Latitude: 42° 31.39´N
Longitude: 70° 33.98´W
Location Description: SE of Gloucester
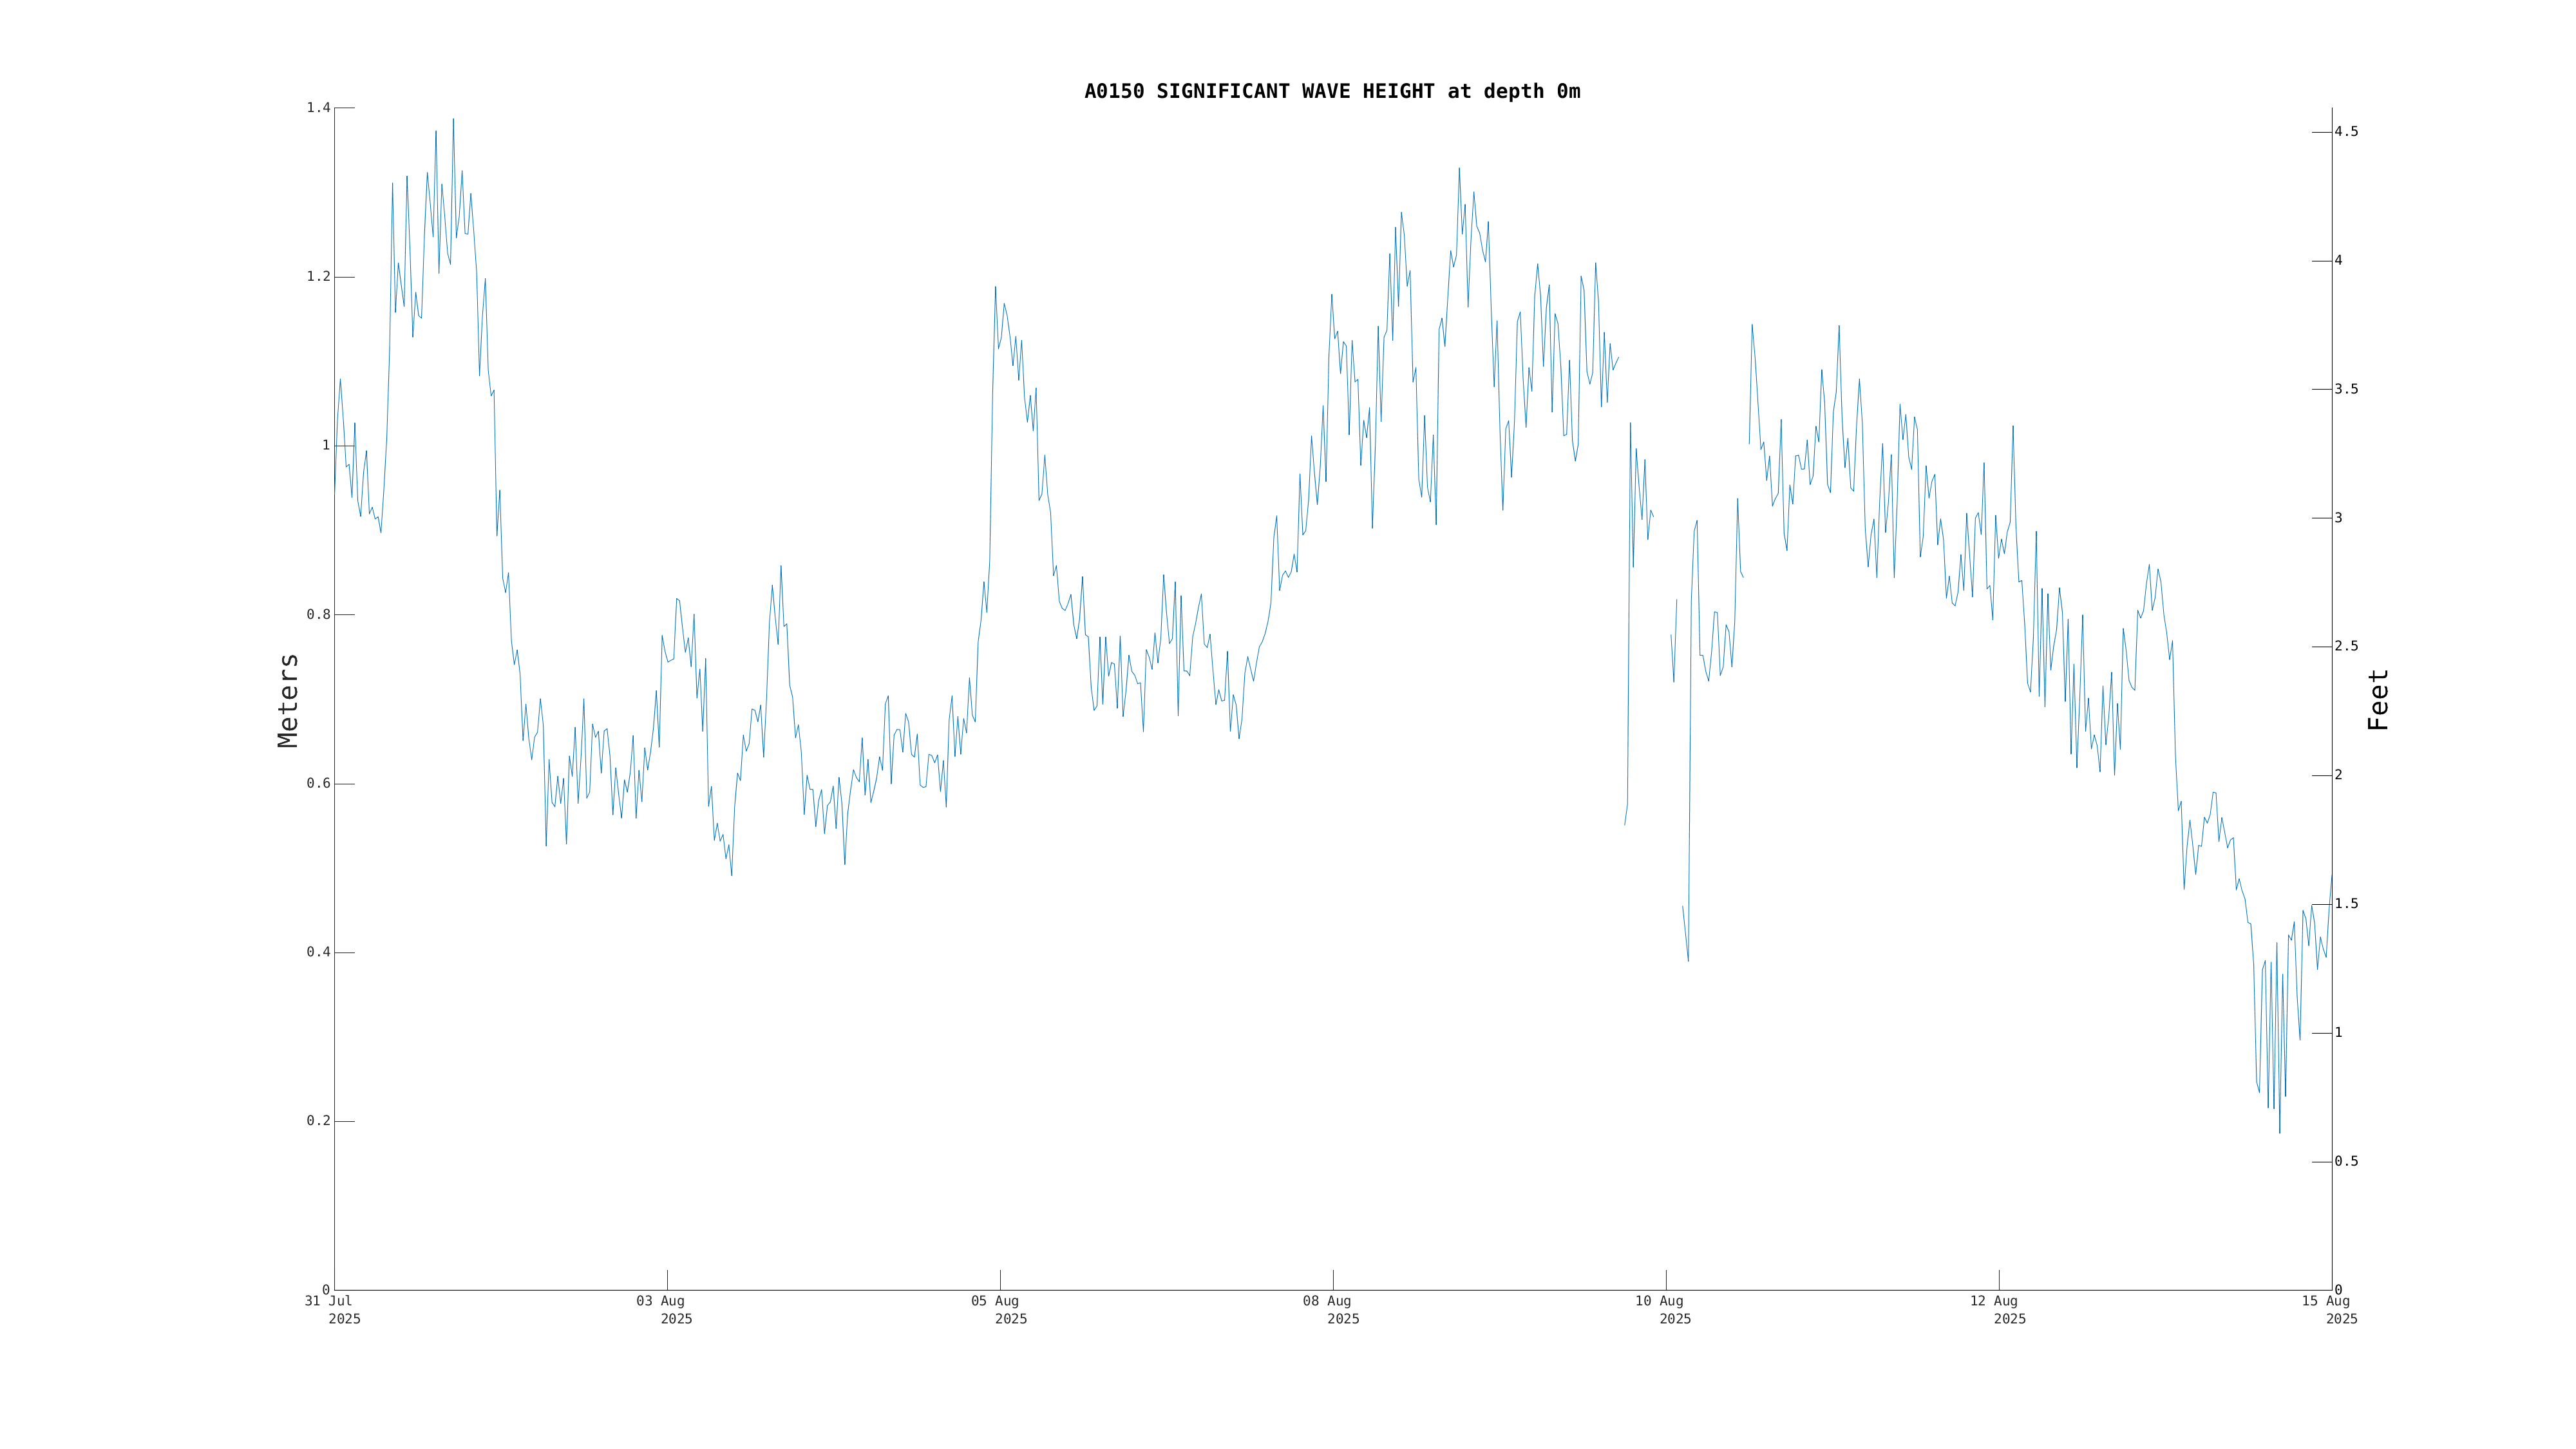
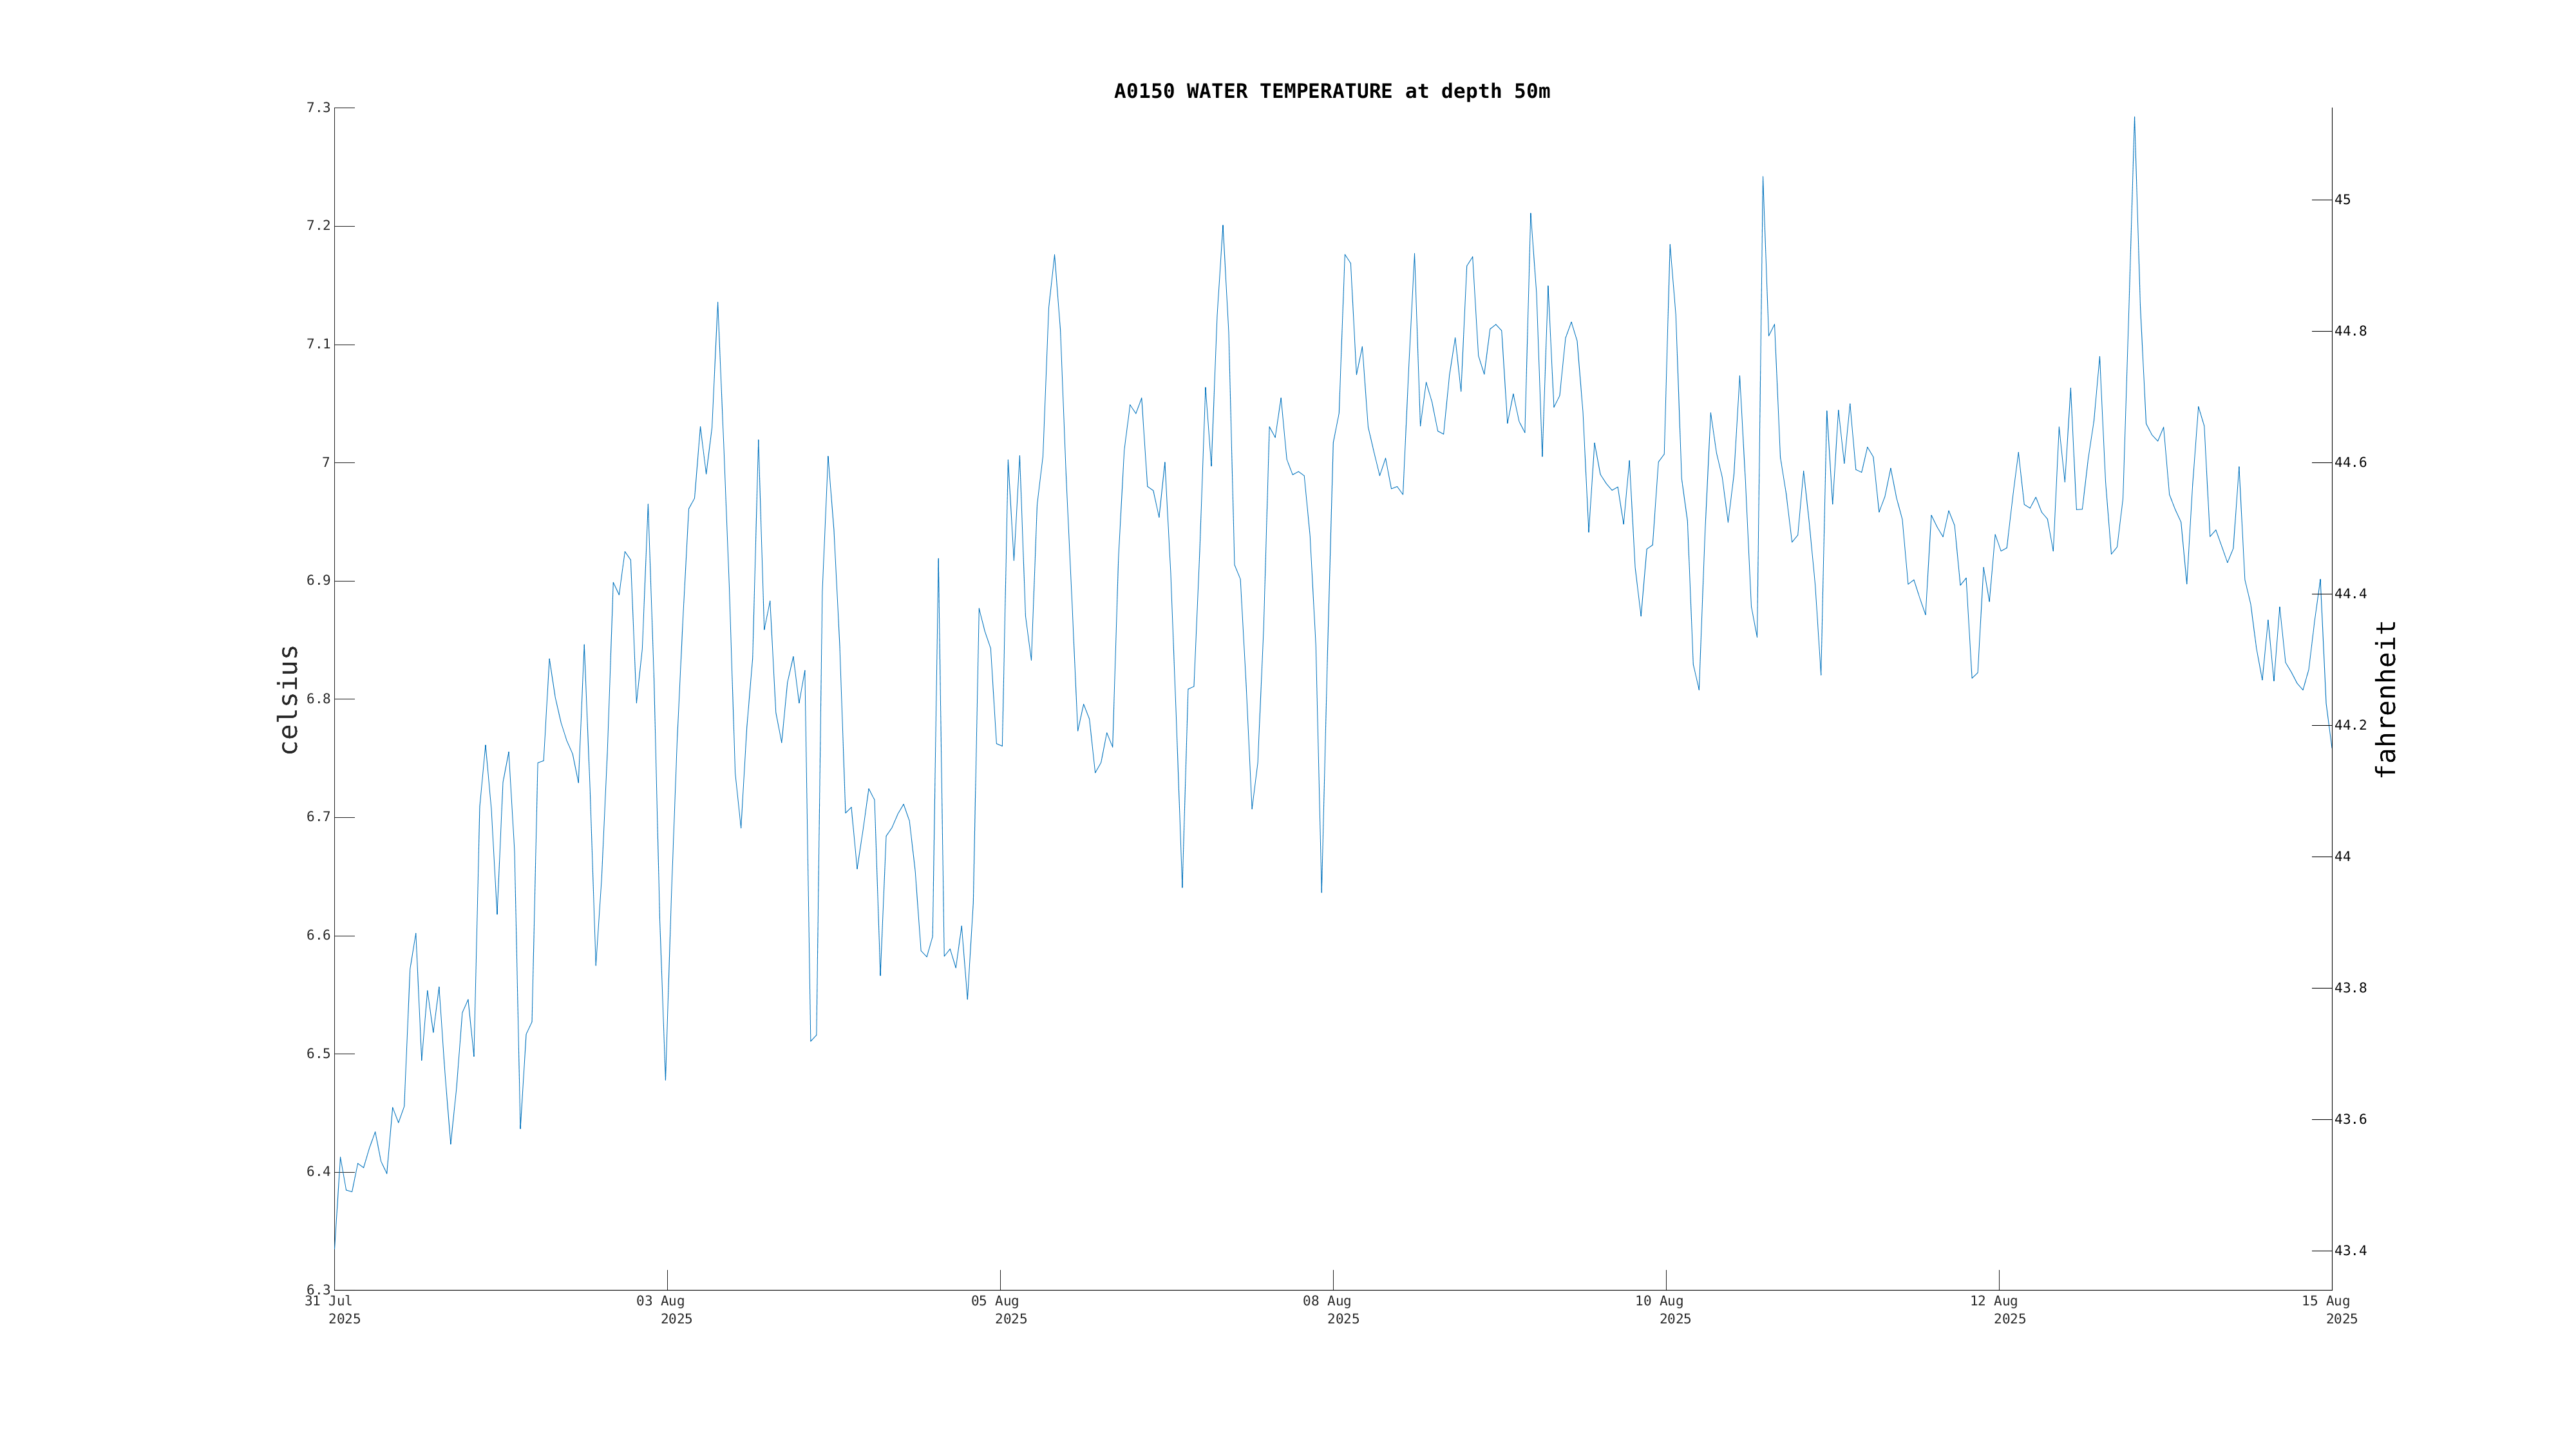
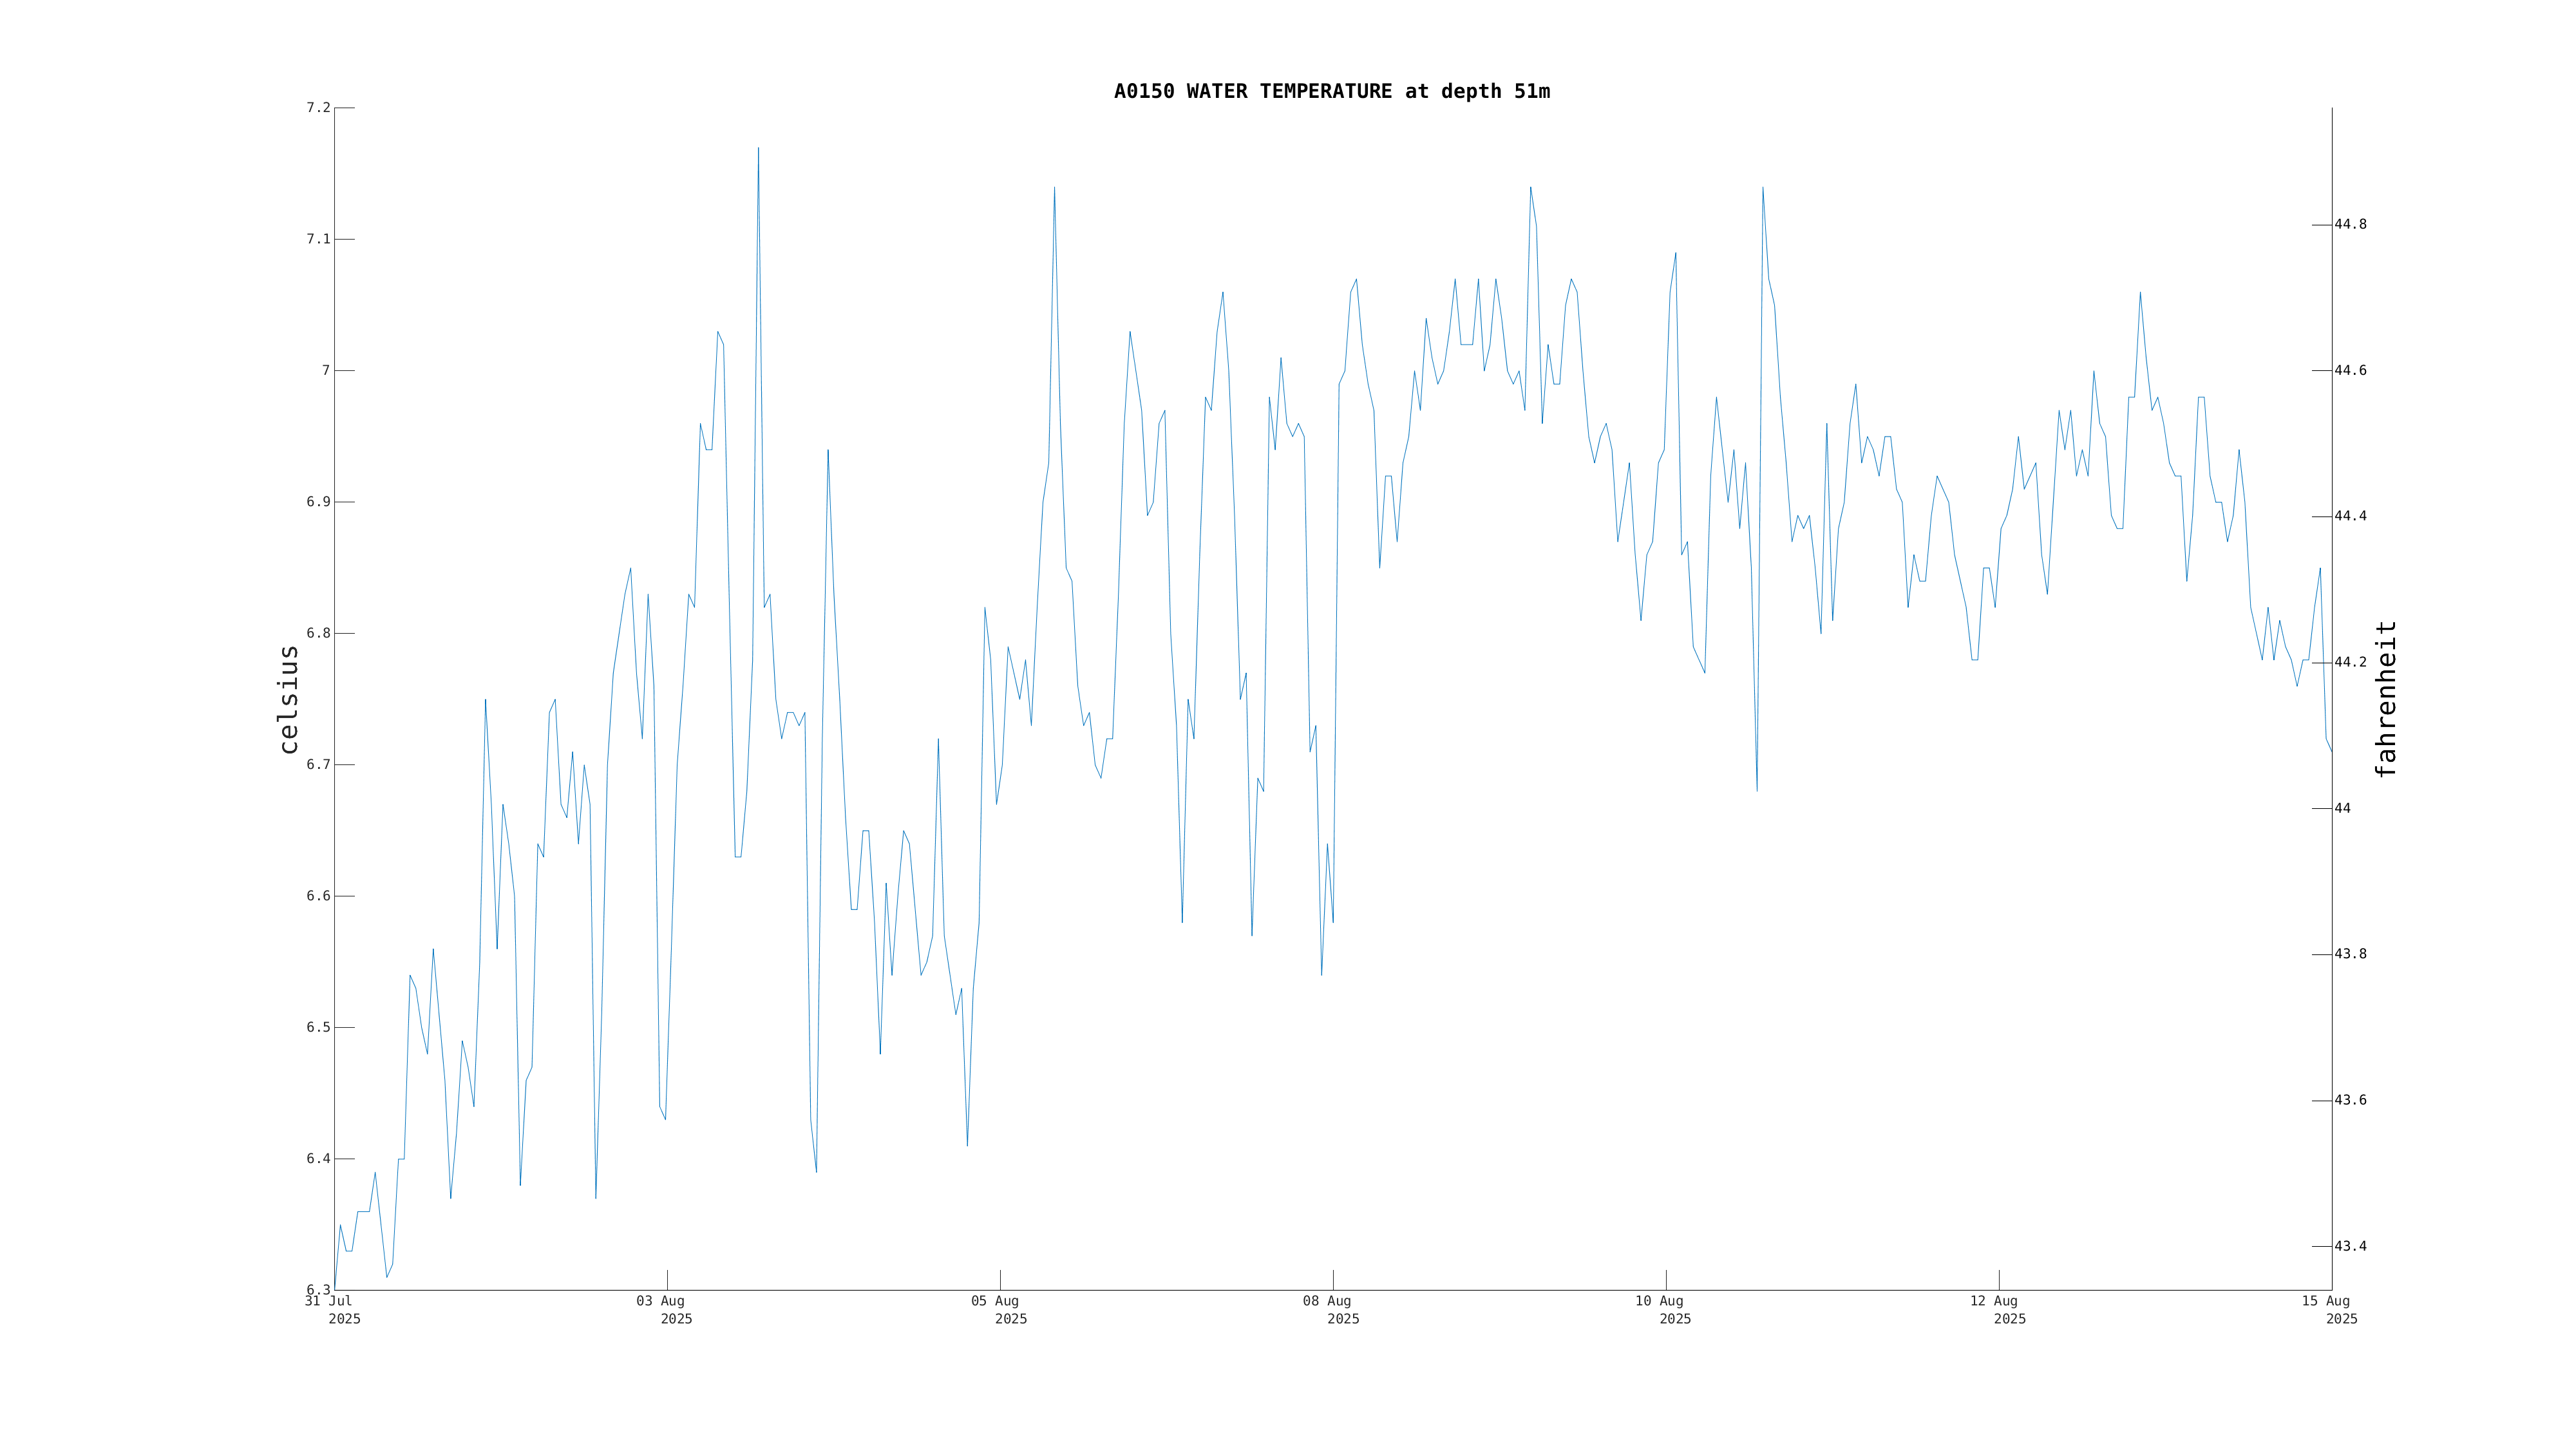
Deployed: Jul 31 2025
Coast Guard Light List Letter: A
Coast Guard Light List Number 367
Water Depth: 65 meters (213 feet)
Watch Circle Radius: 45 meters (148 feet)
Last Cell Phone Transmission: May 22, 11 AM EDT
Last GOES Transmission: May 22, 10 AM EDT
Latest Event:
Jul 31, 03 PM EDT
Deployed by M/V James K Goodwin
Deployed by M/V James K Goodwin
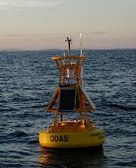

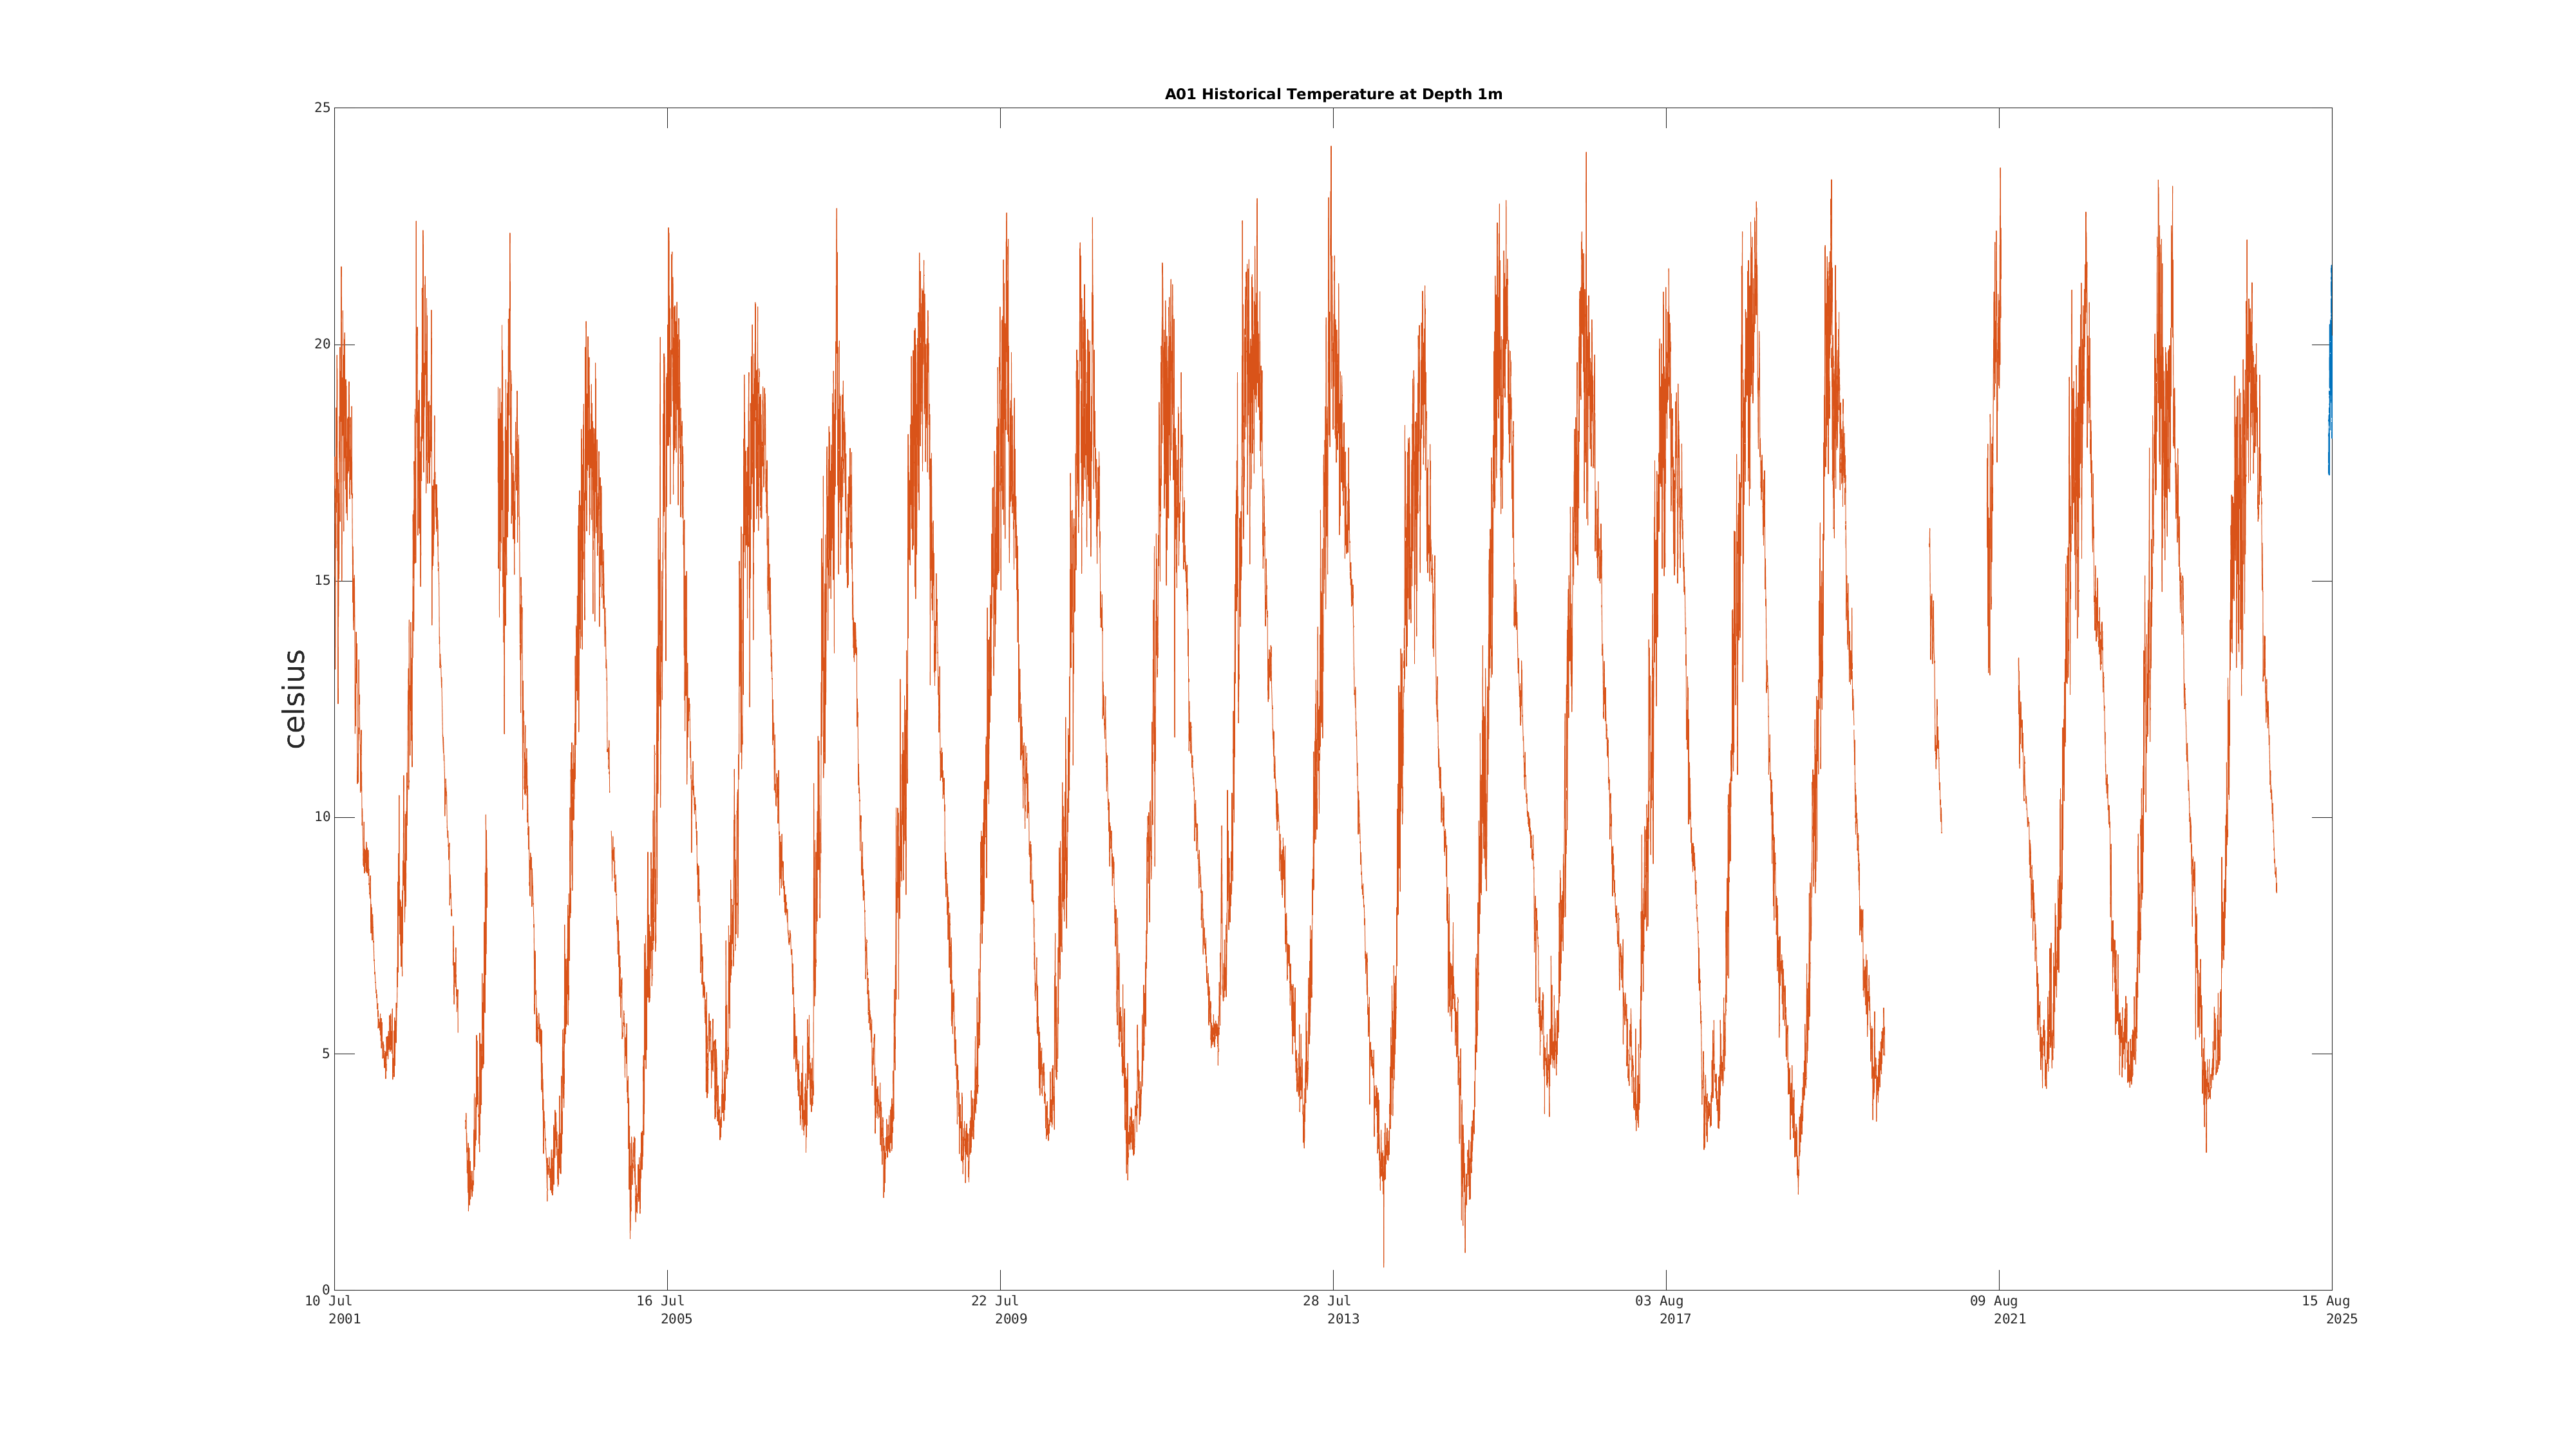
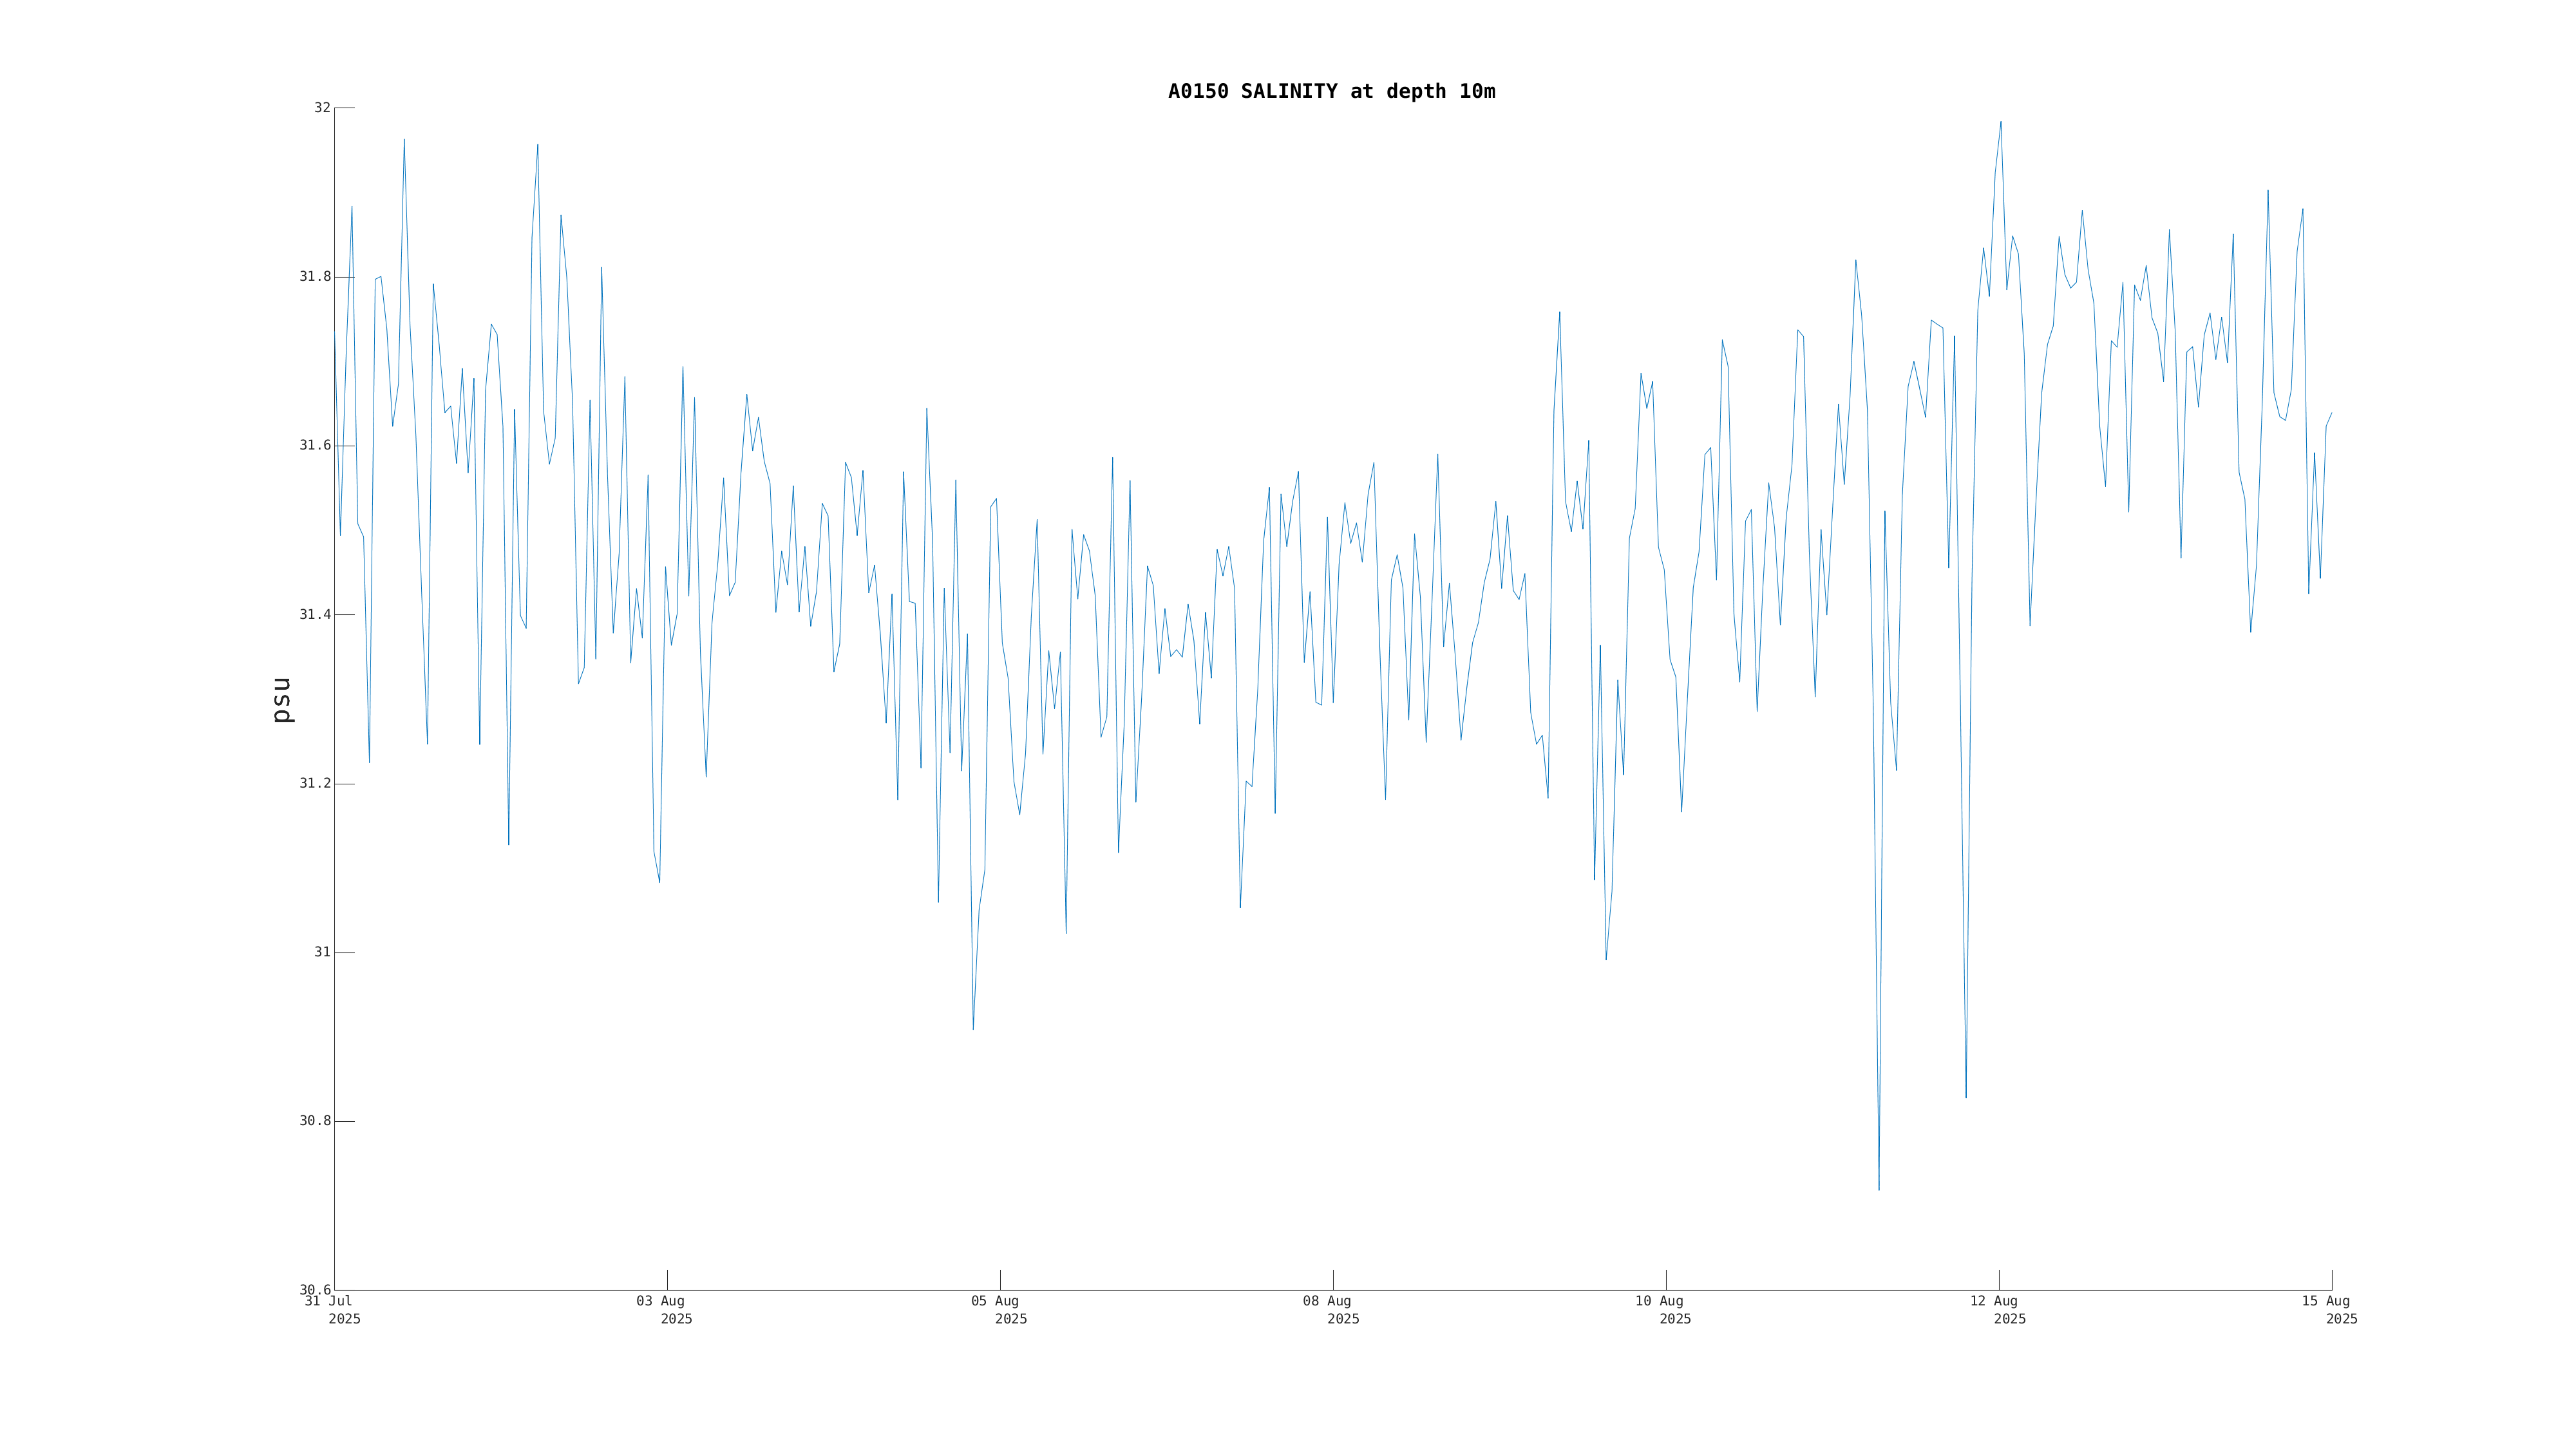
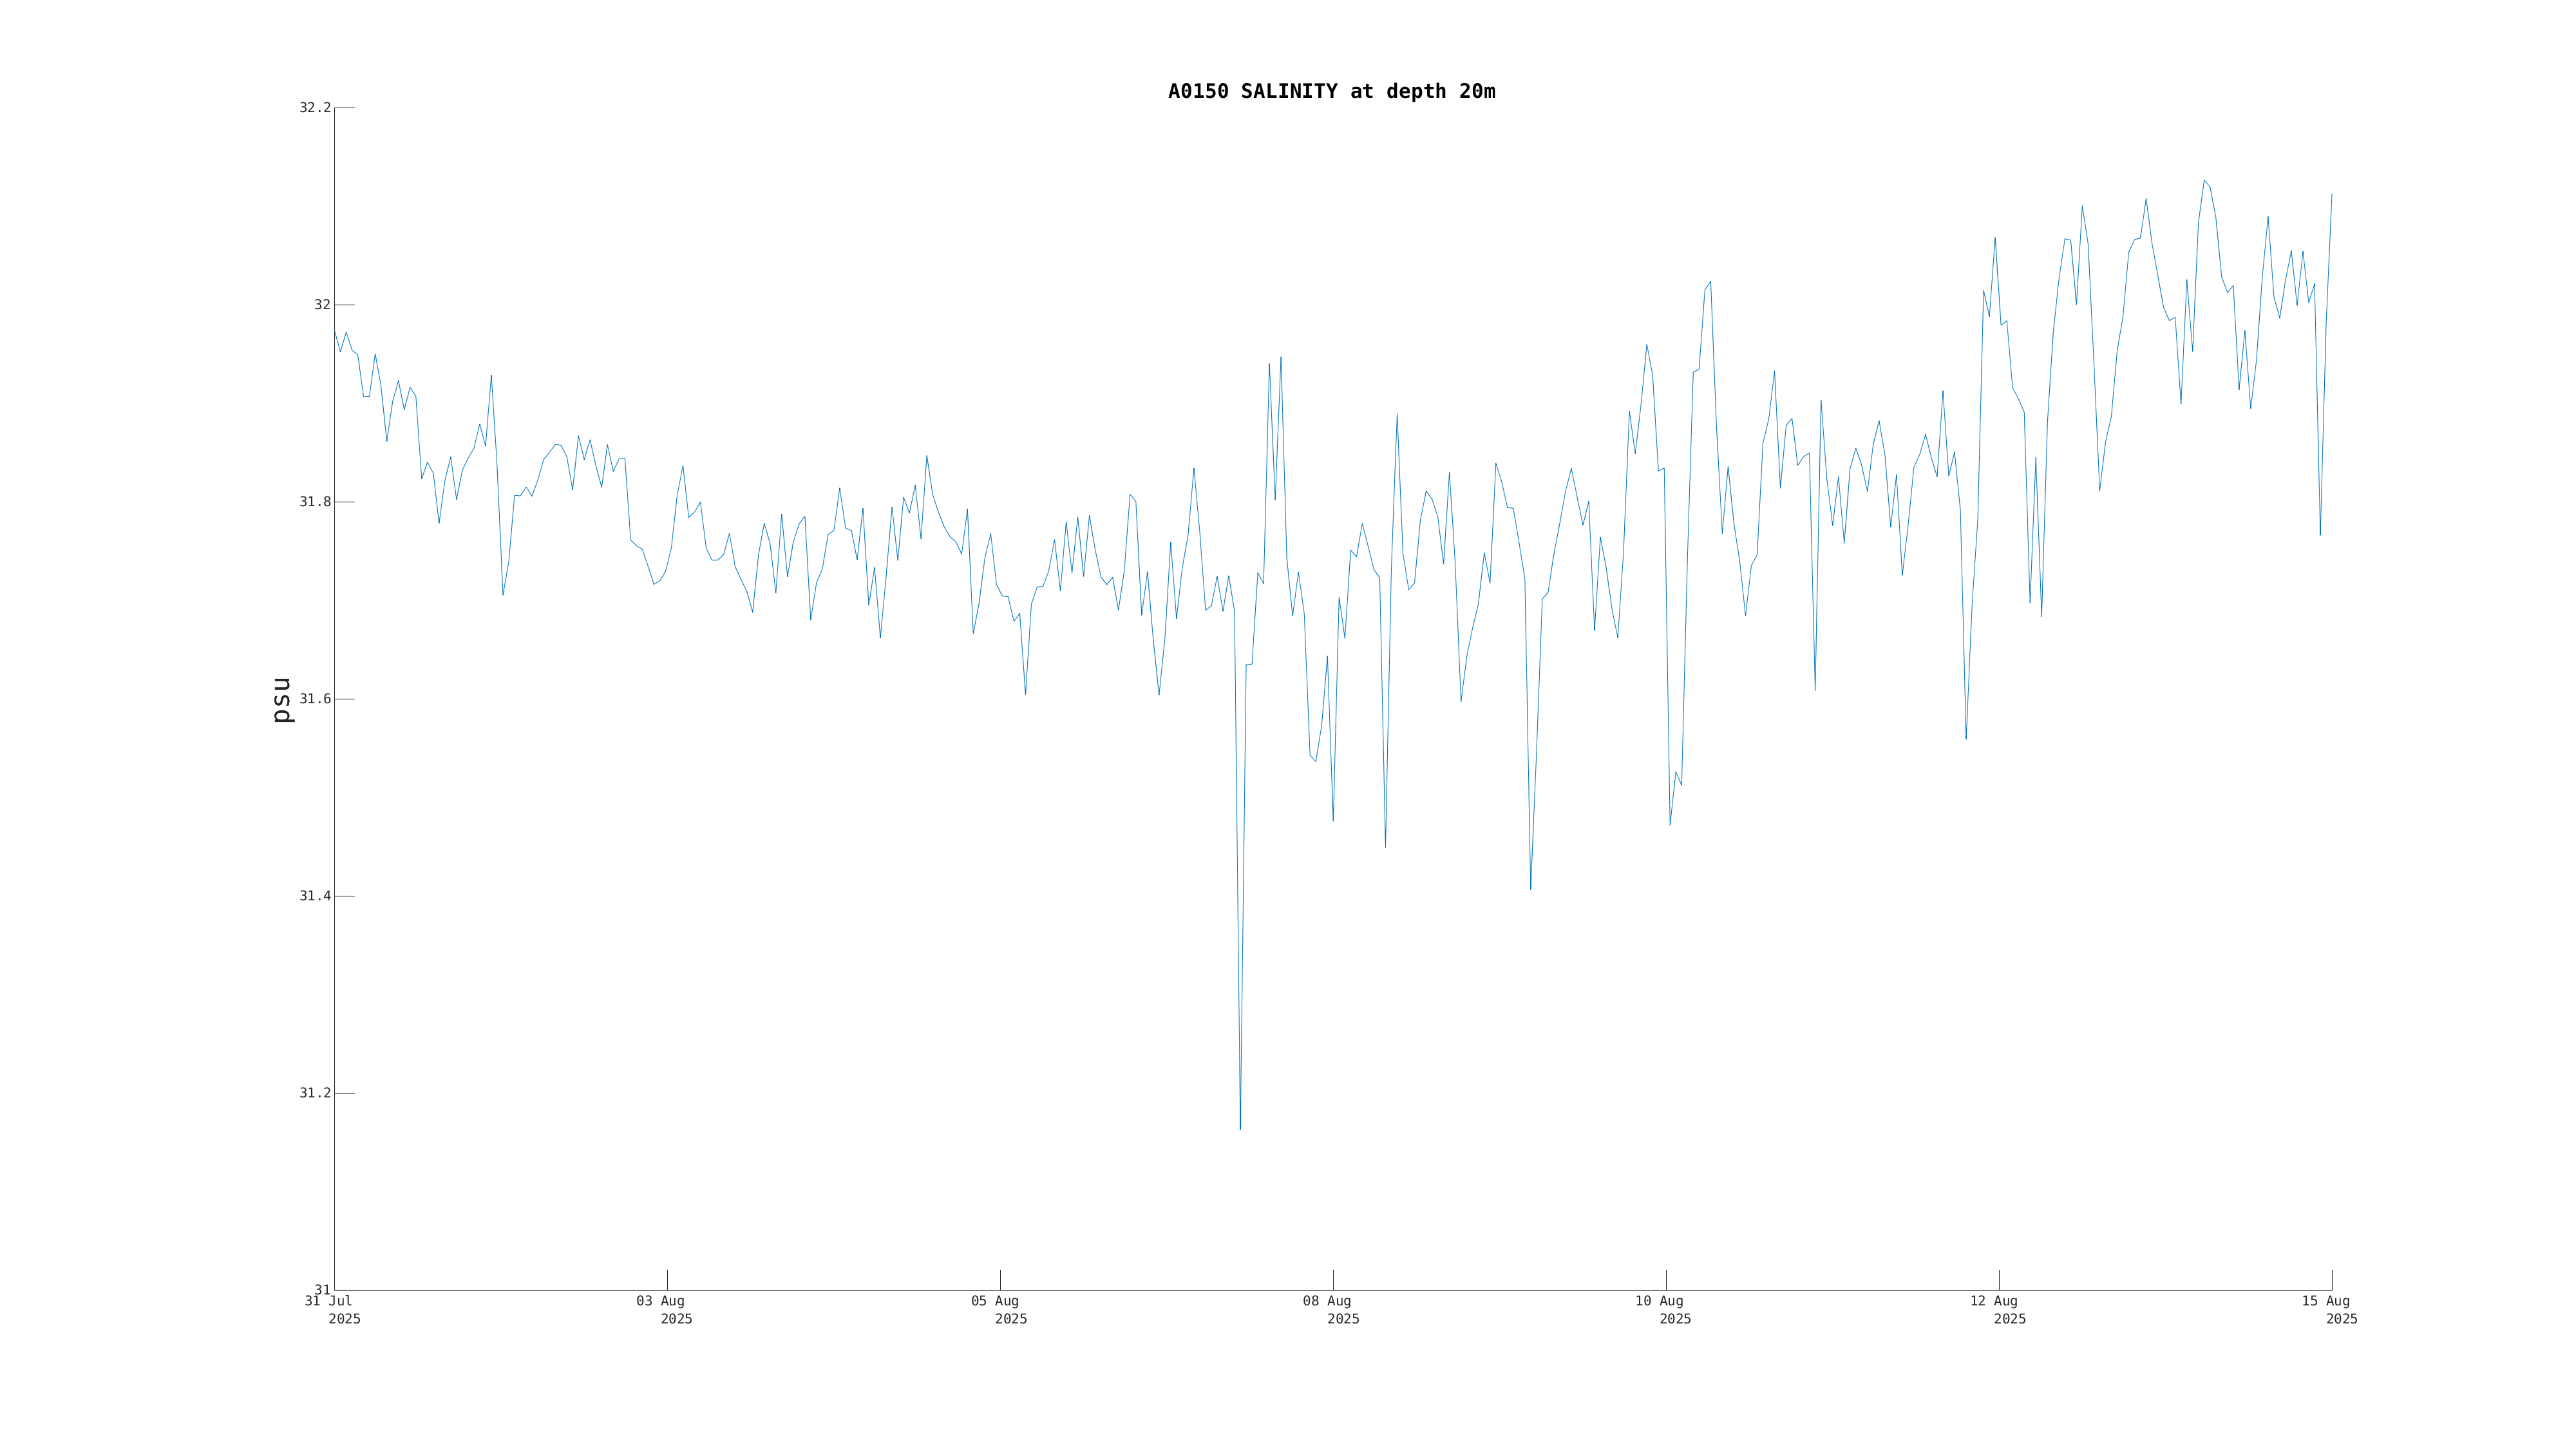
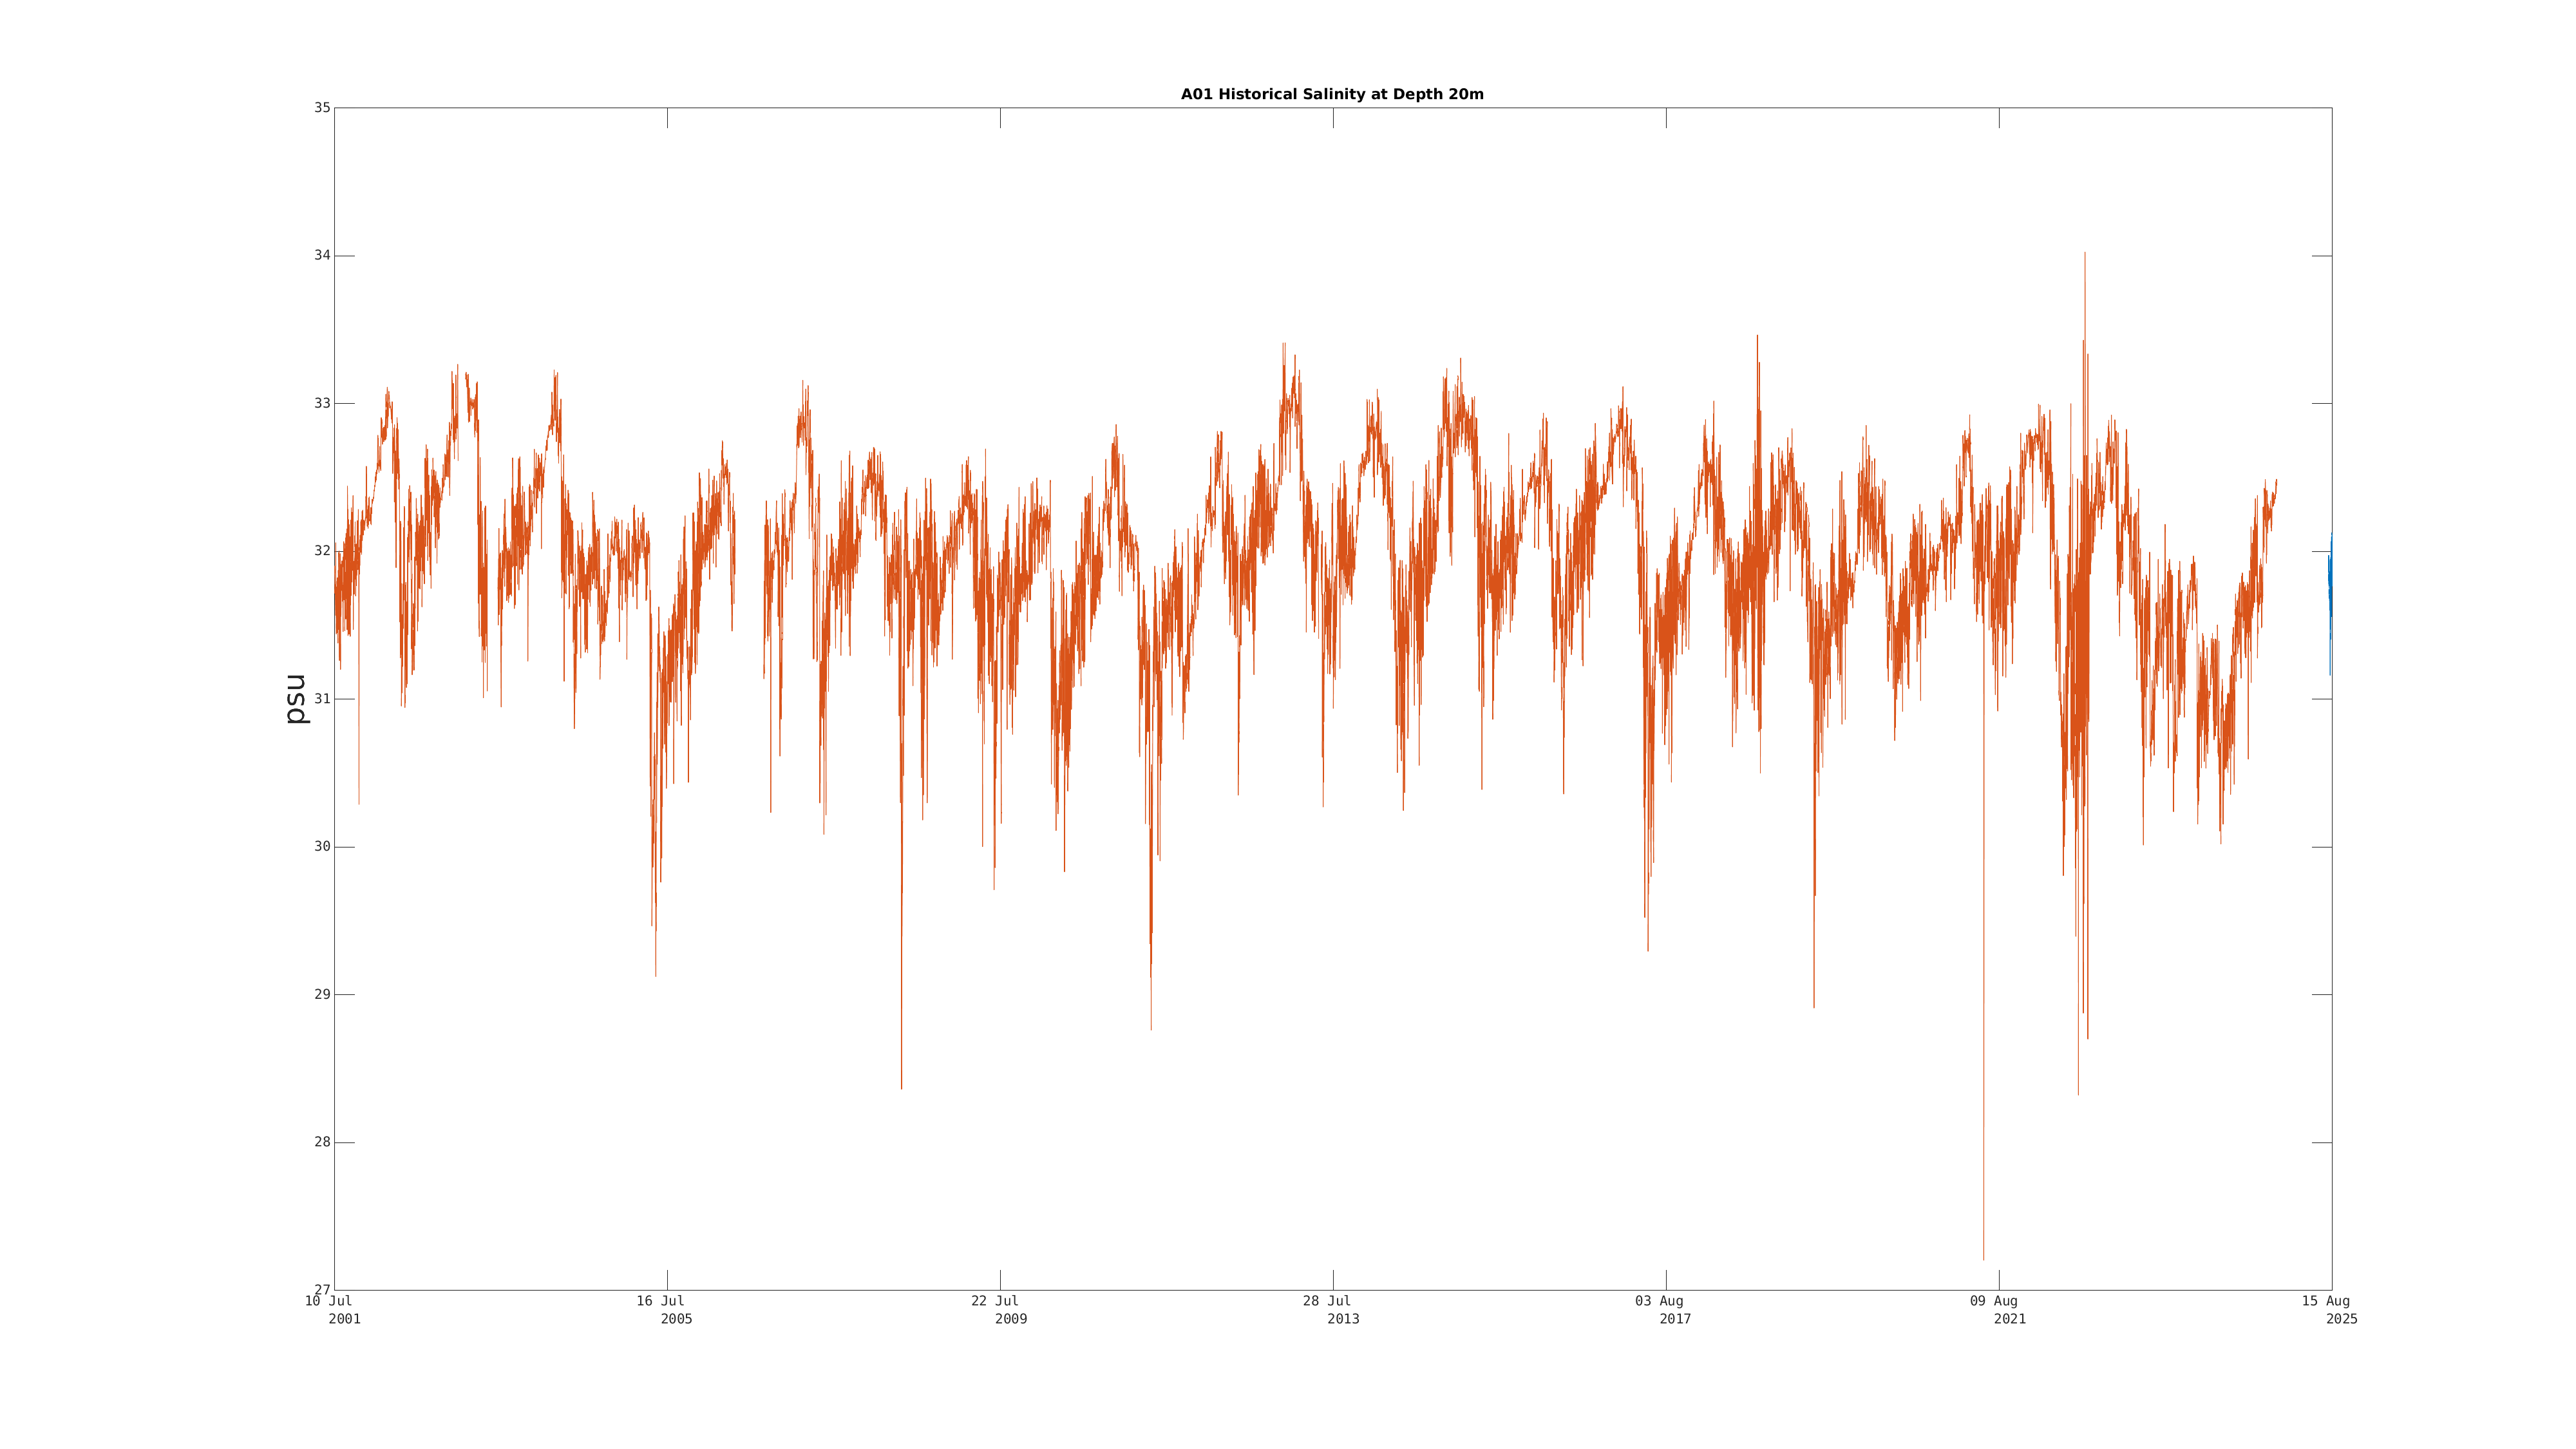
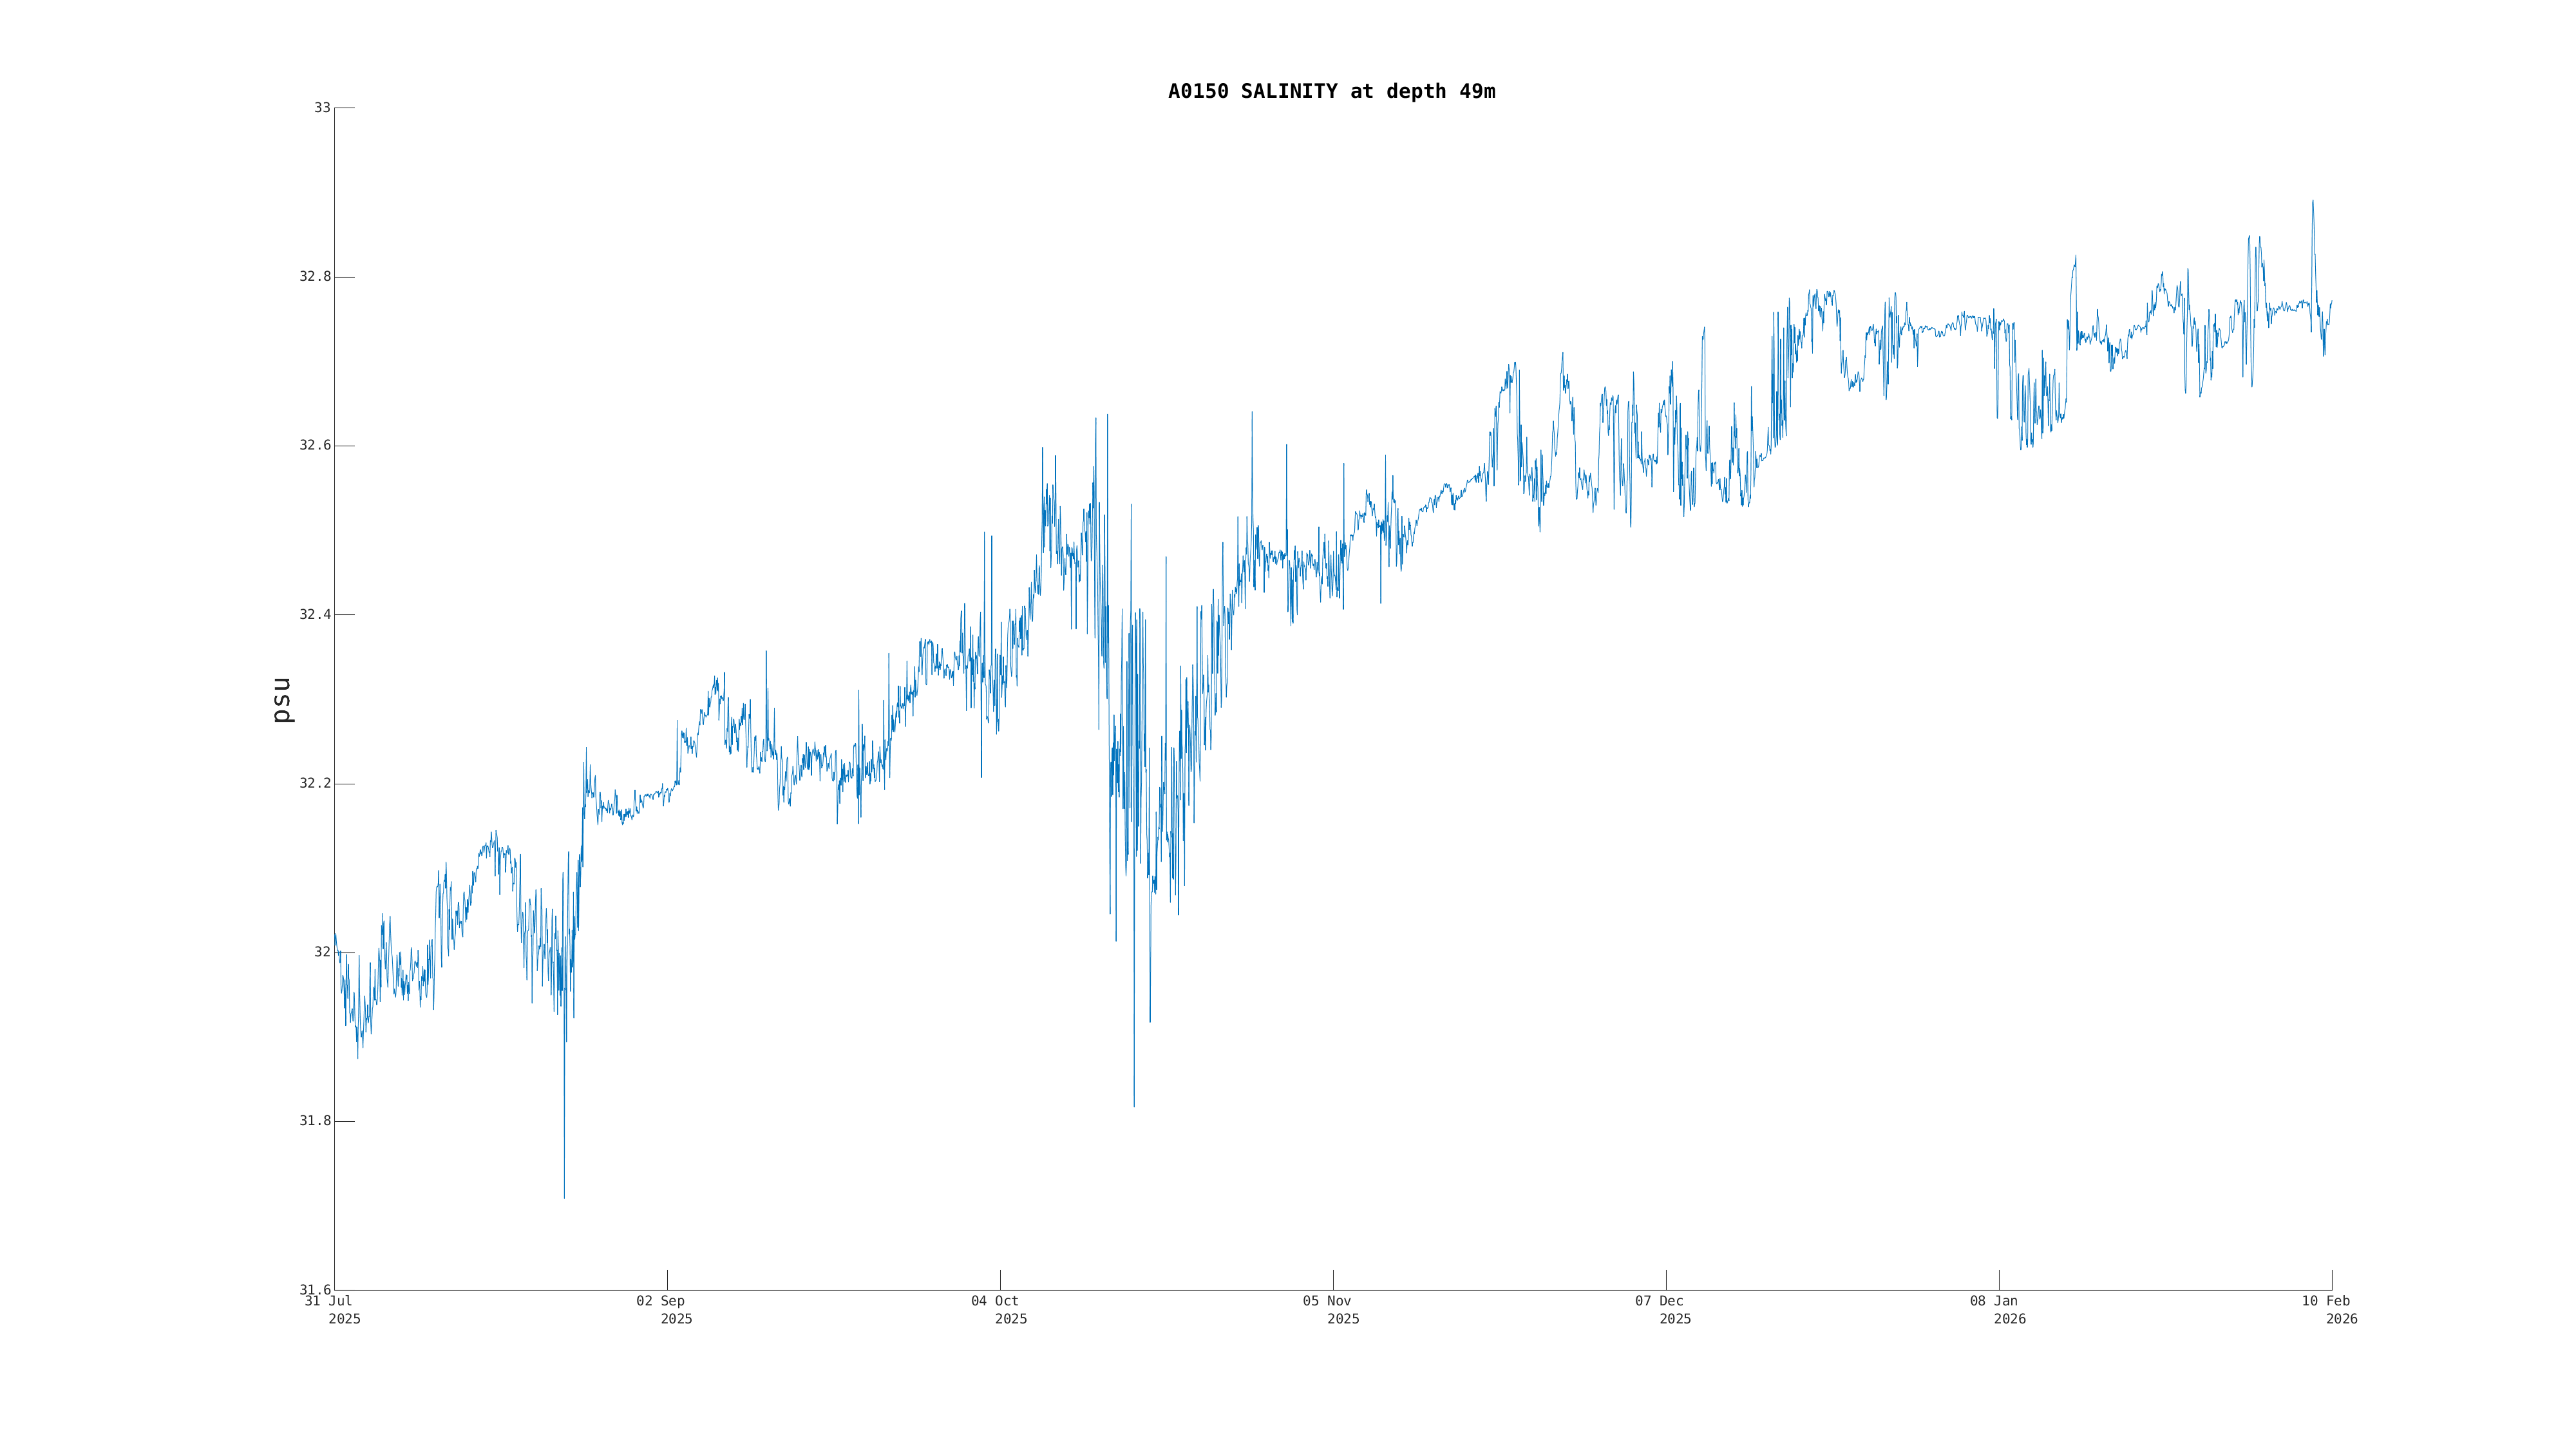
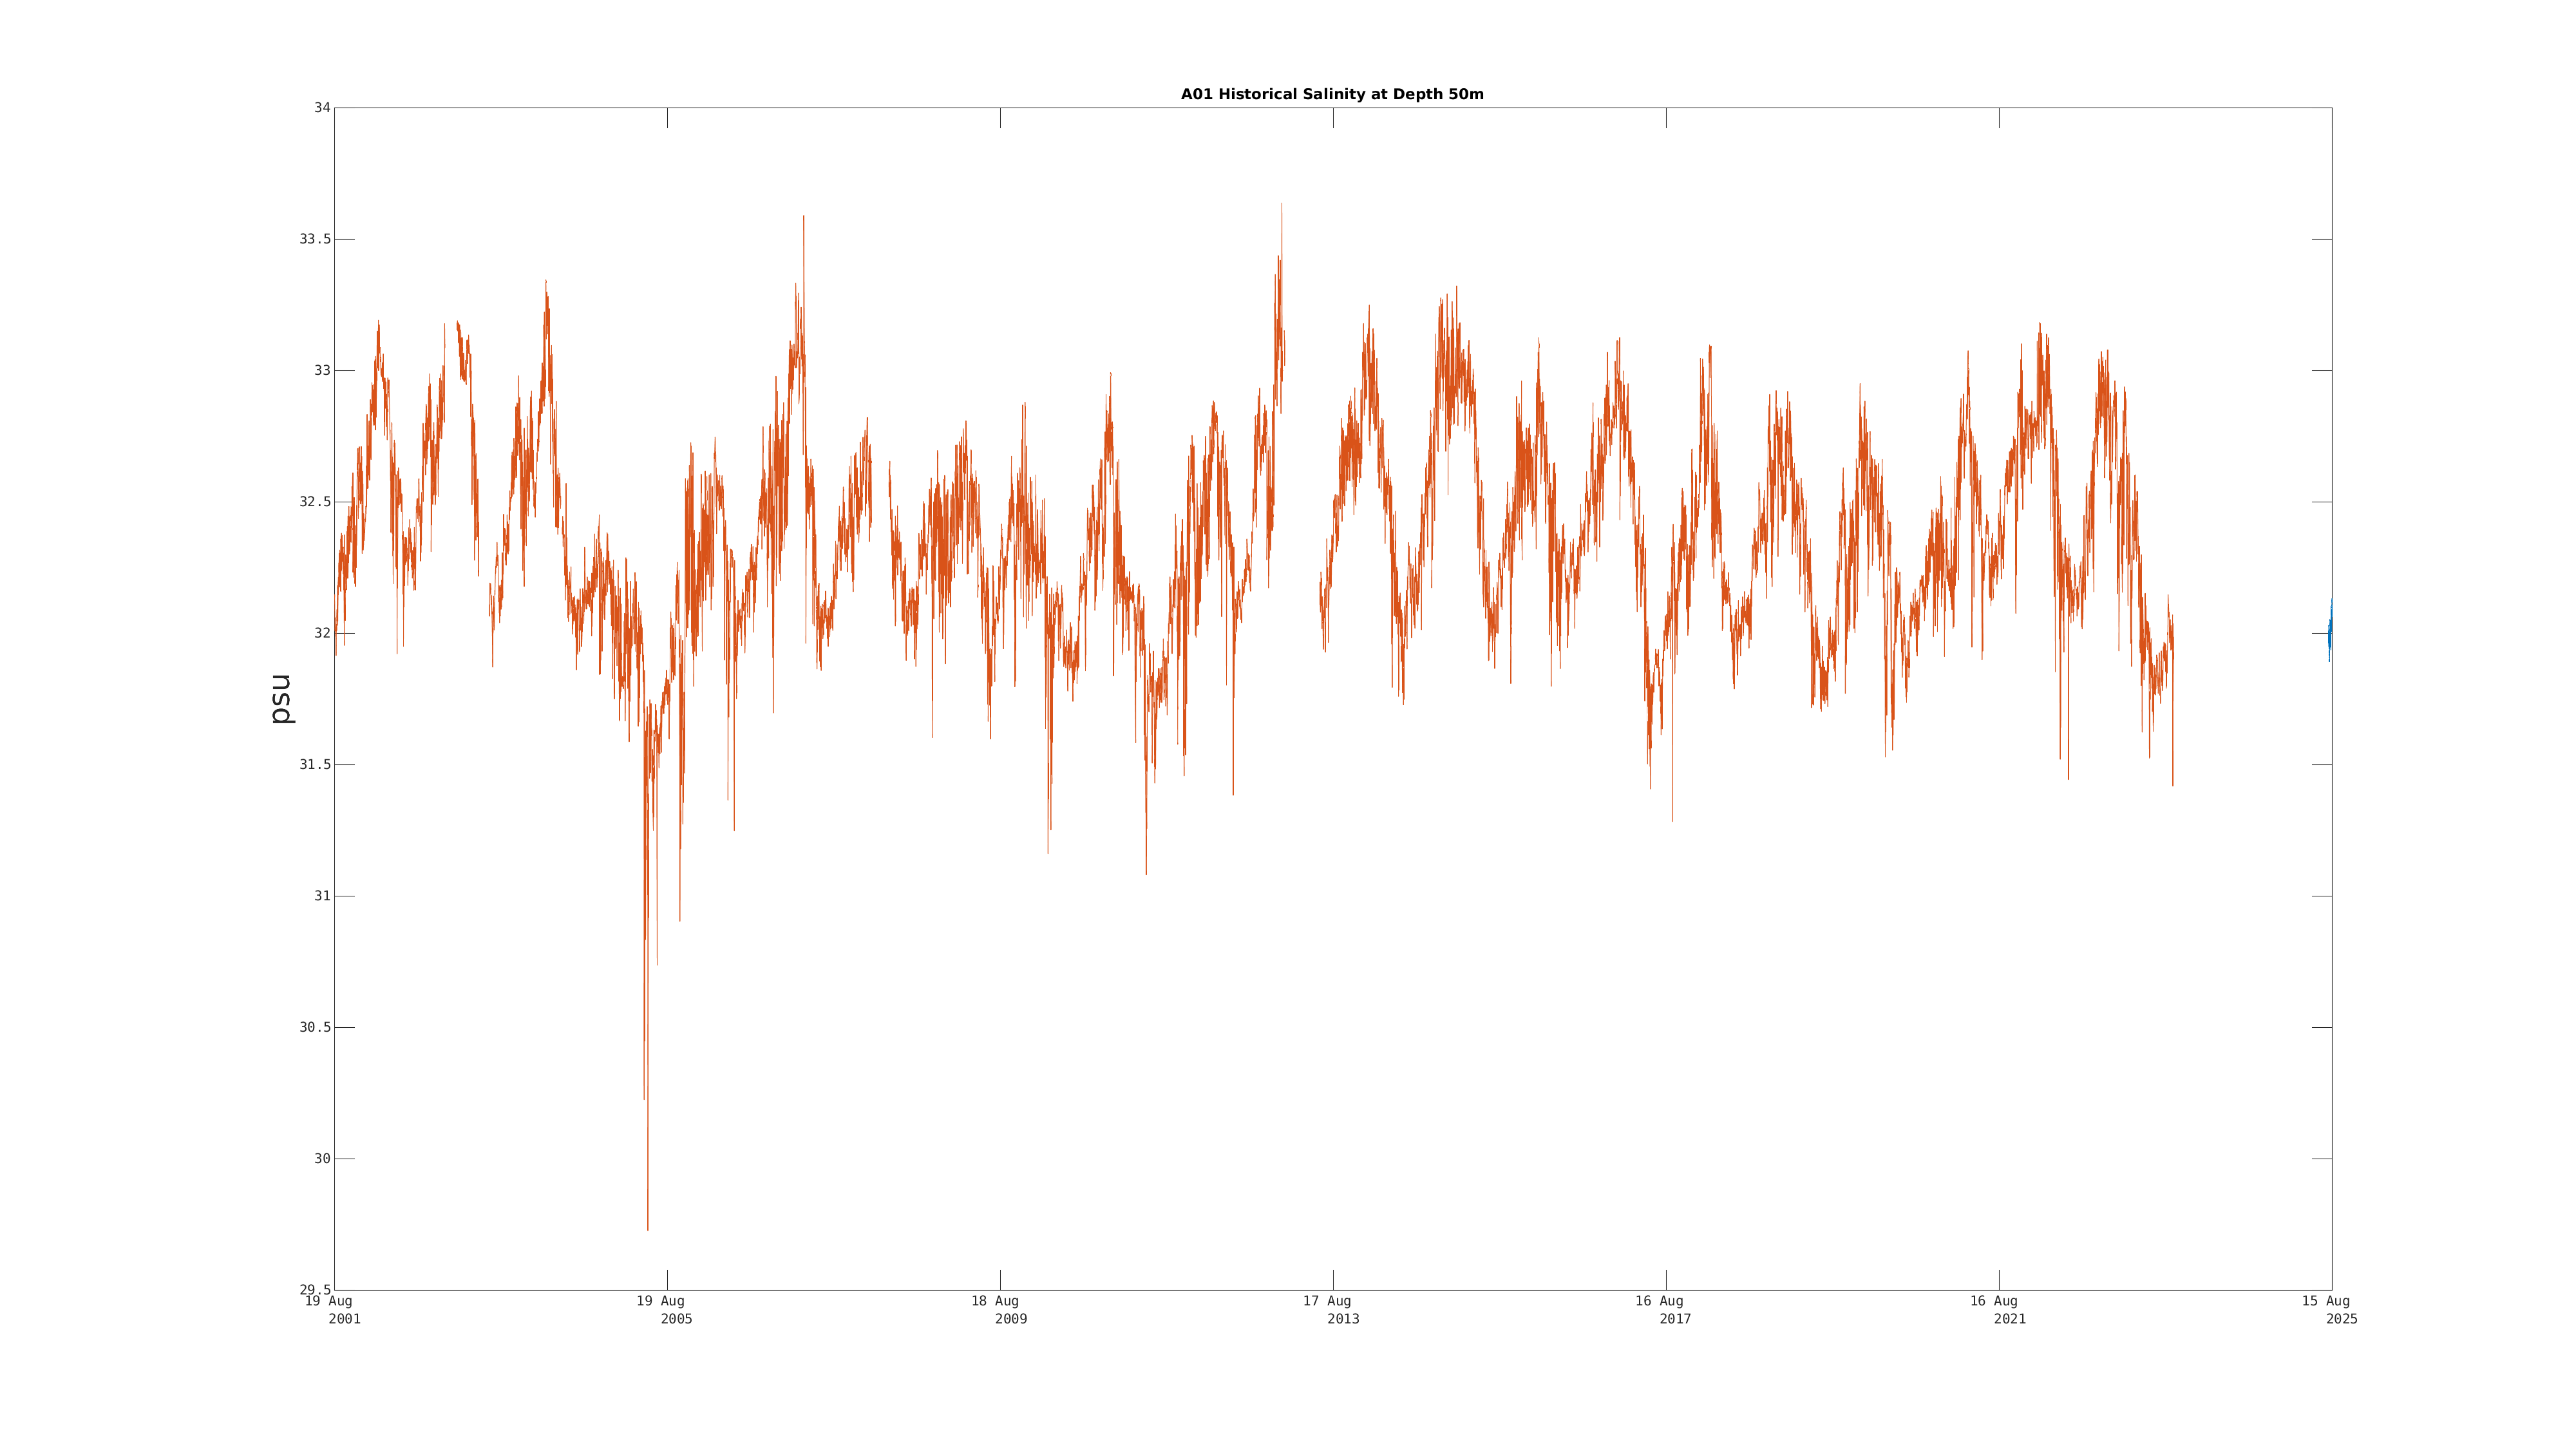
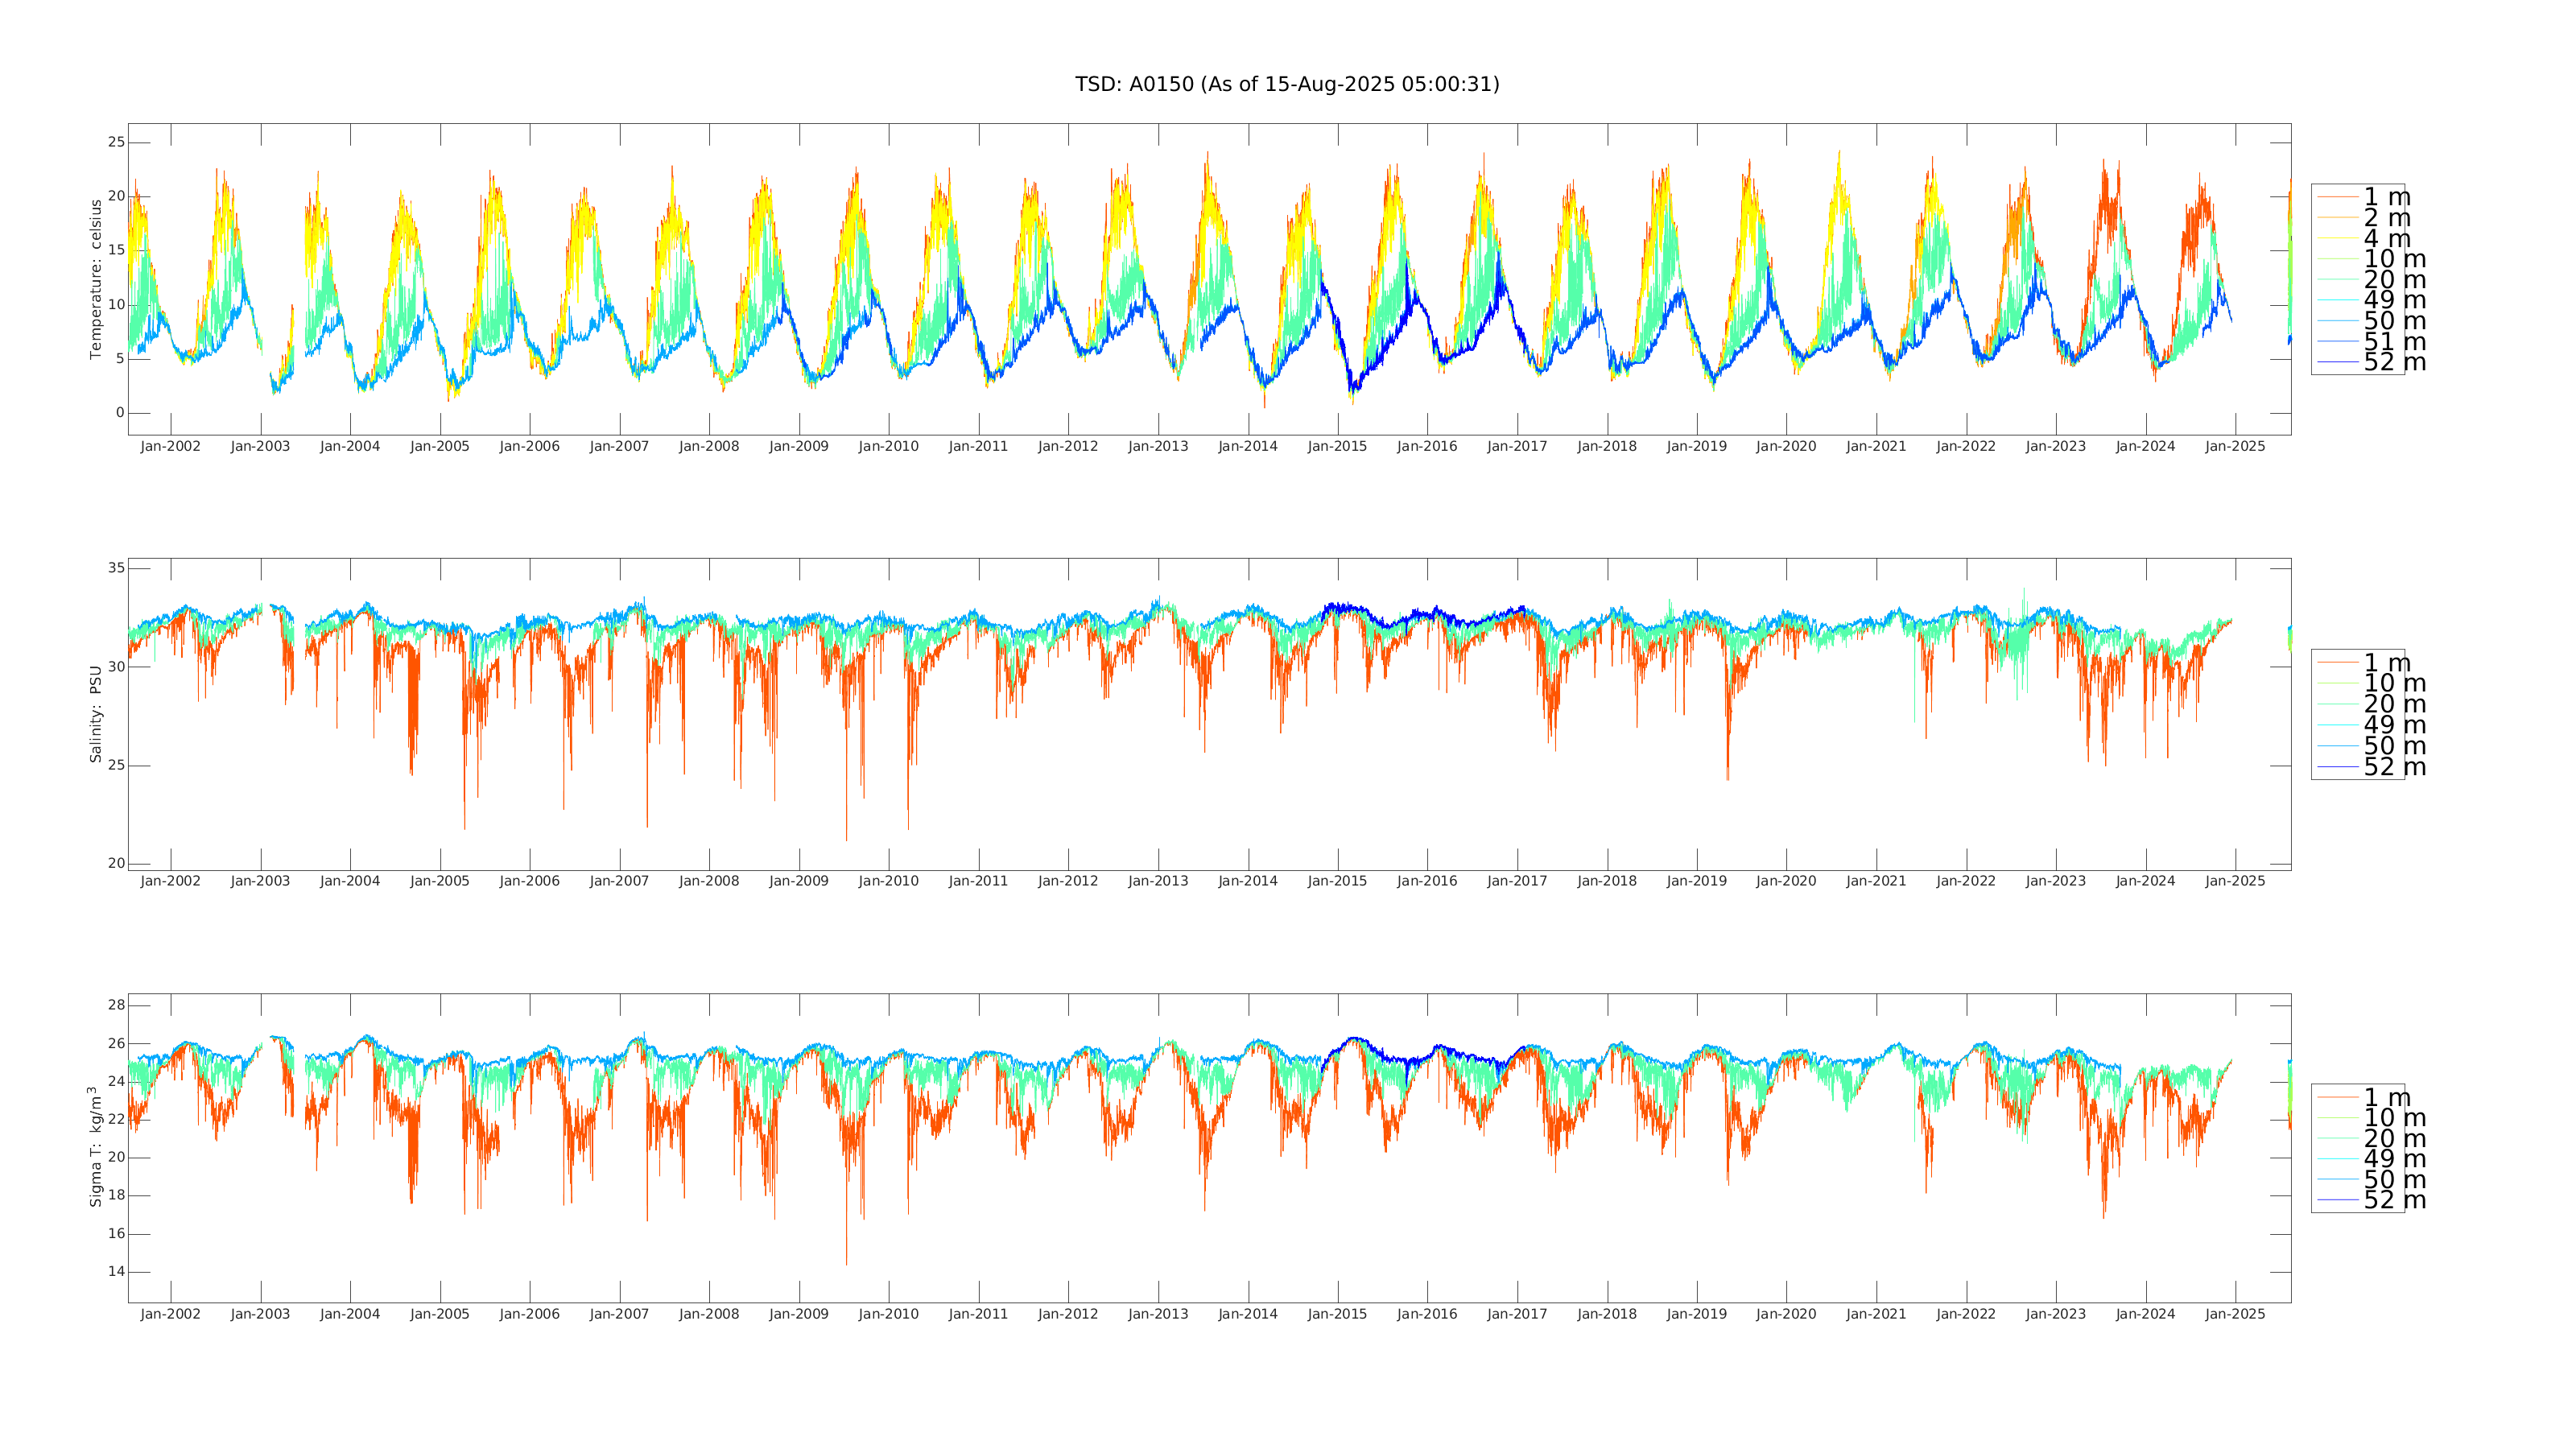 Temperature, Salinity, Density:
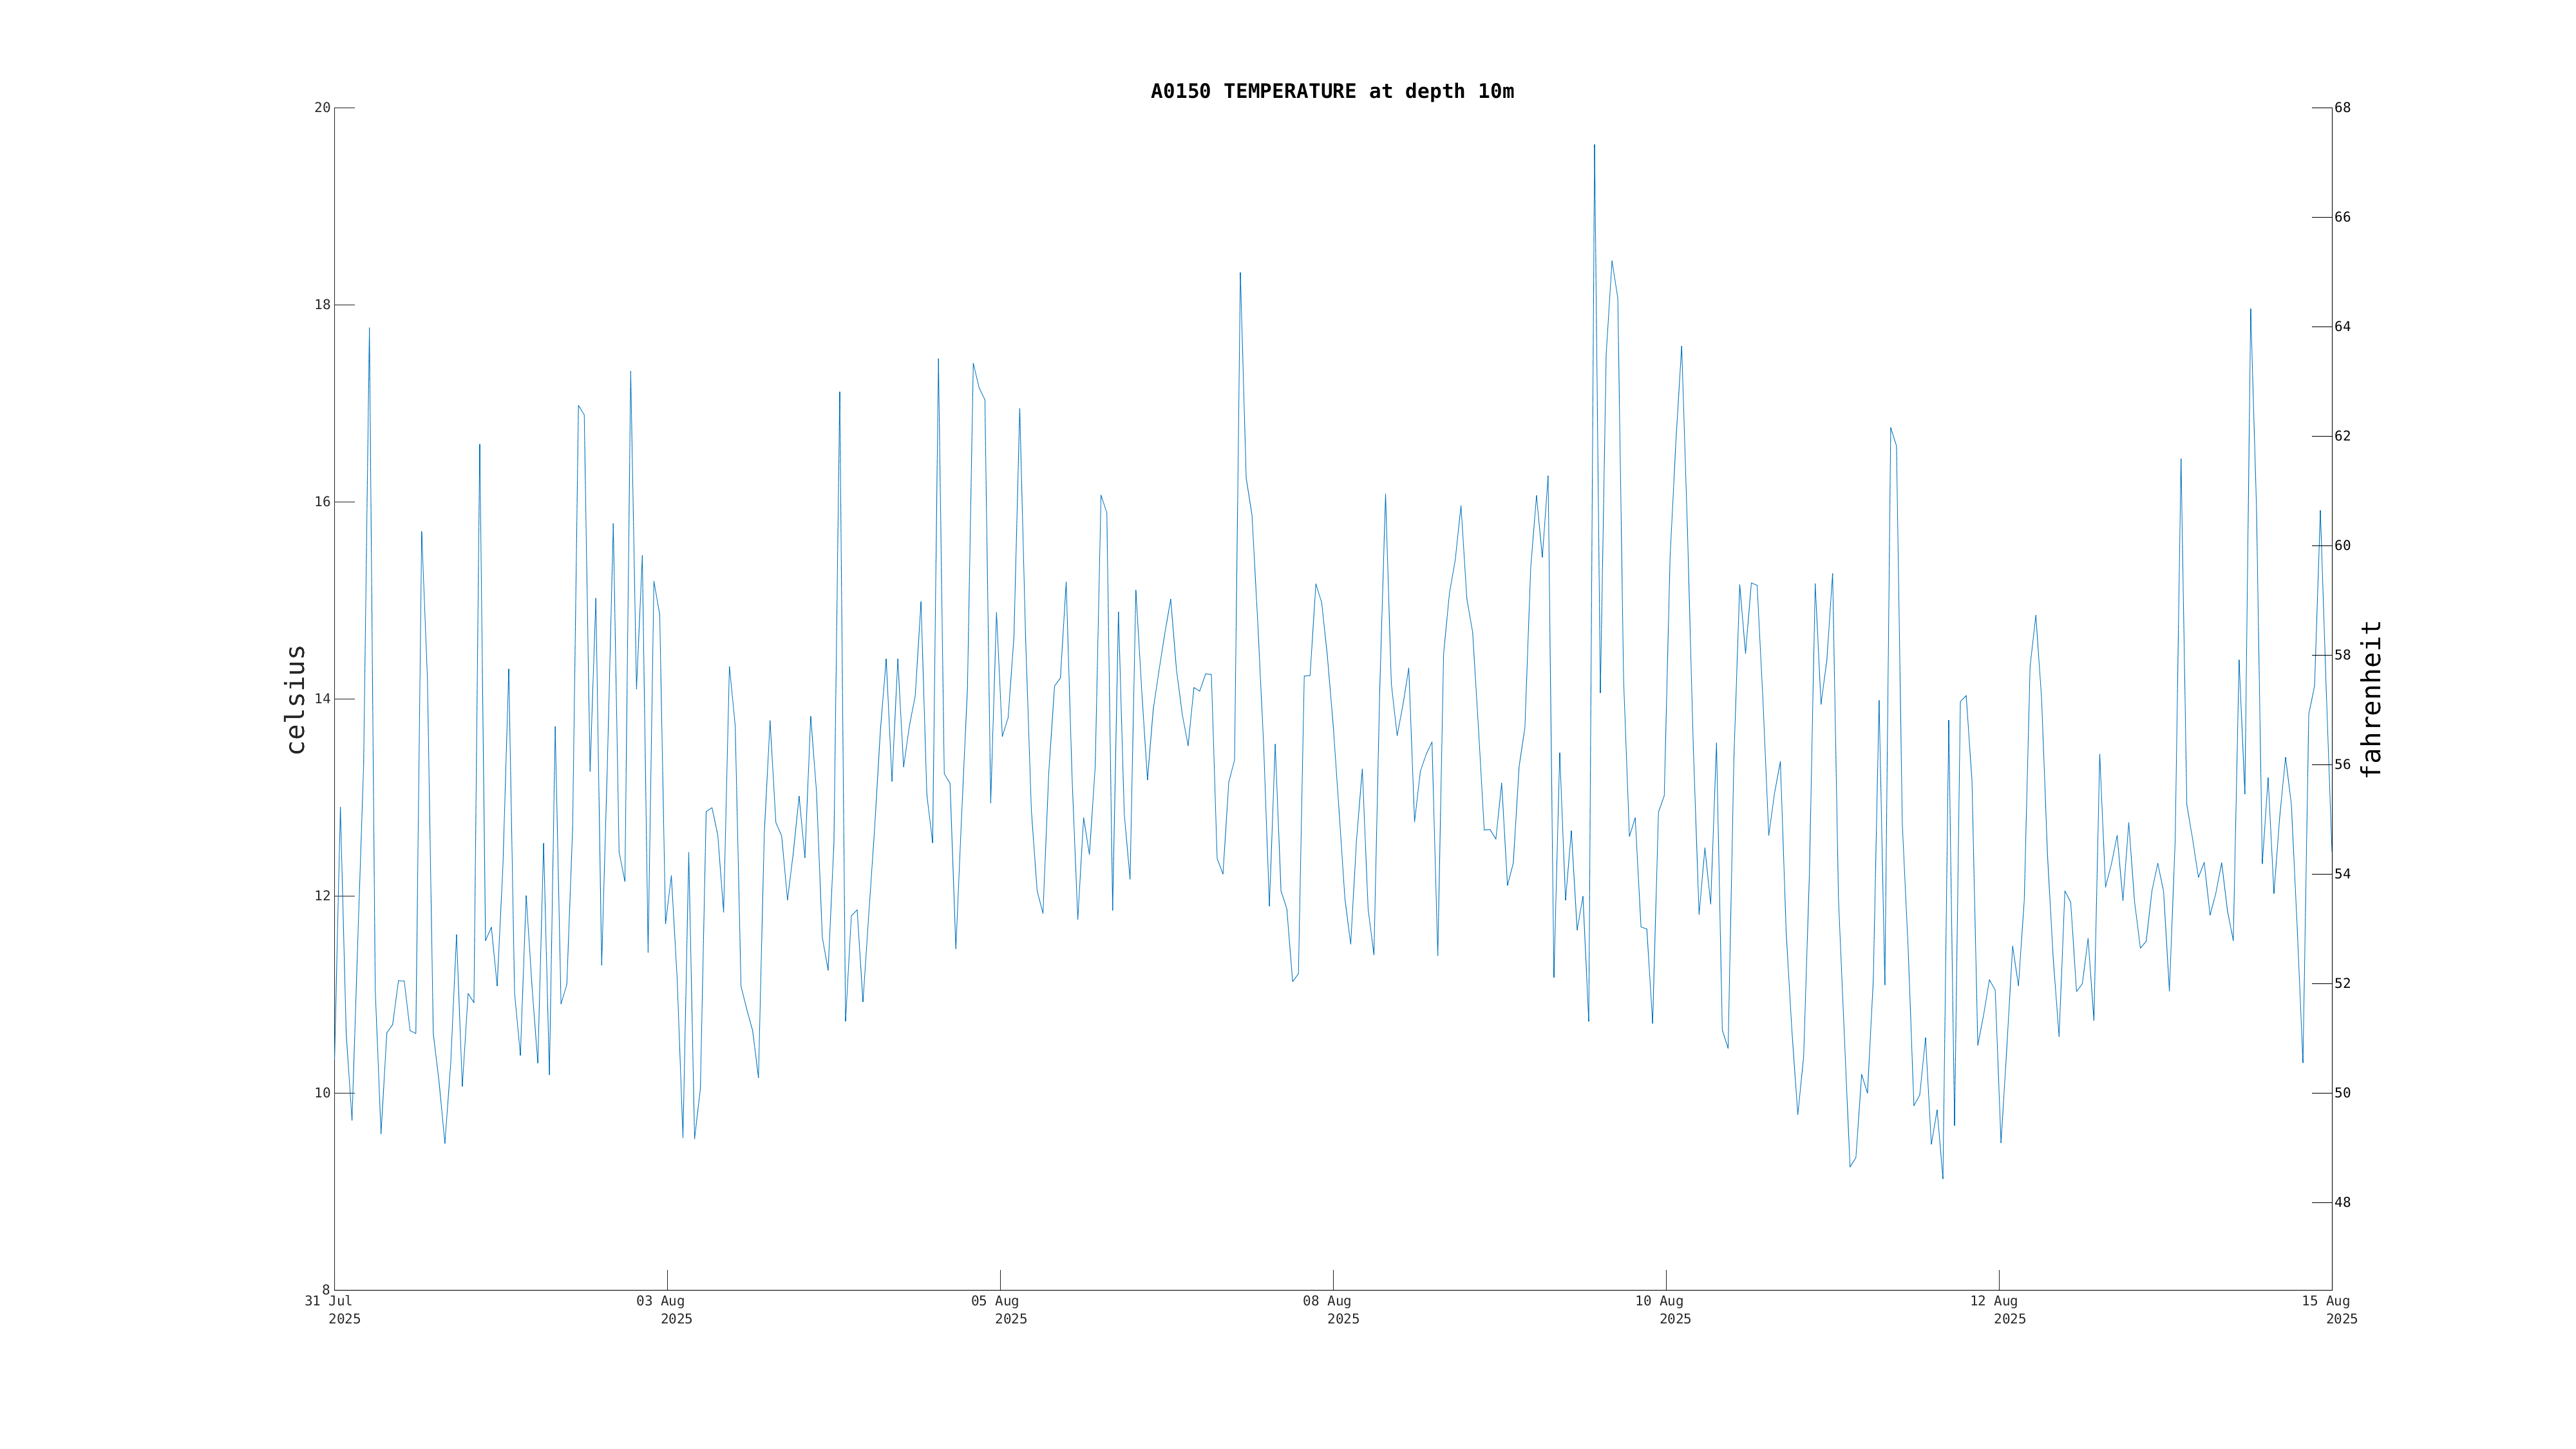
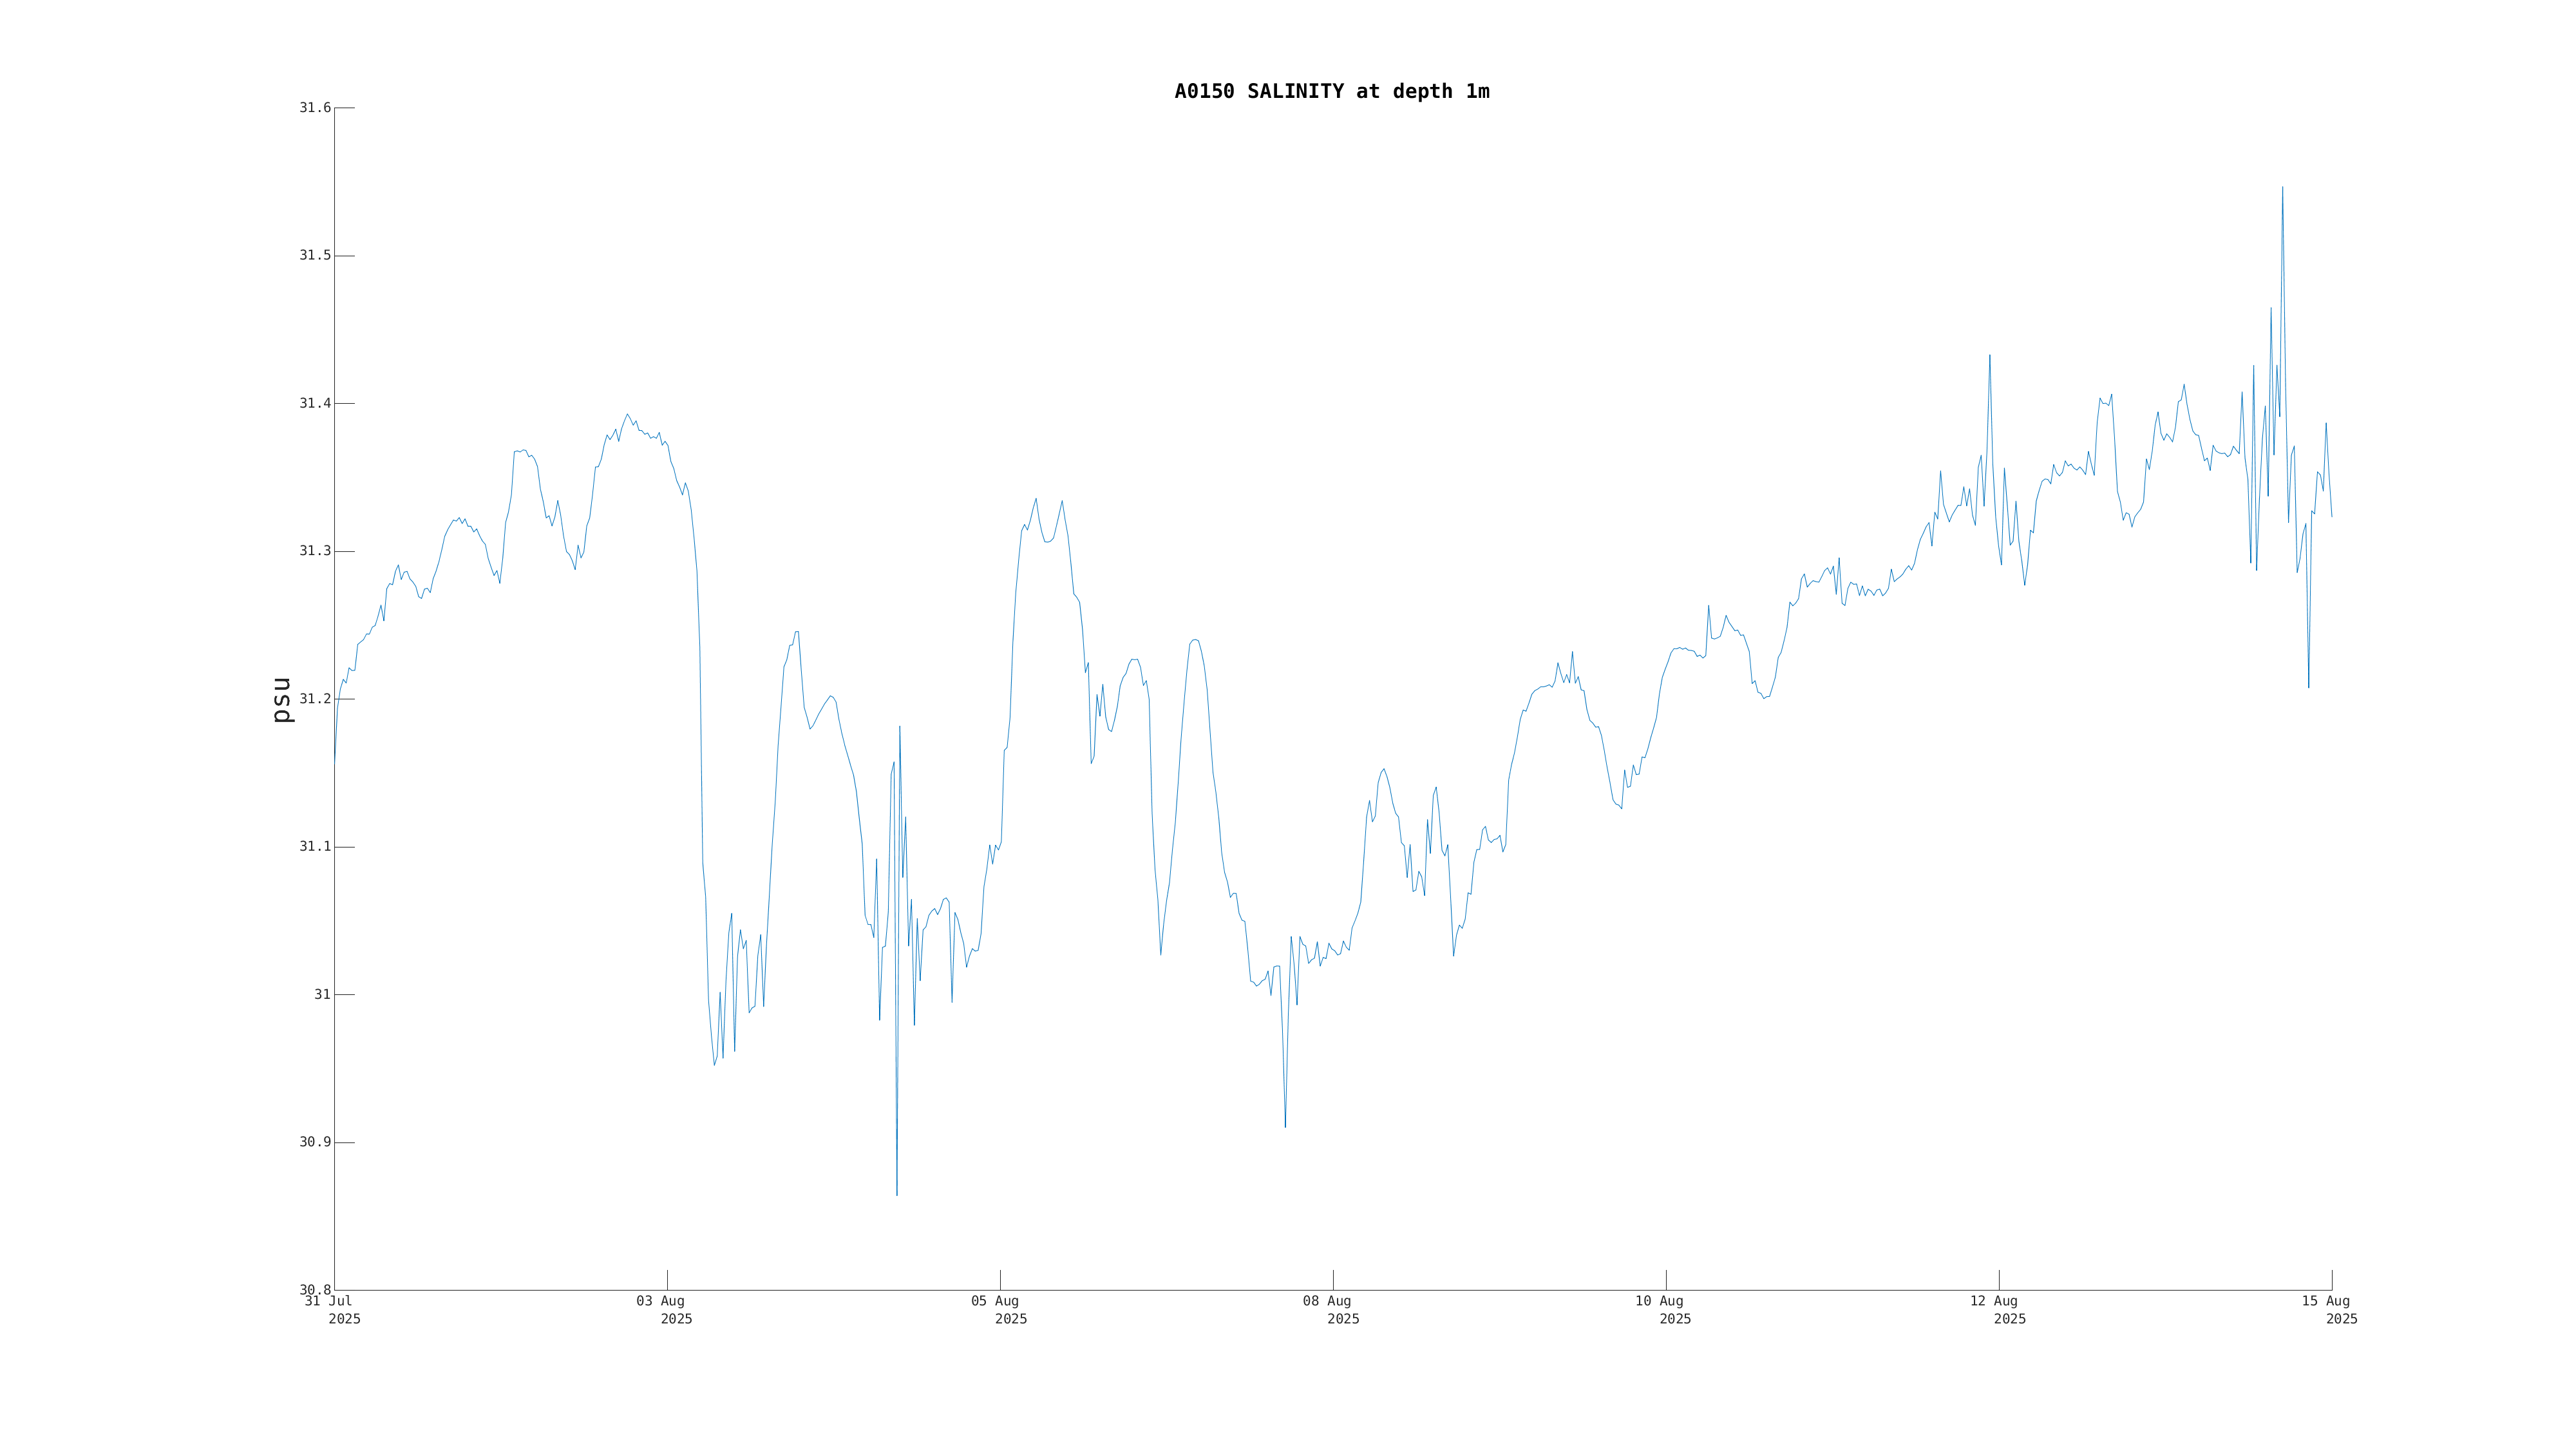
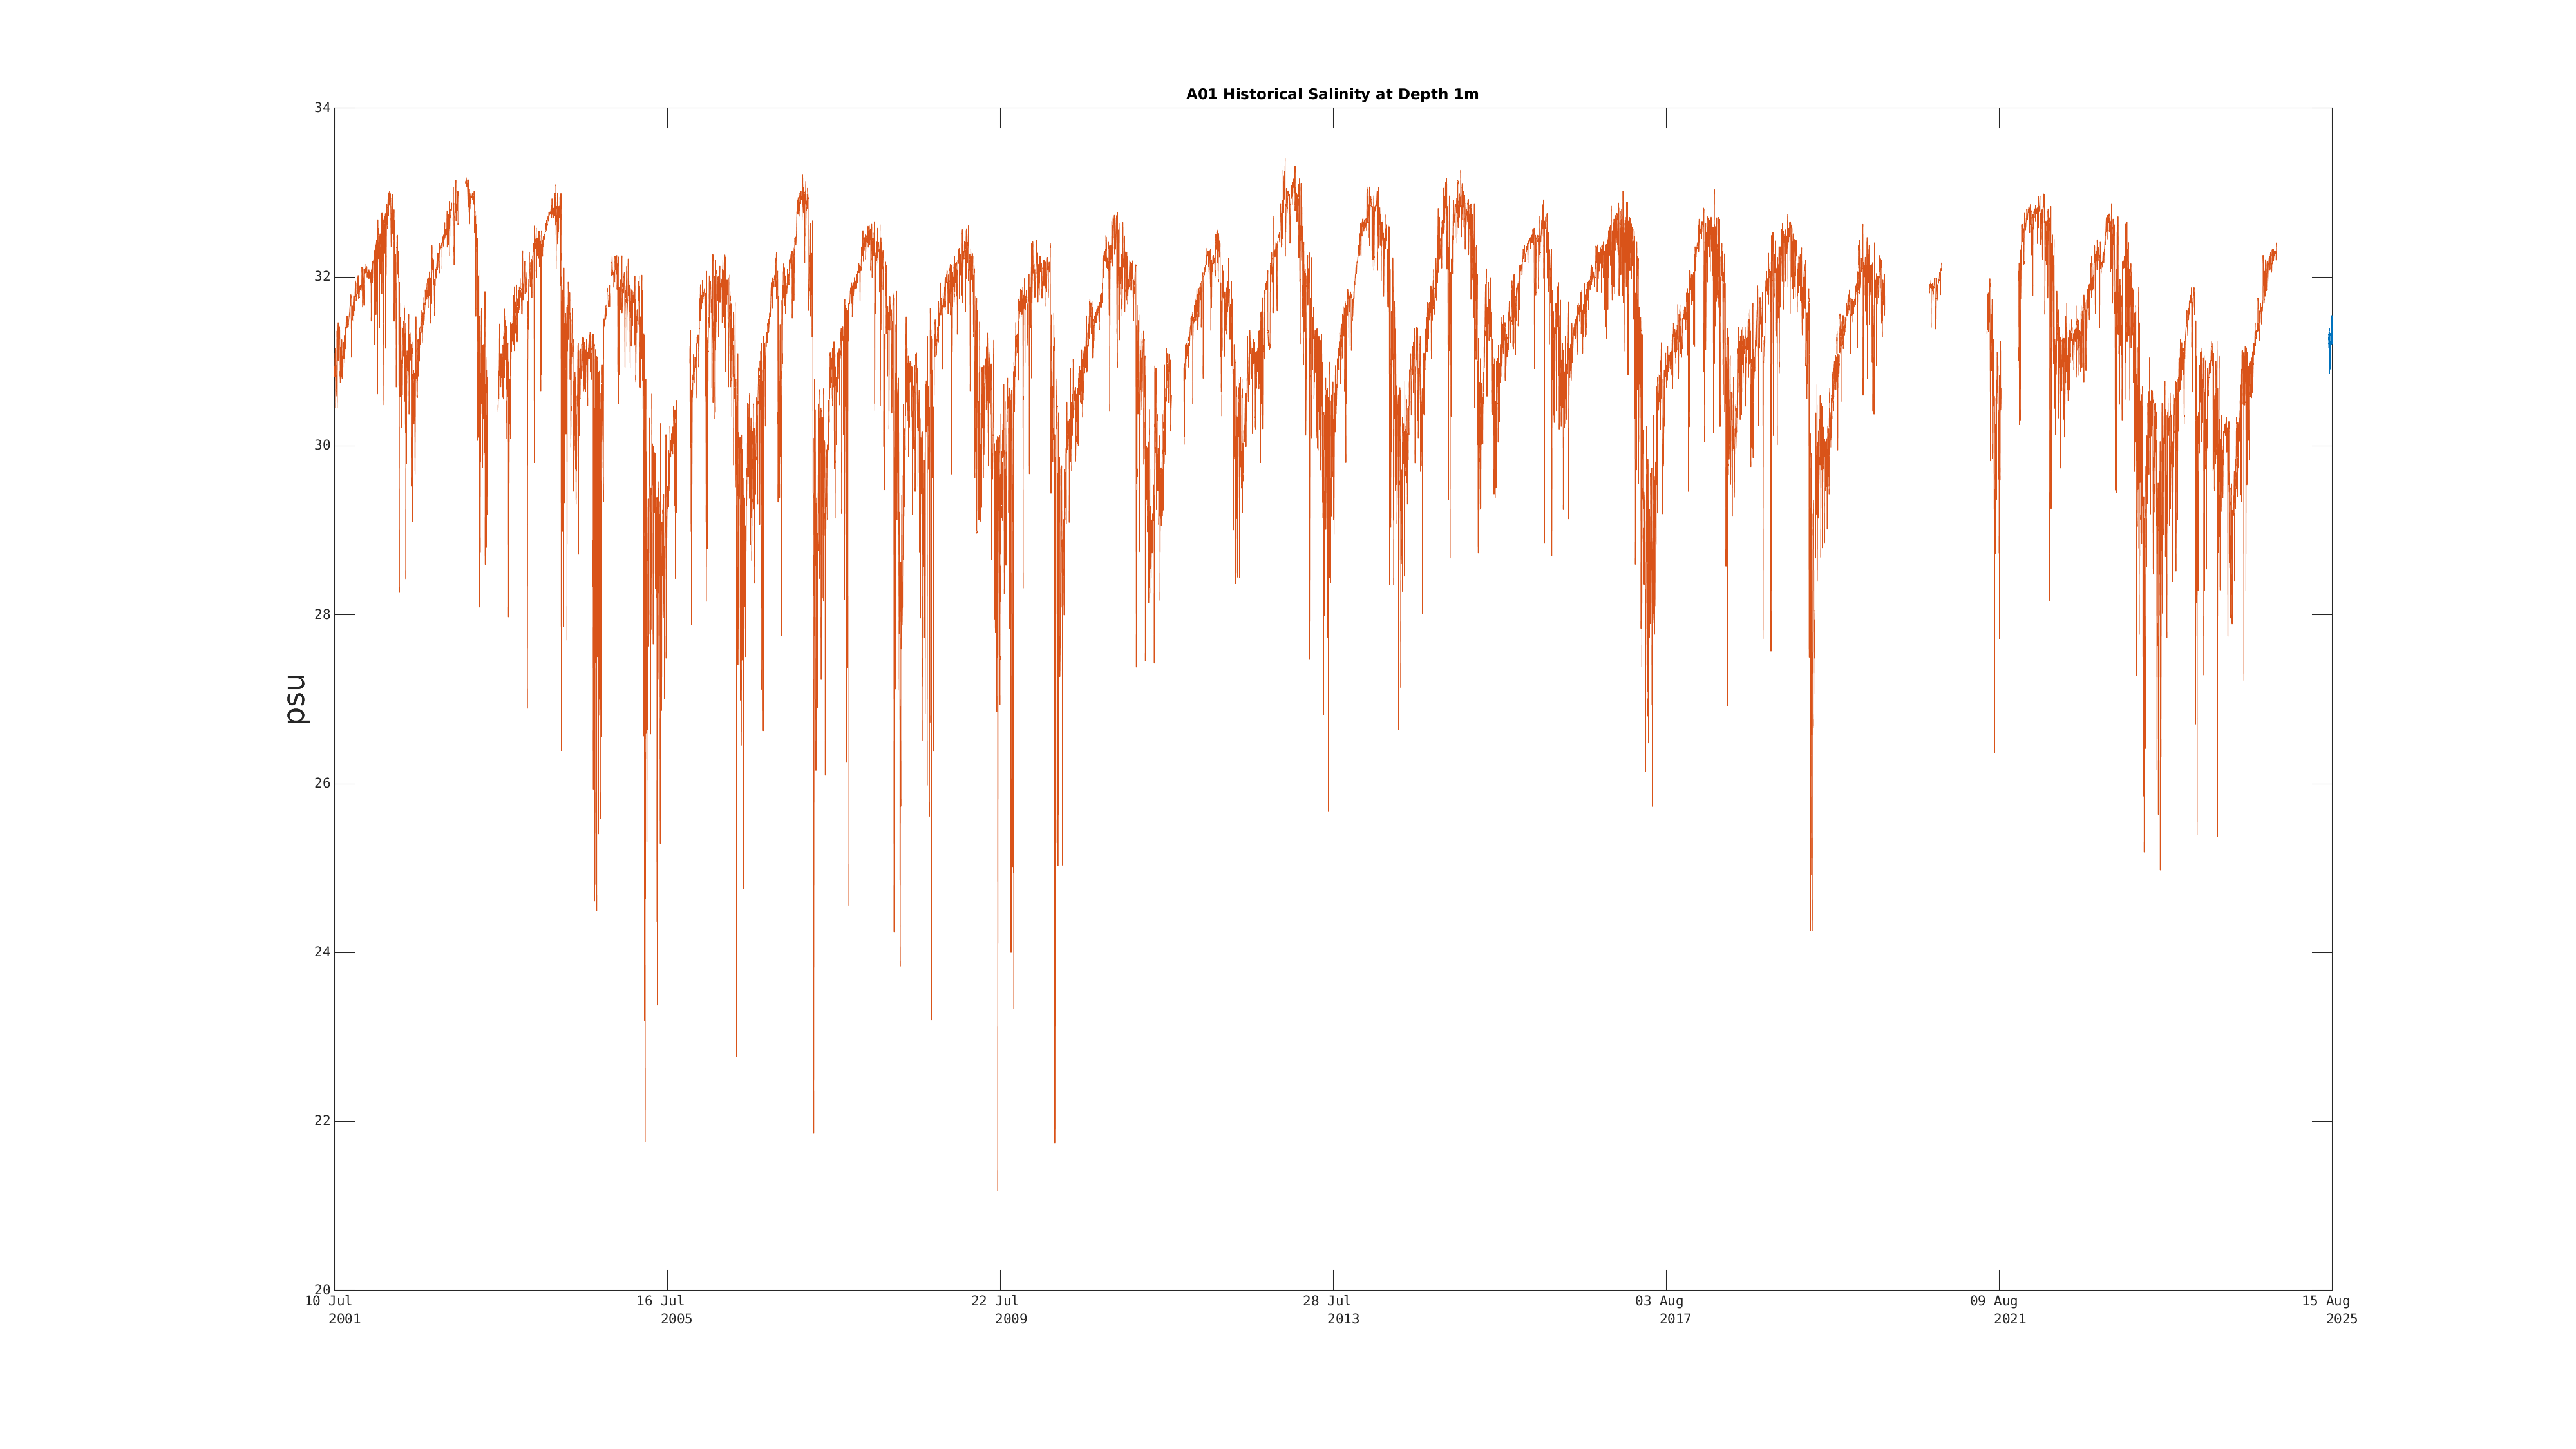
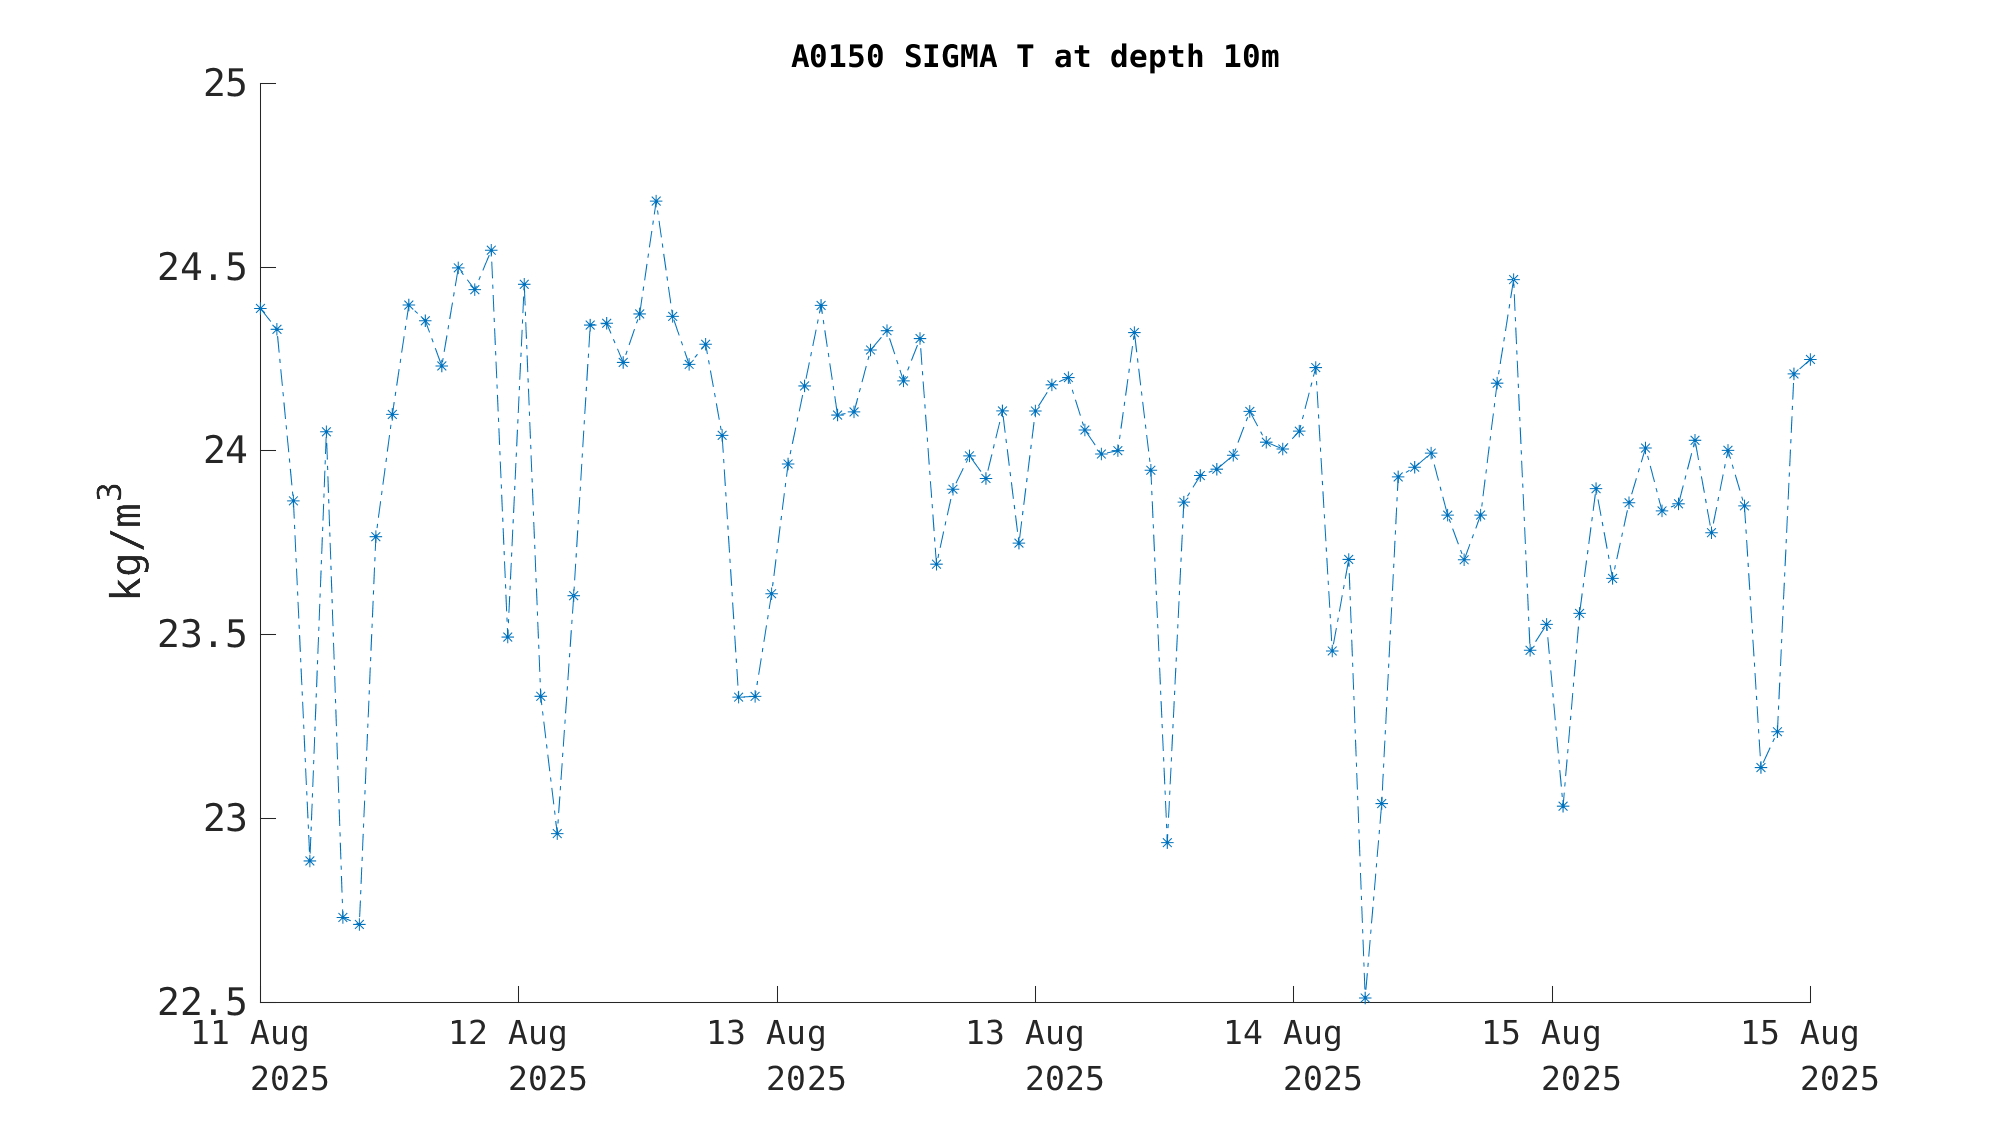
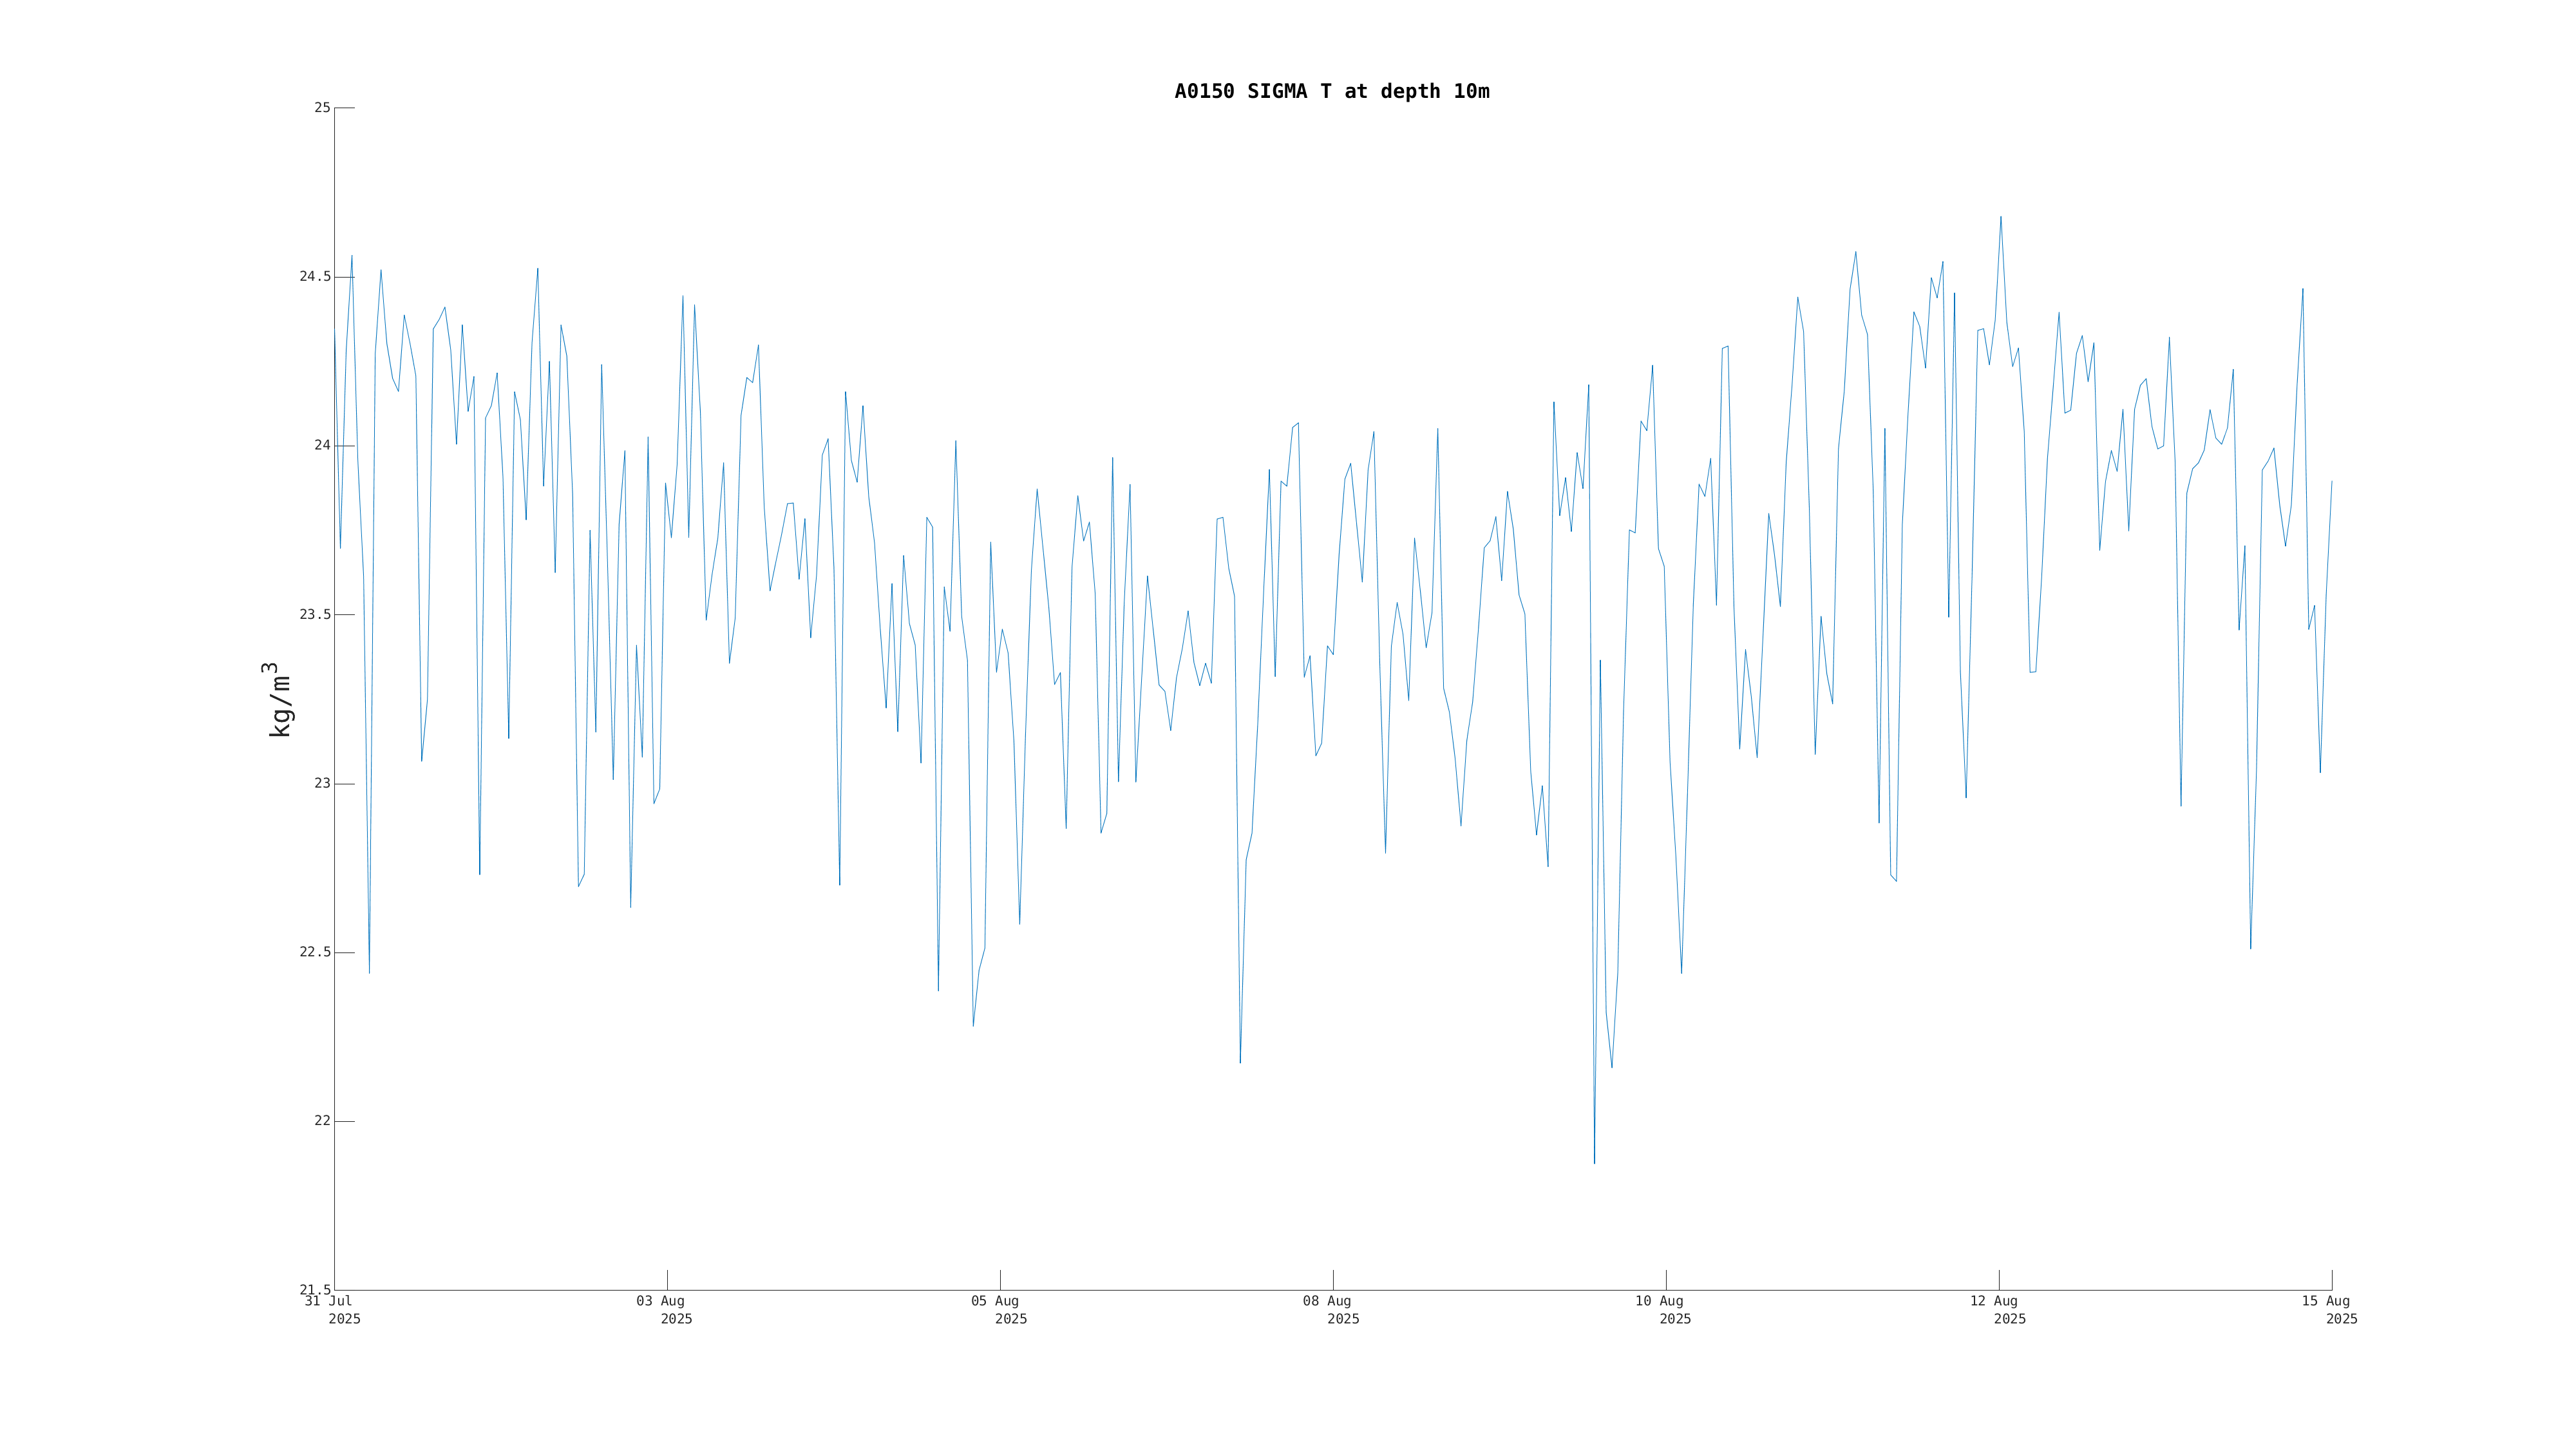
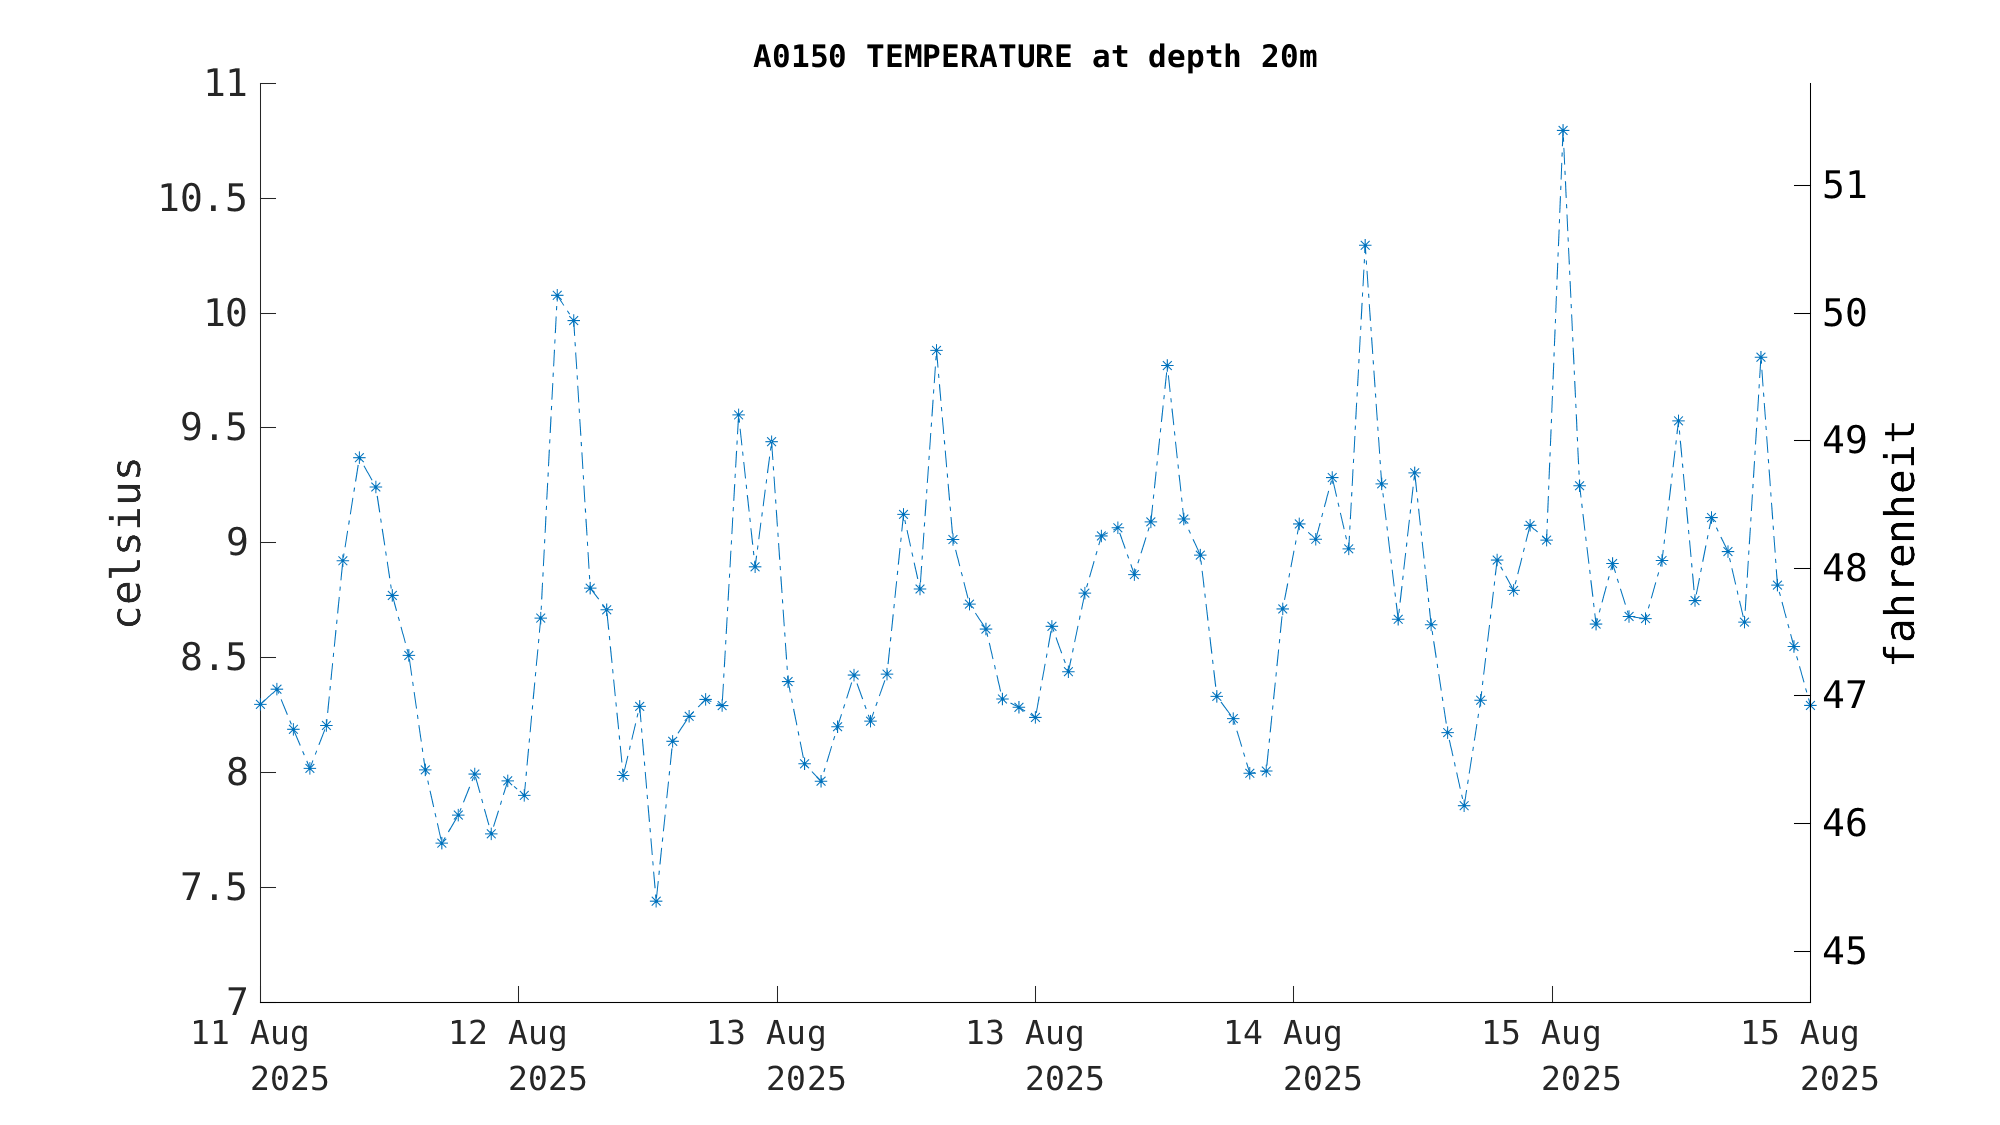
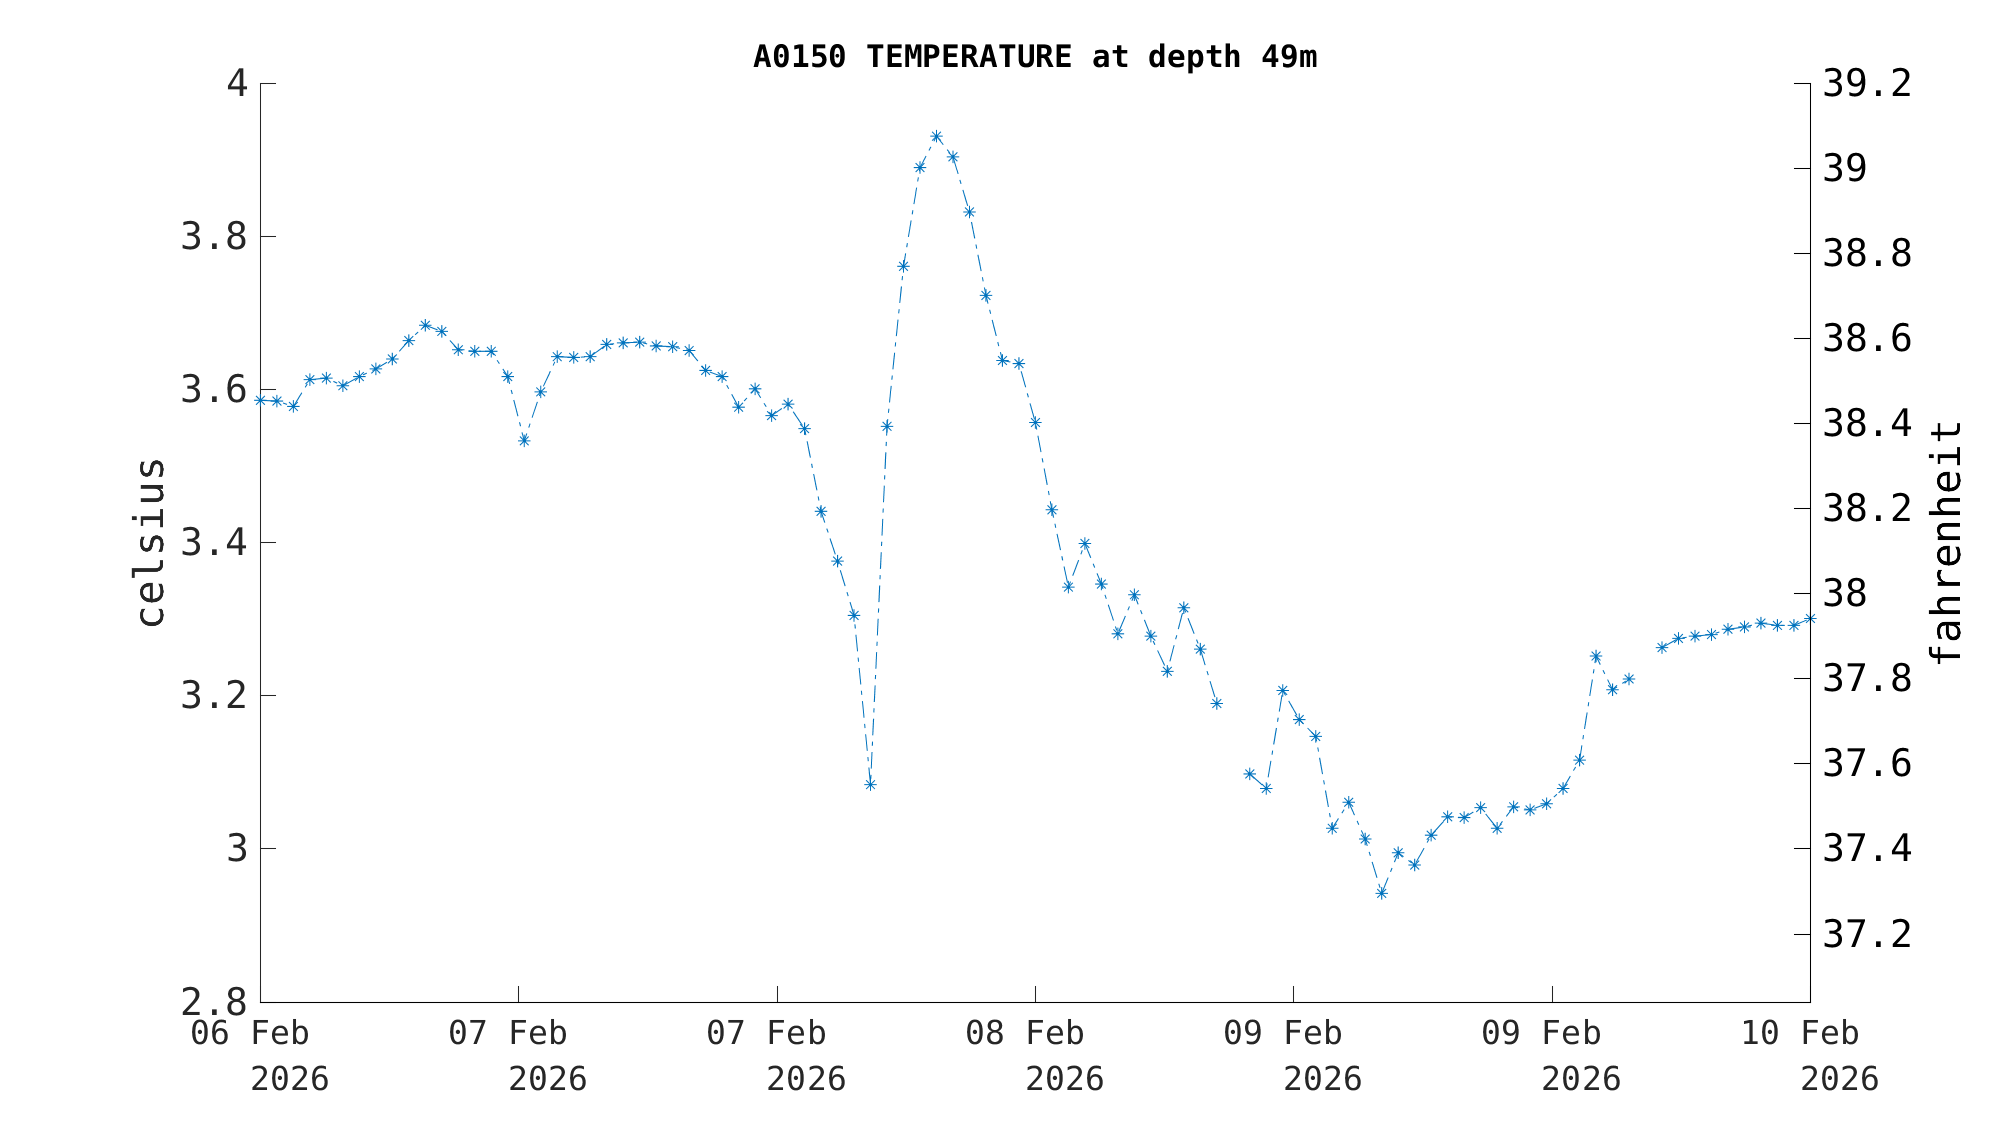
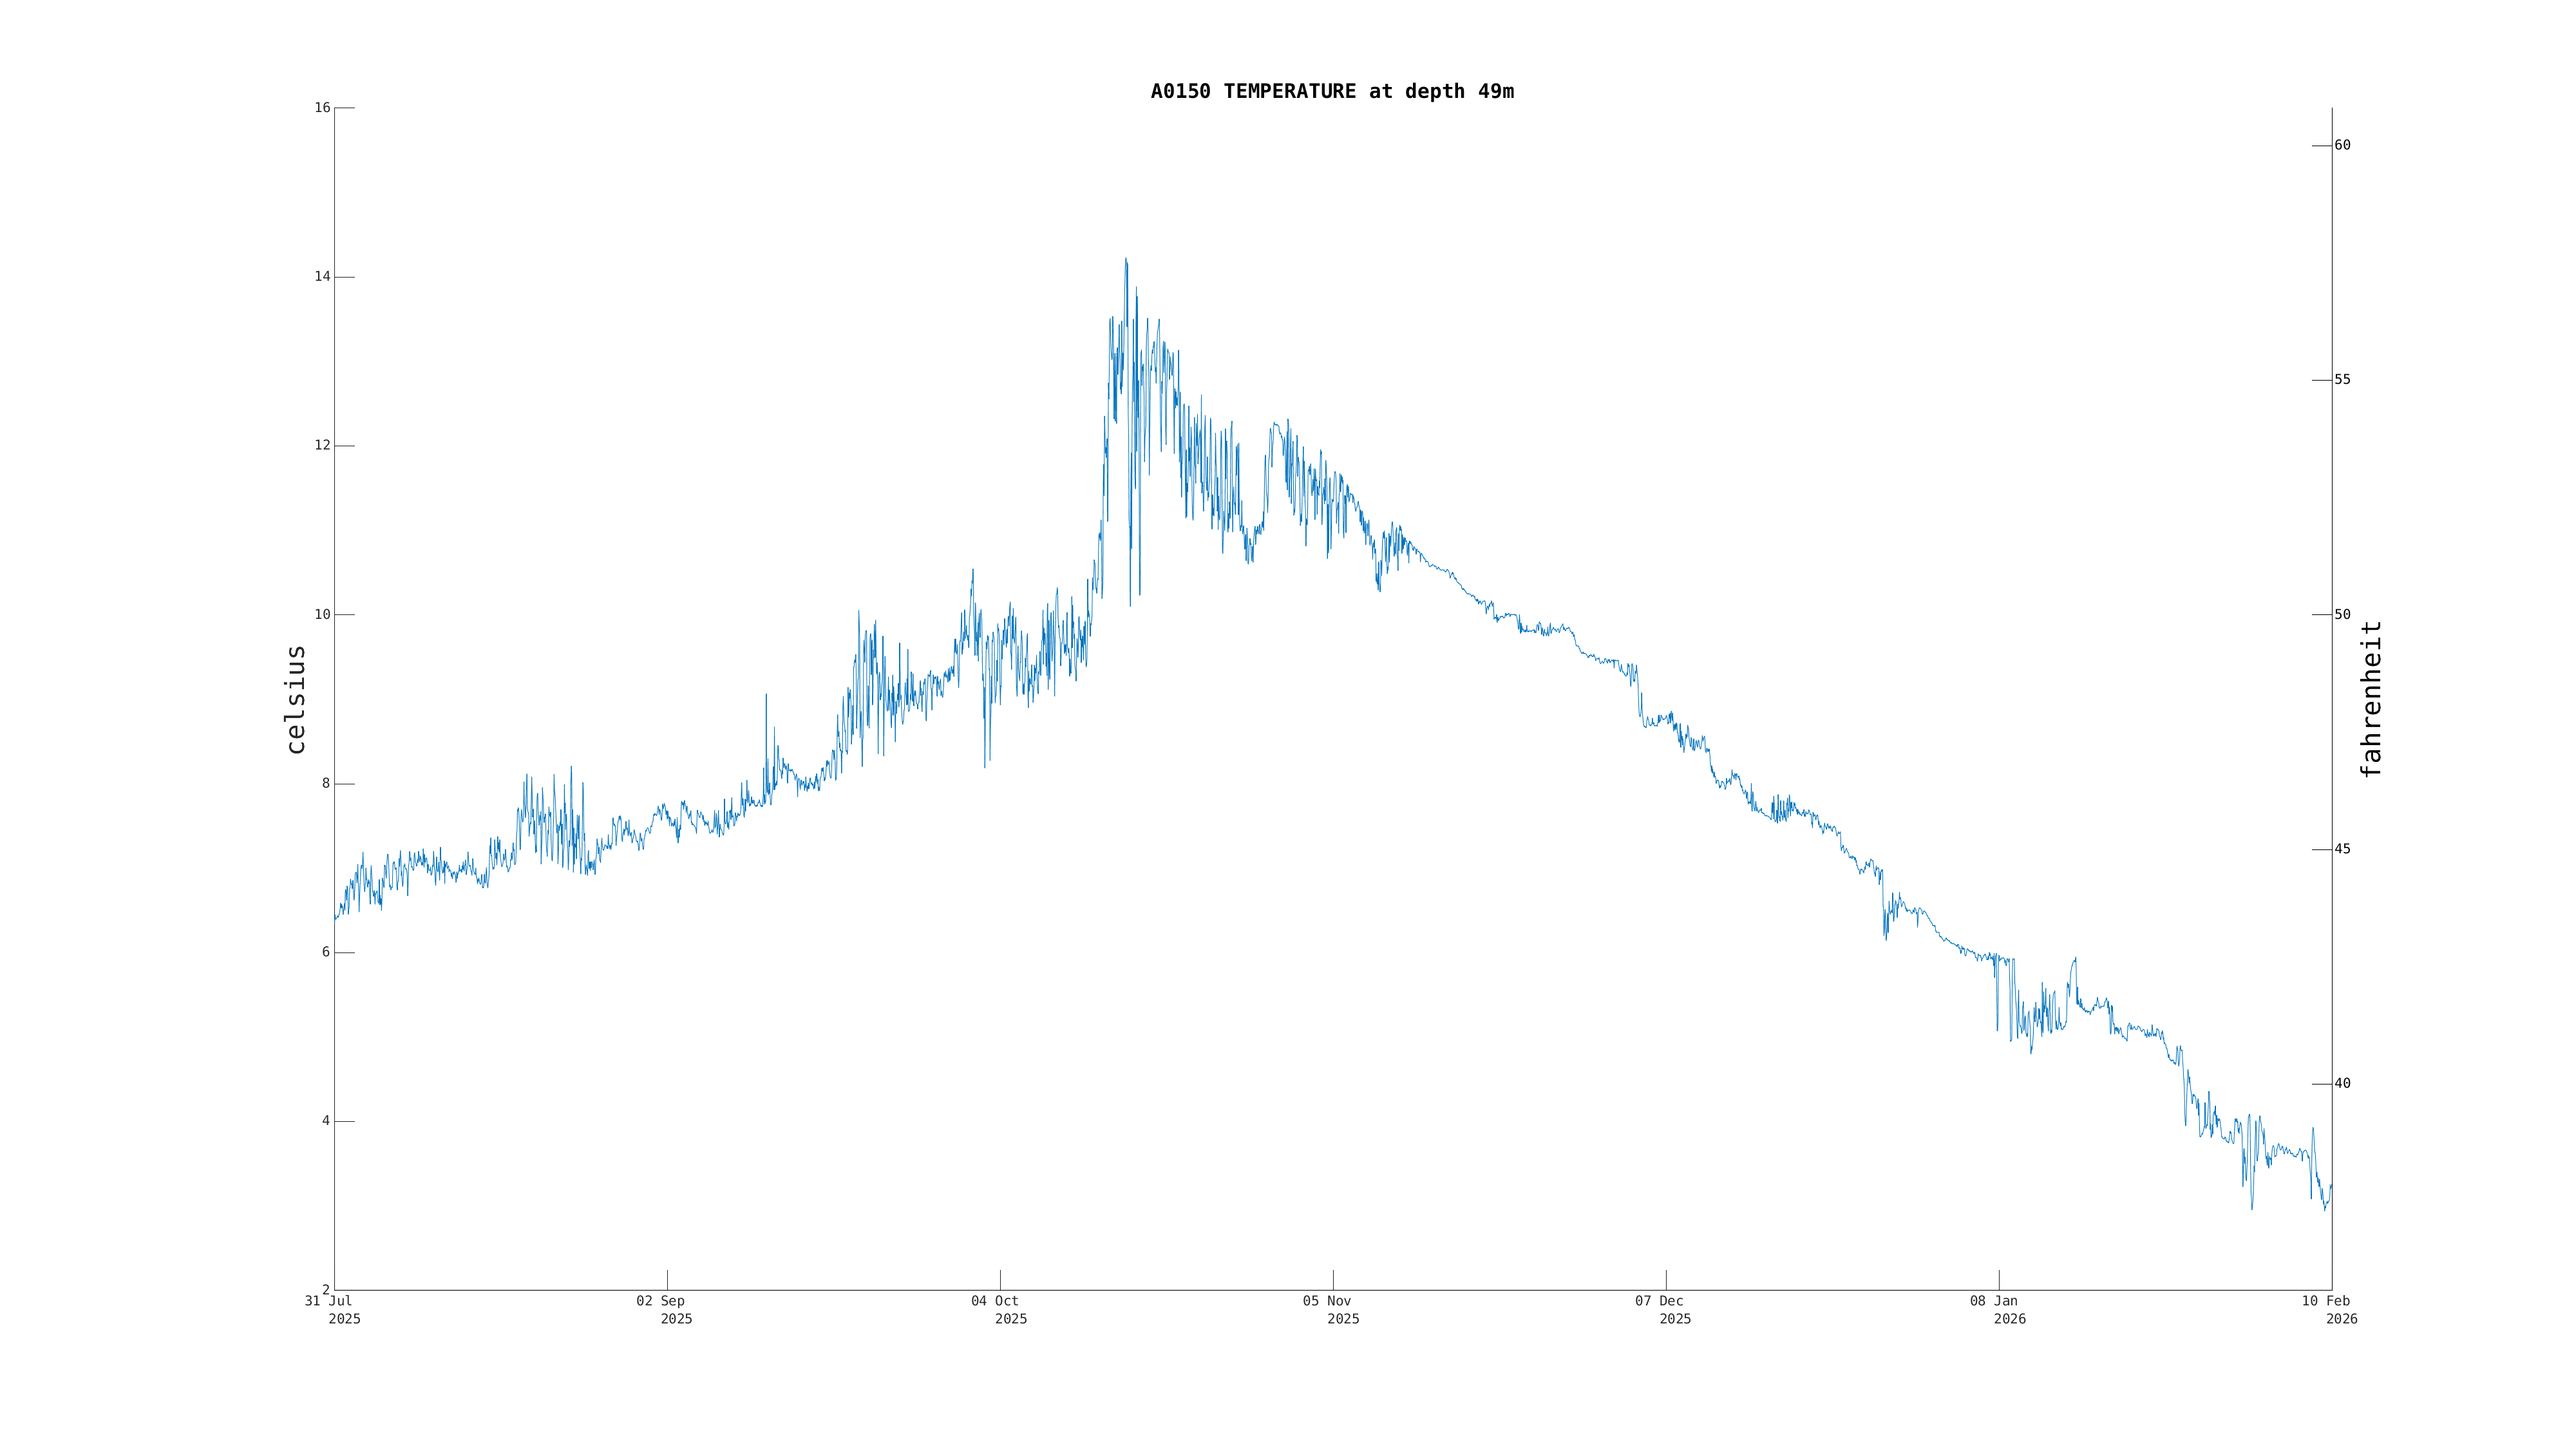
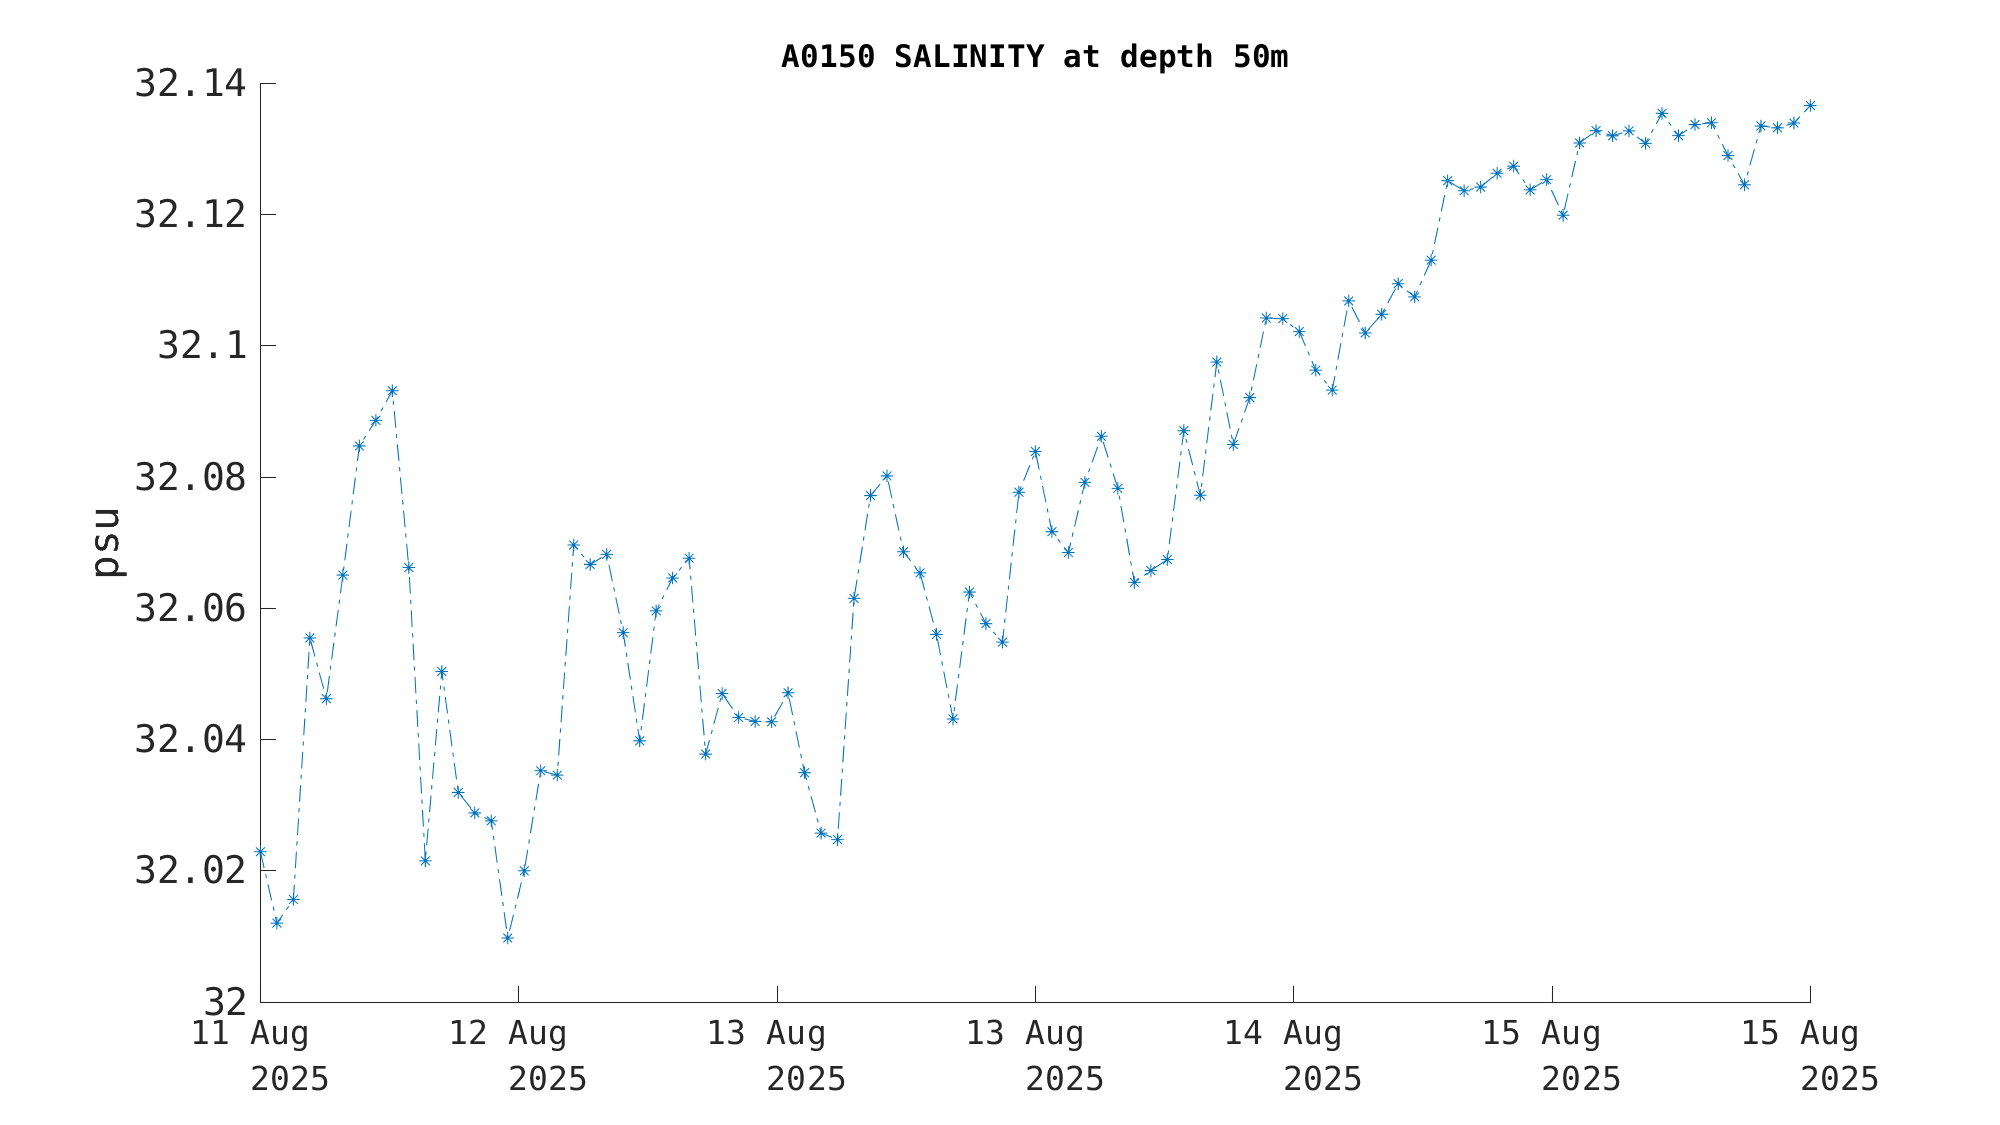
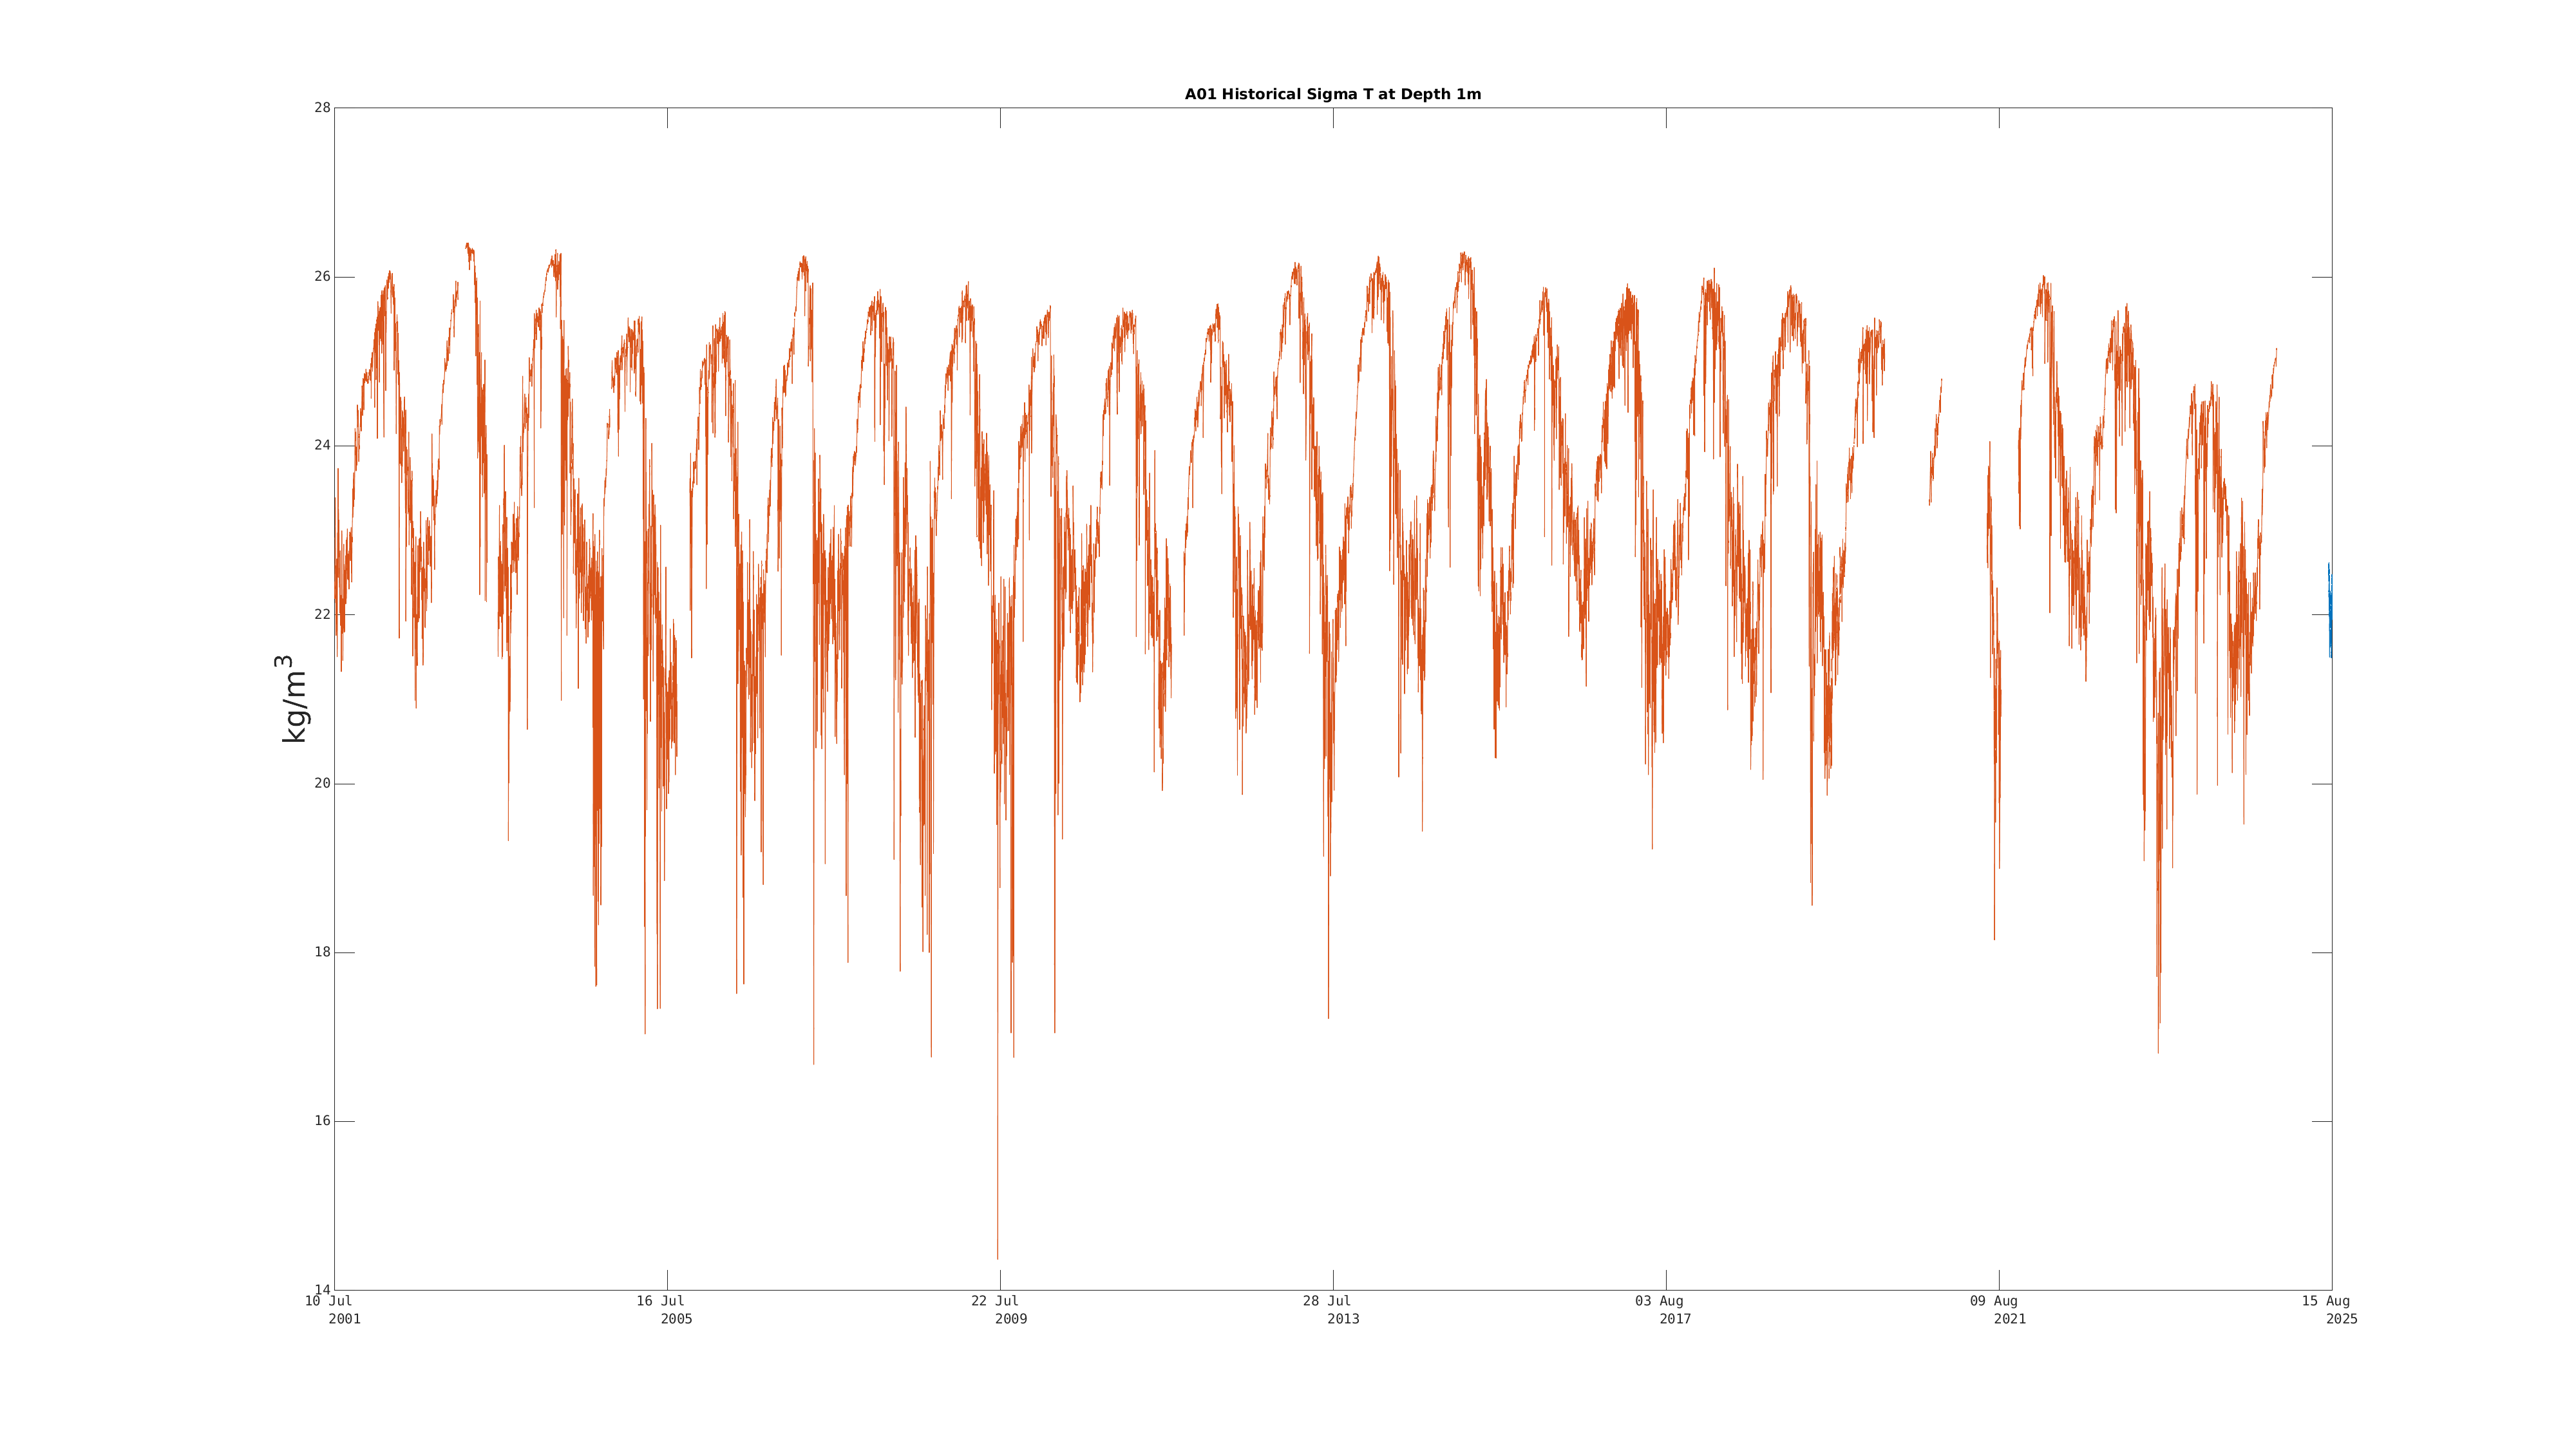
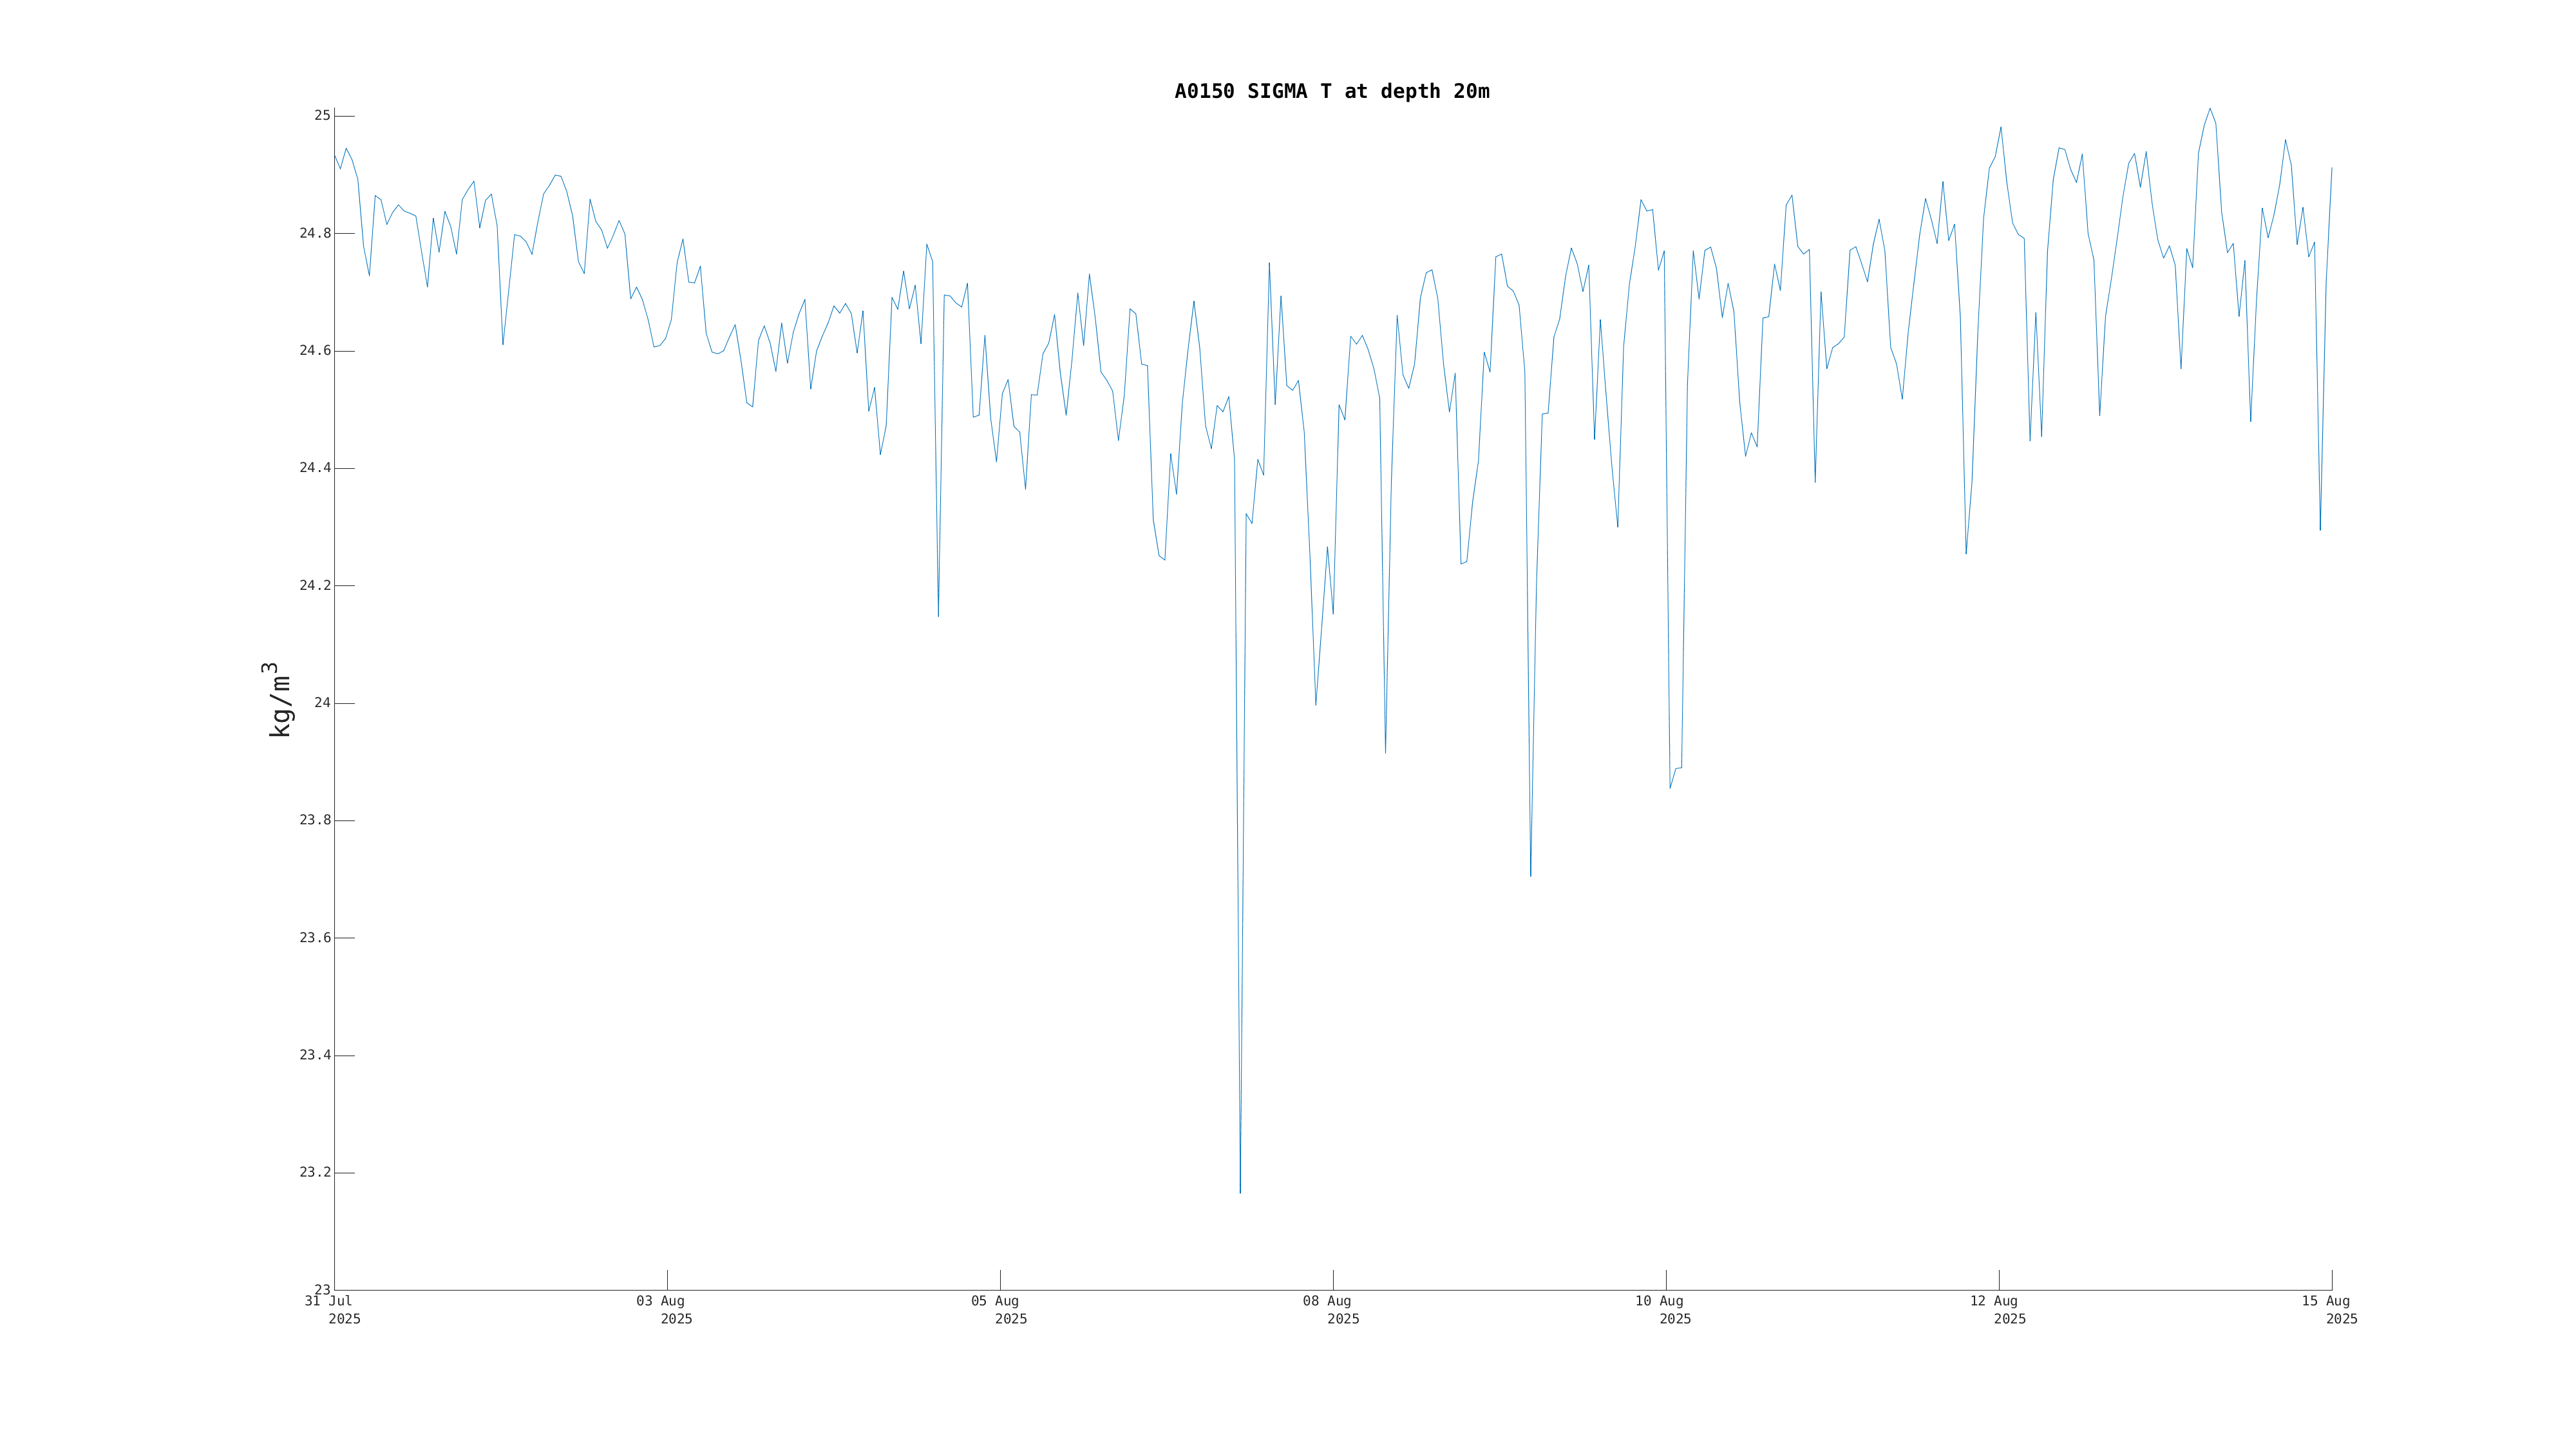
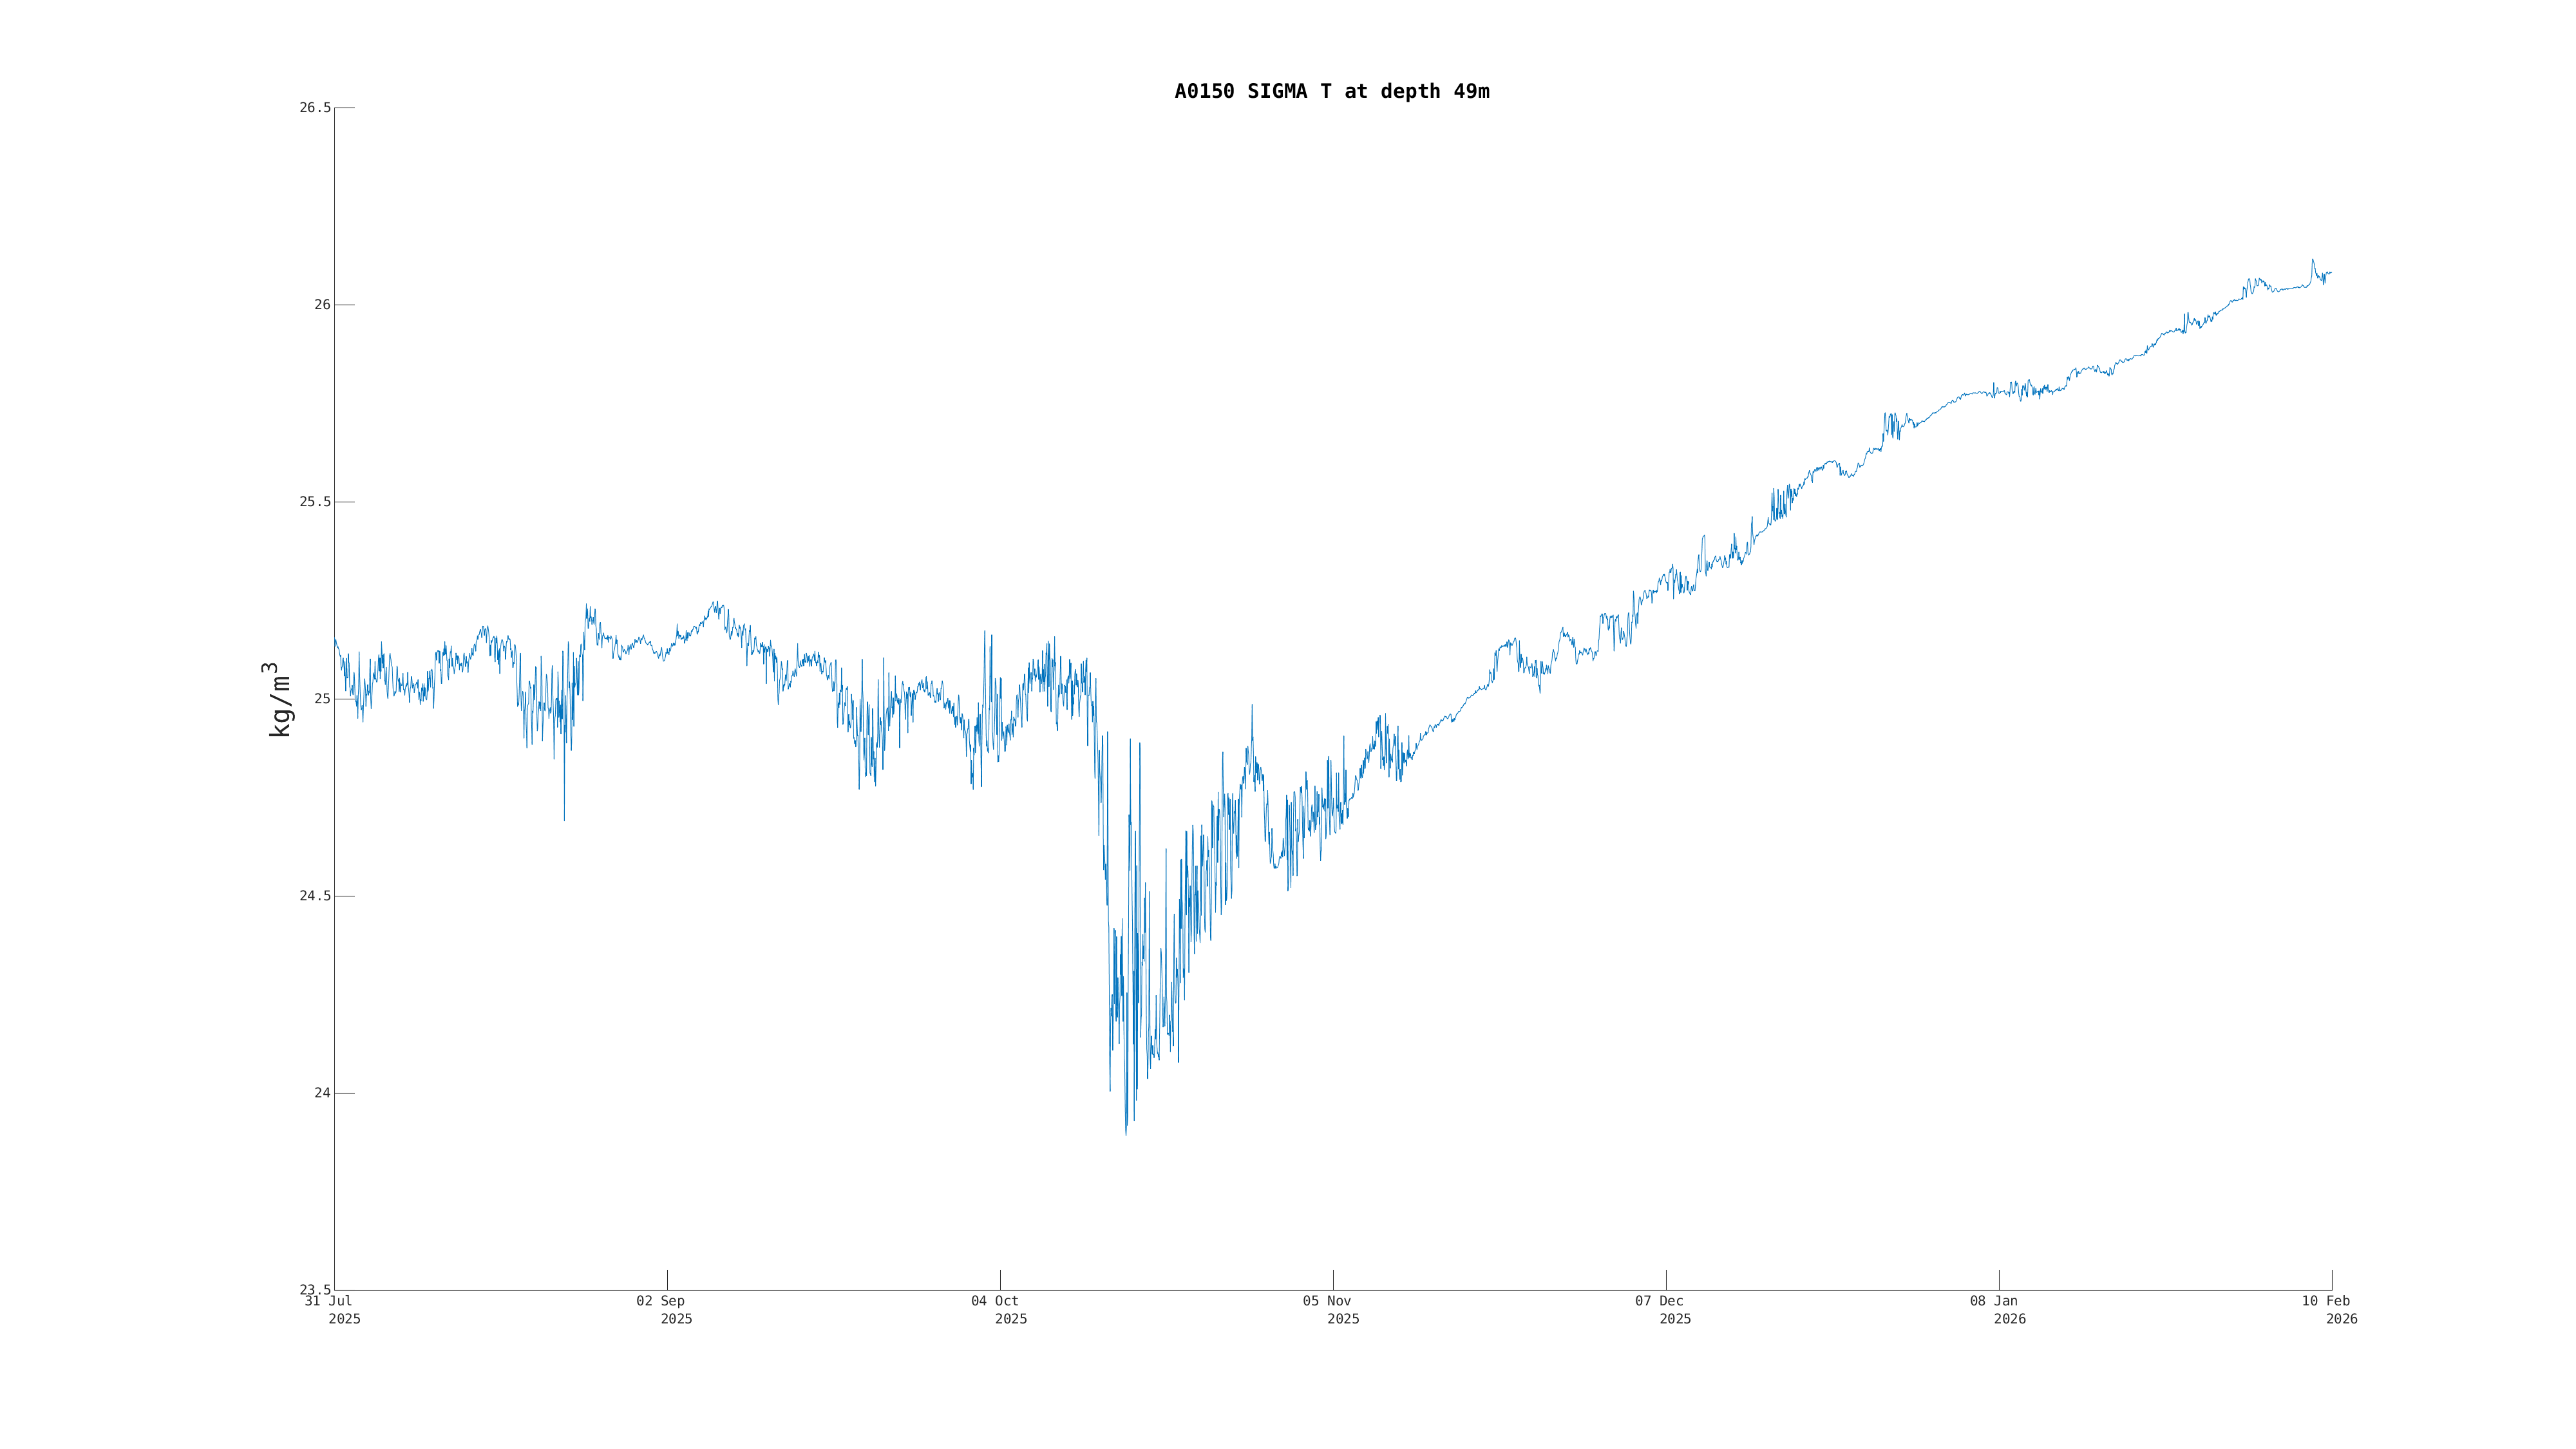
 Temperature, Salinity, Density (Deployment Only):
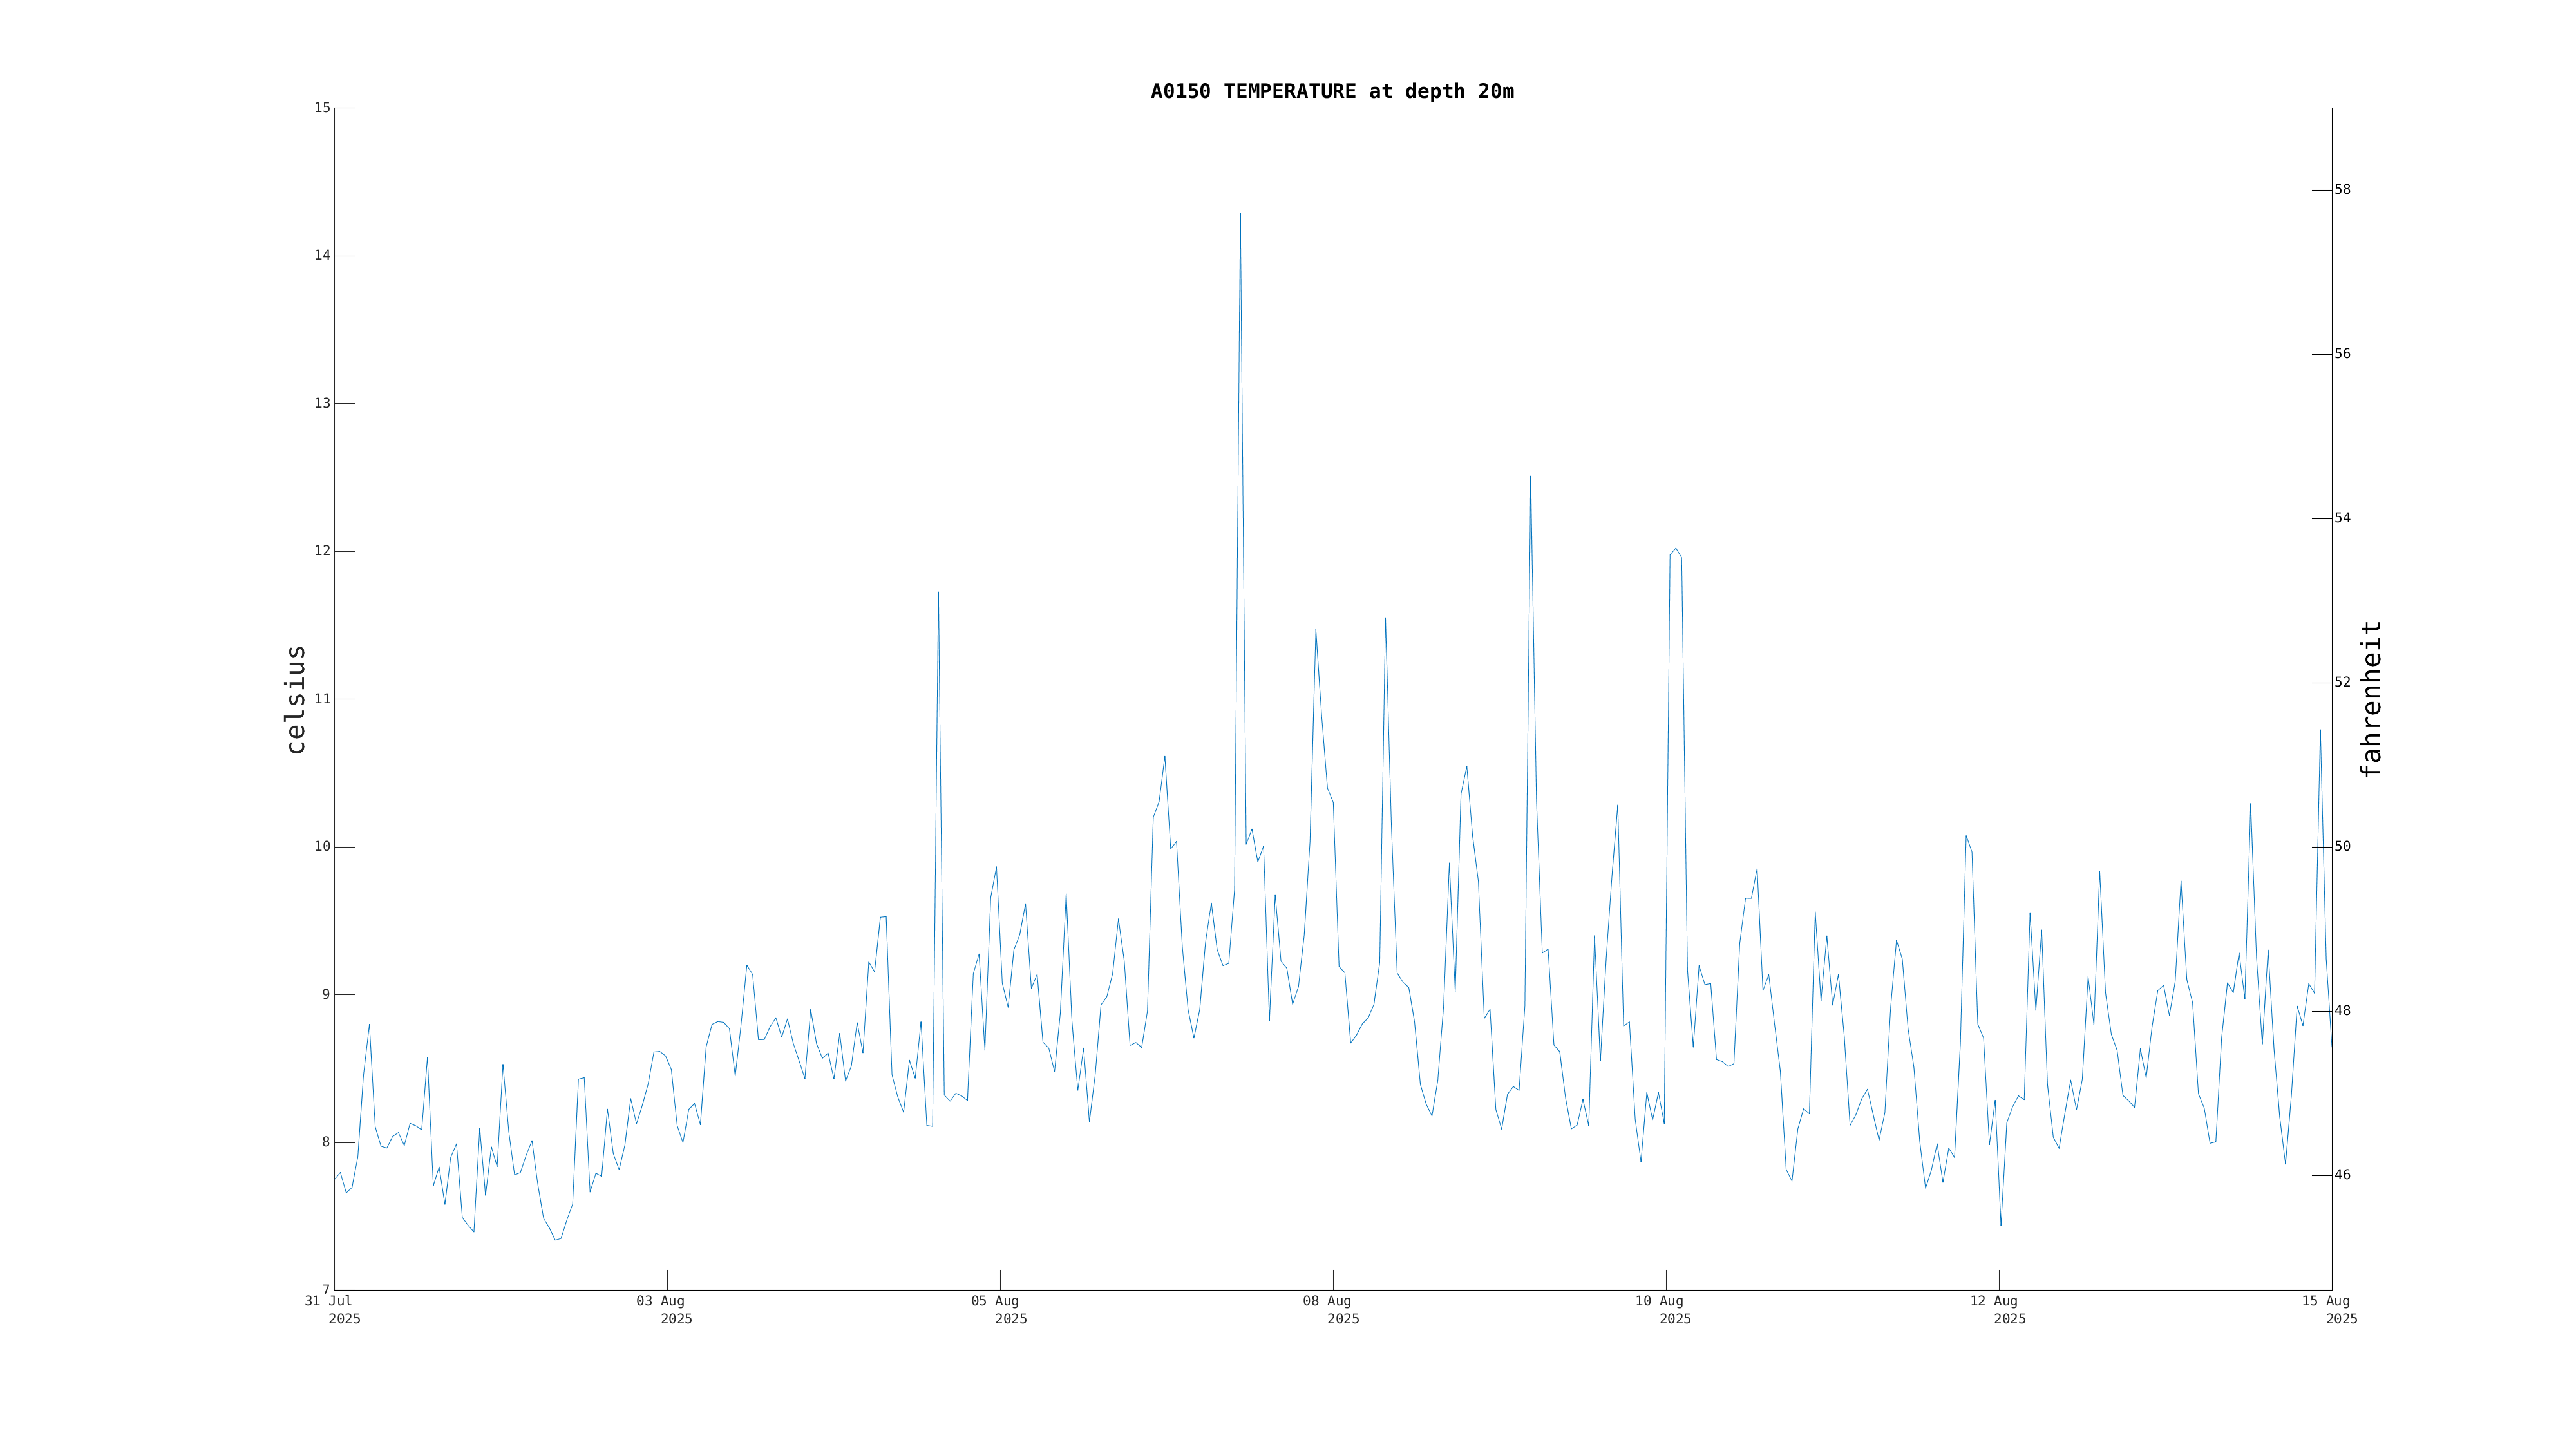

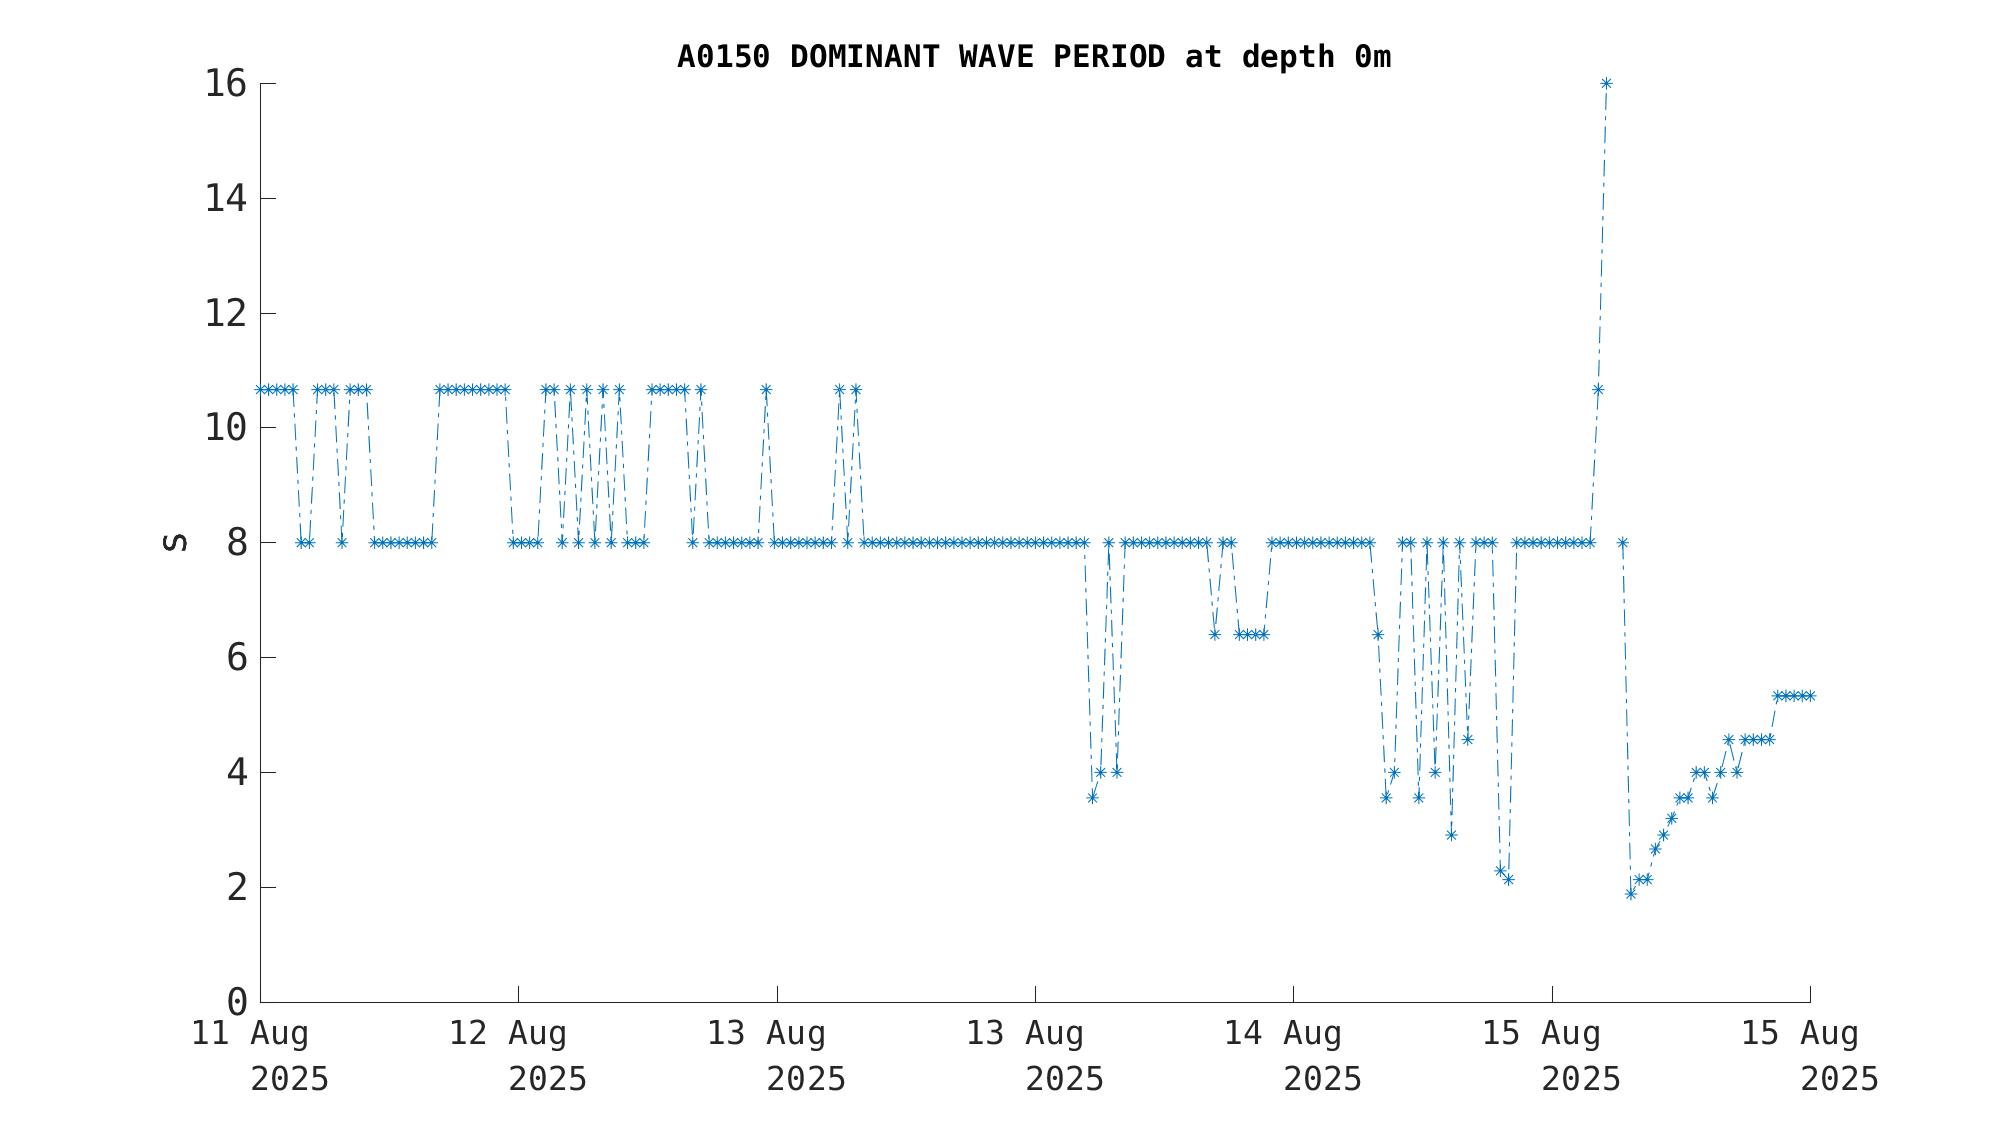
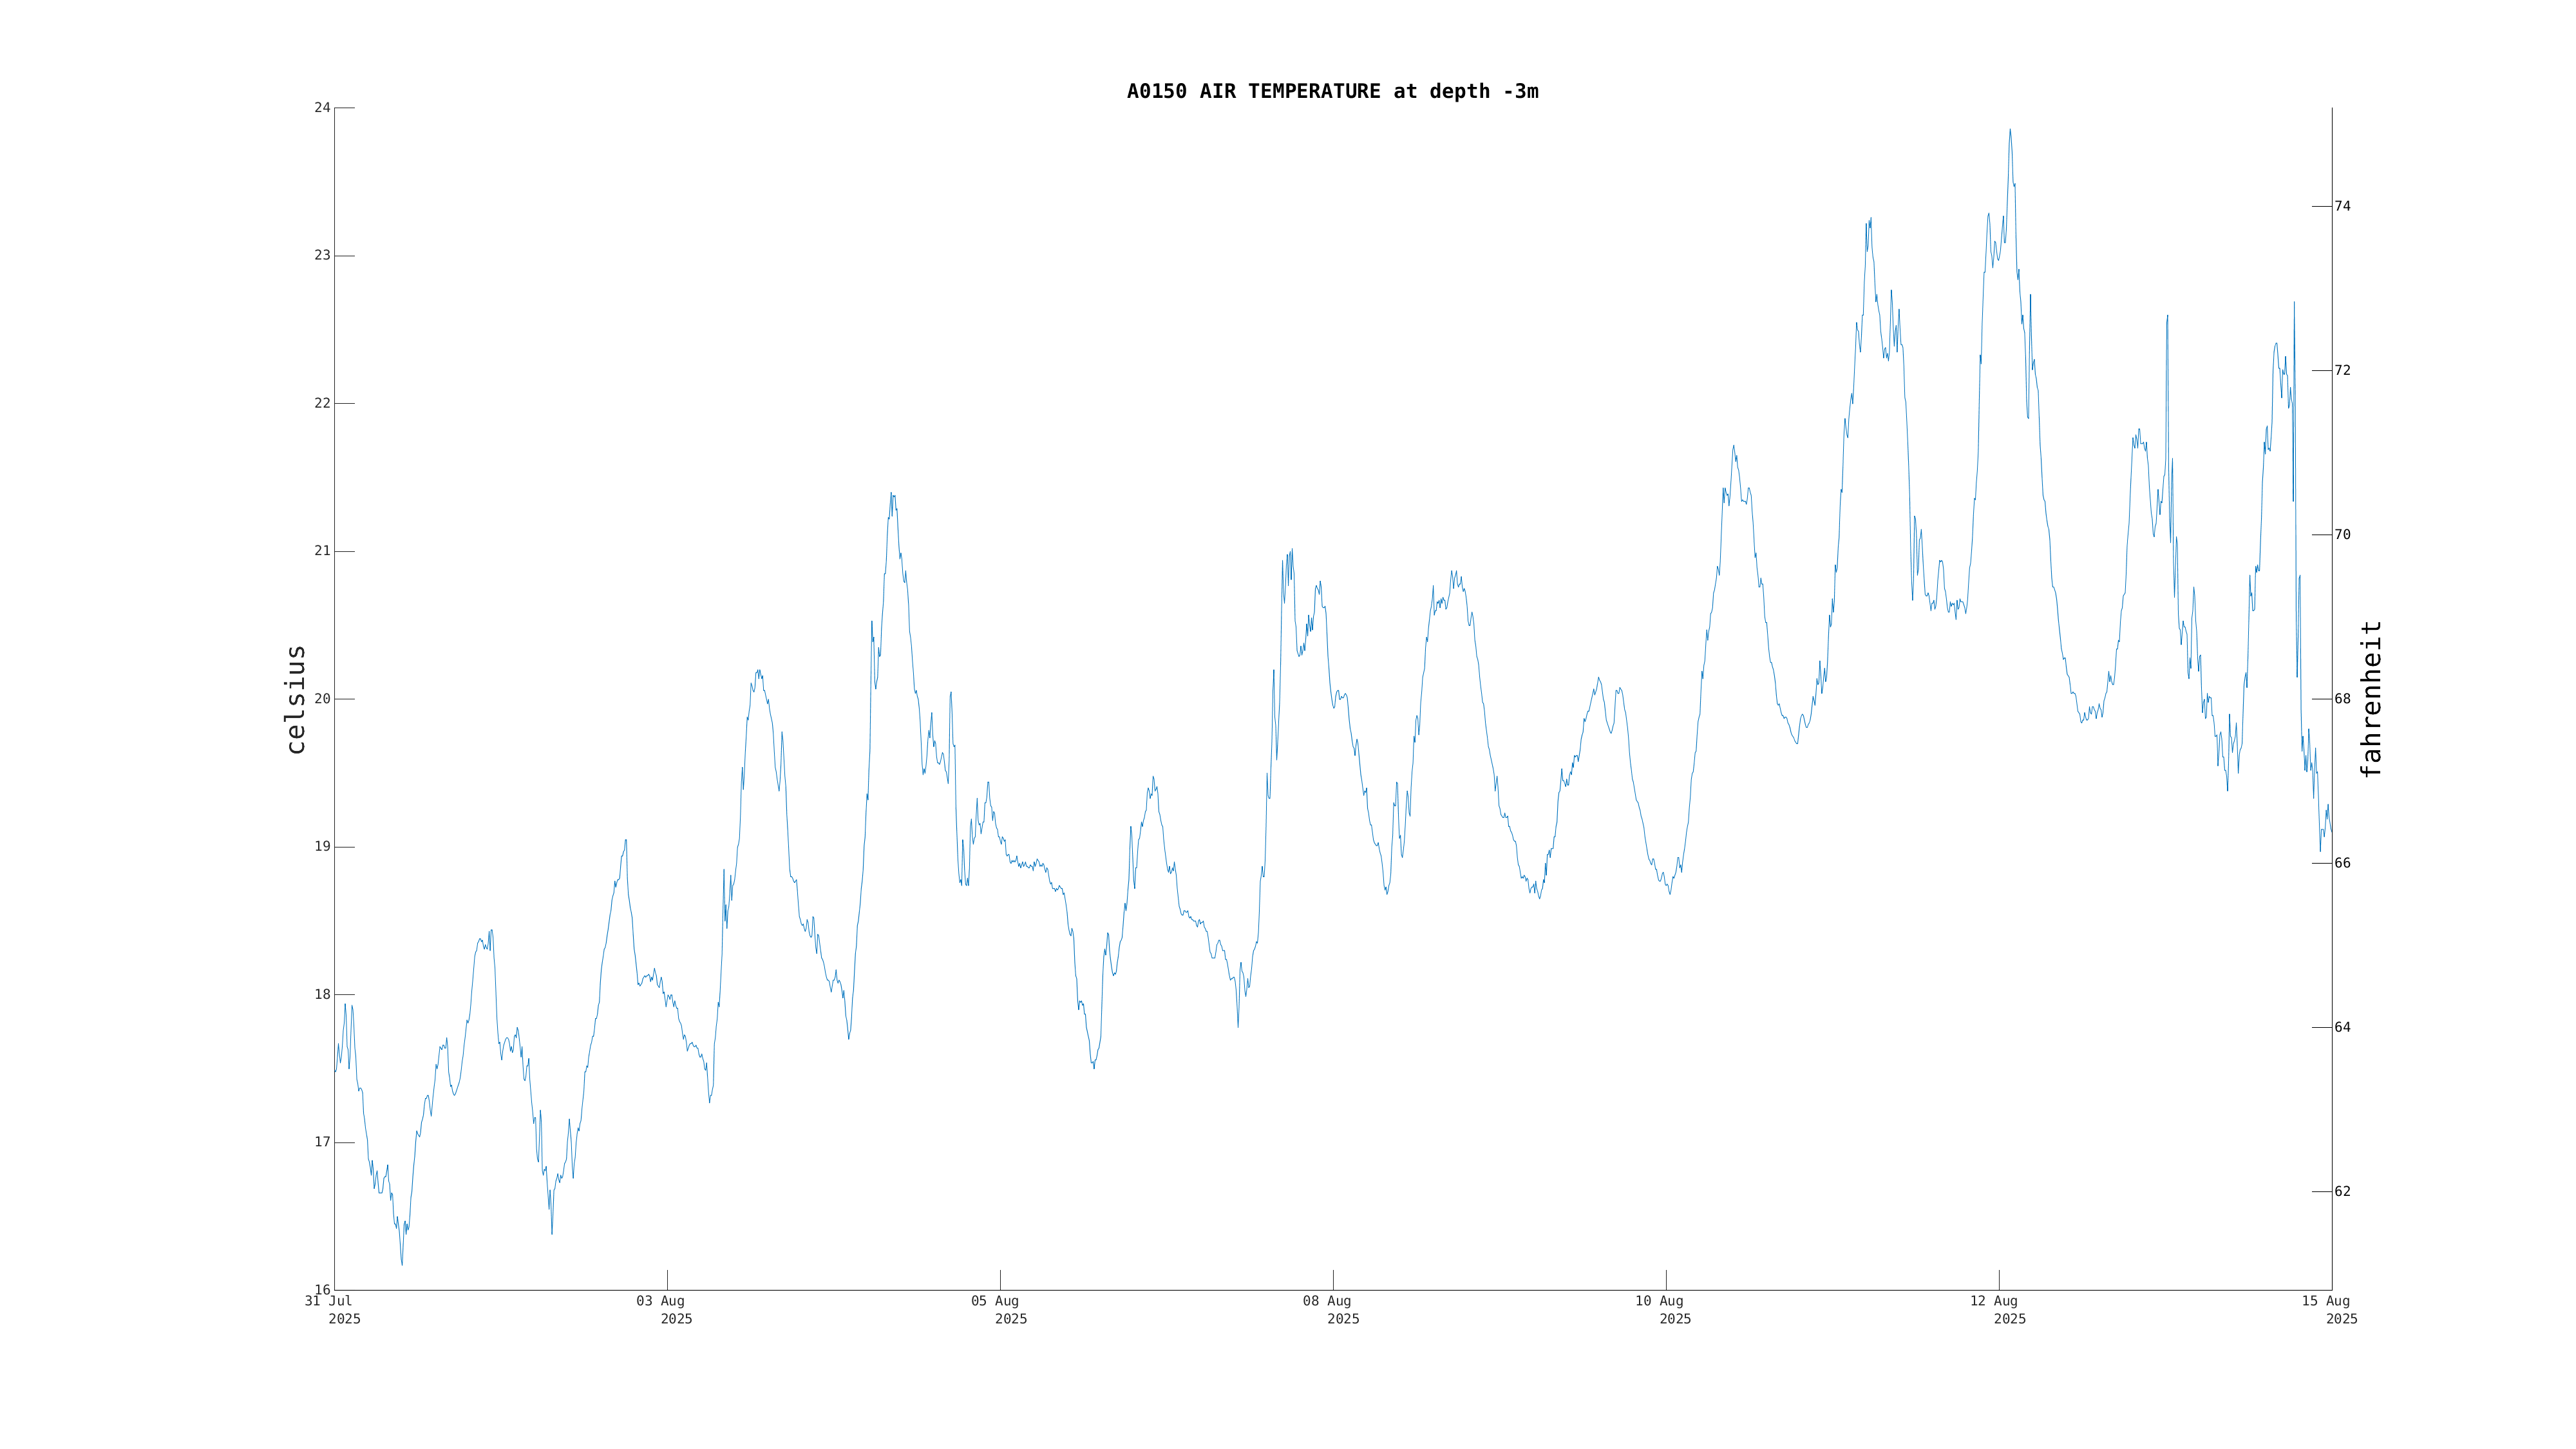
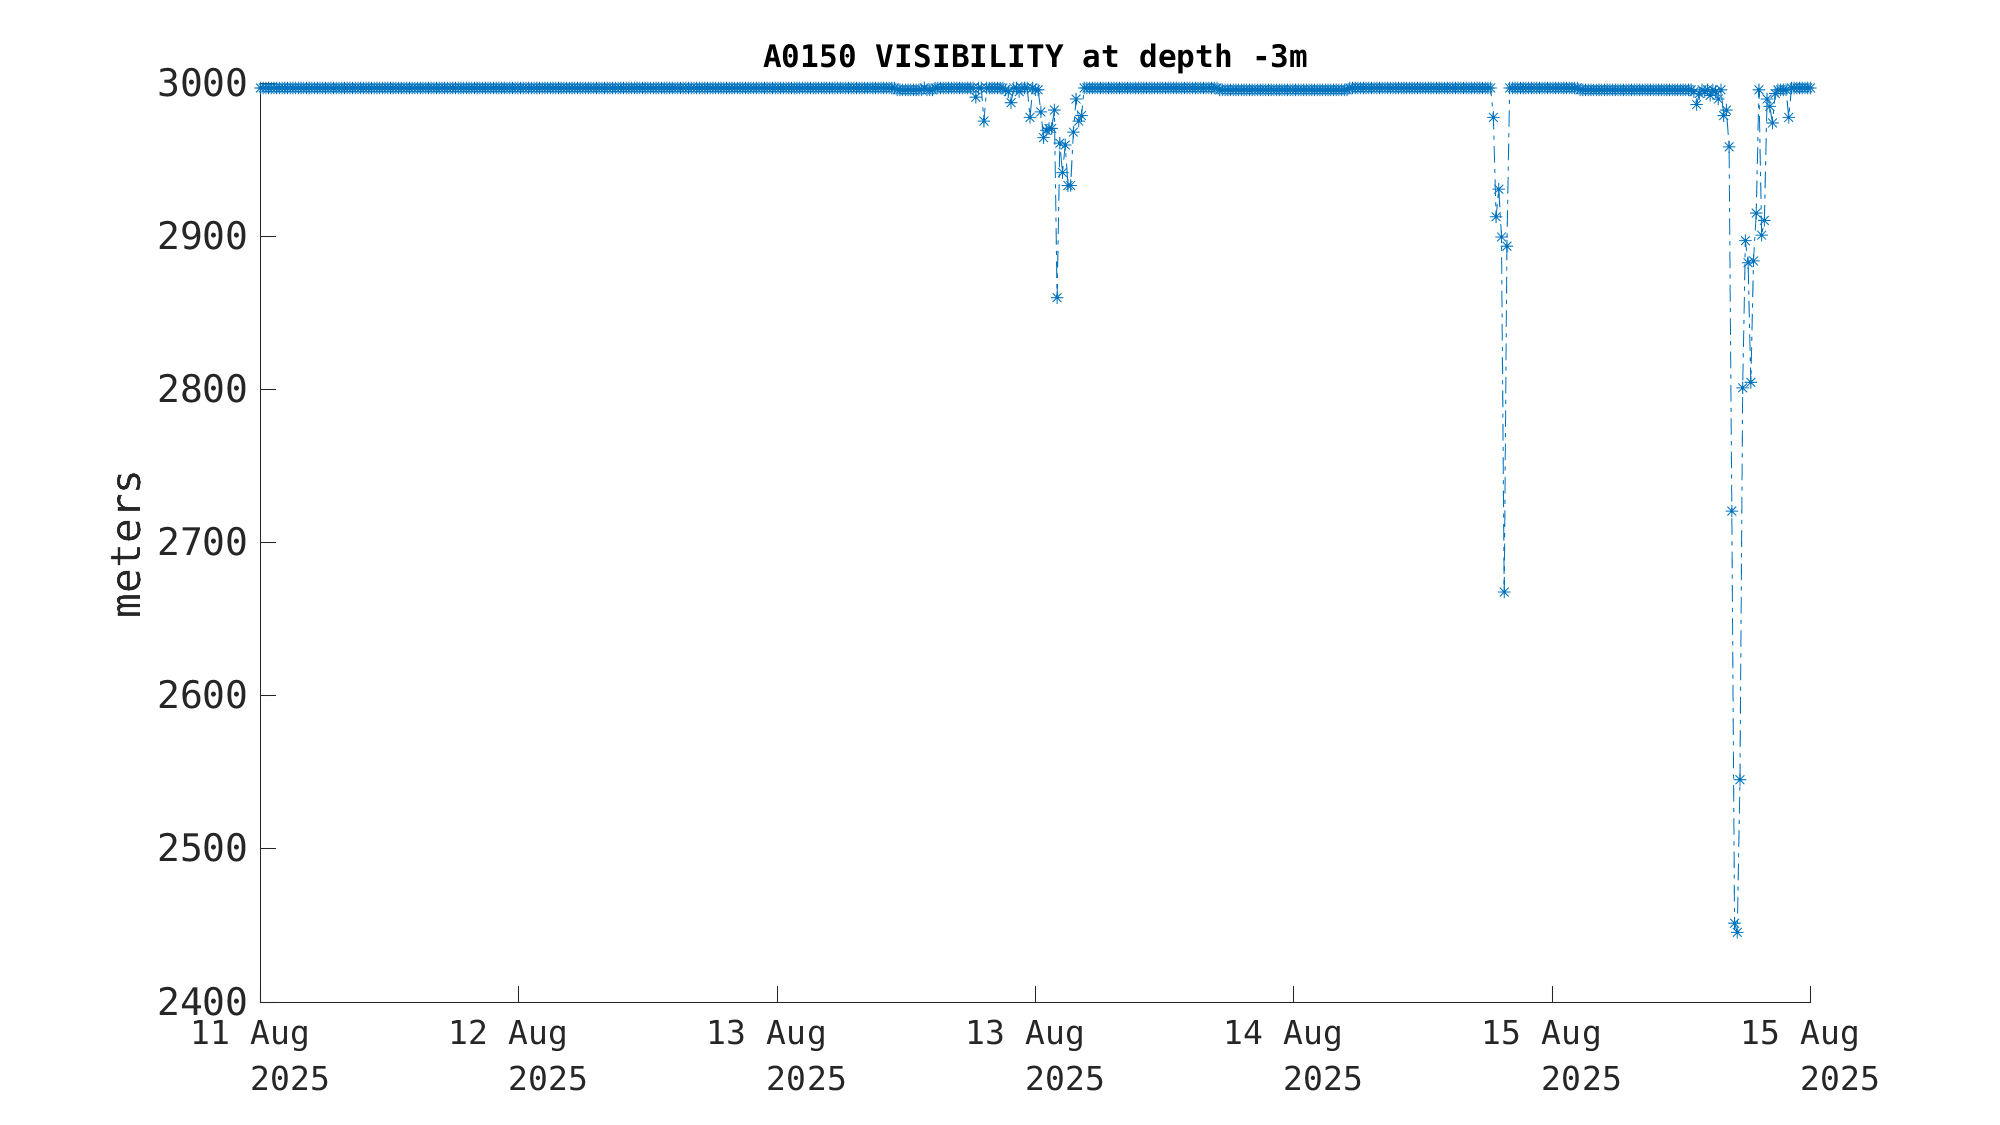
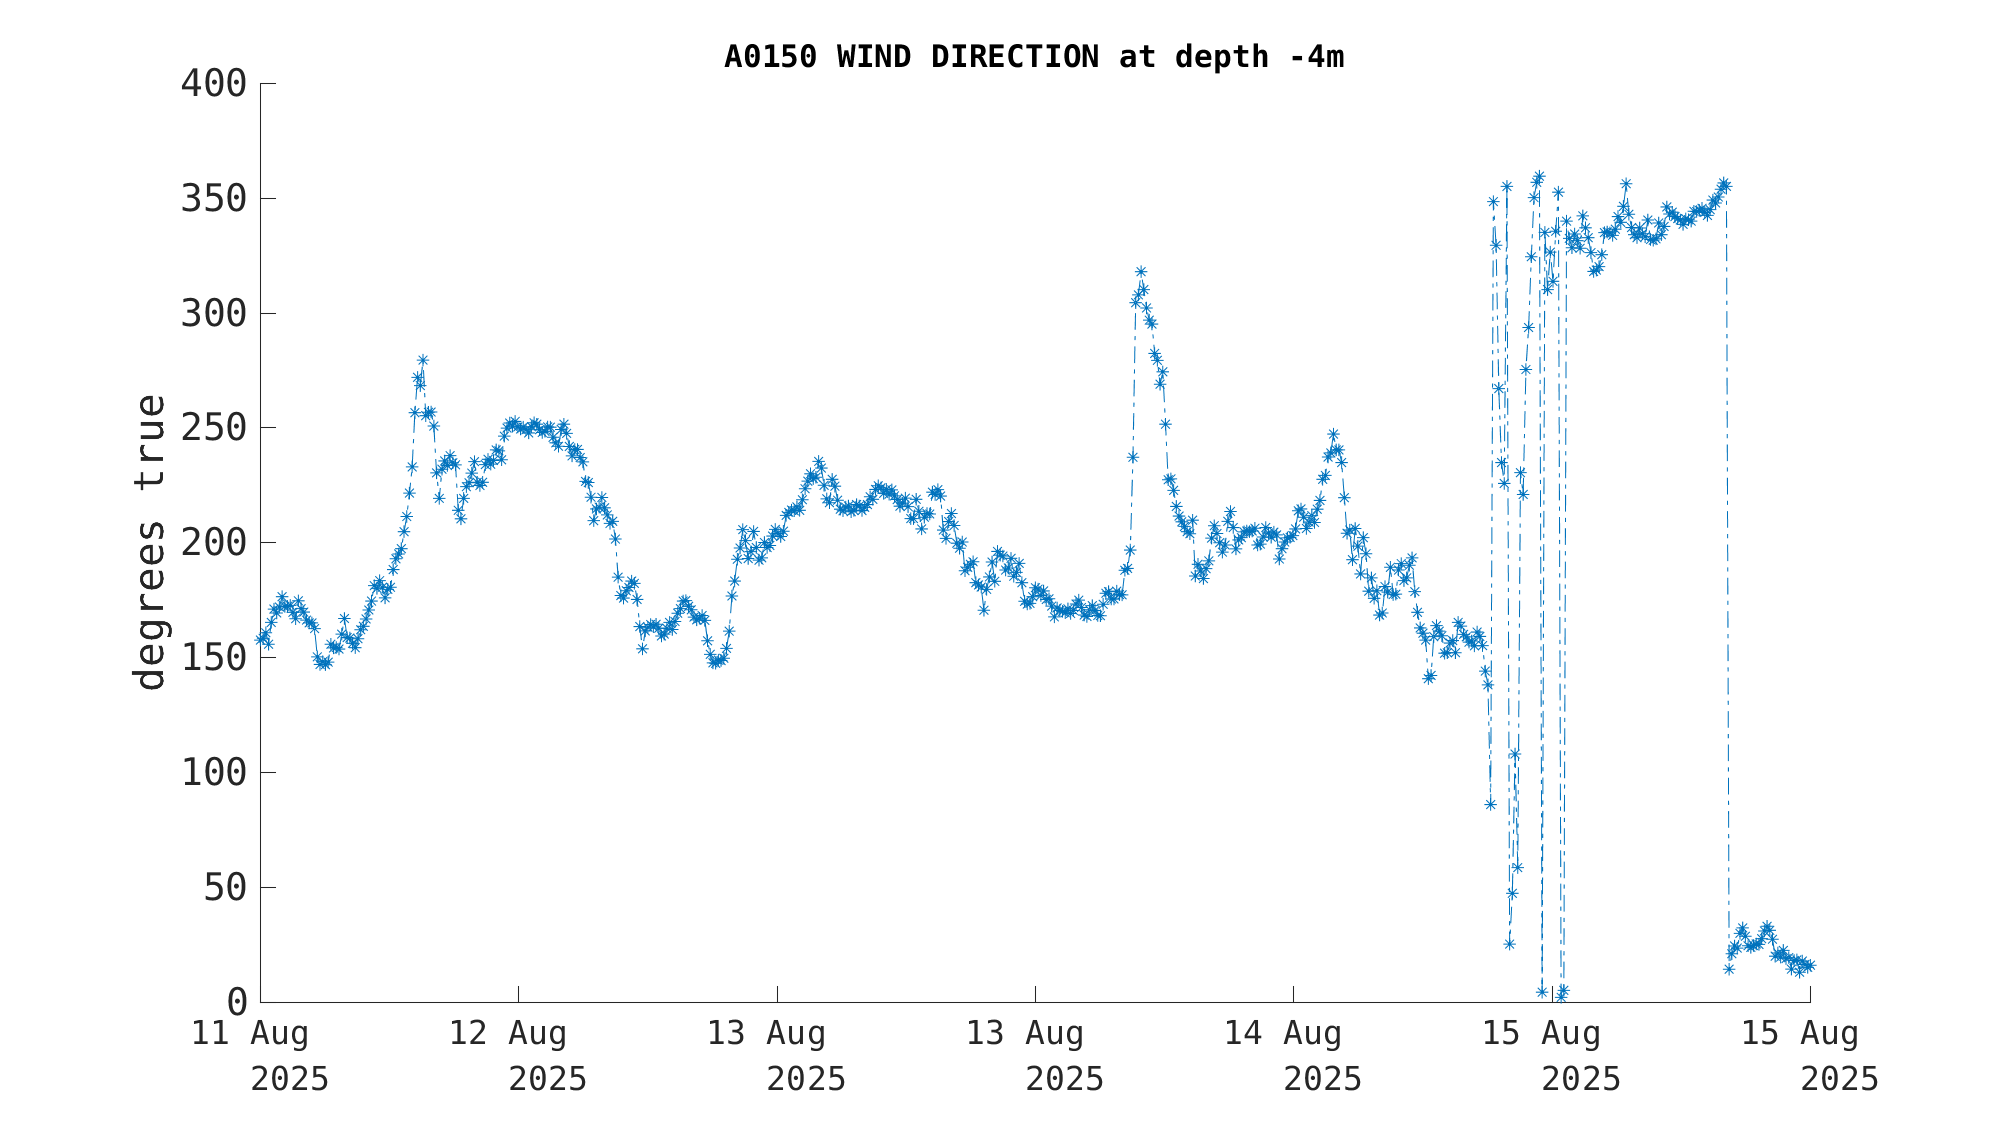

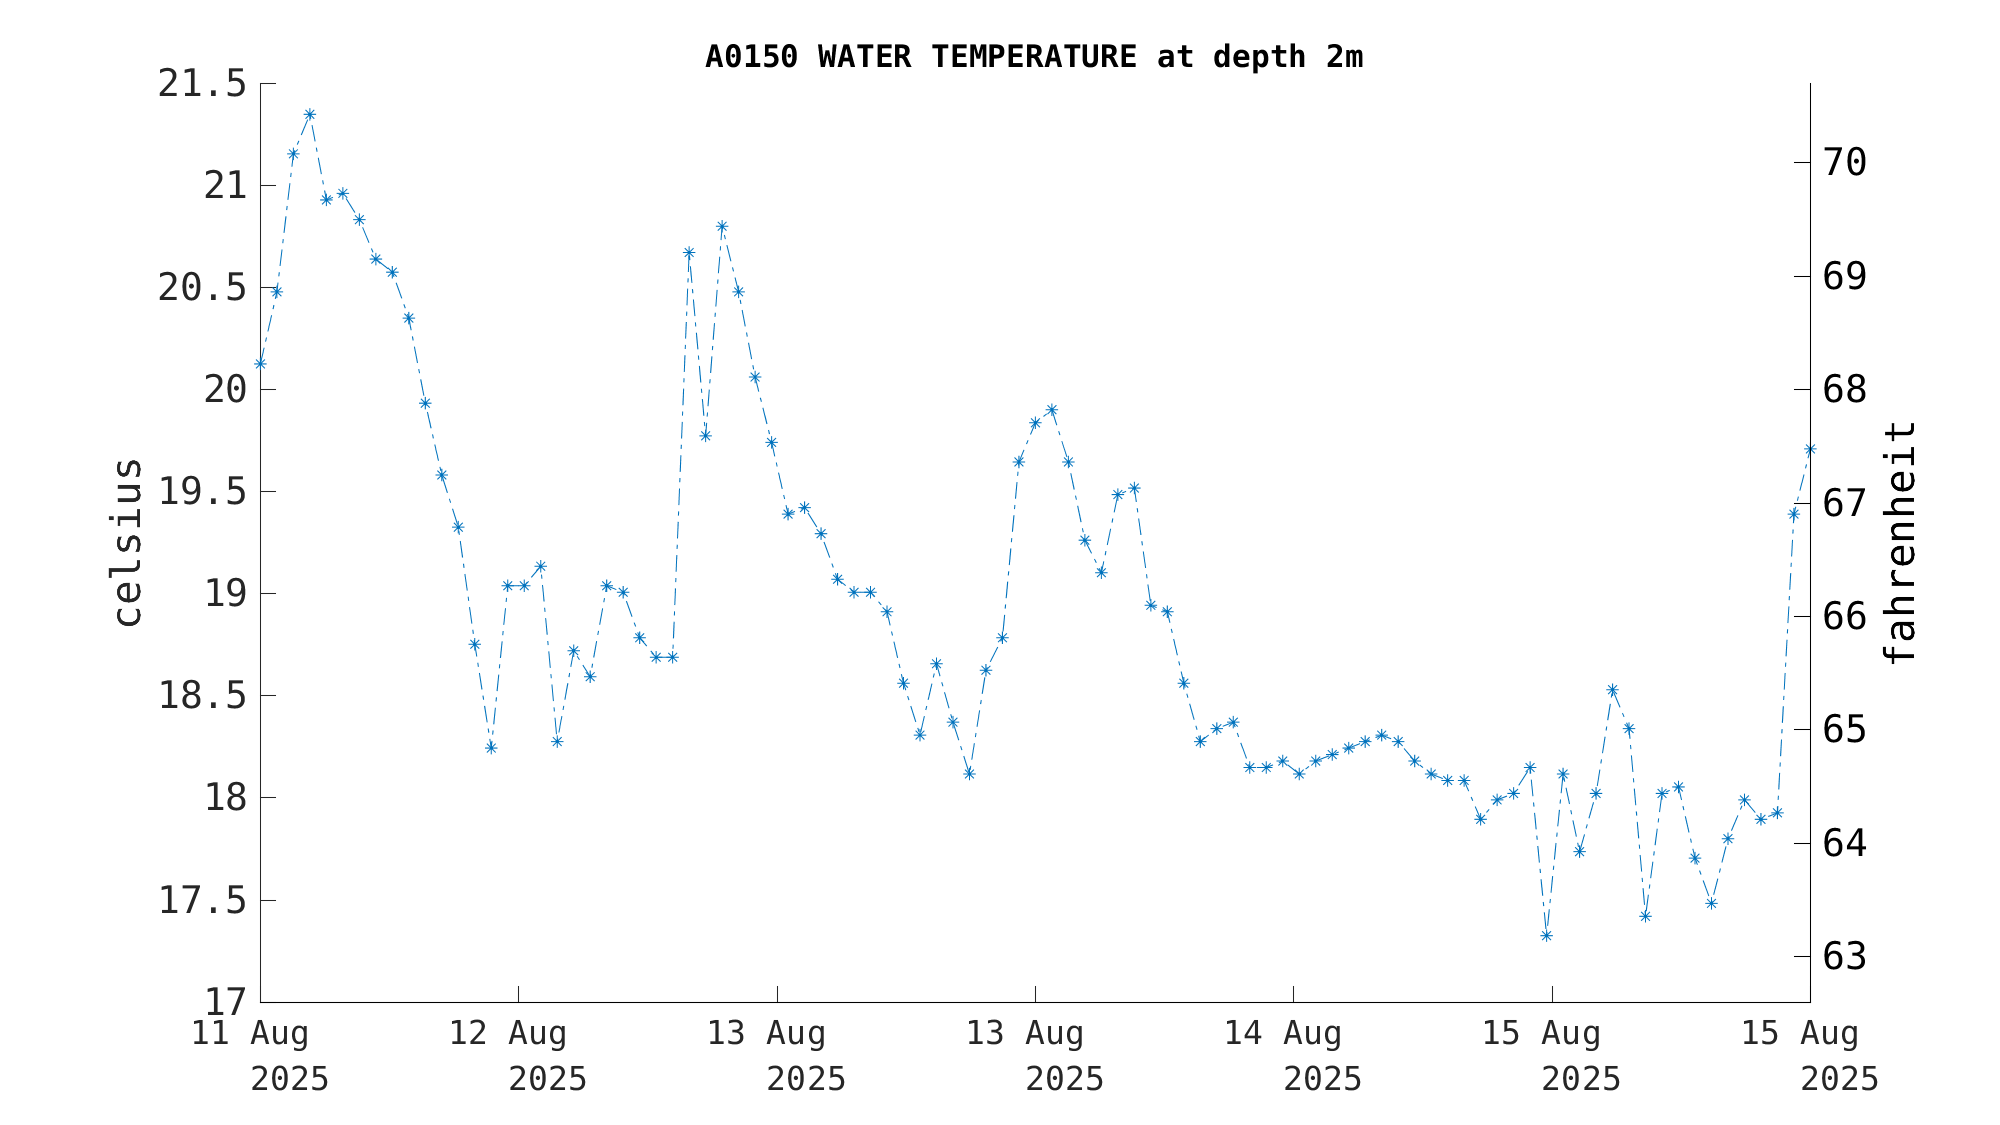
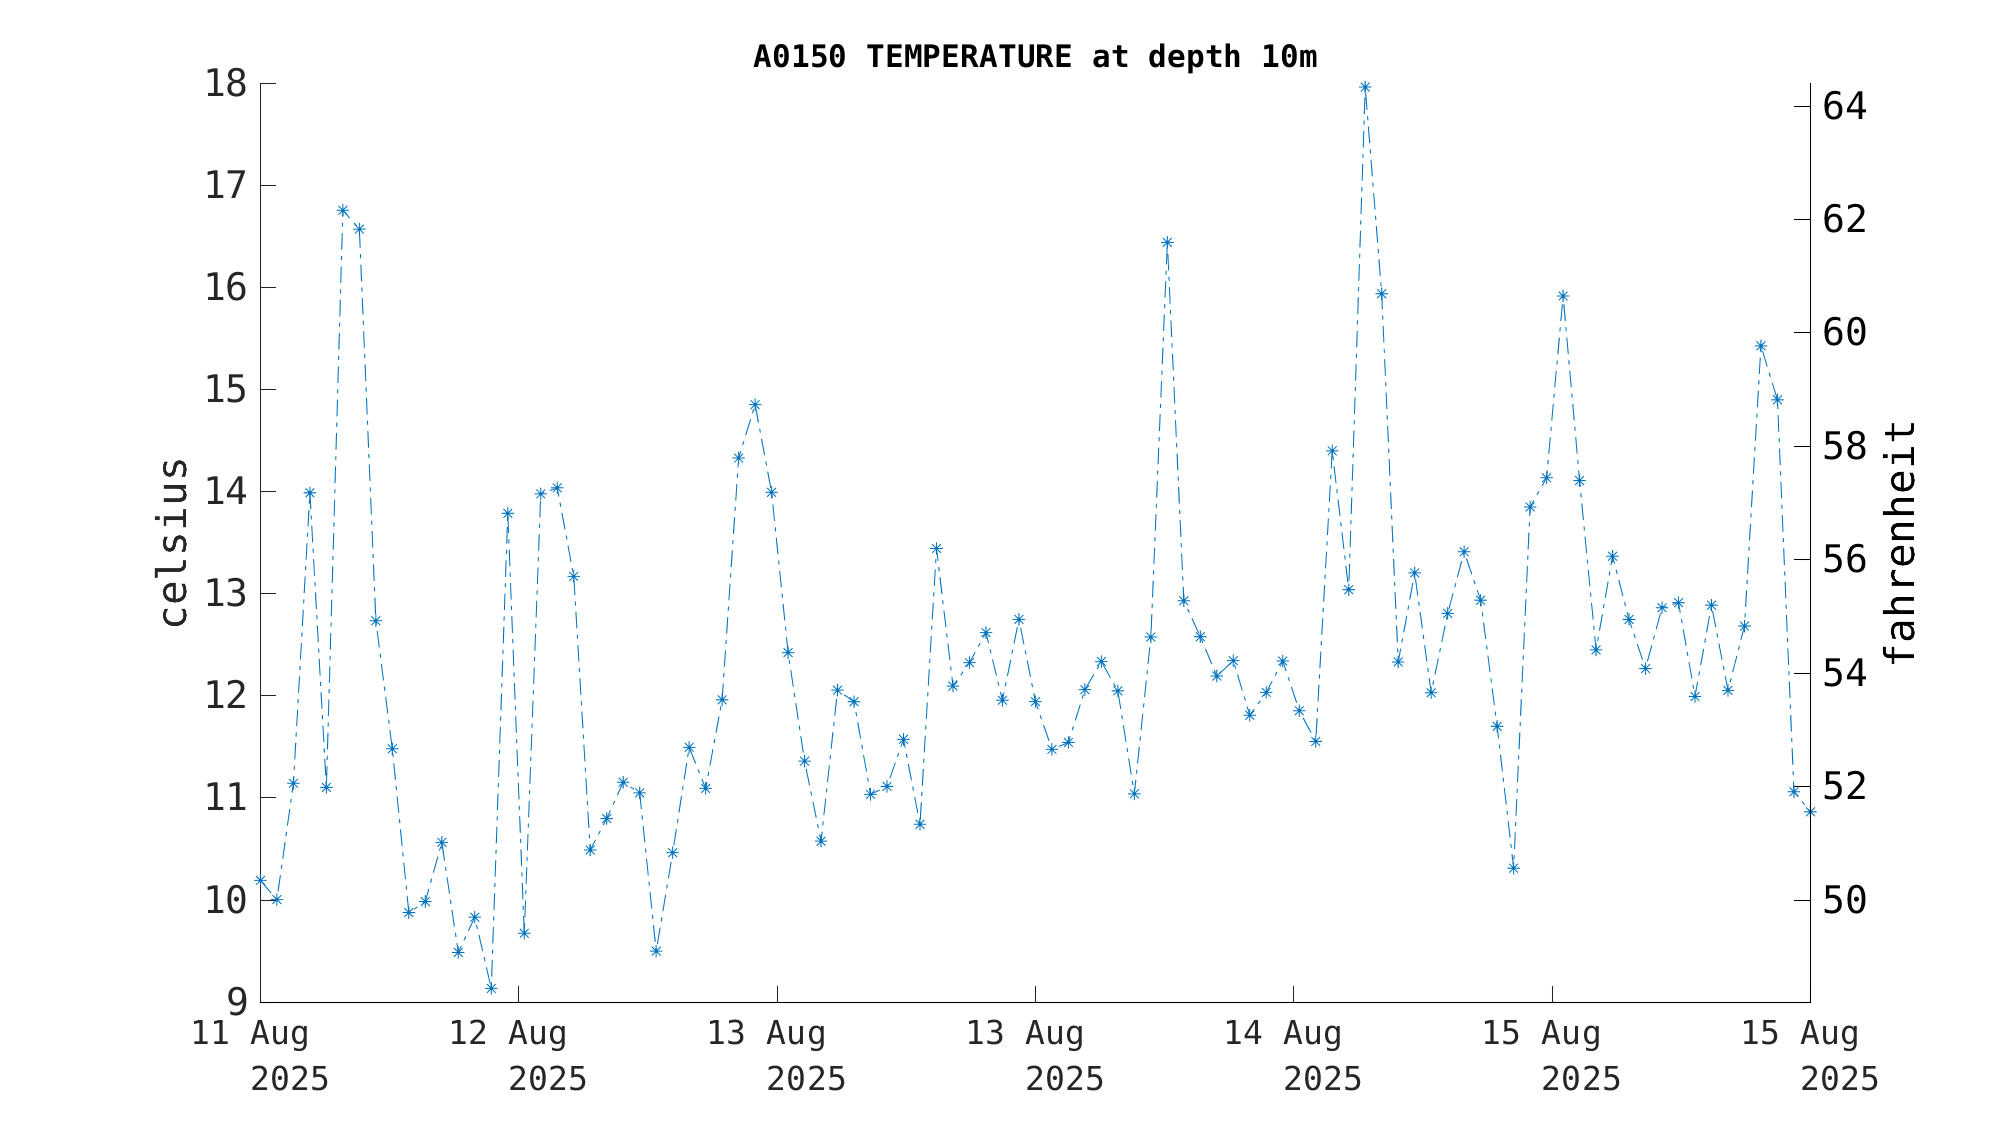
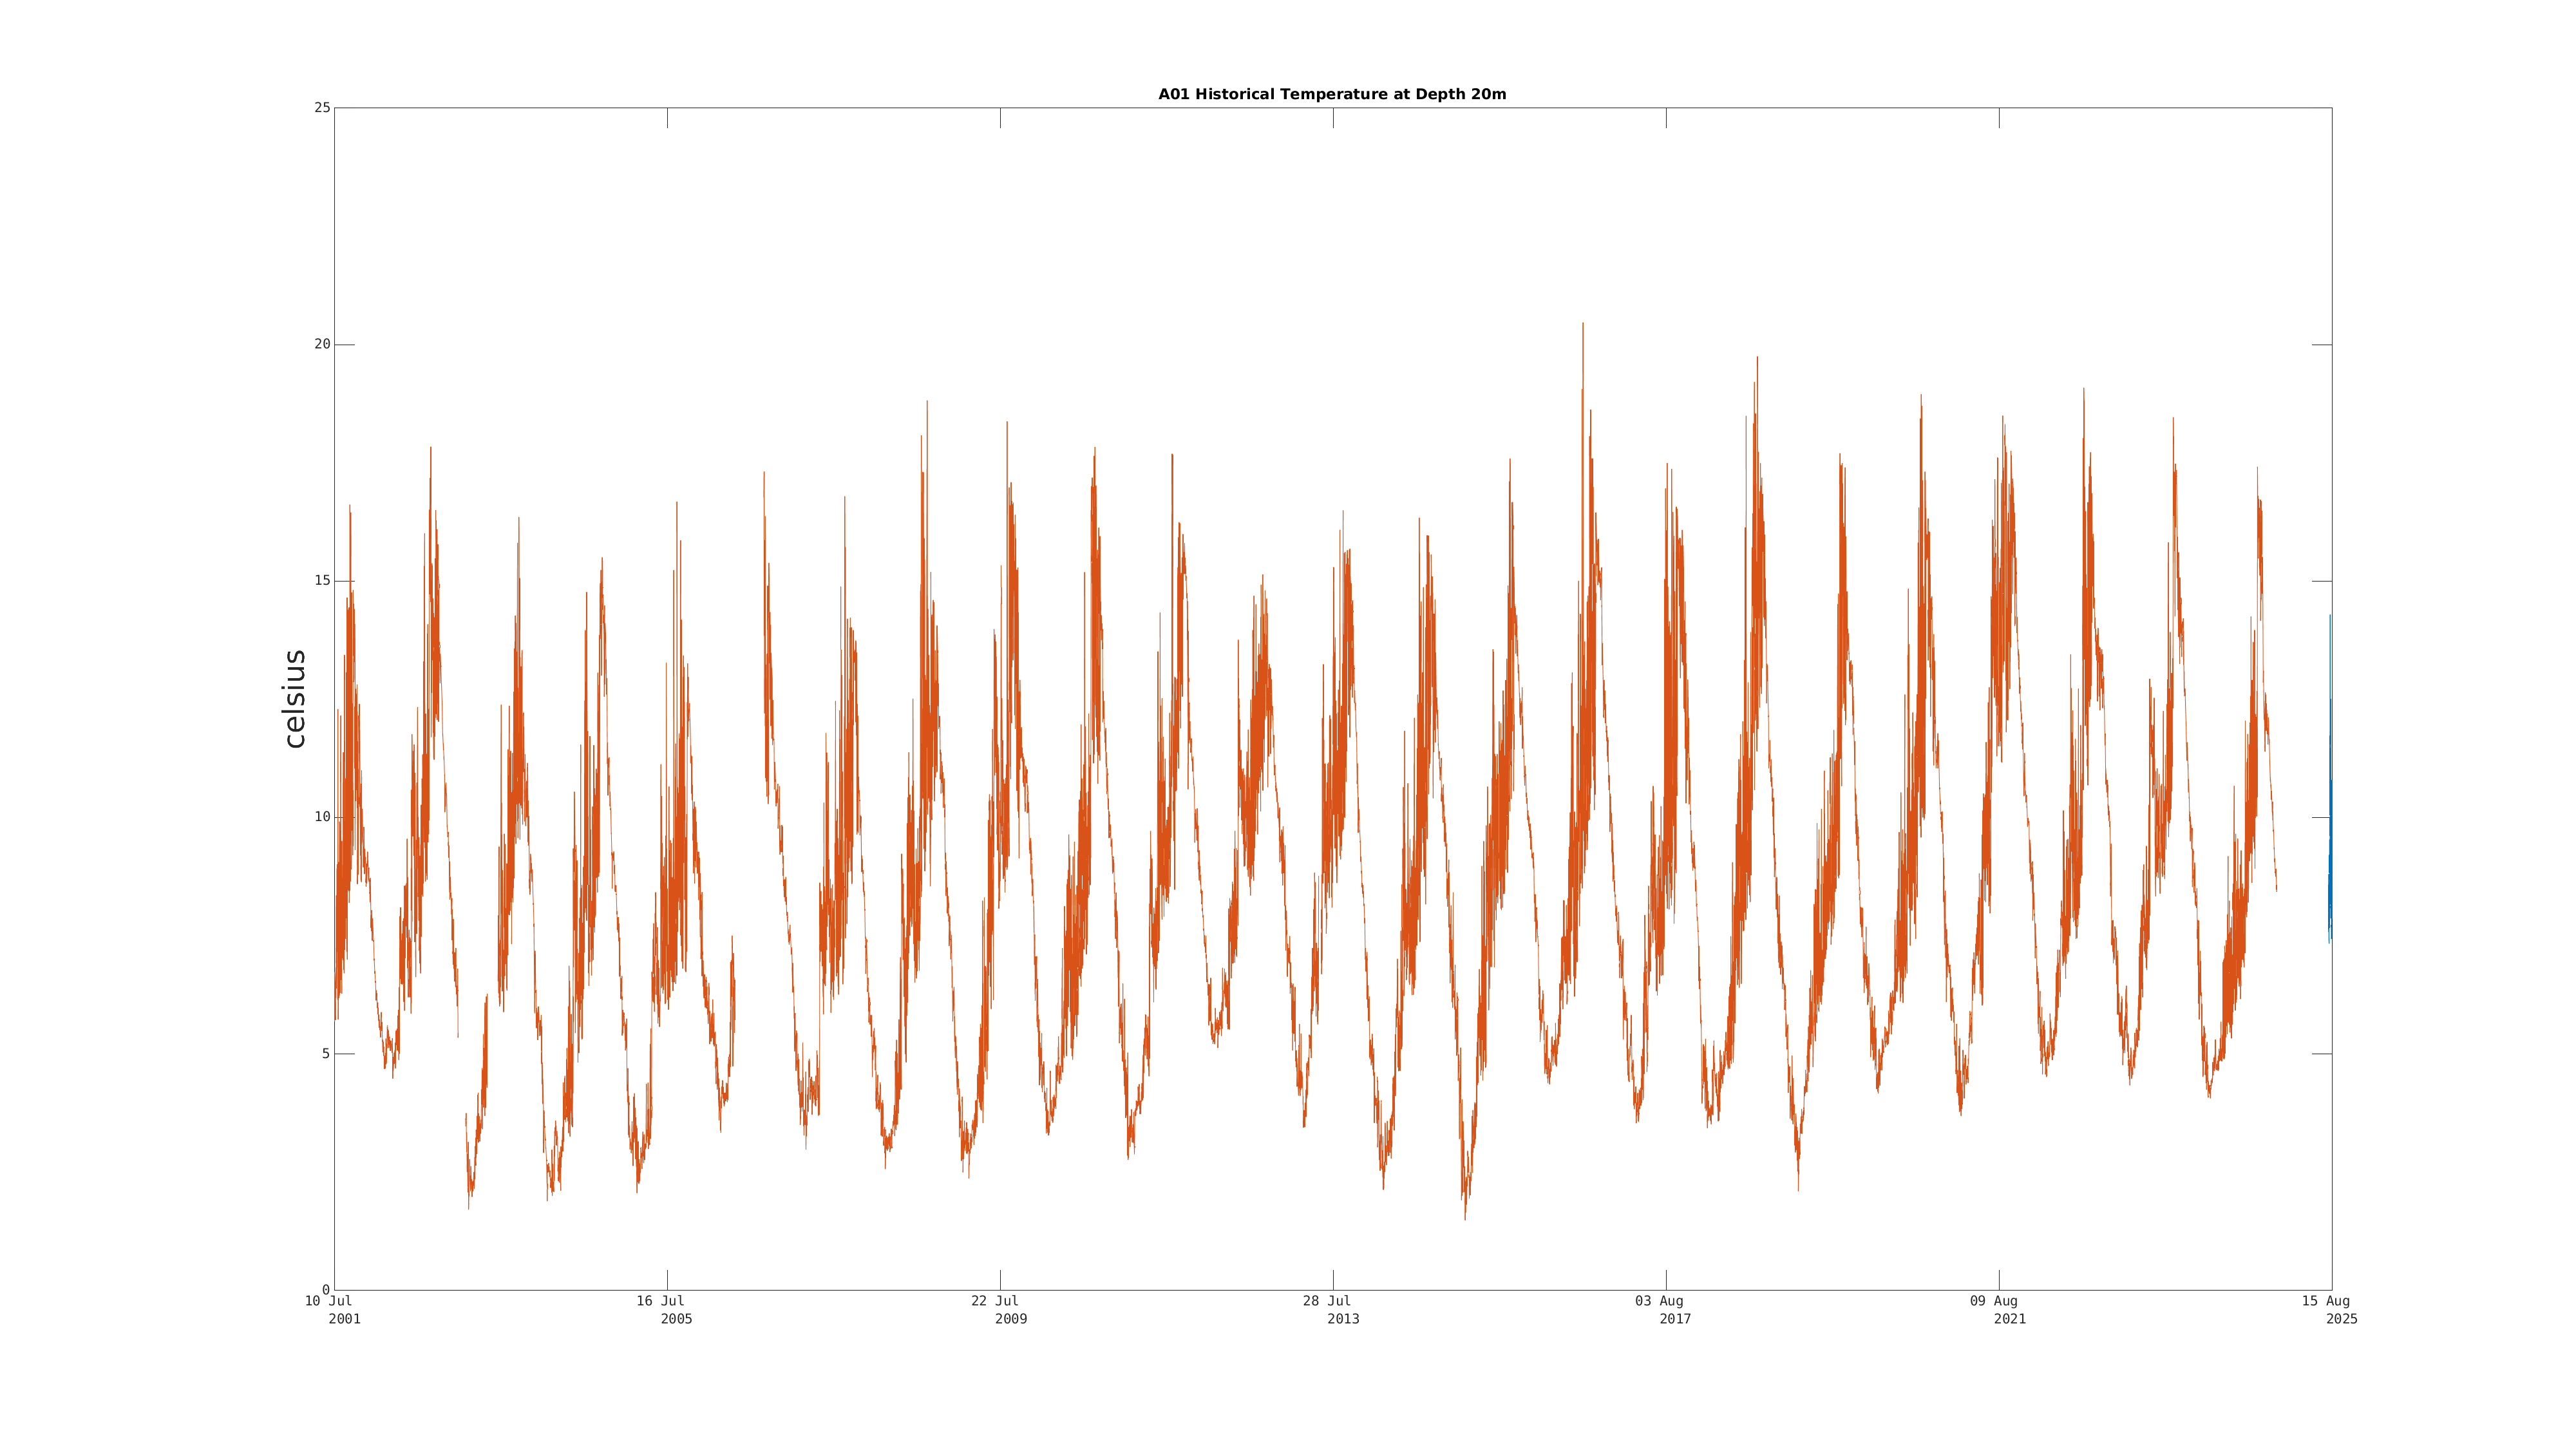
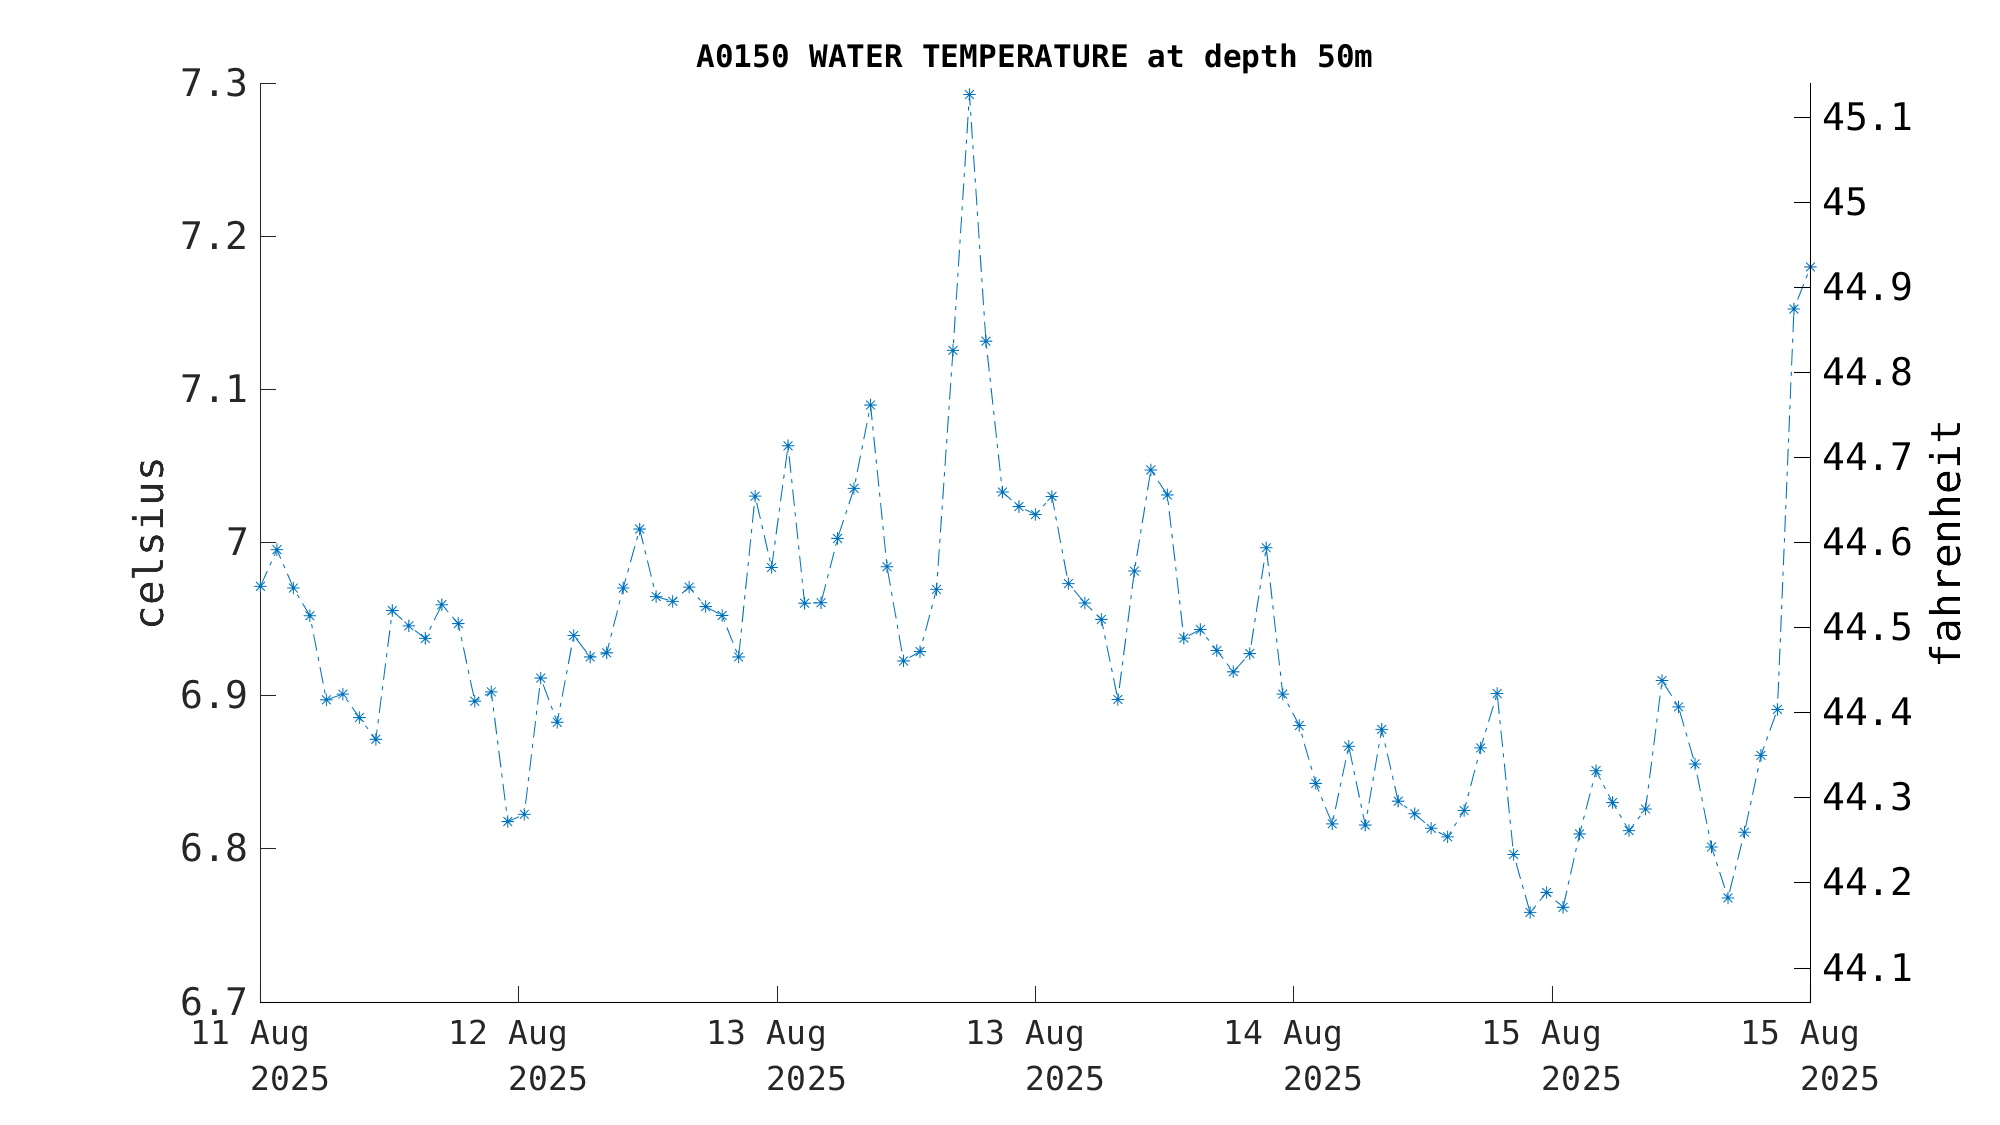
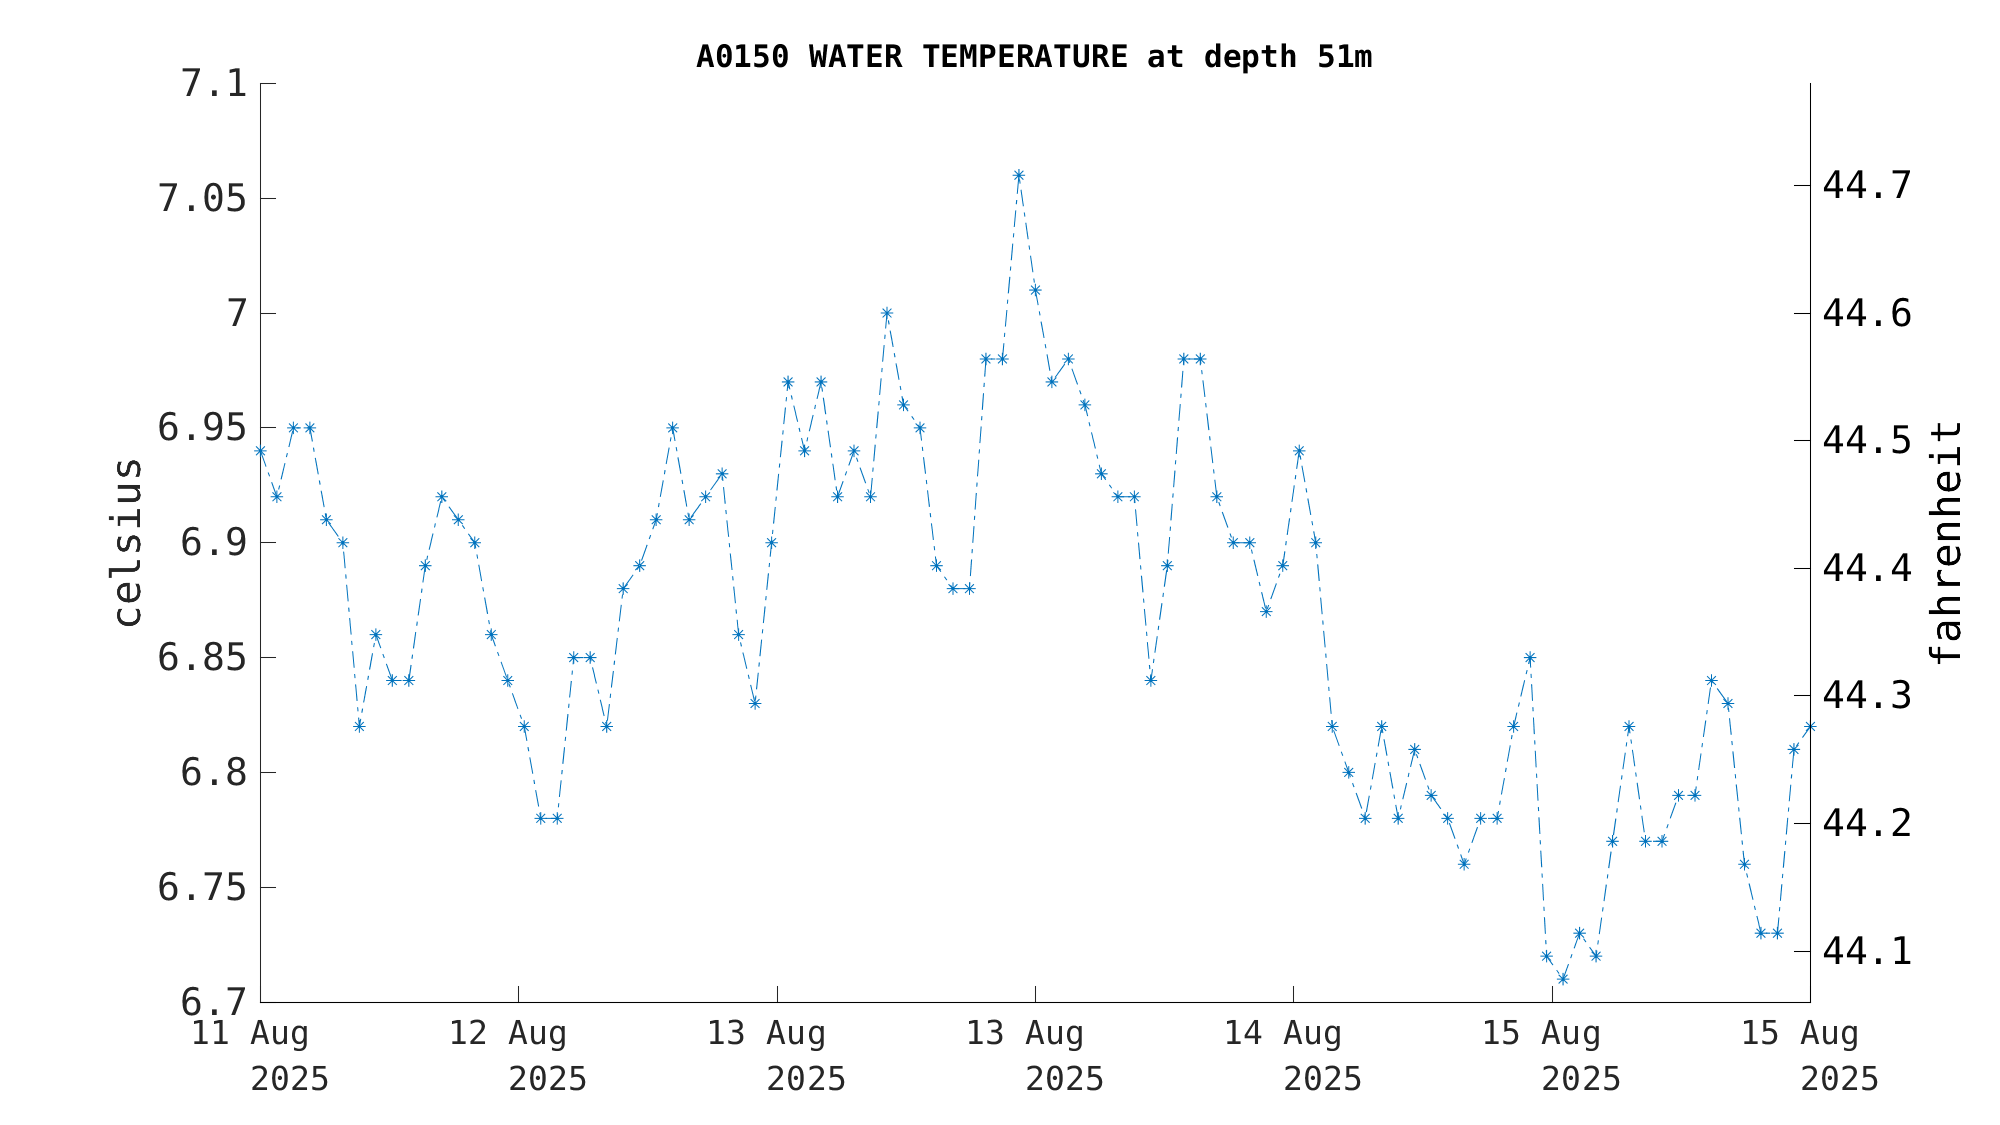
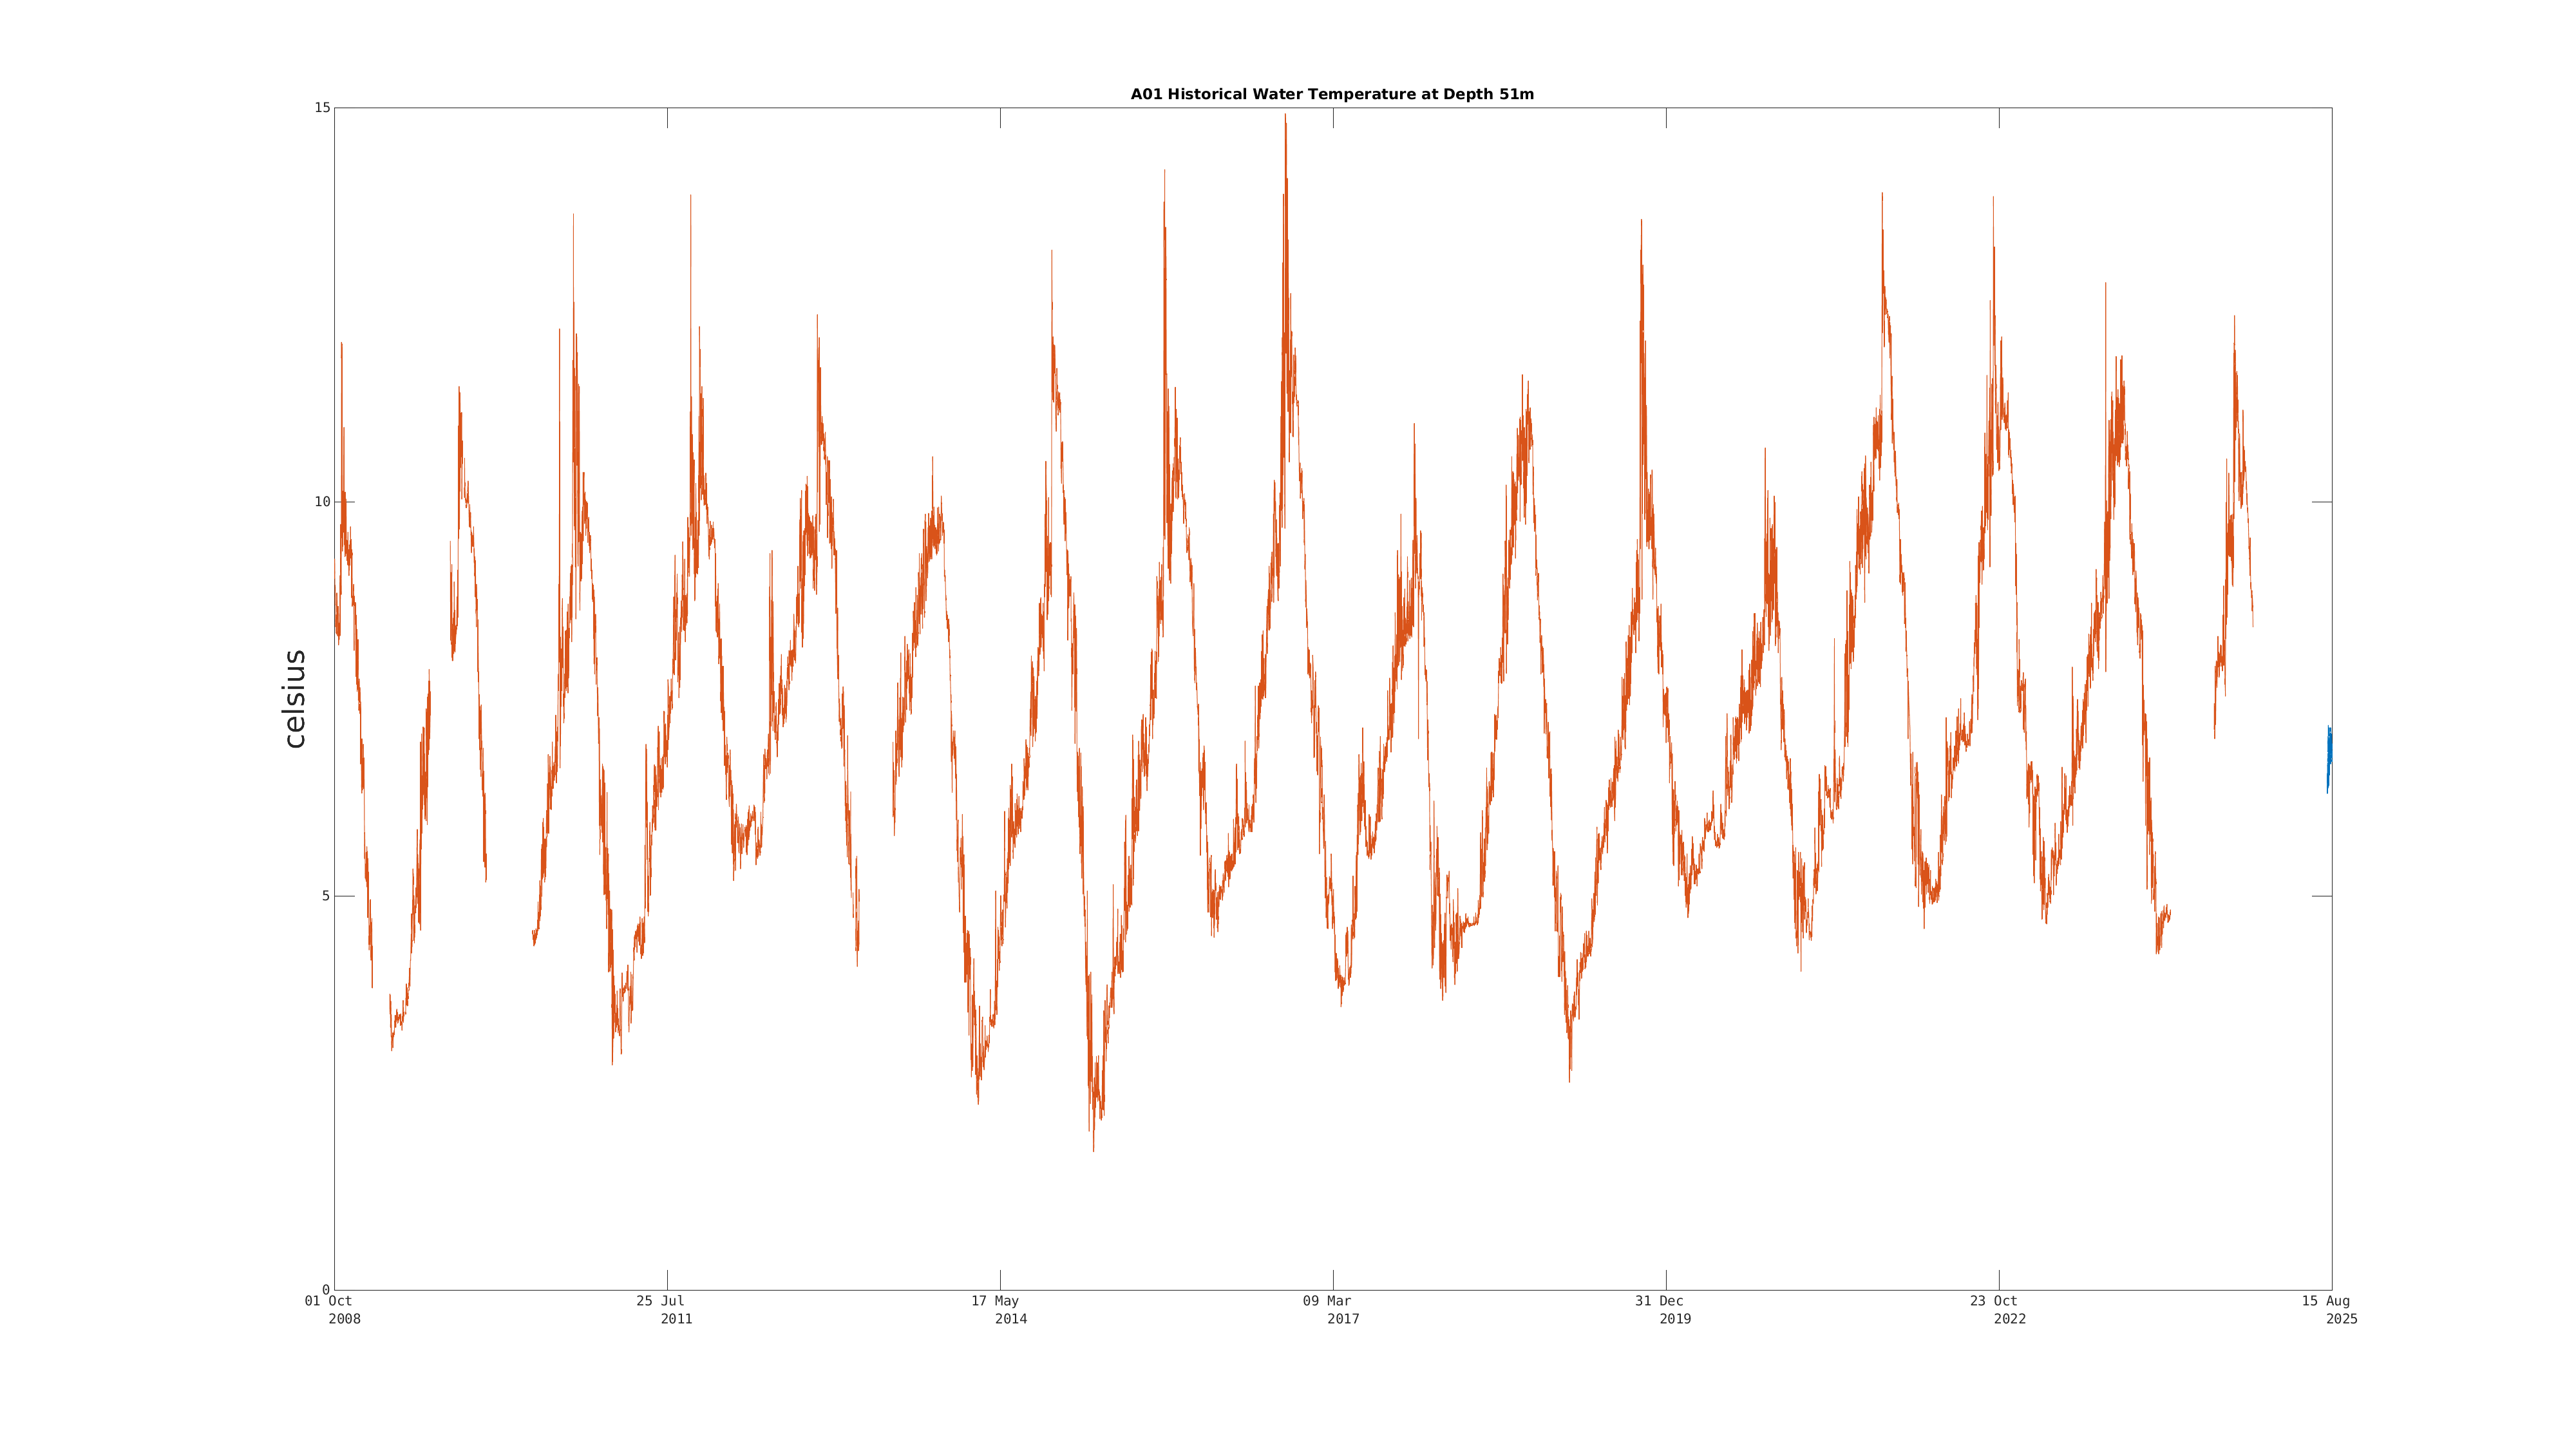
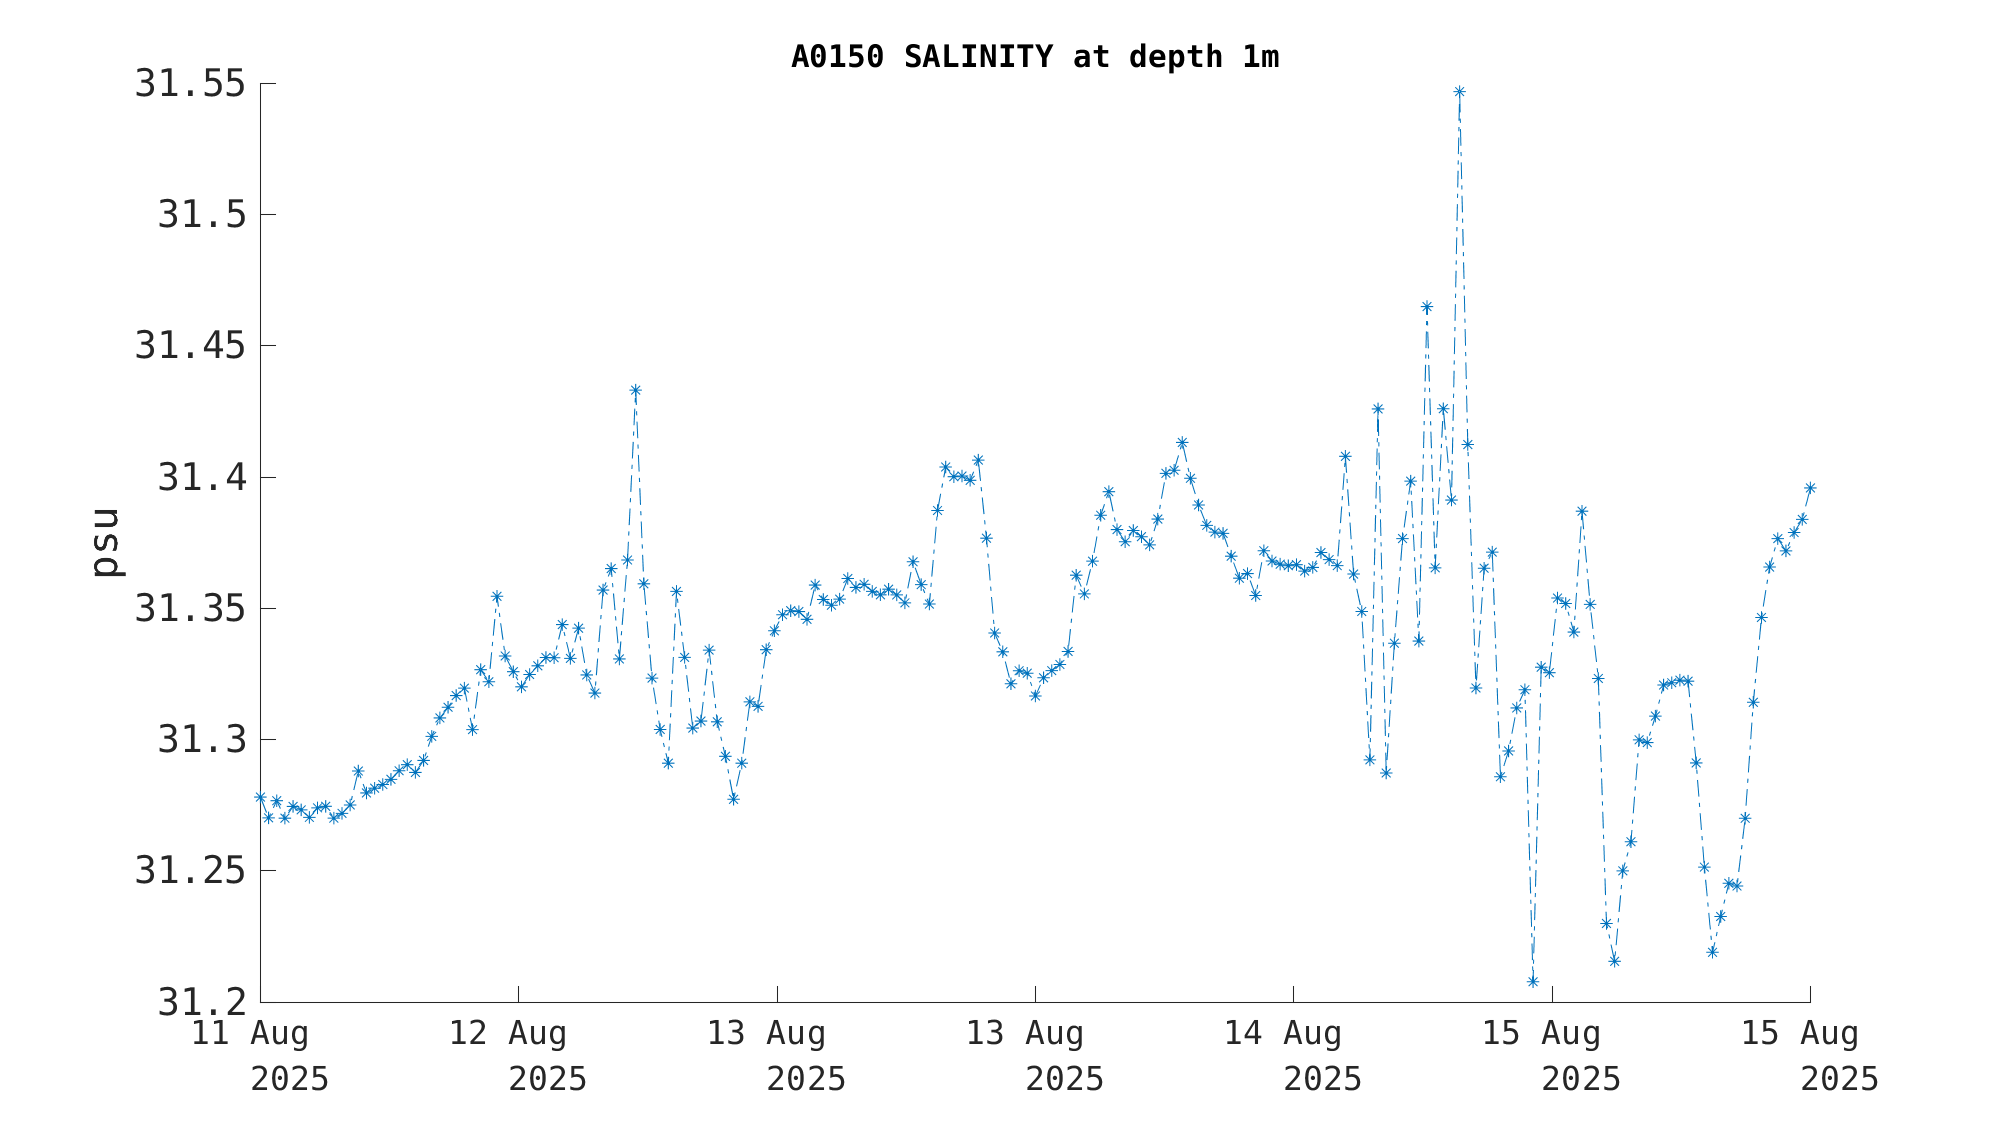
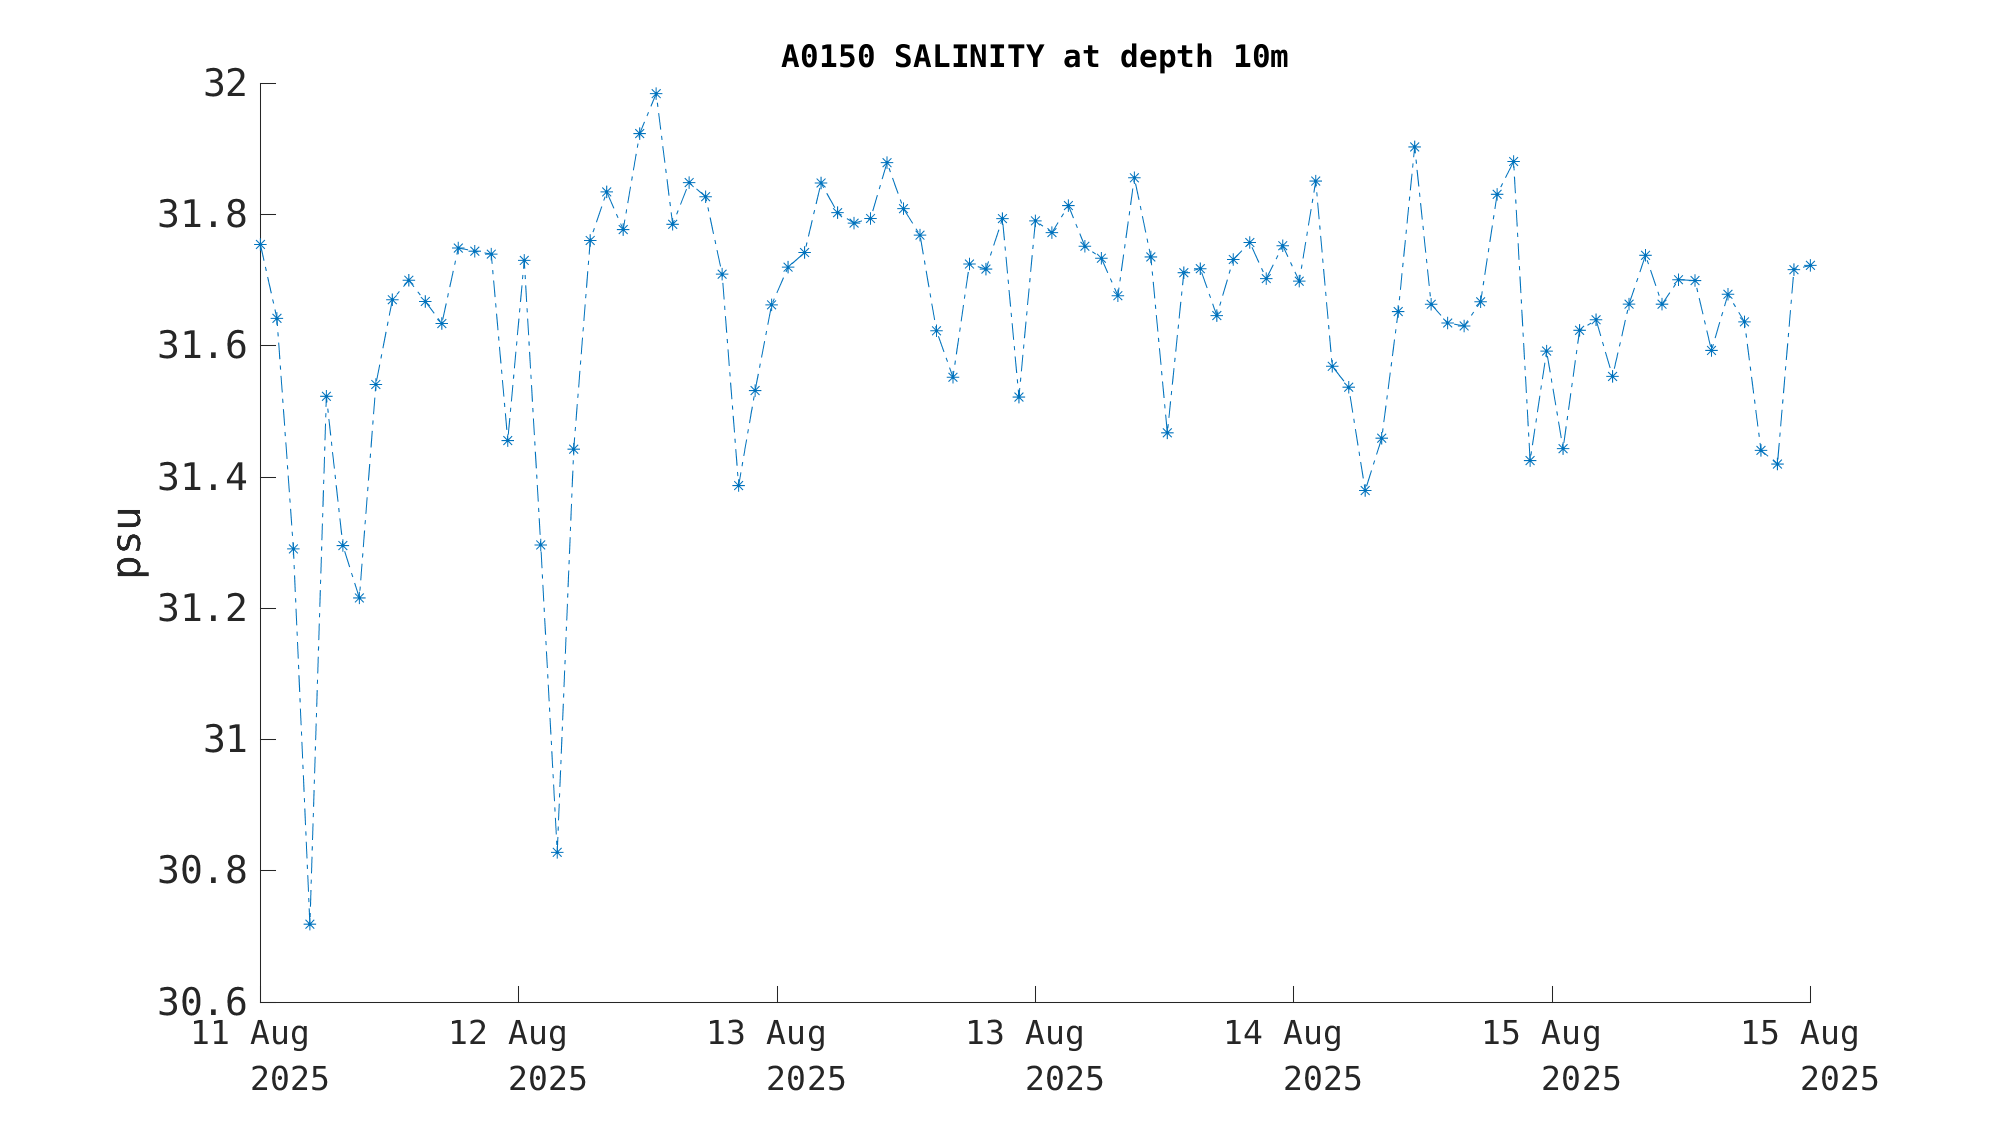
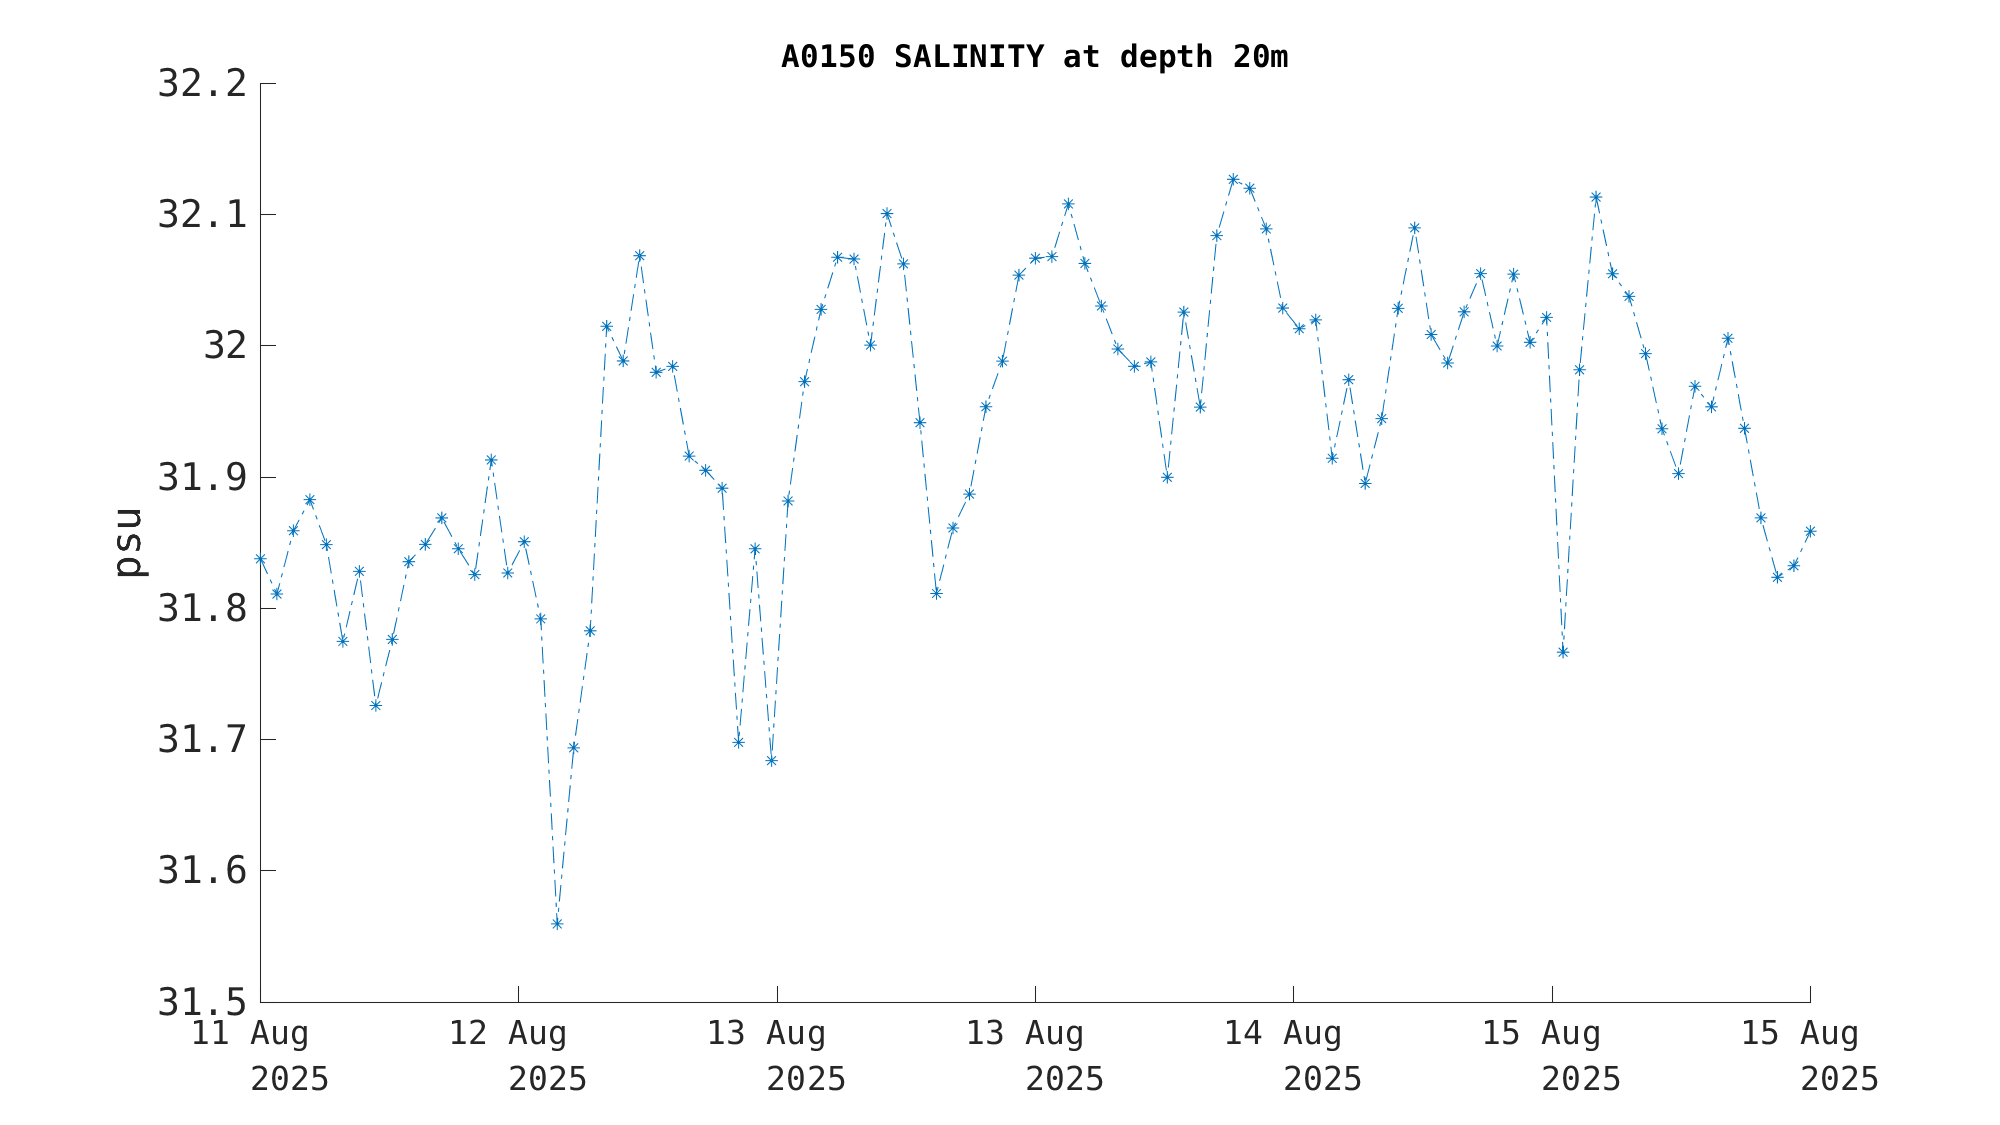
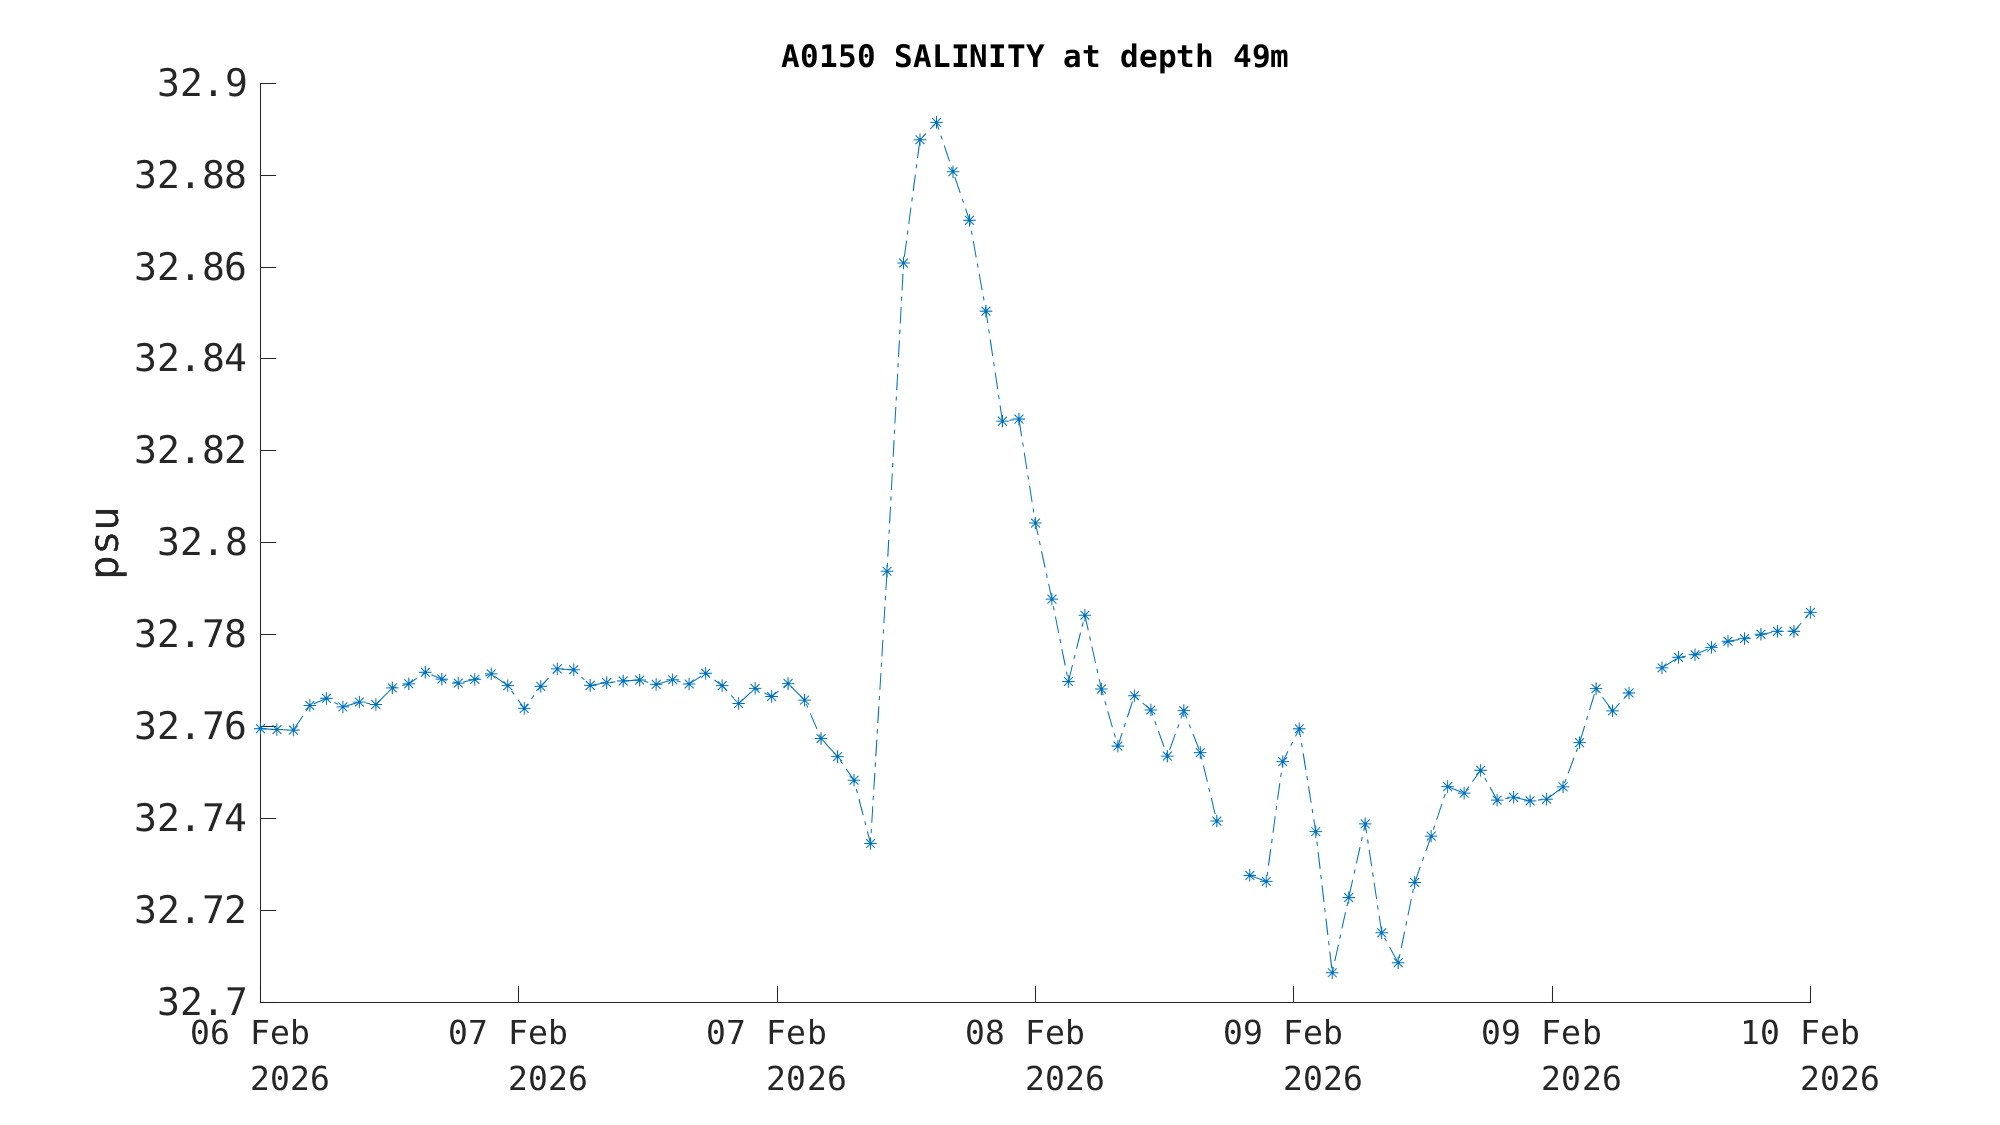
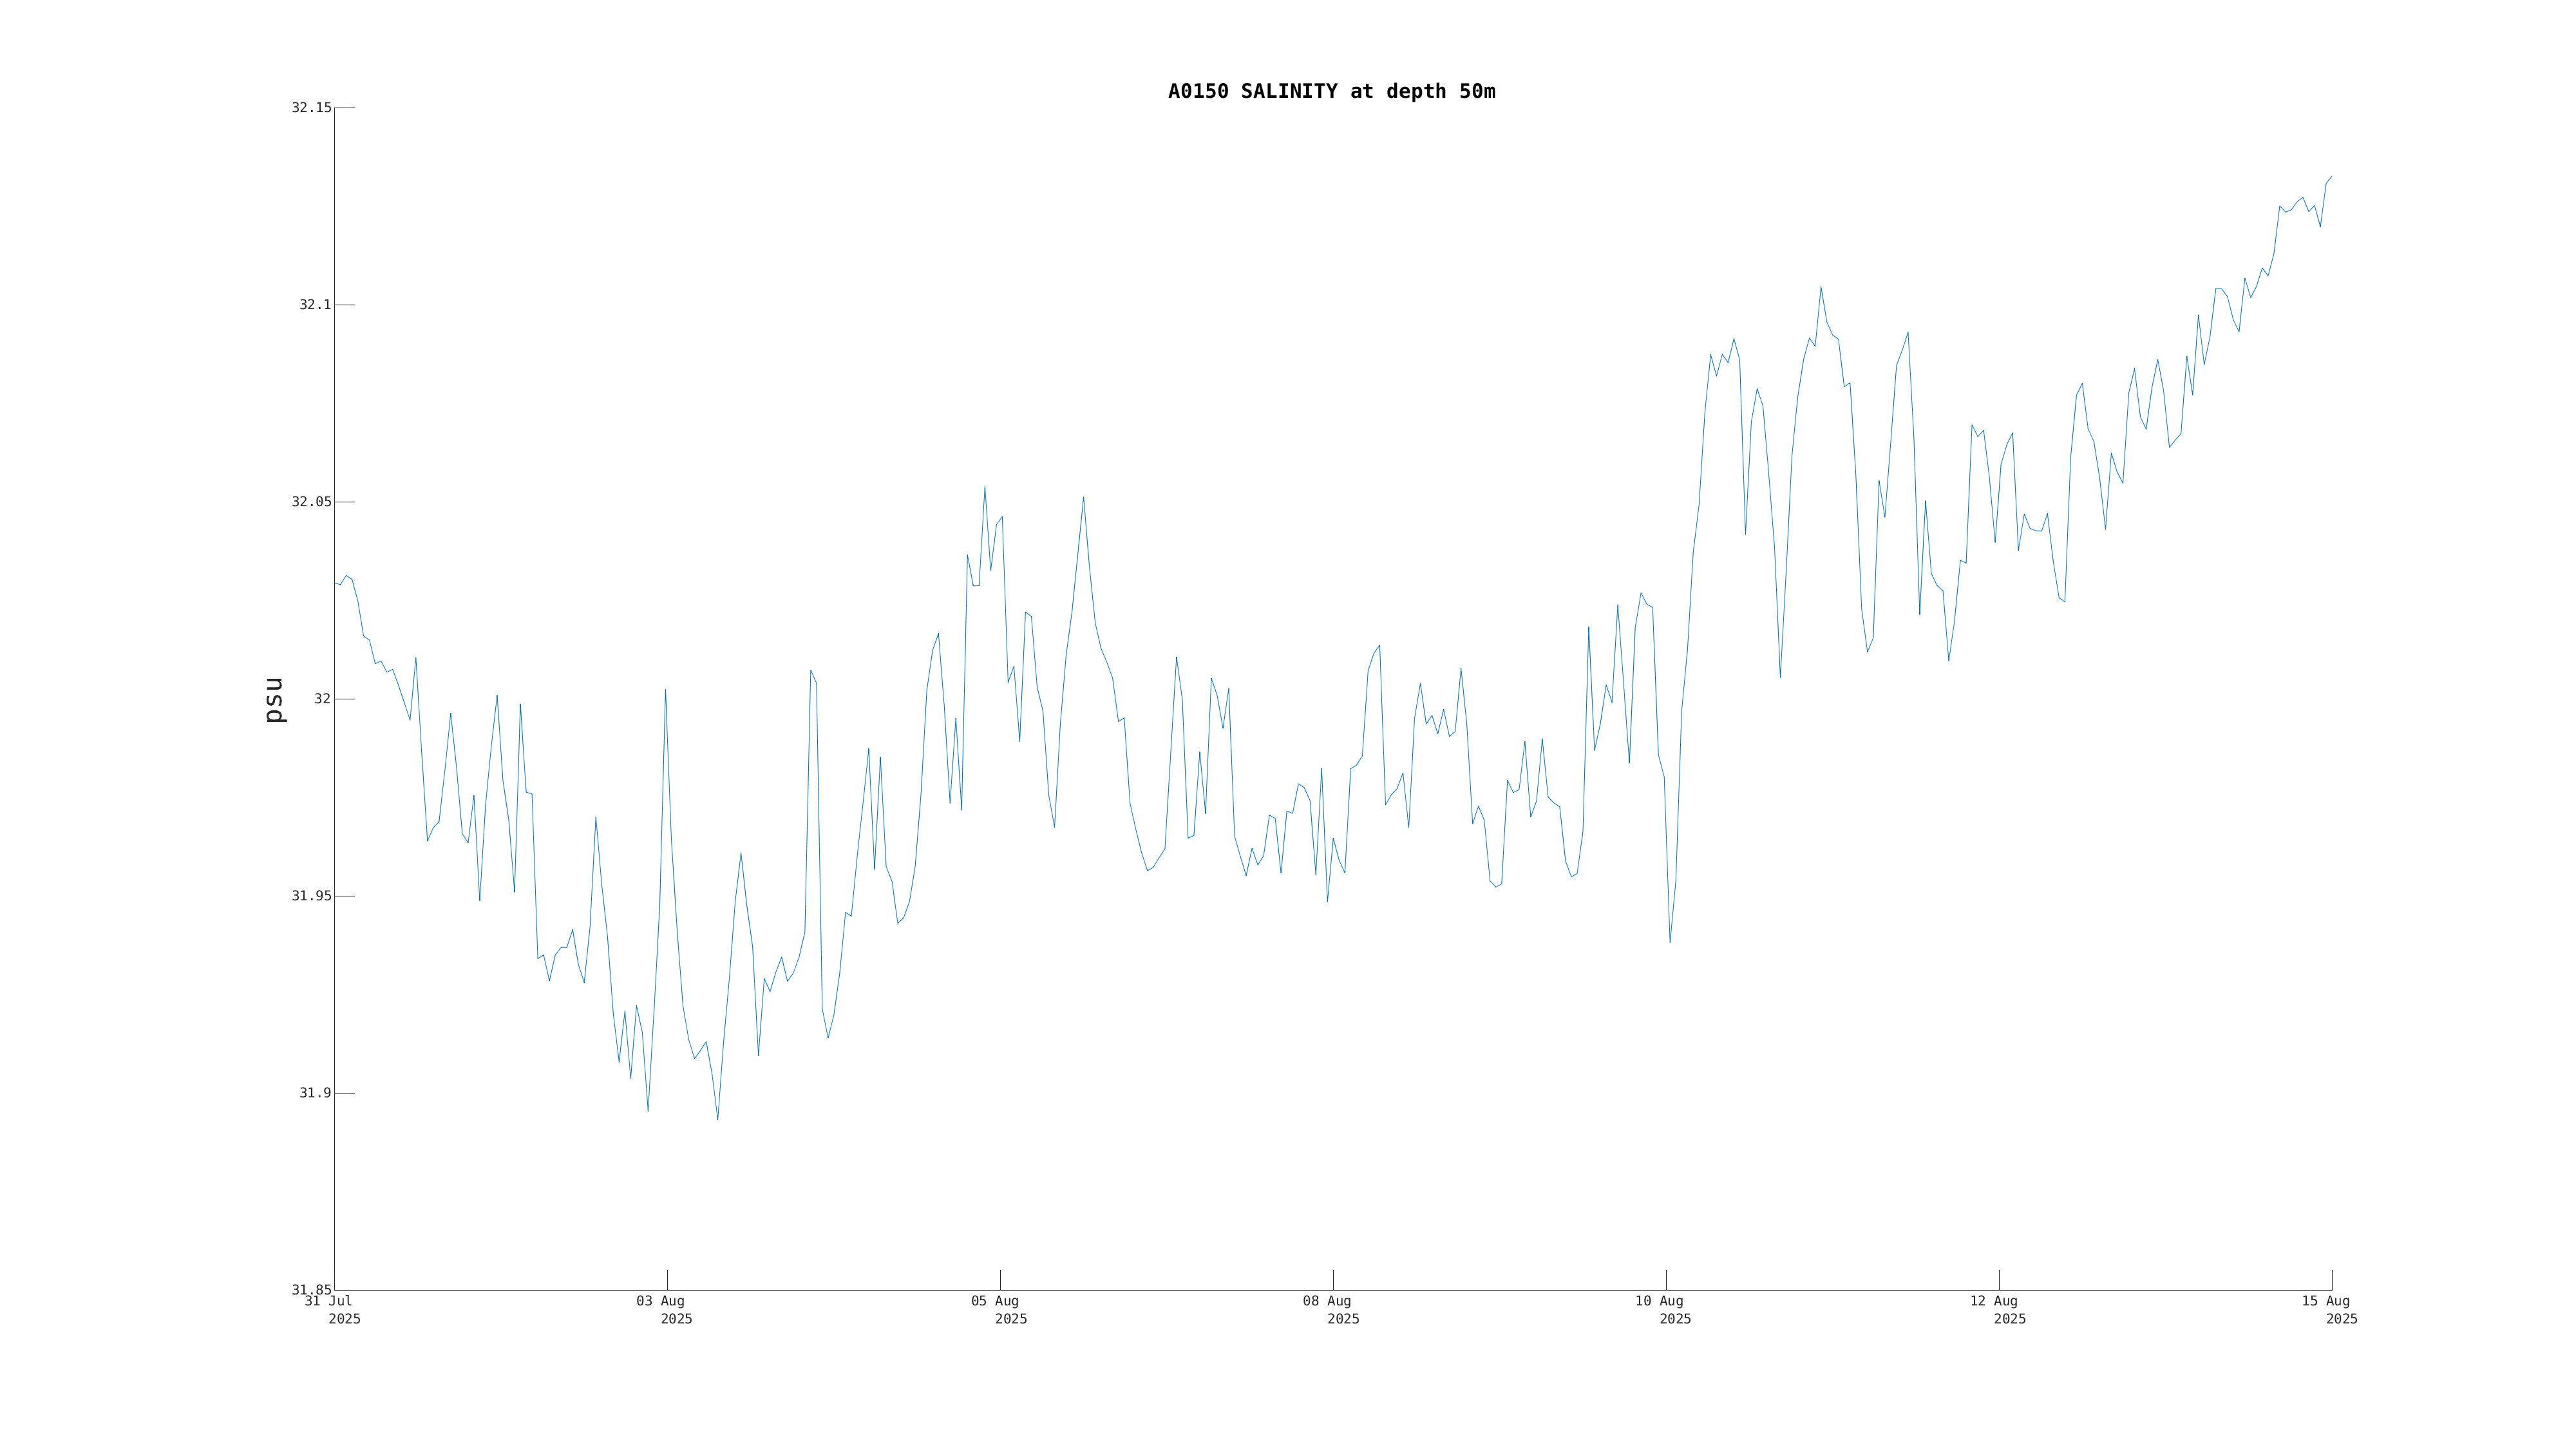

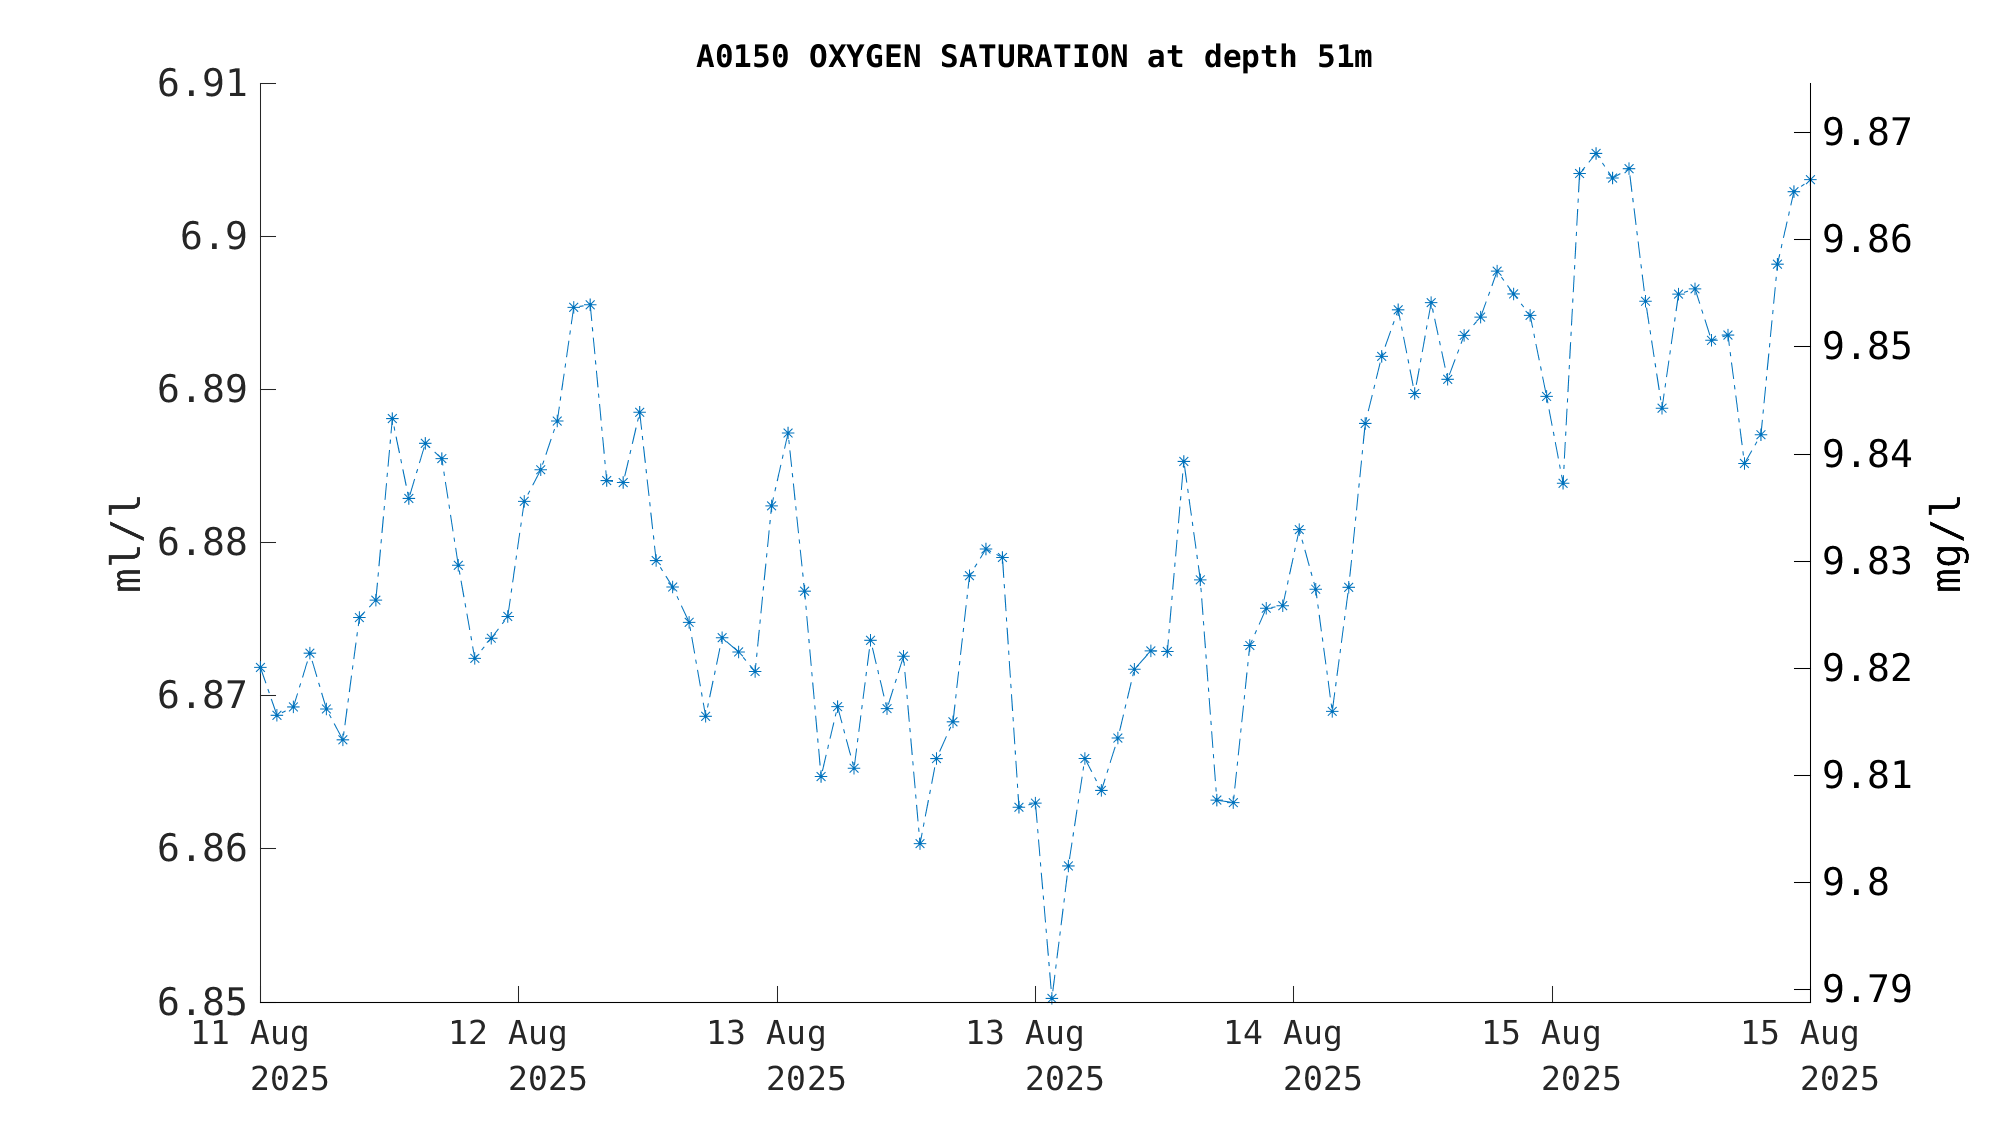
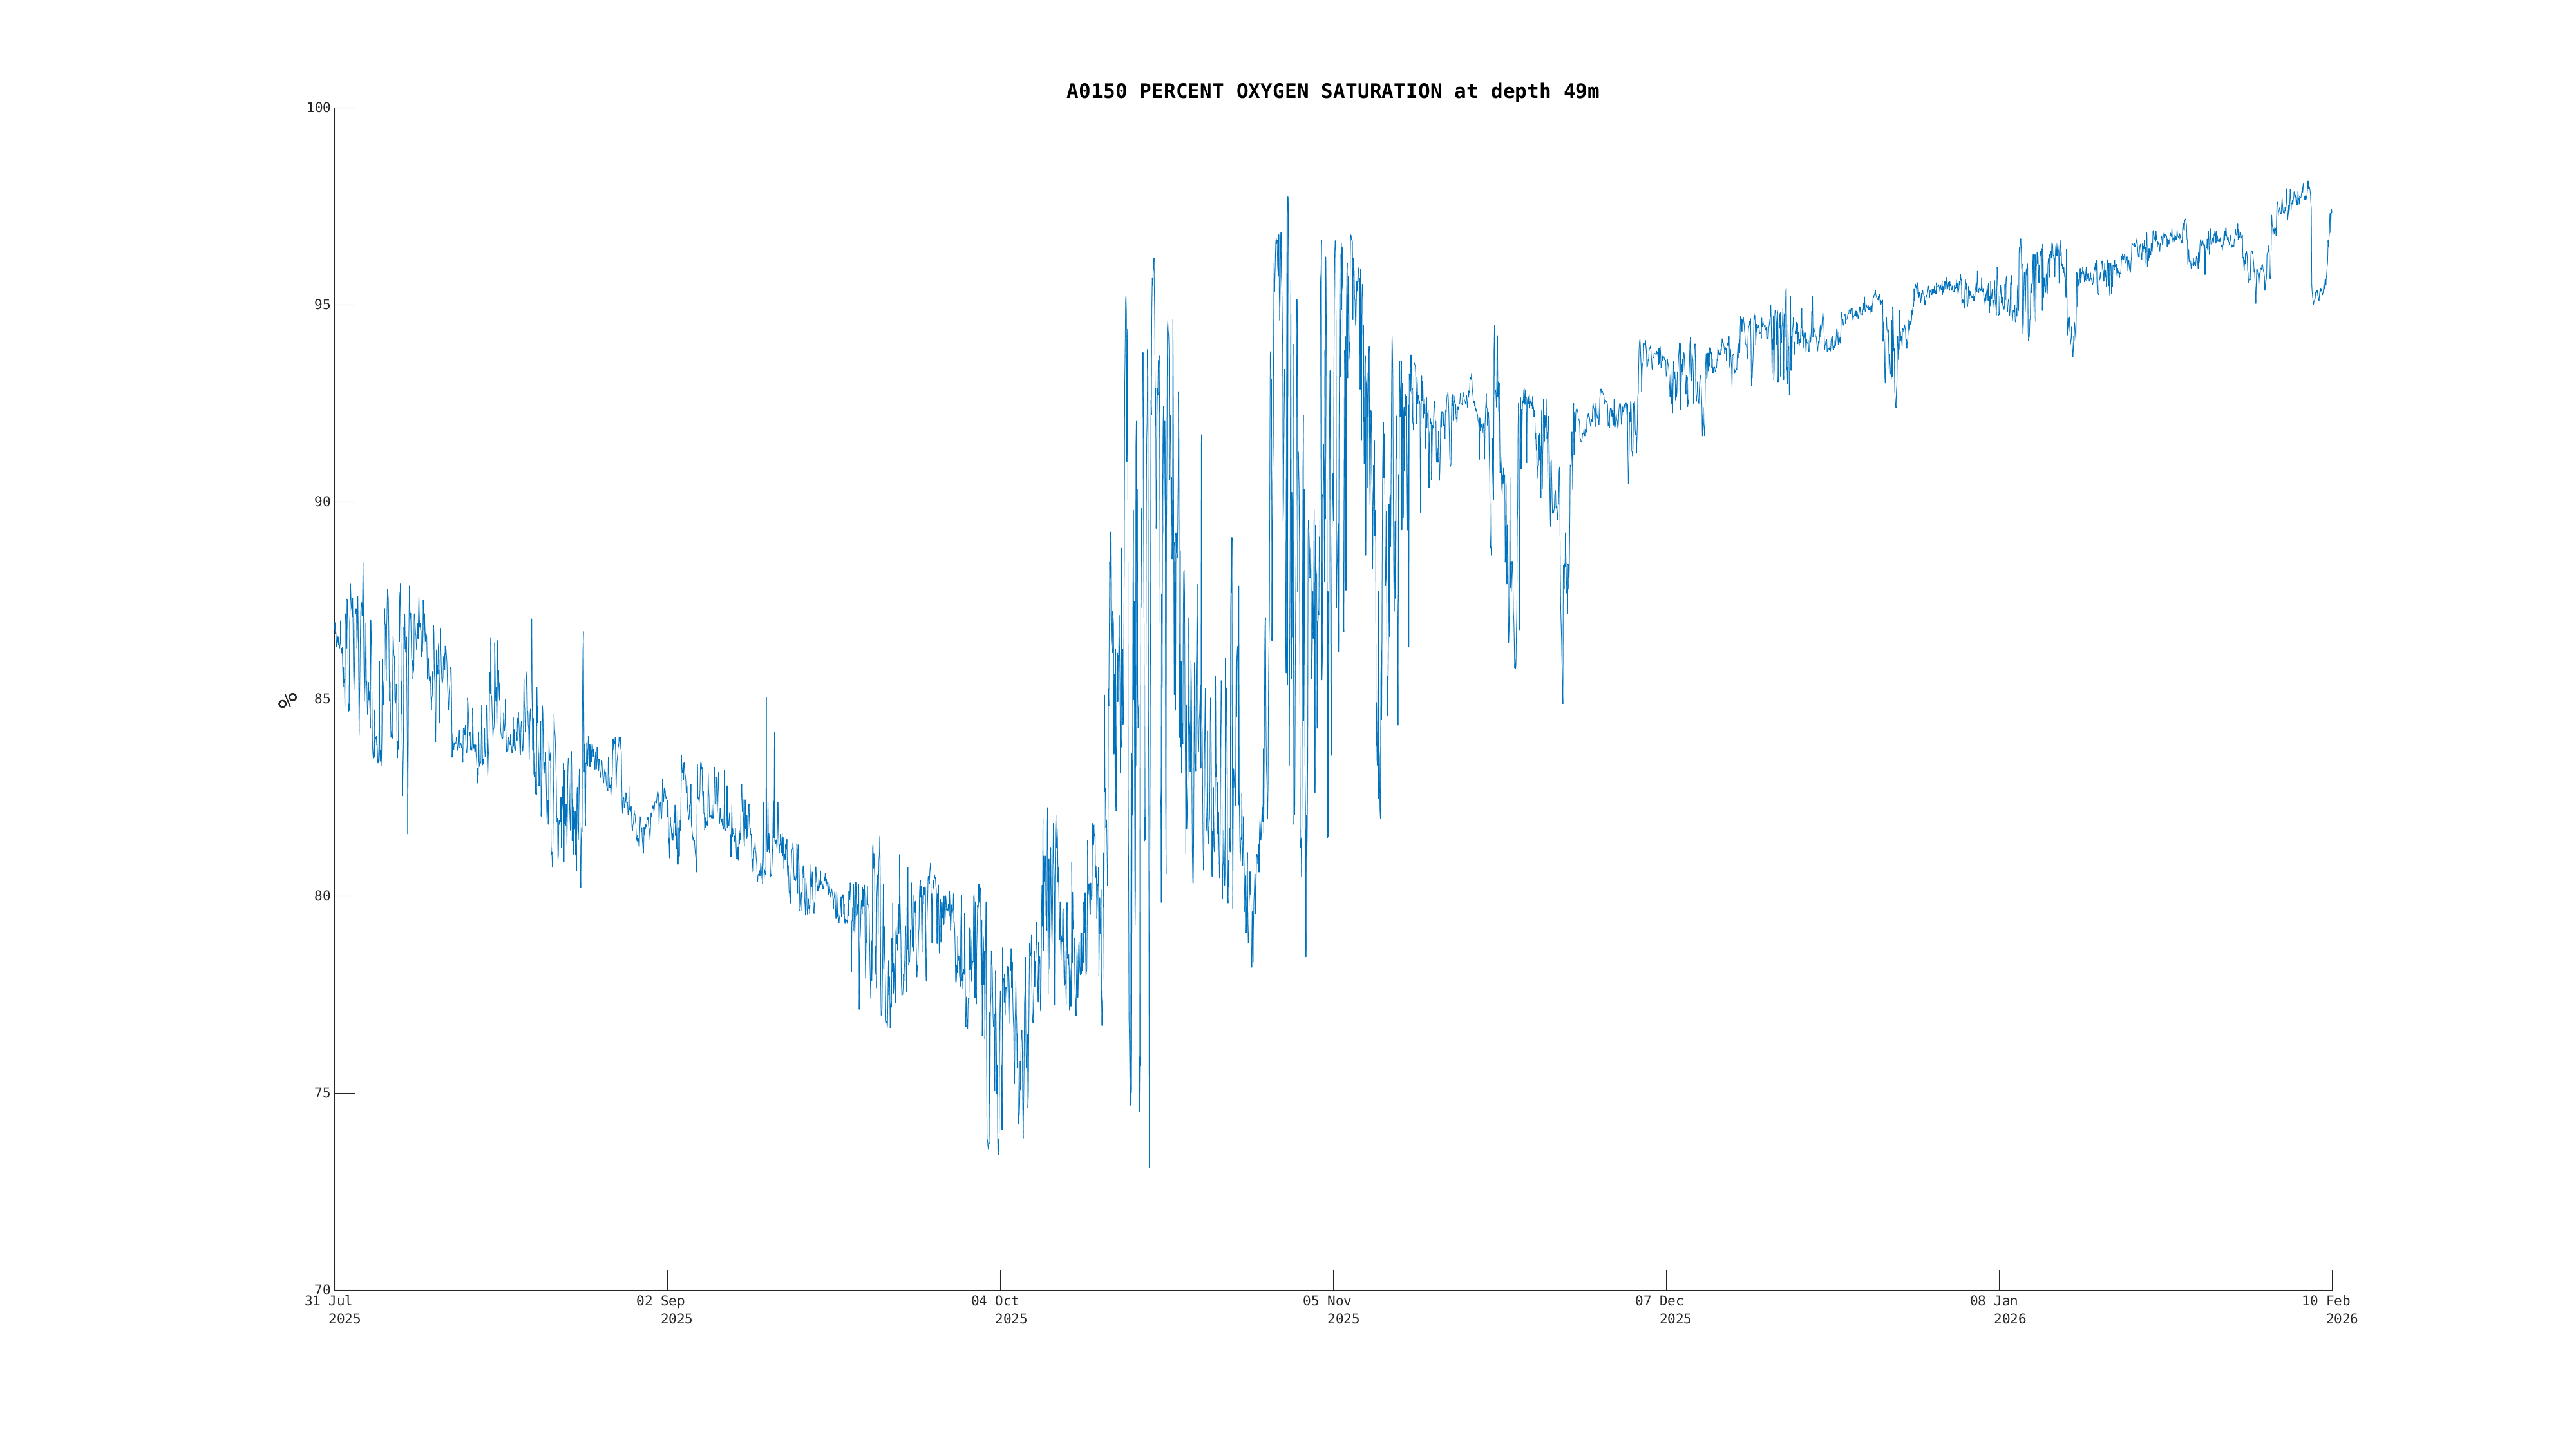
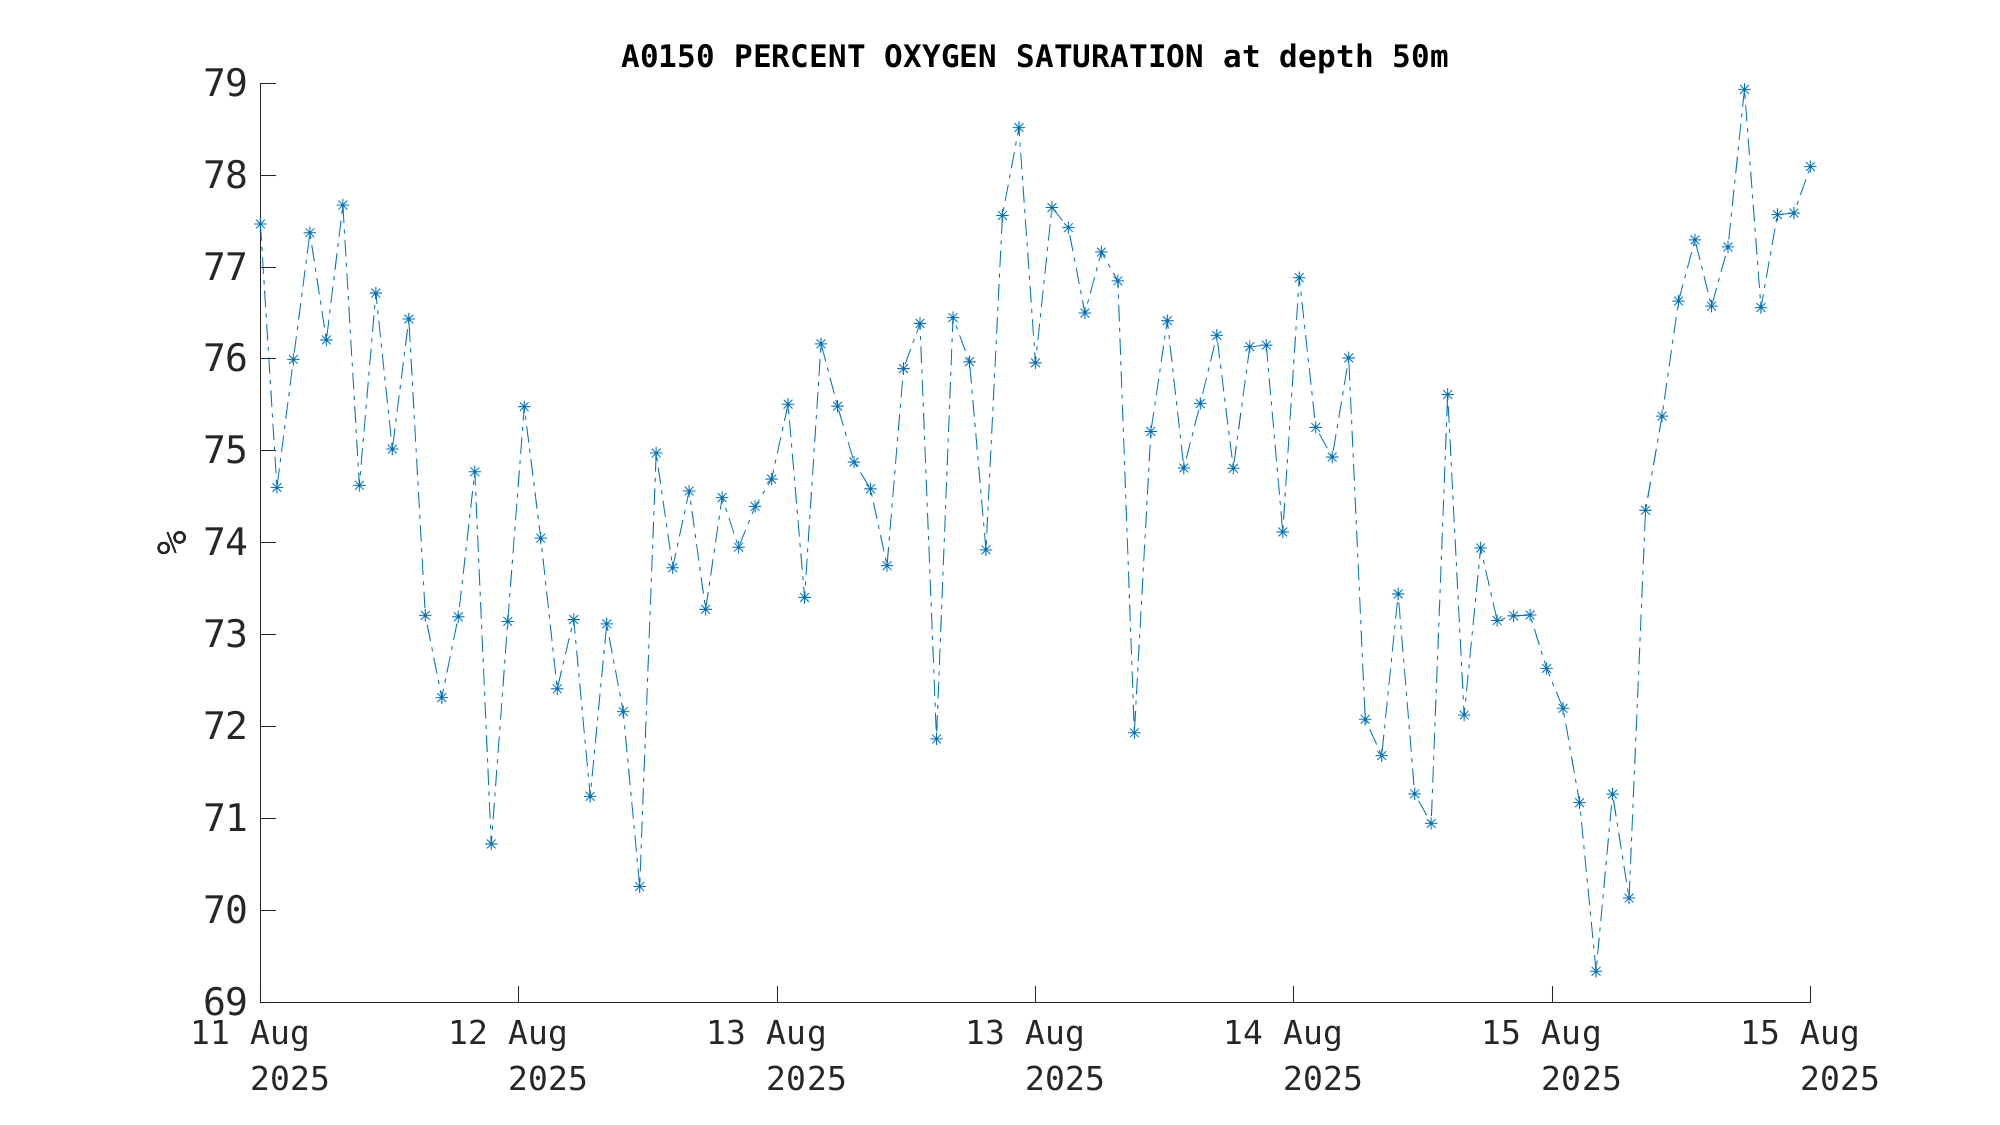
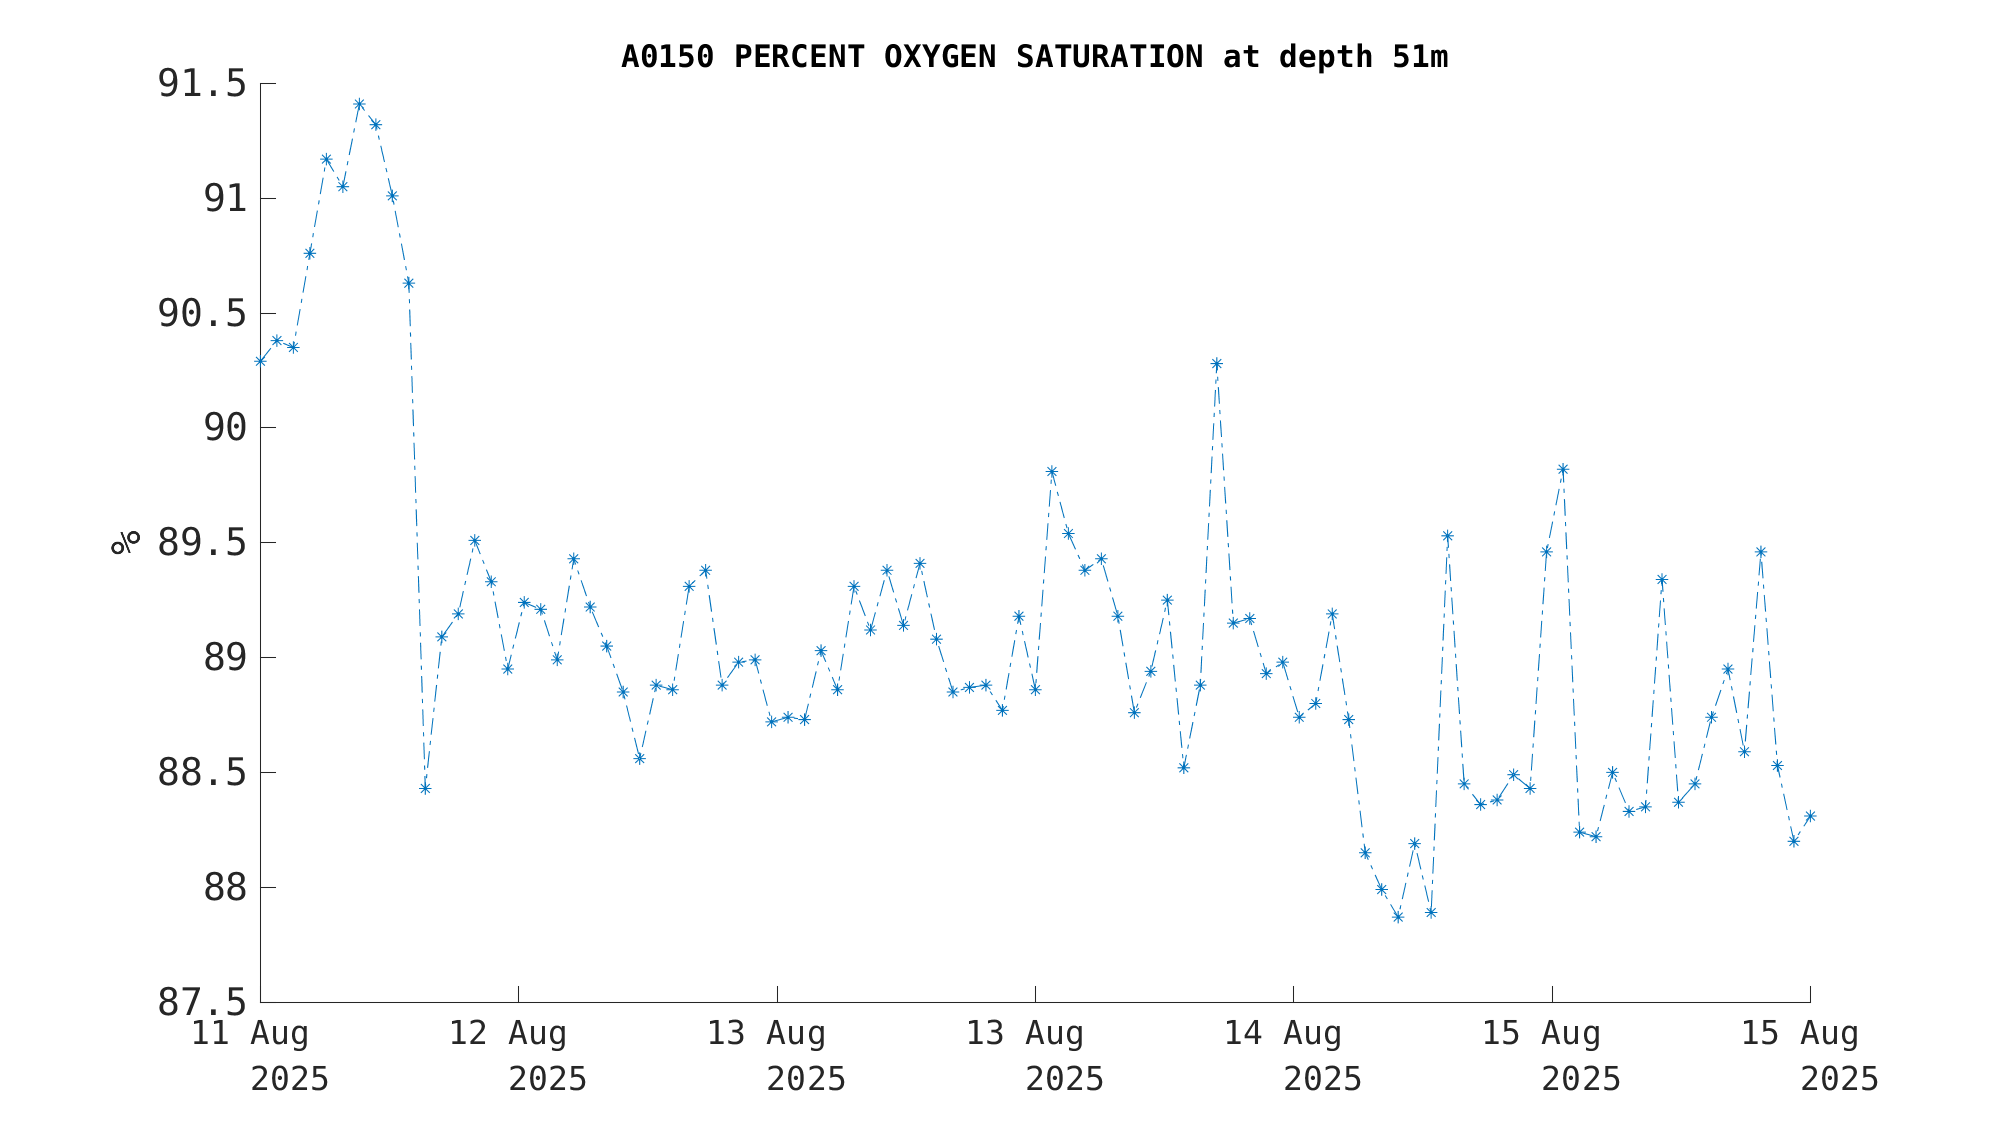
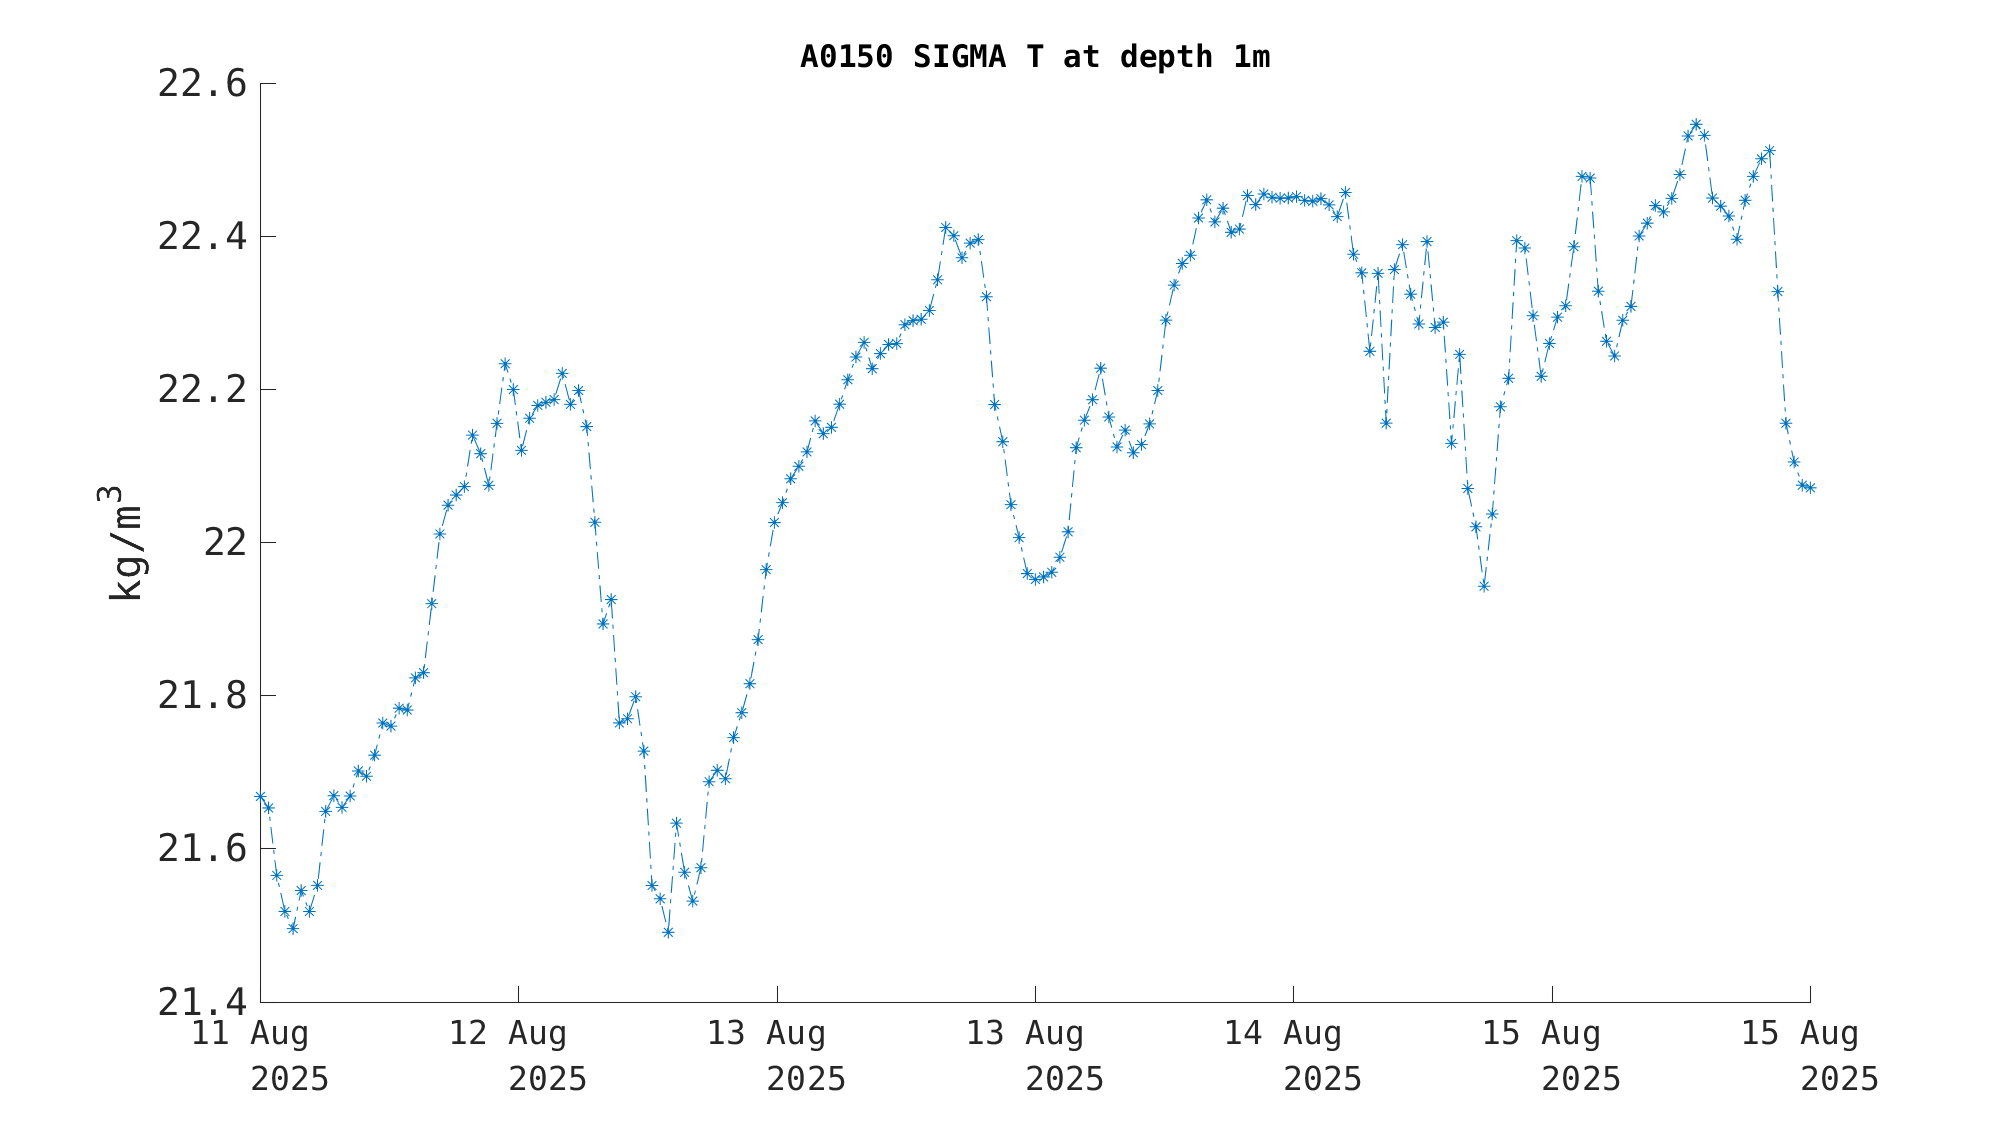
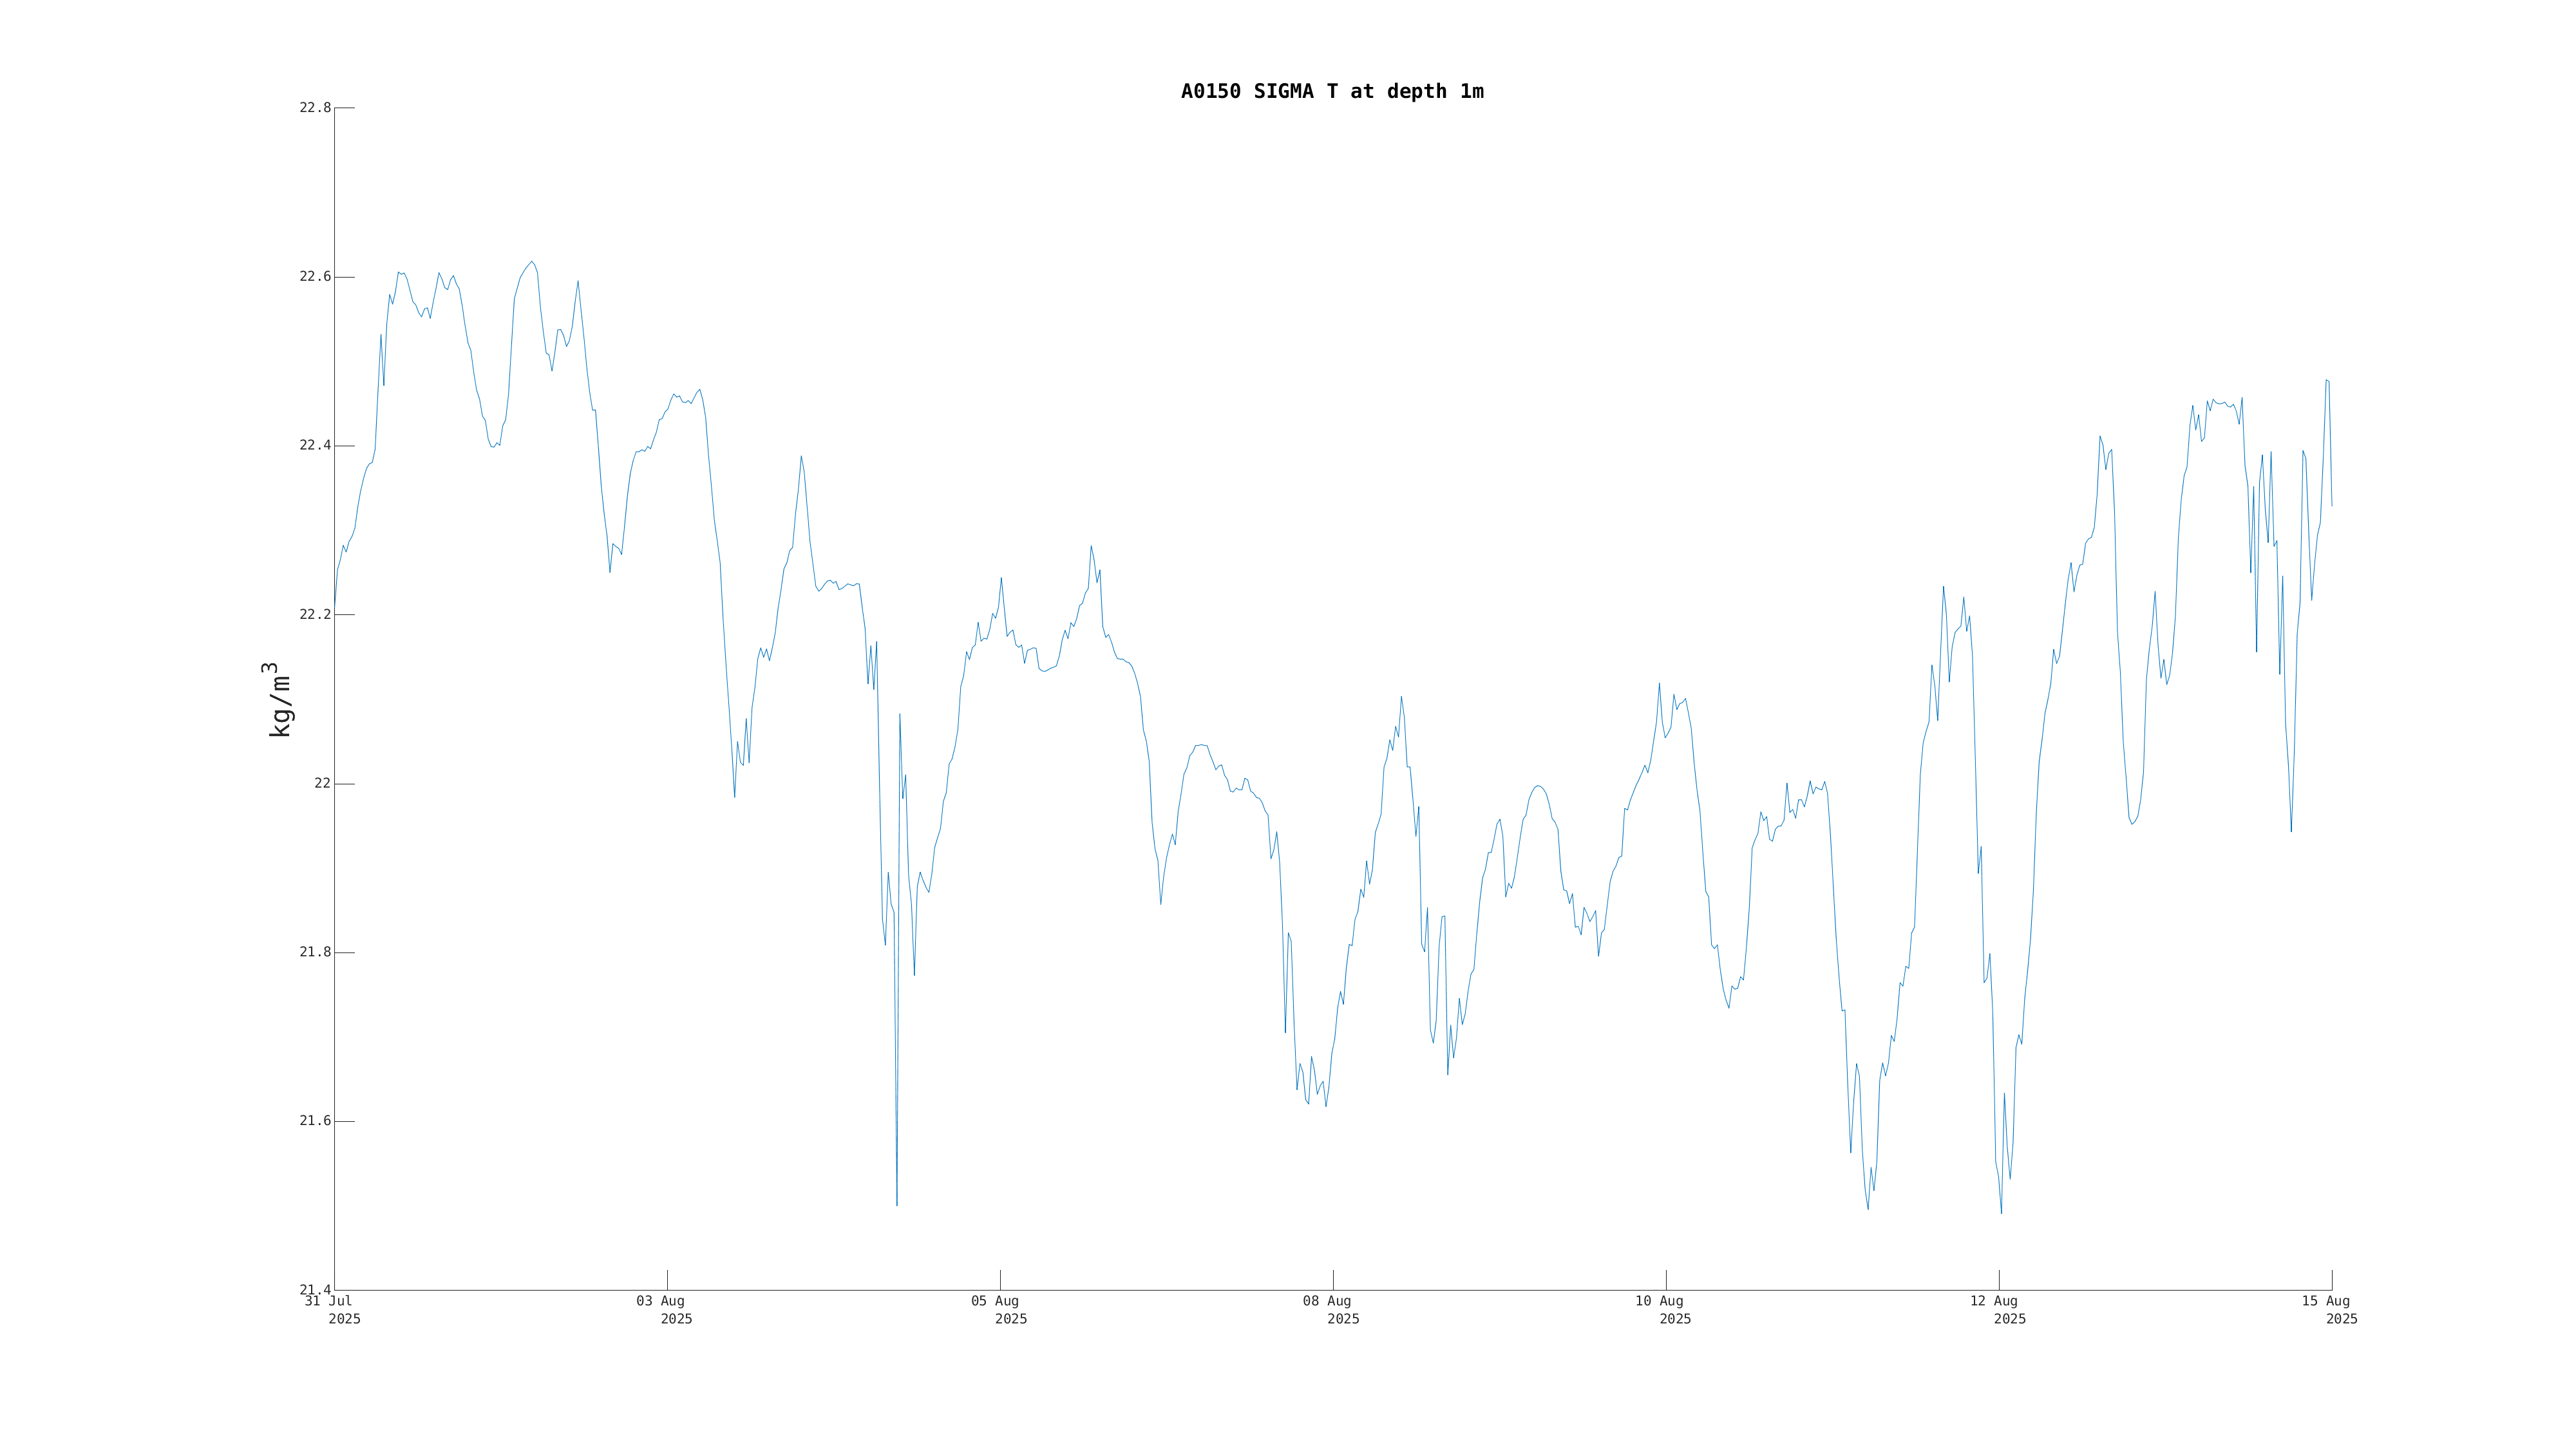
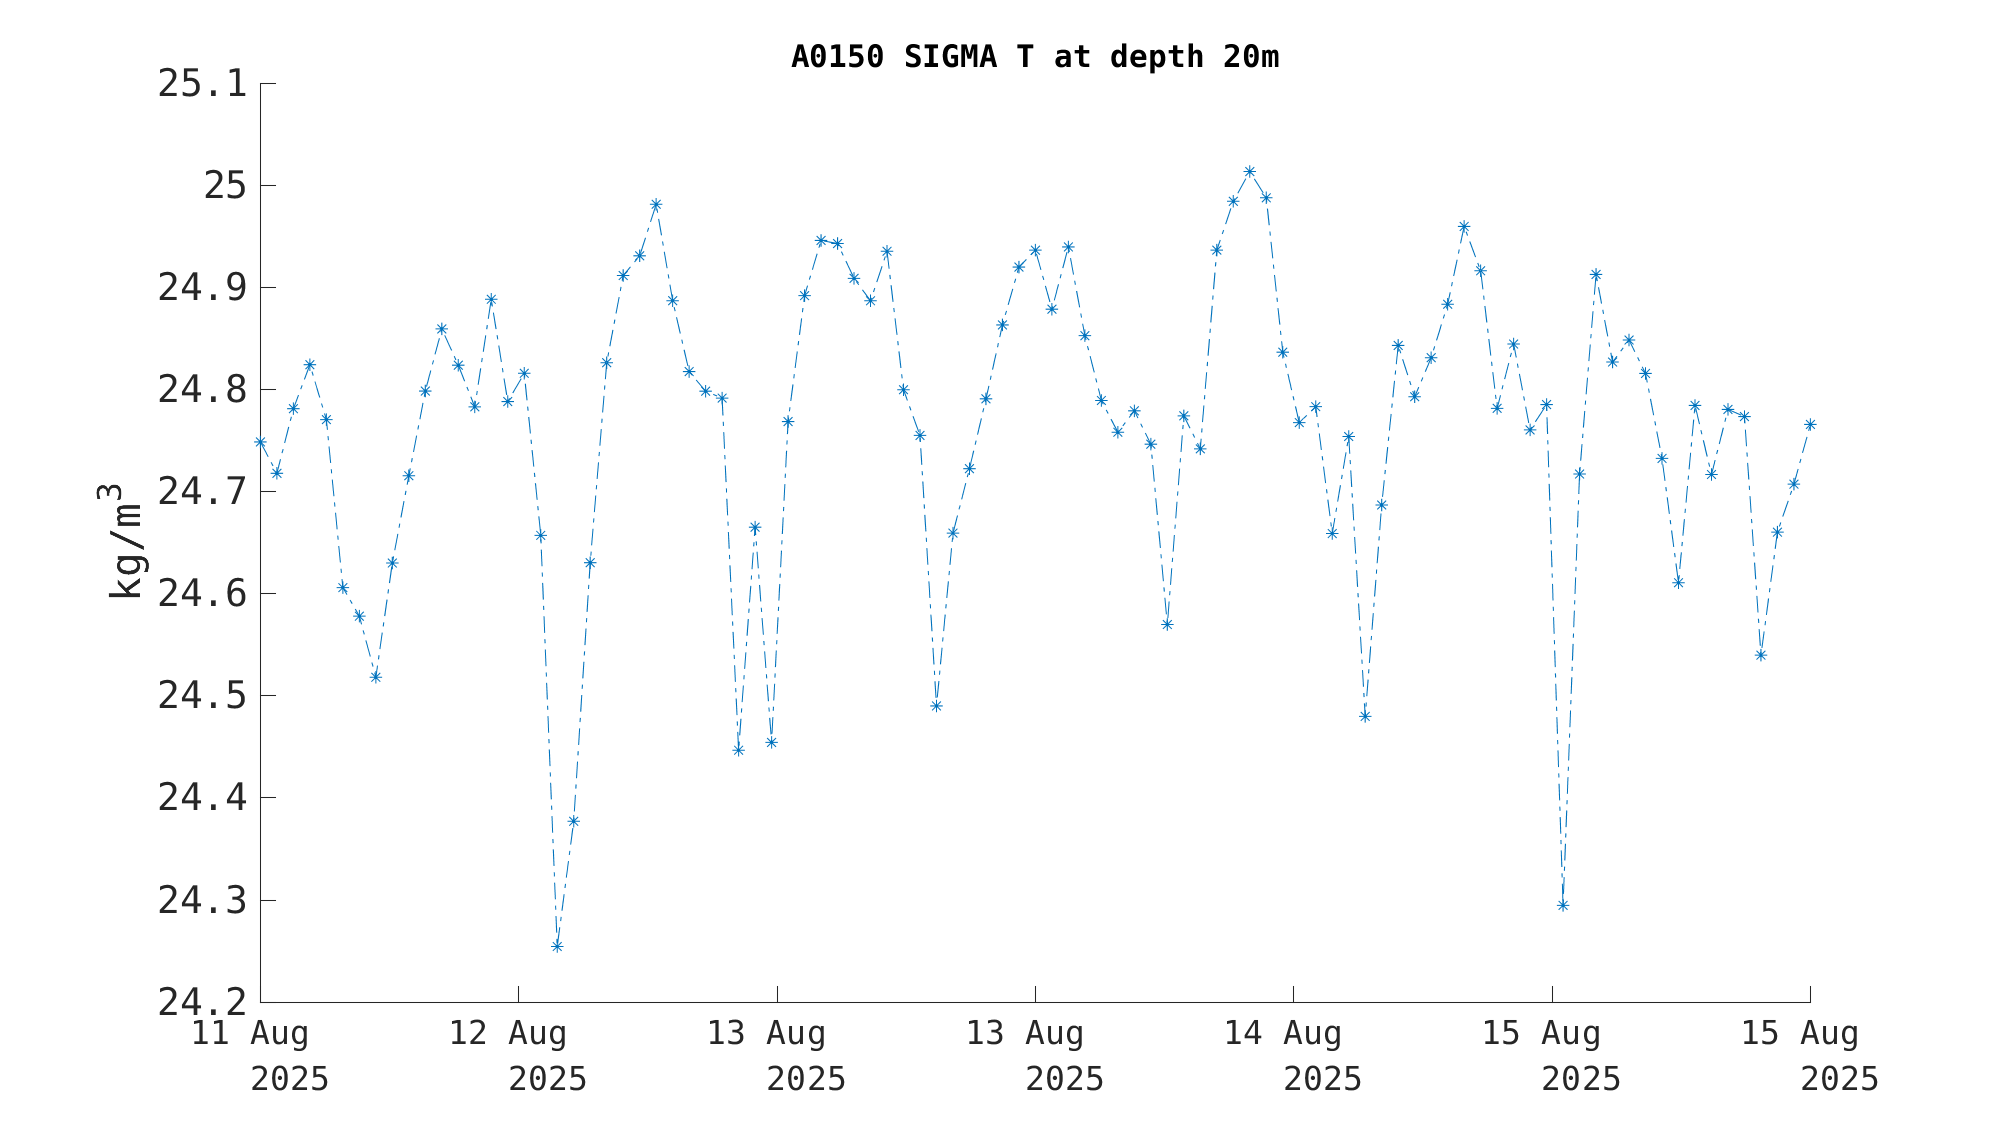
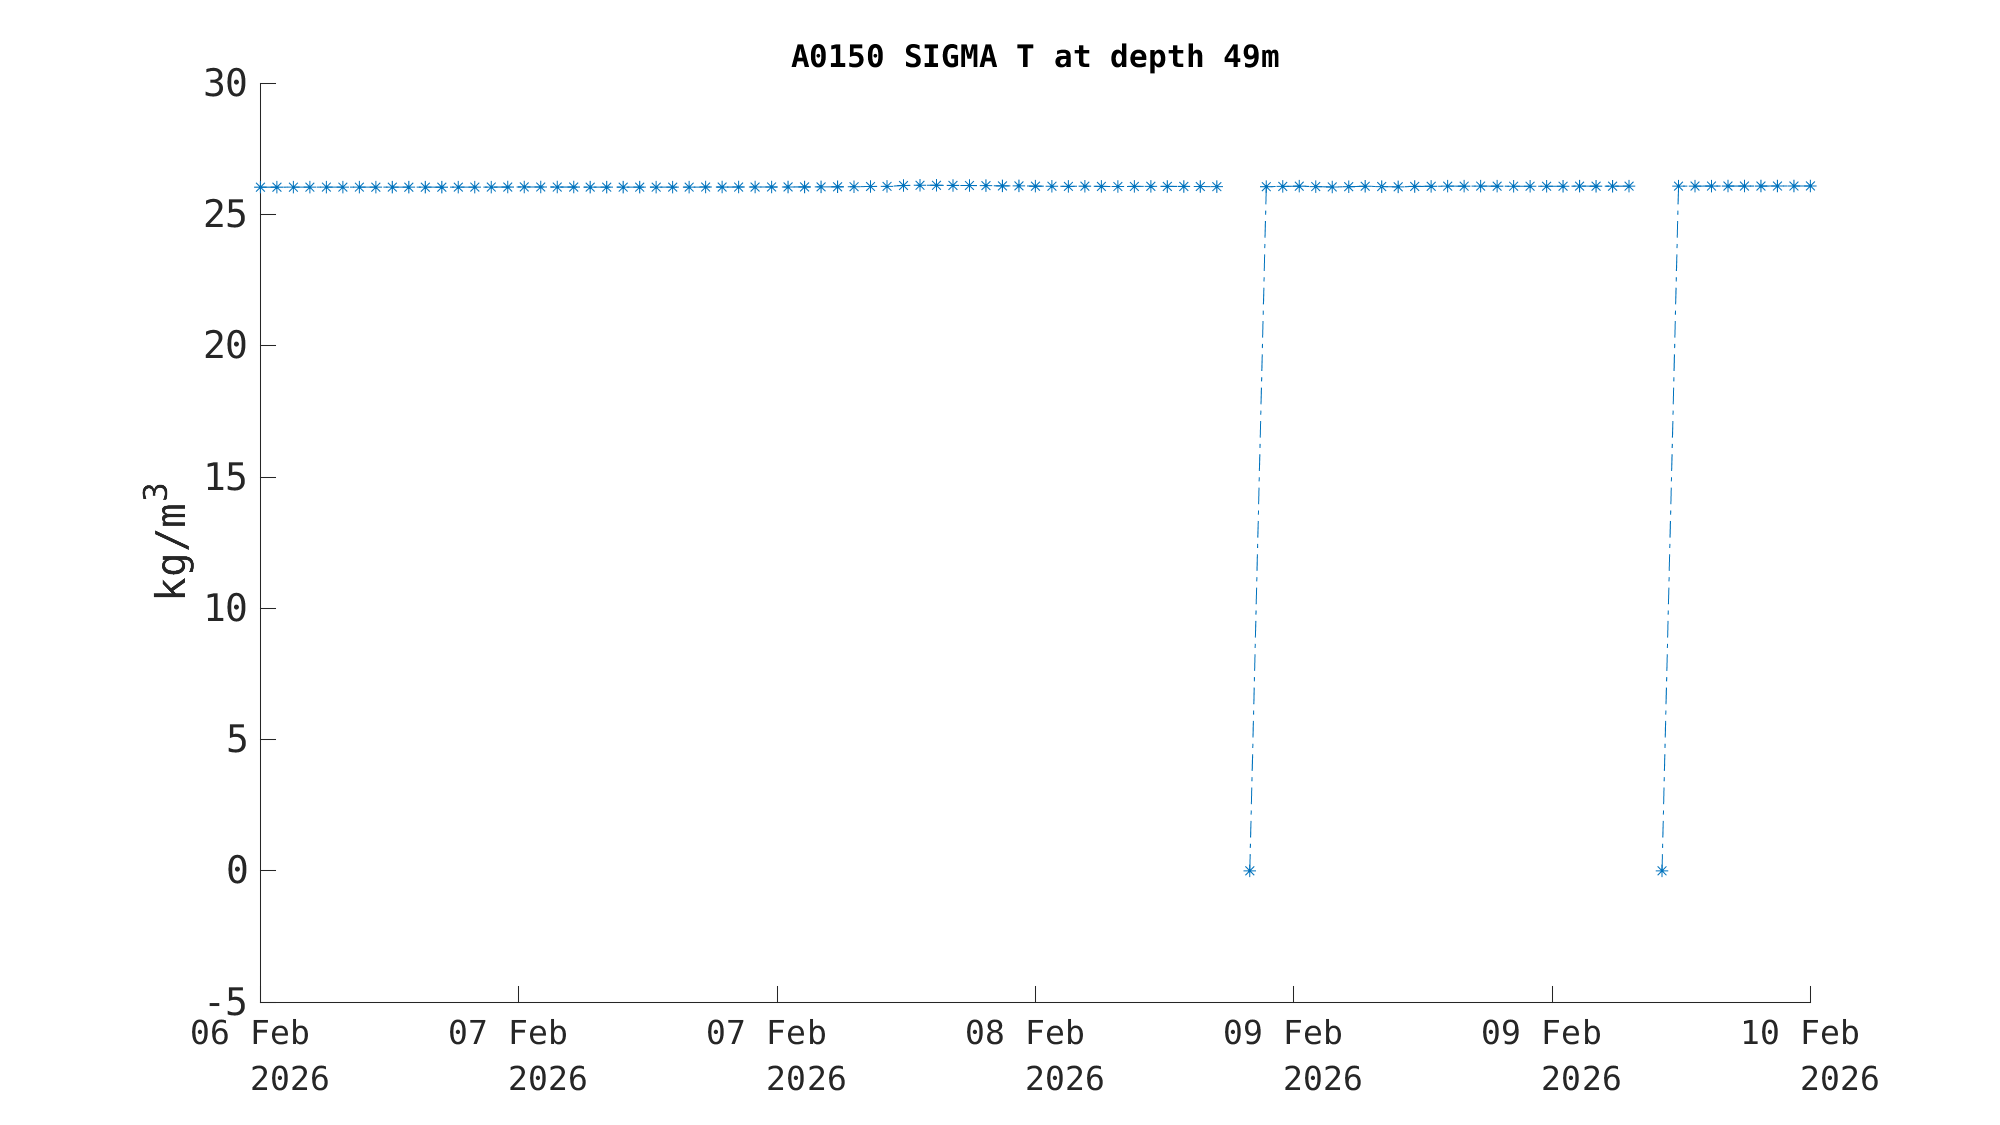
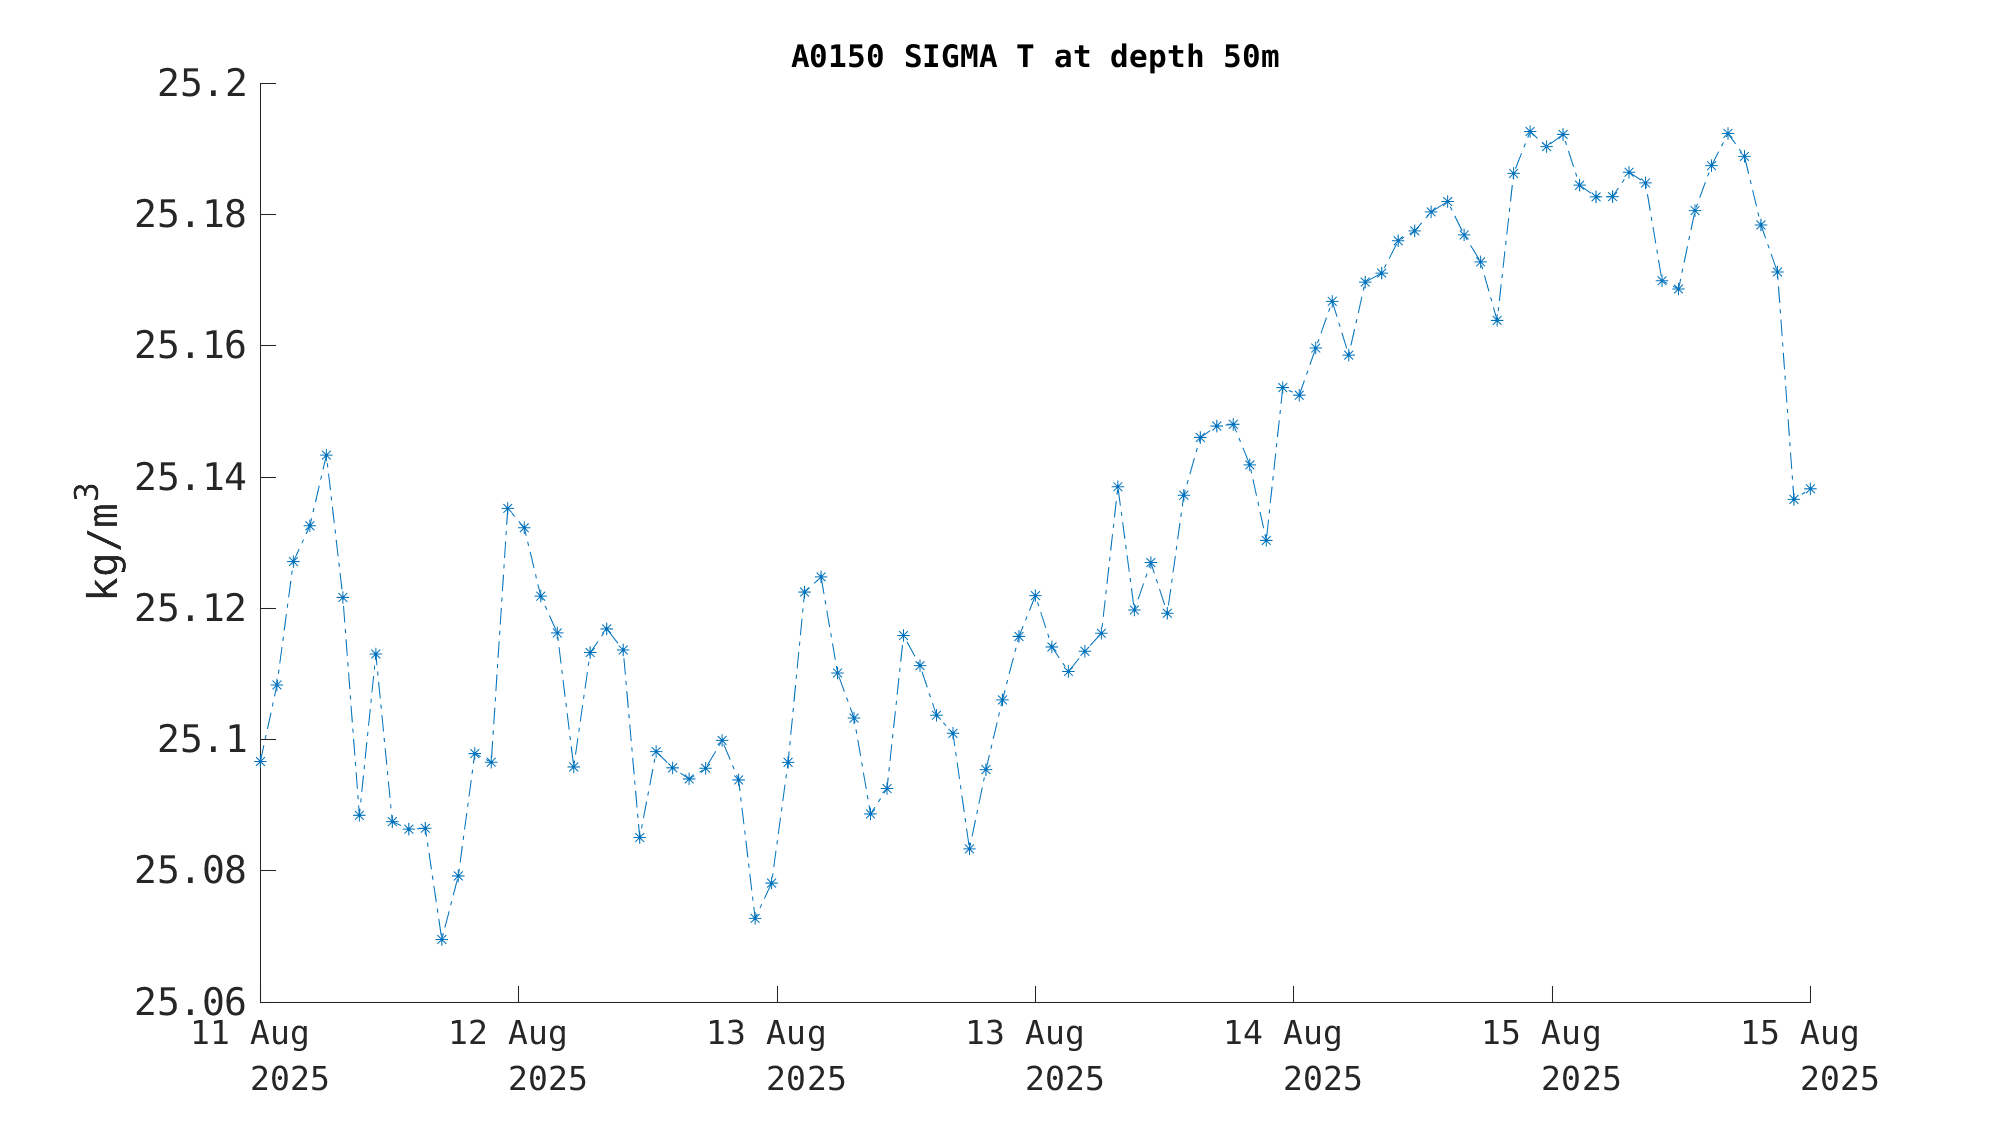
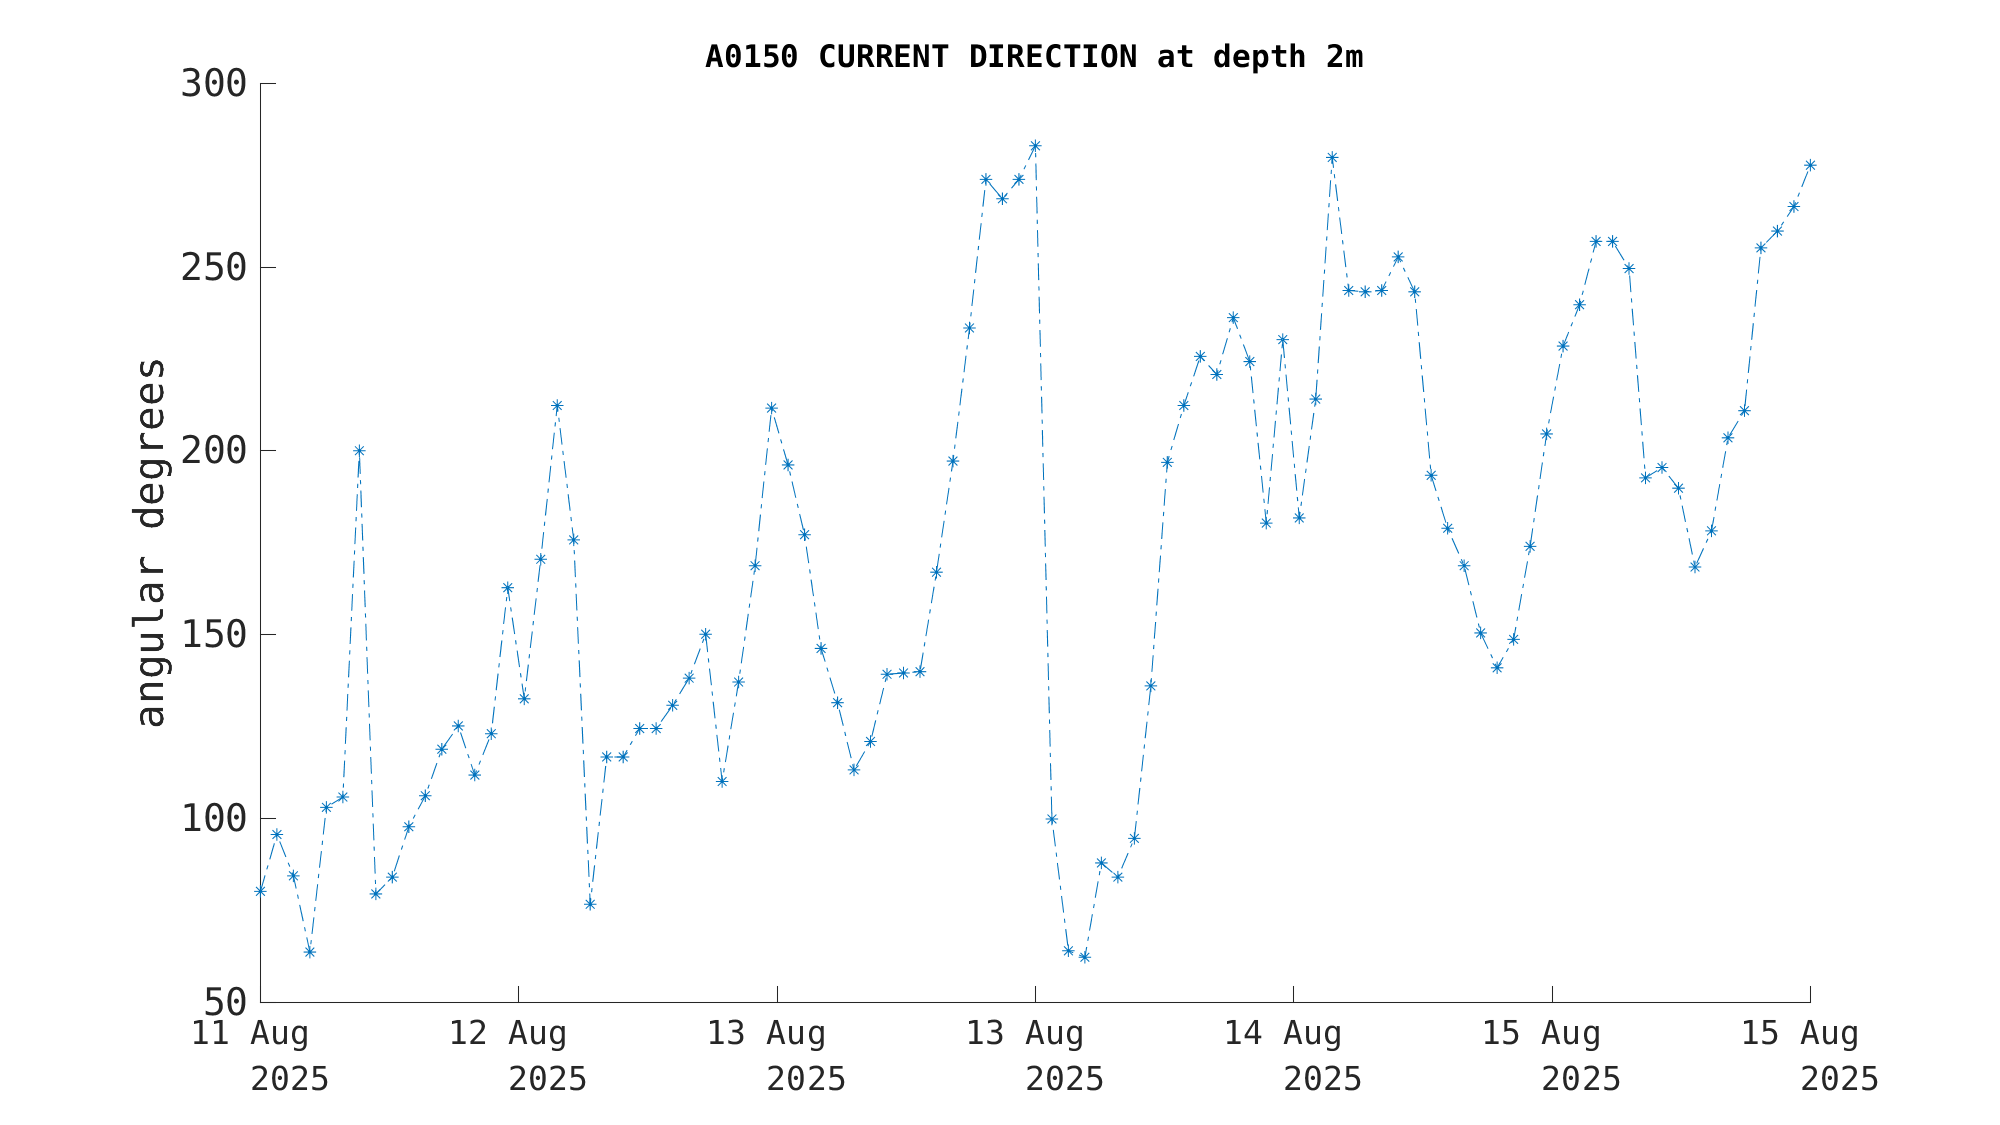
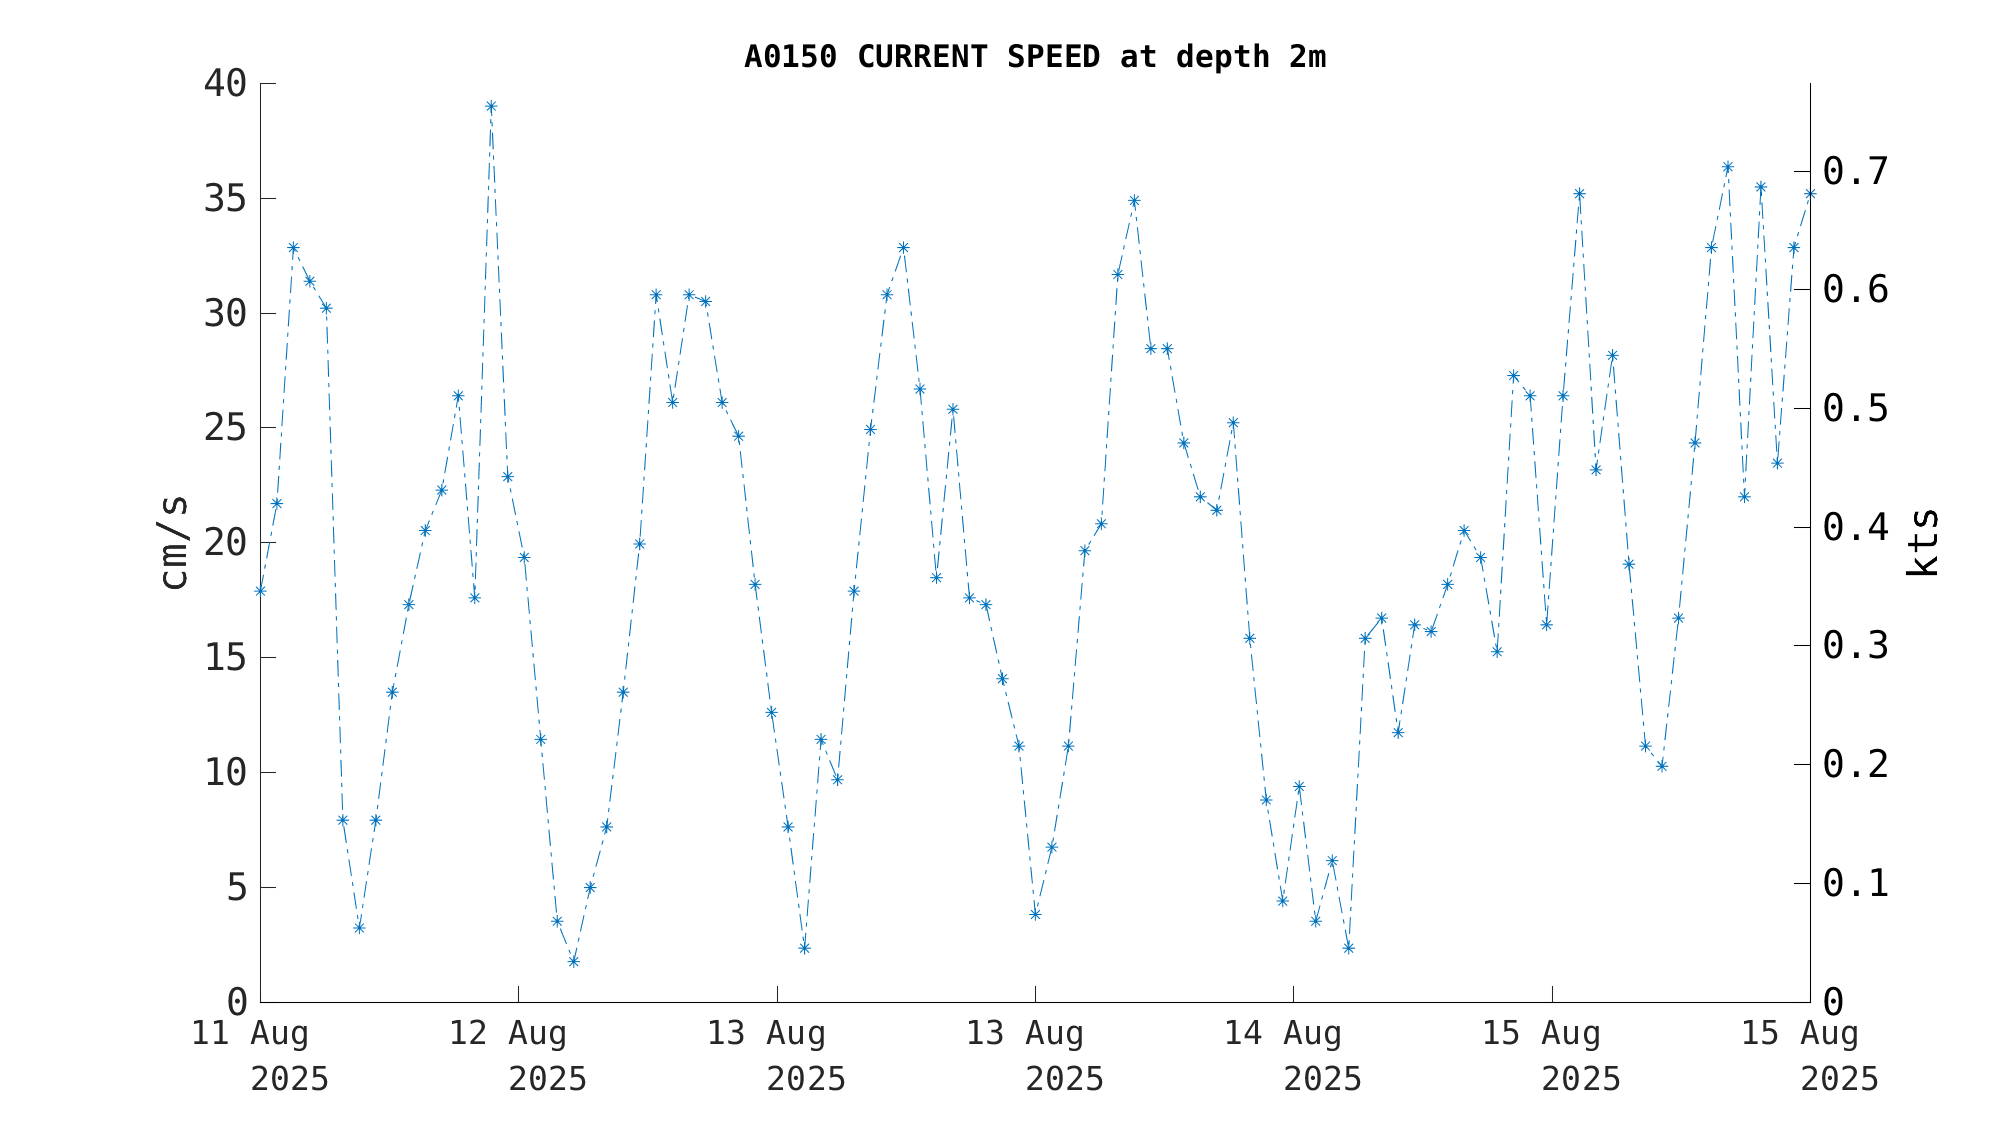
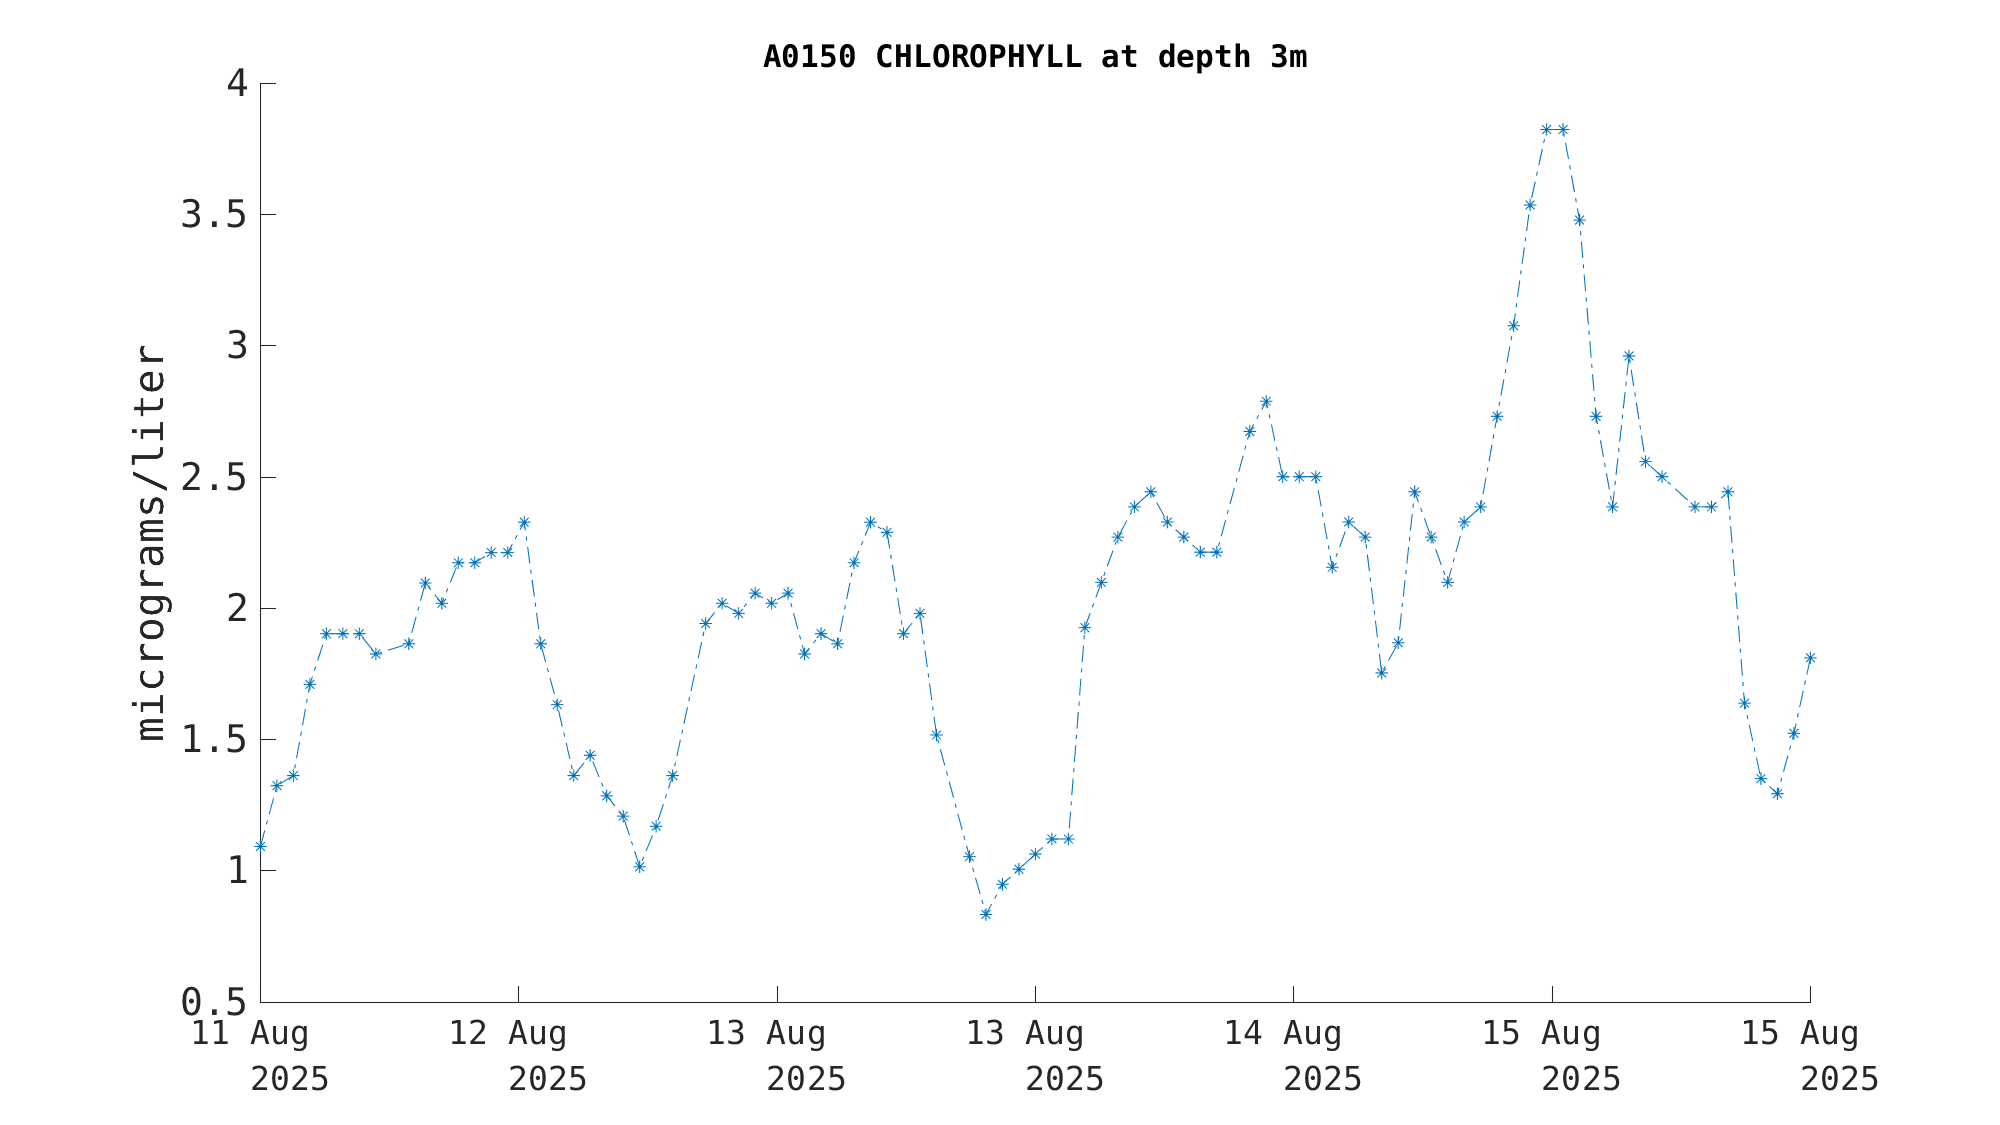
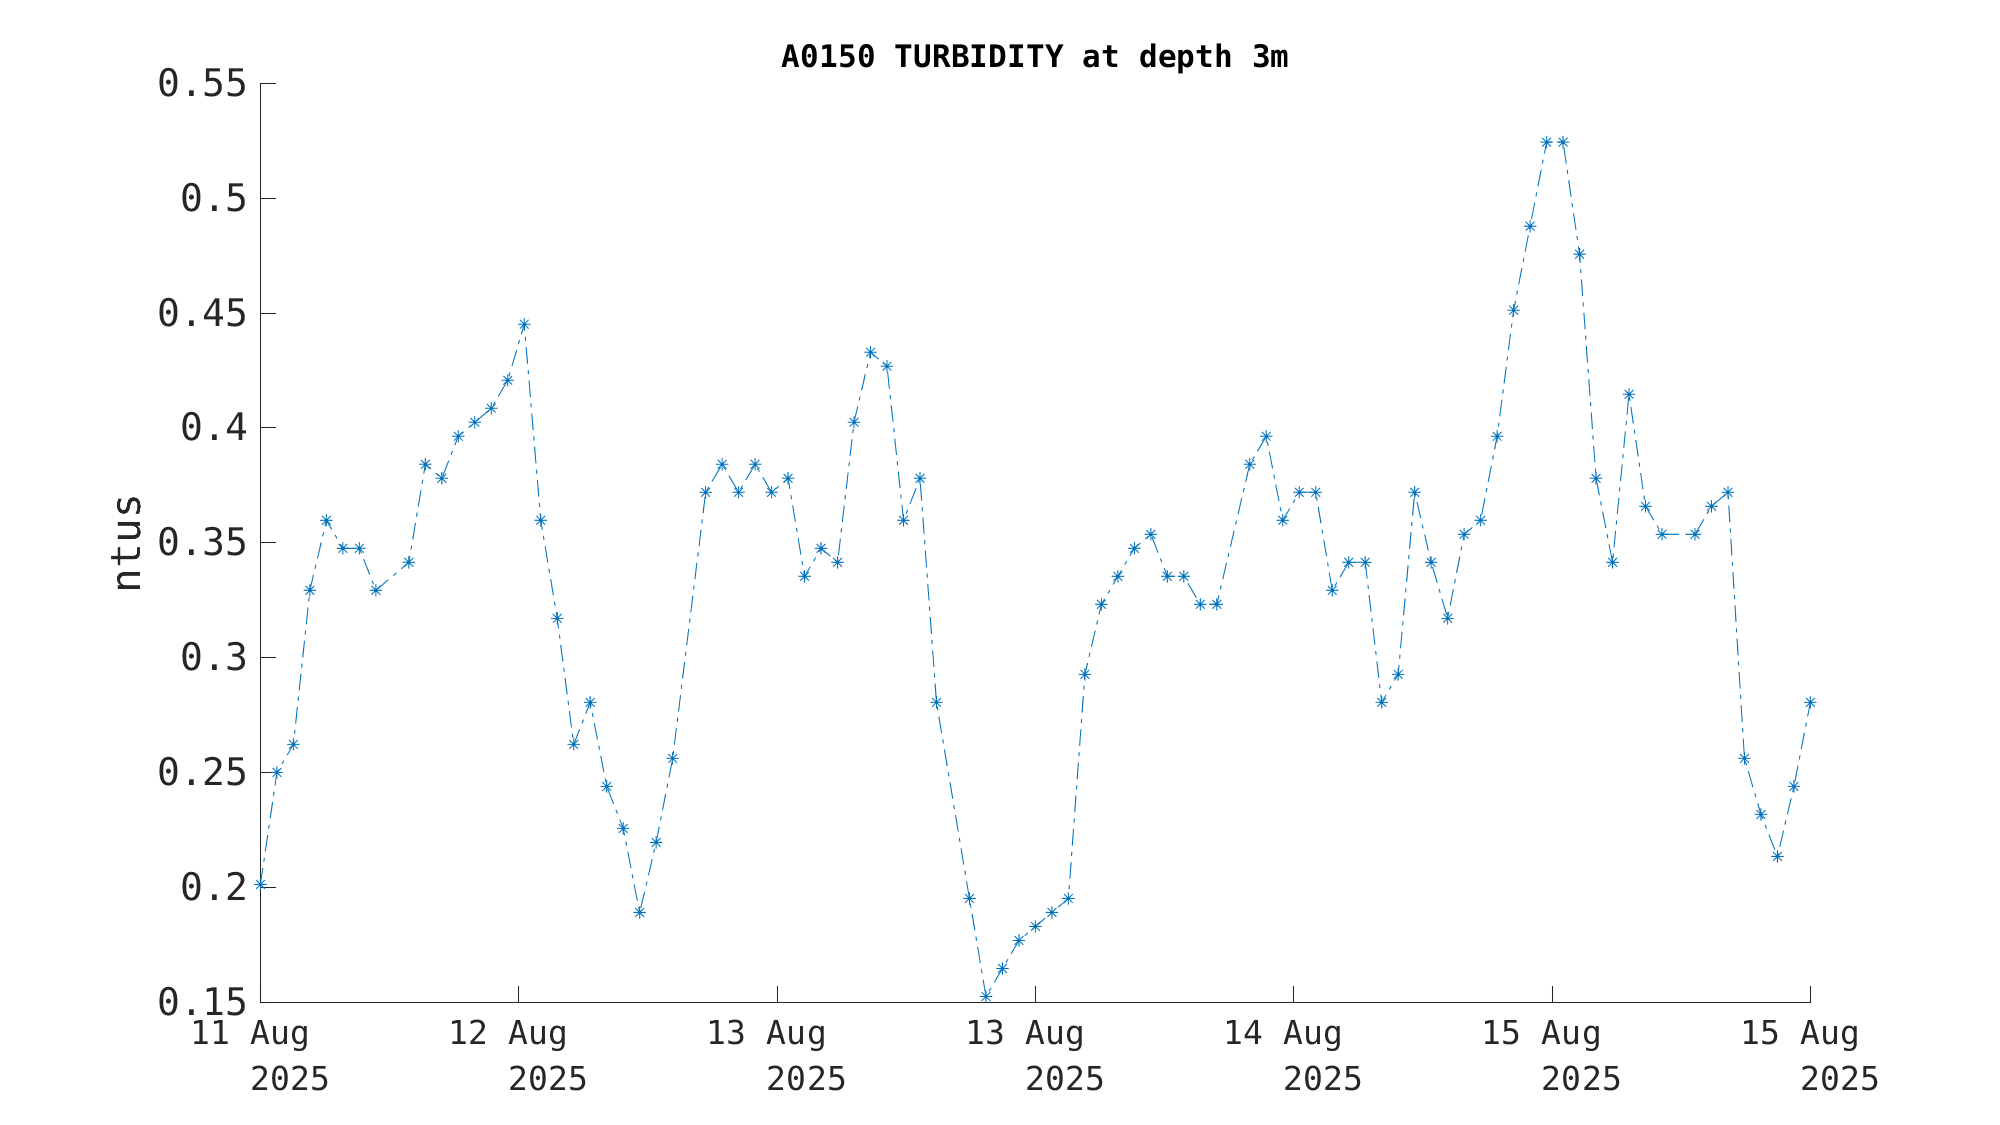
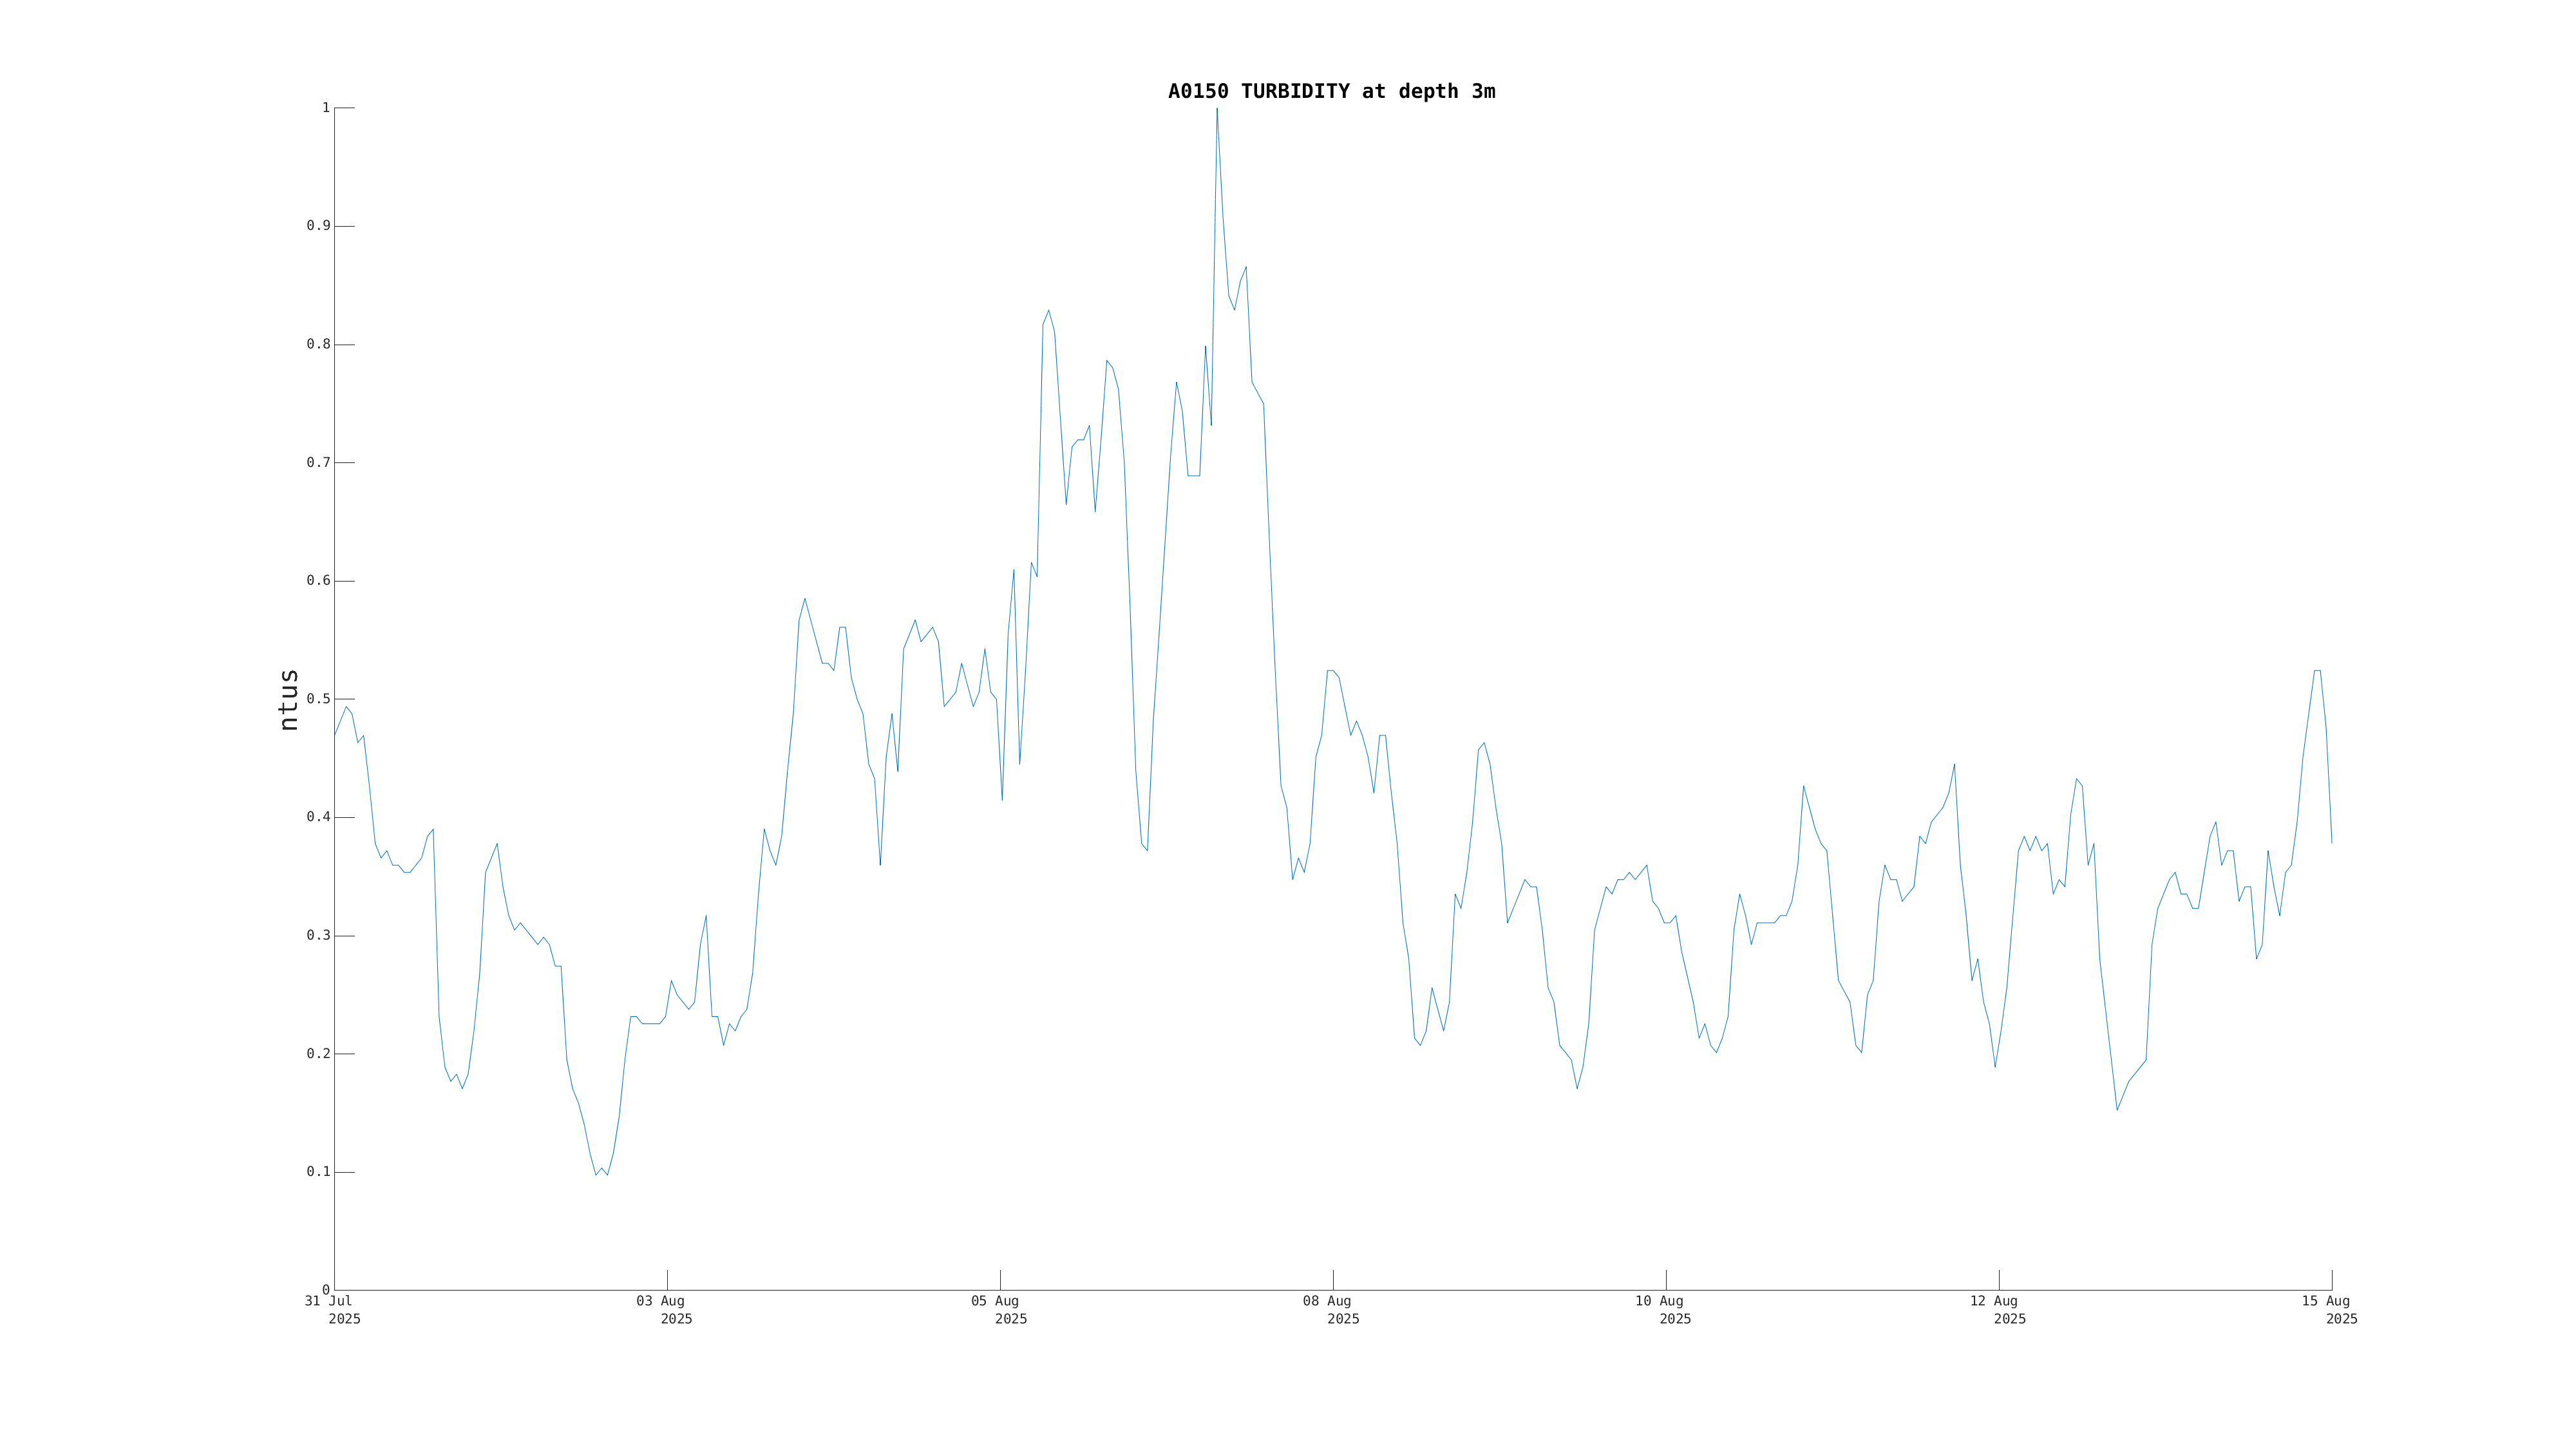
 Latest Month's:
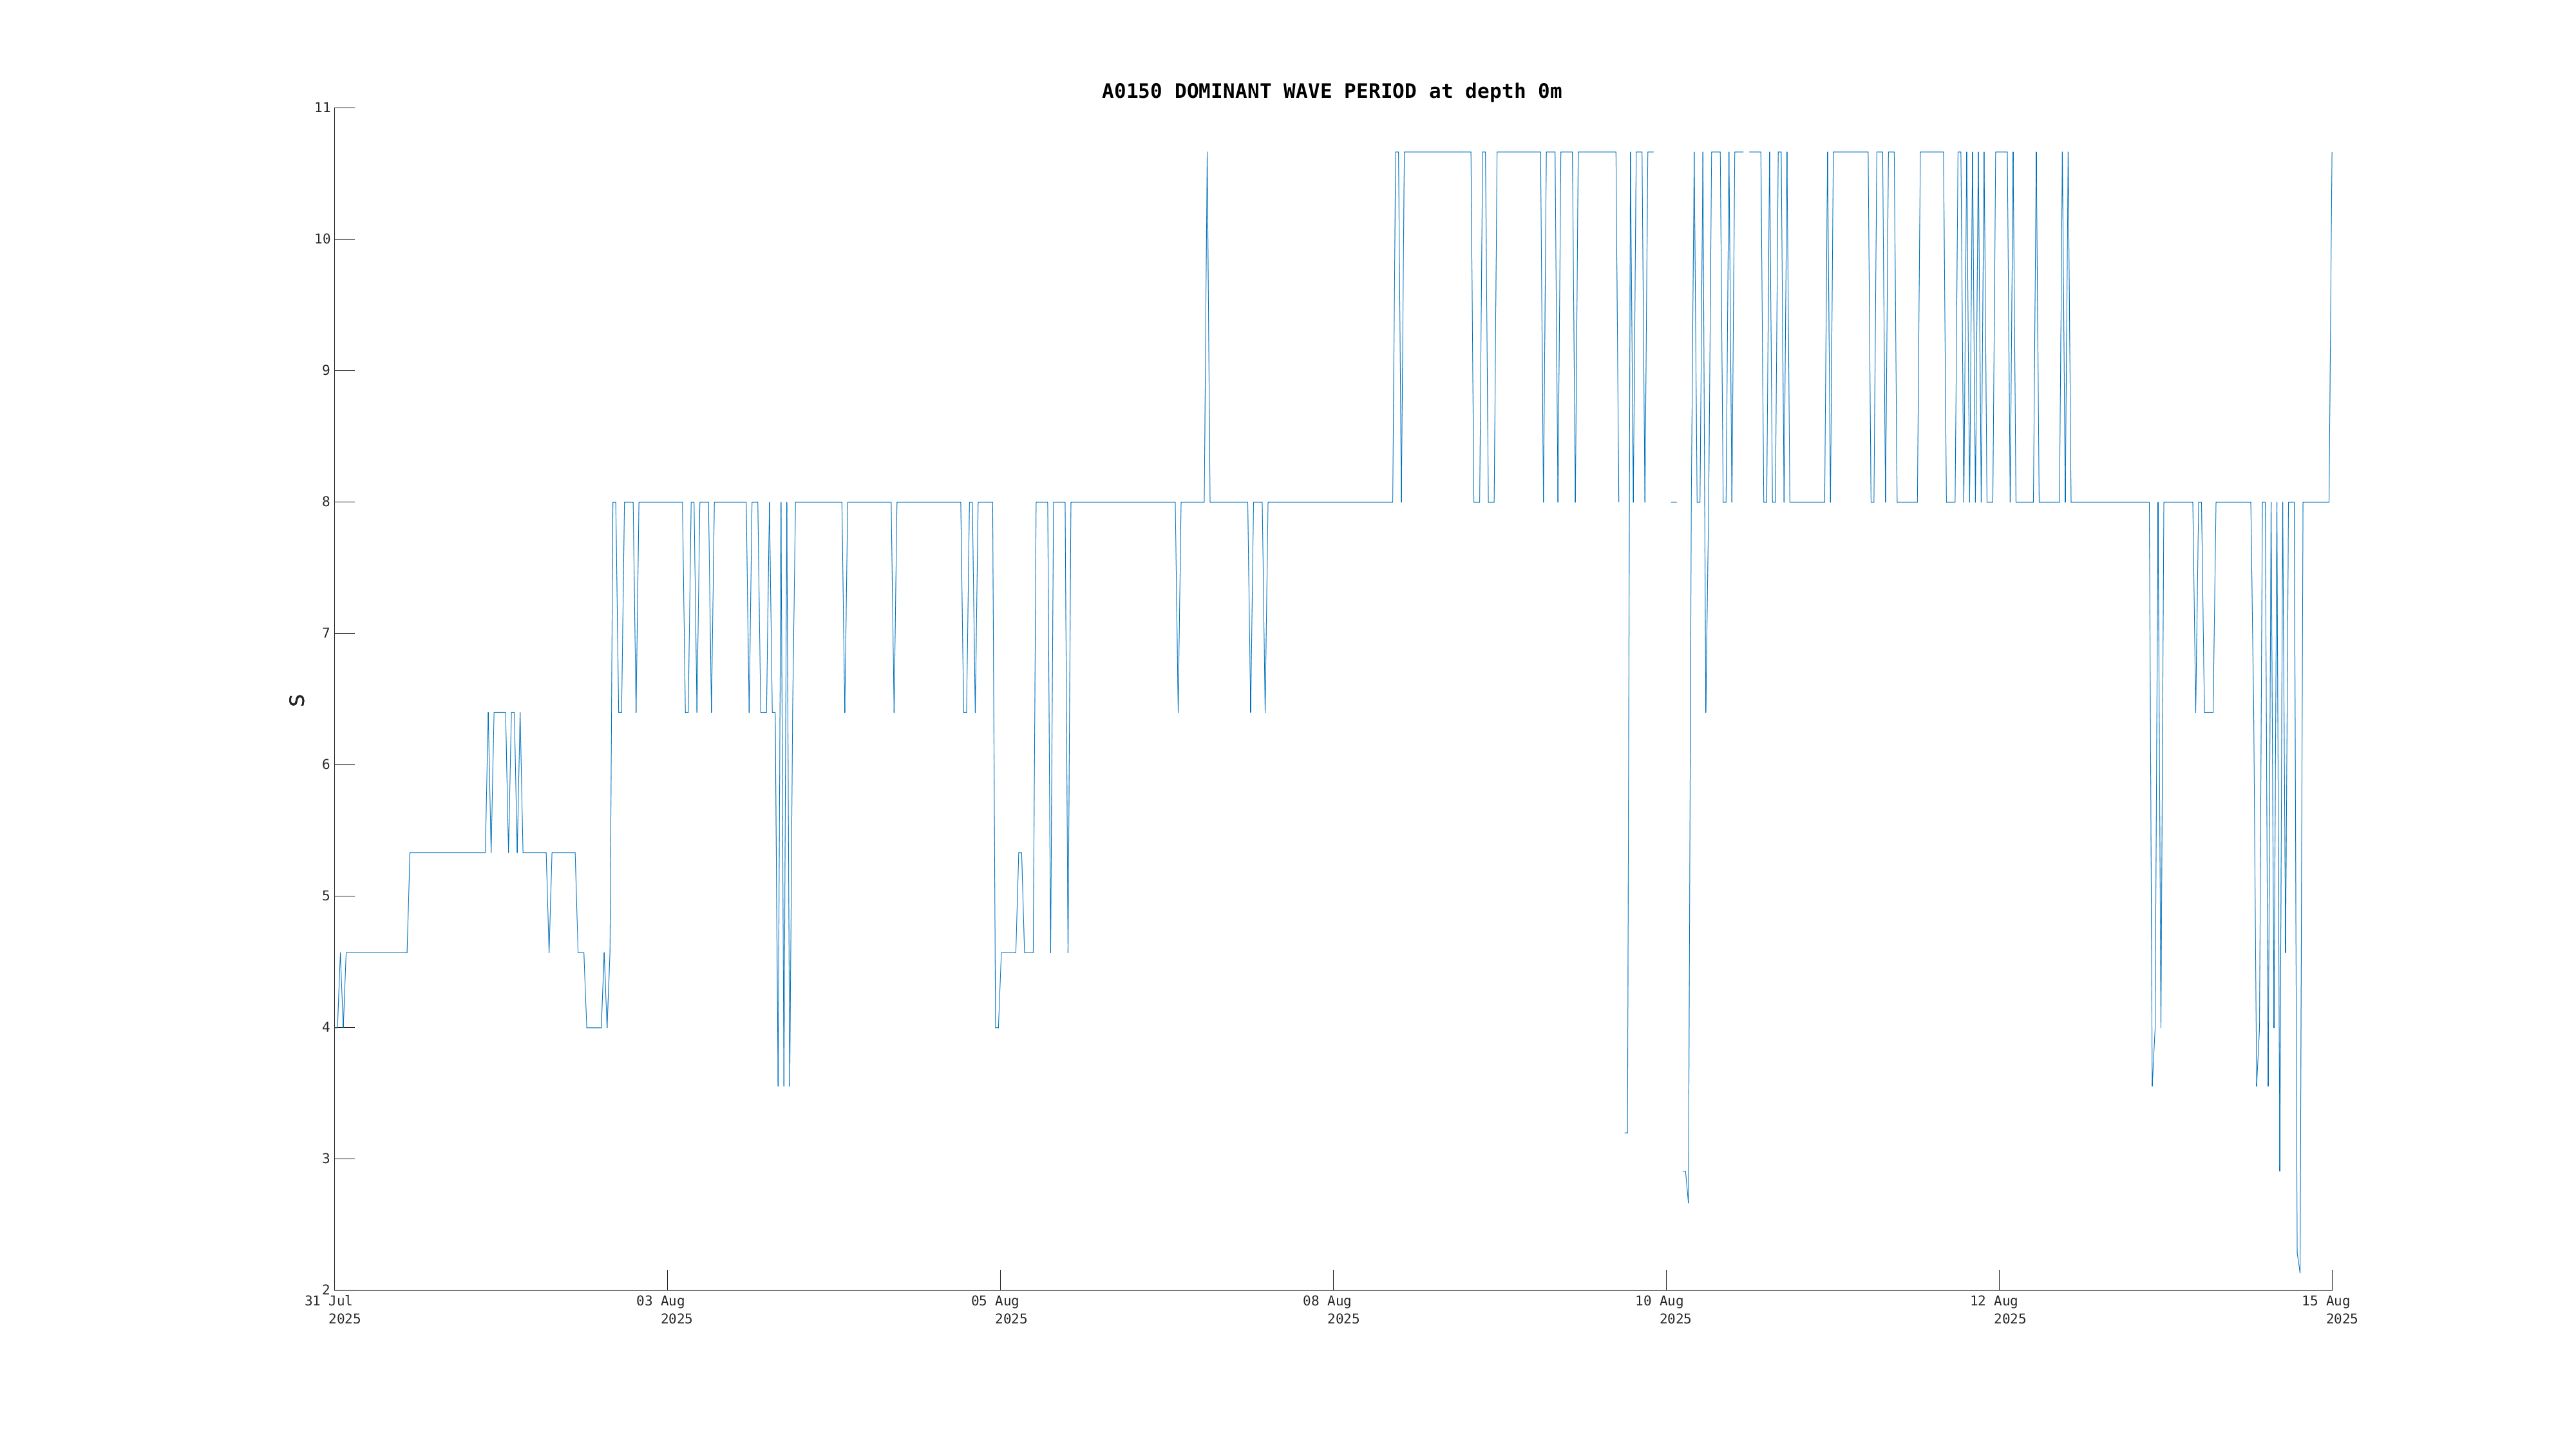
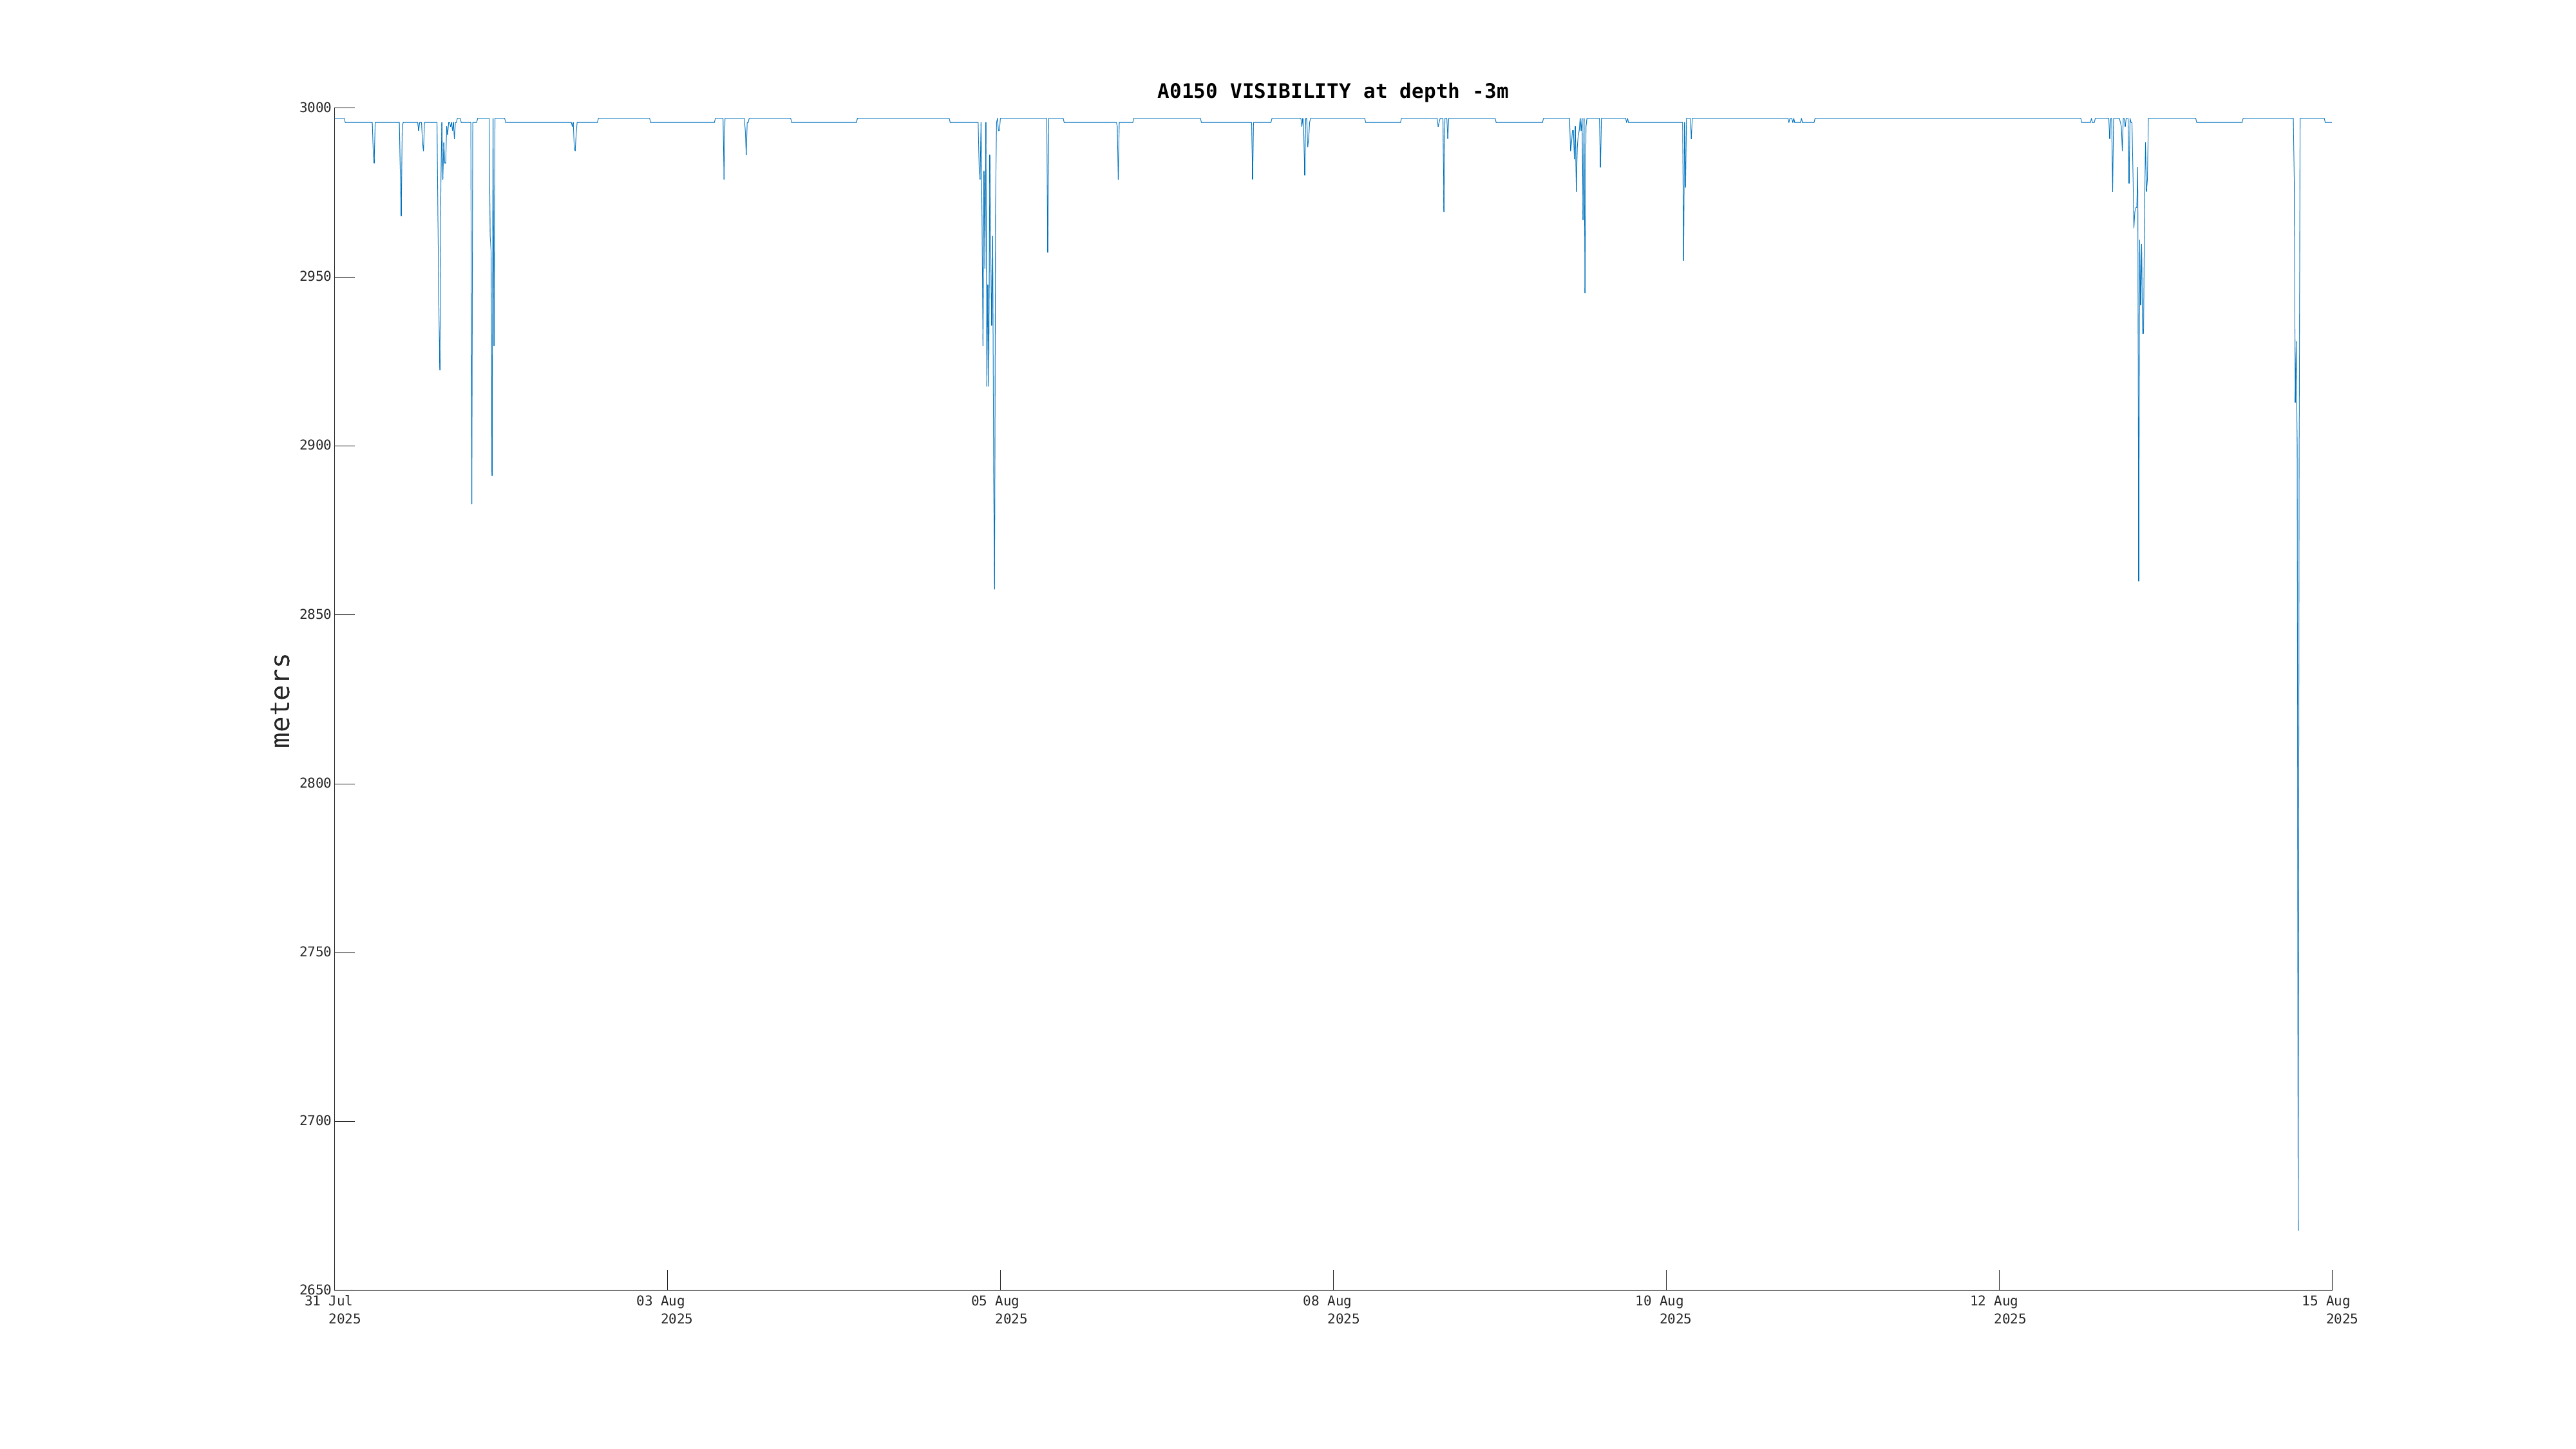
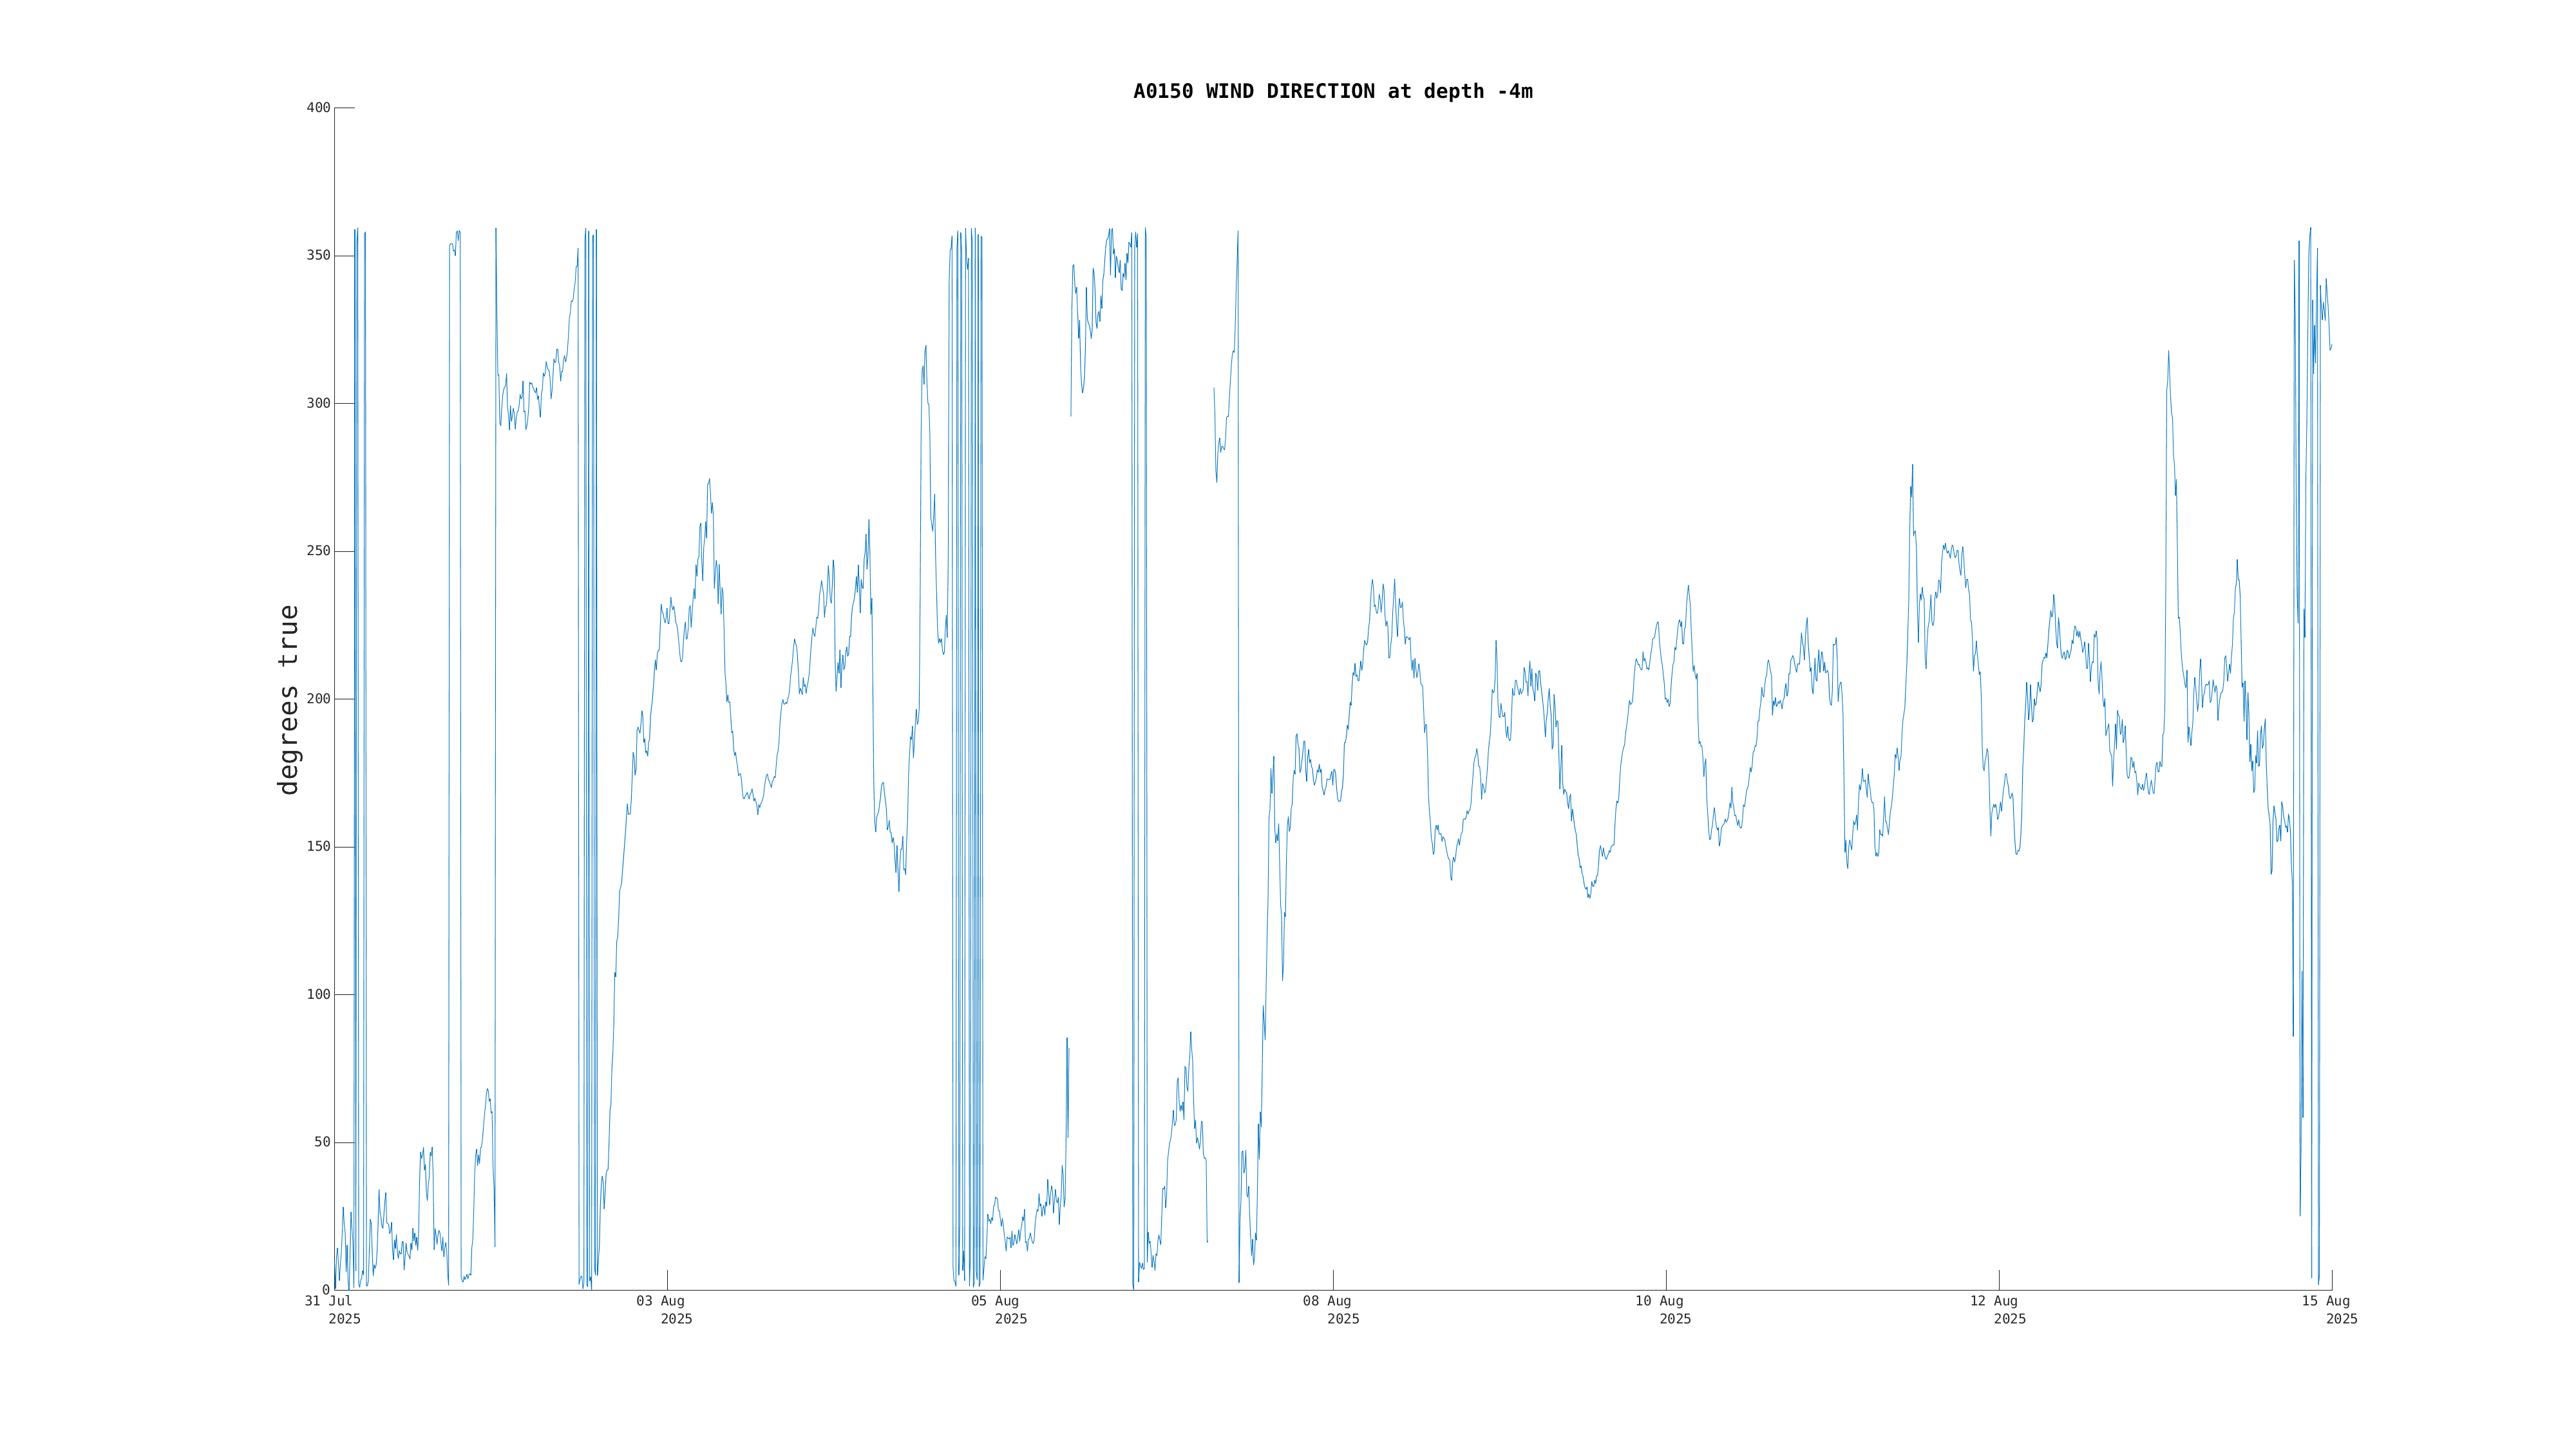
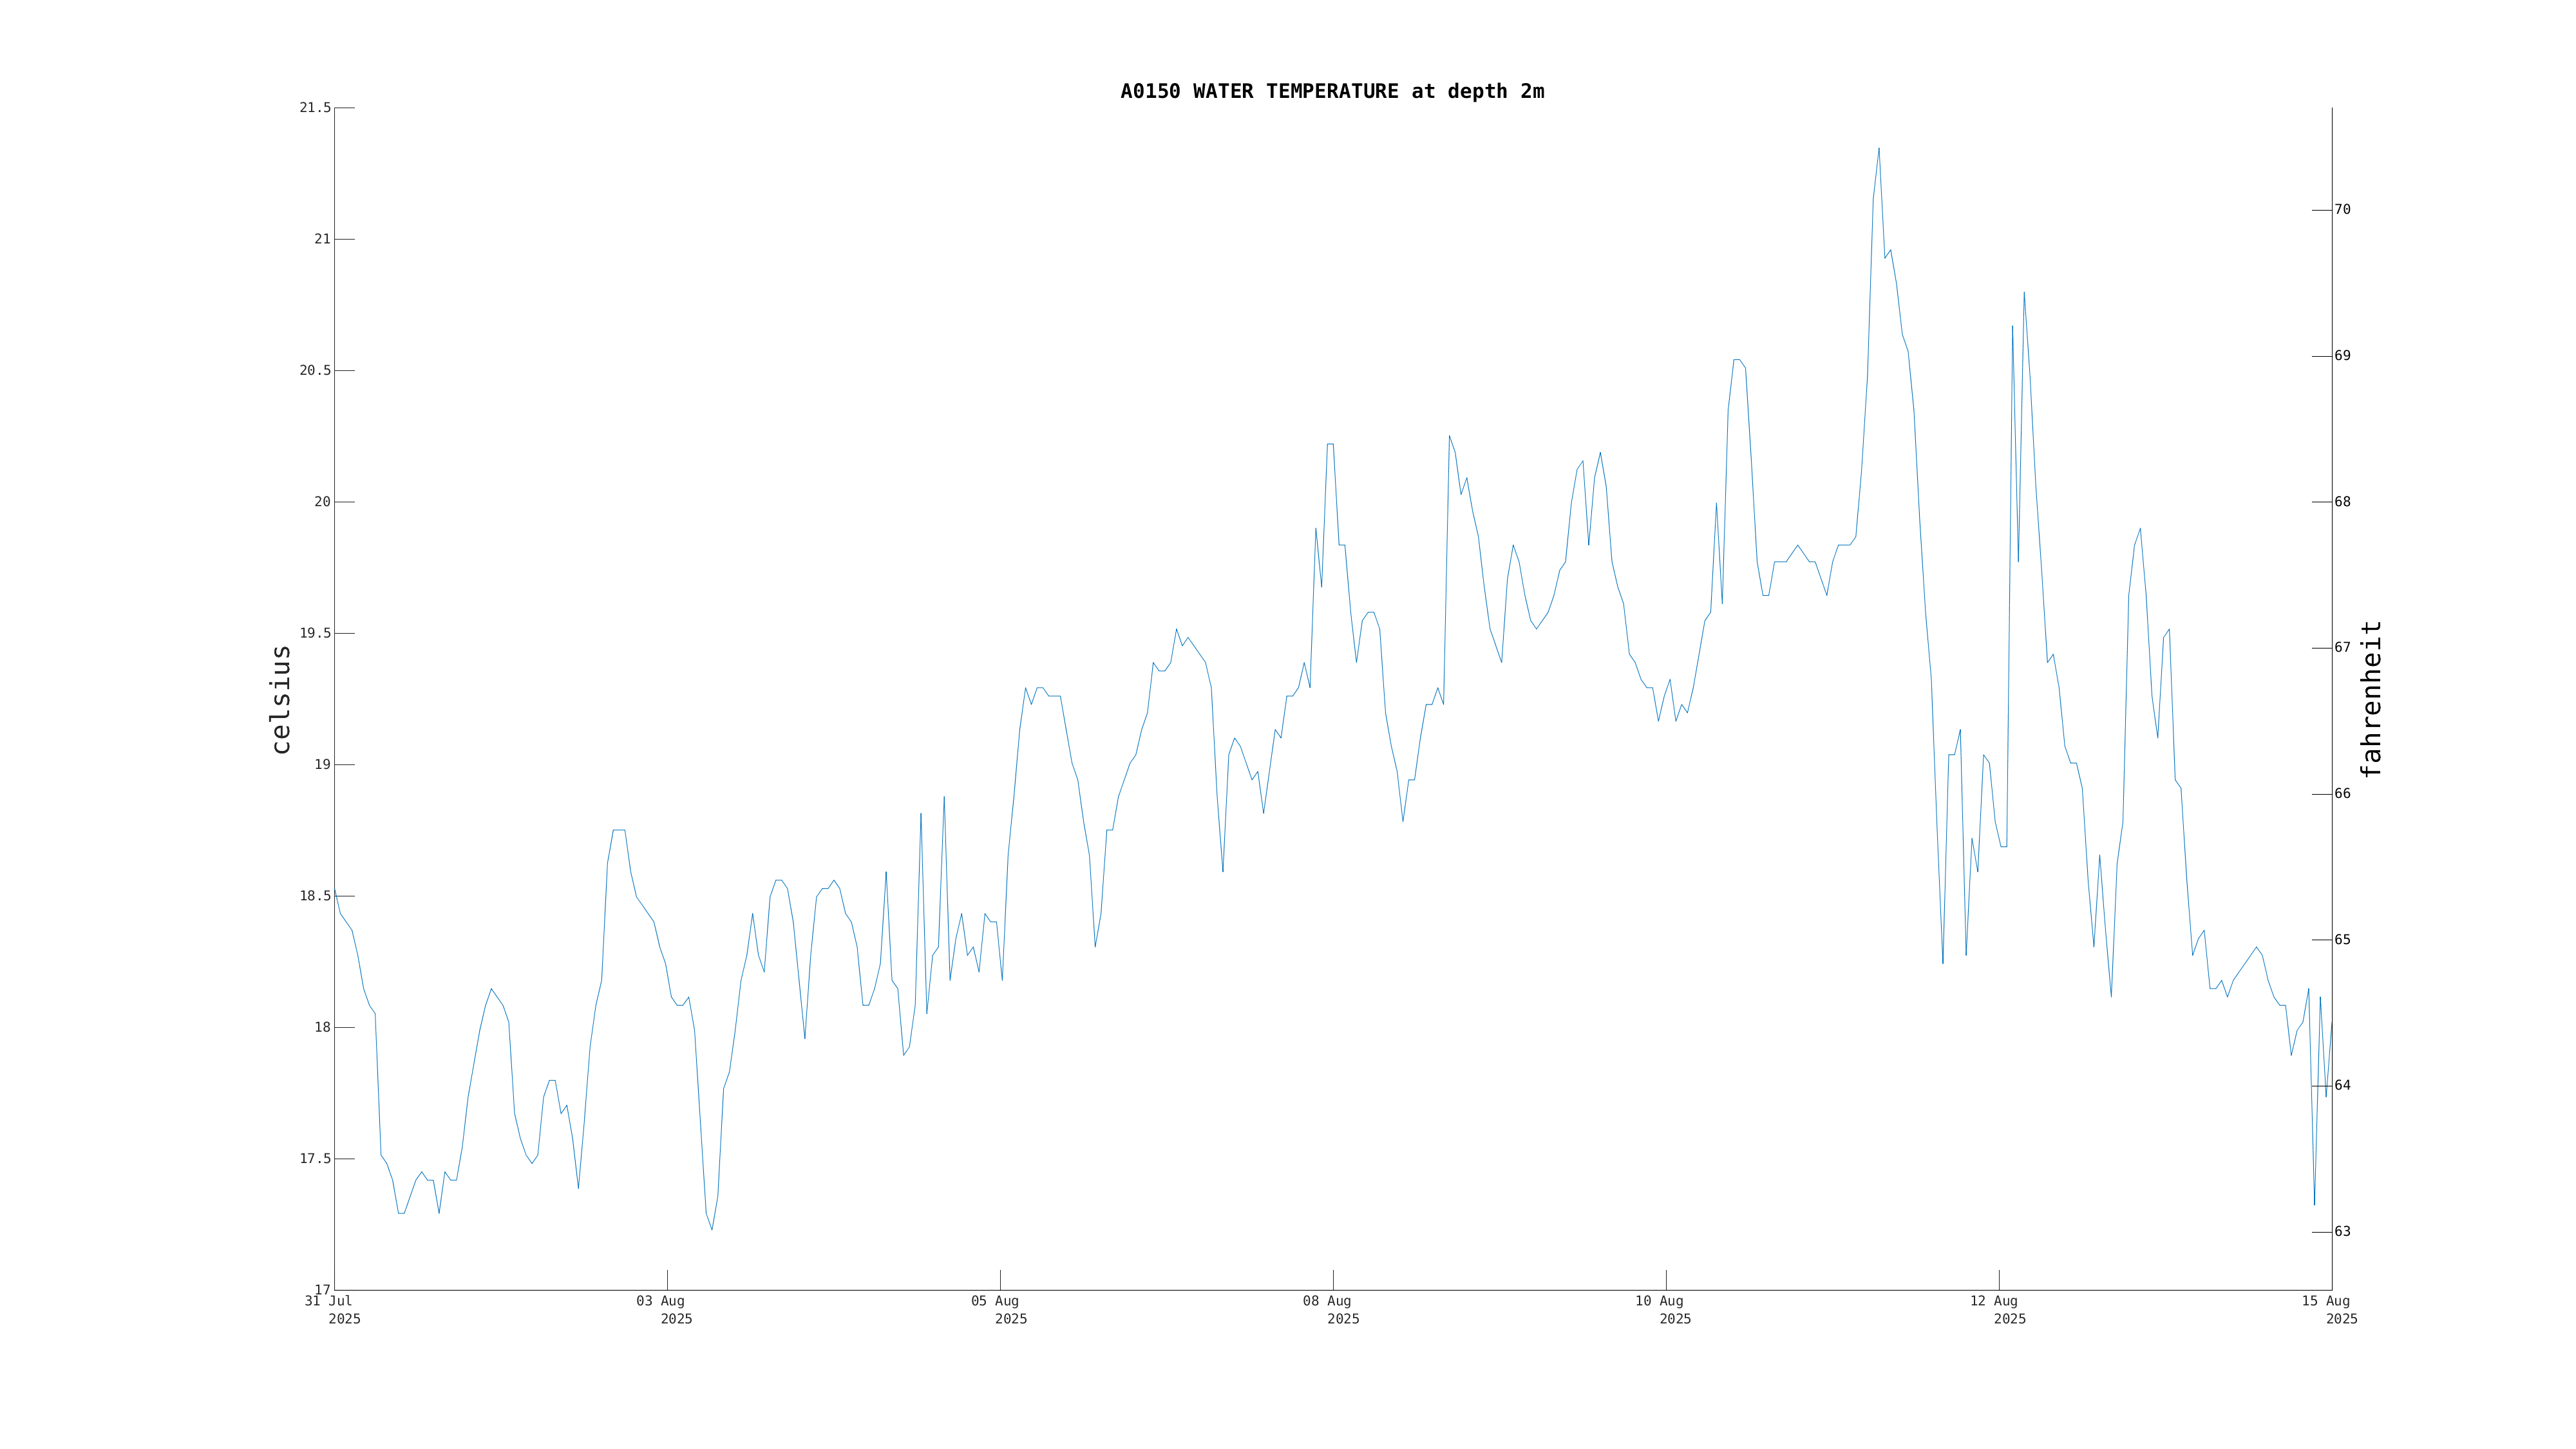
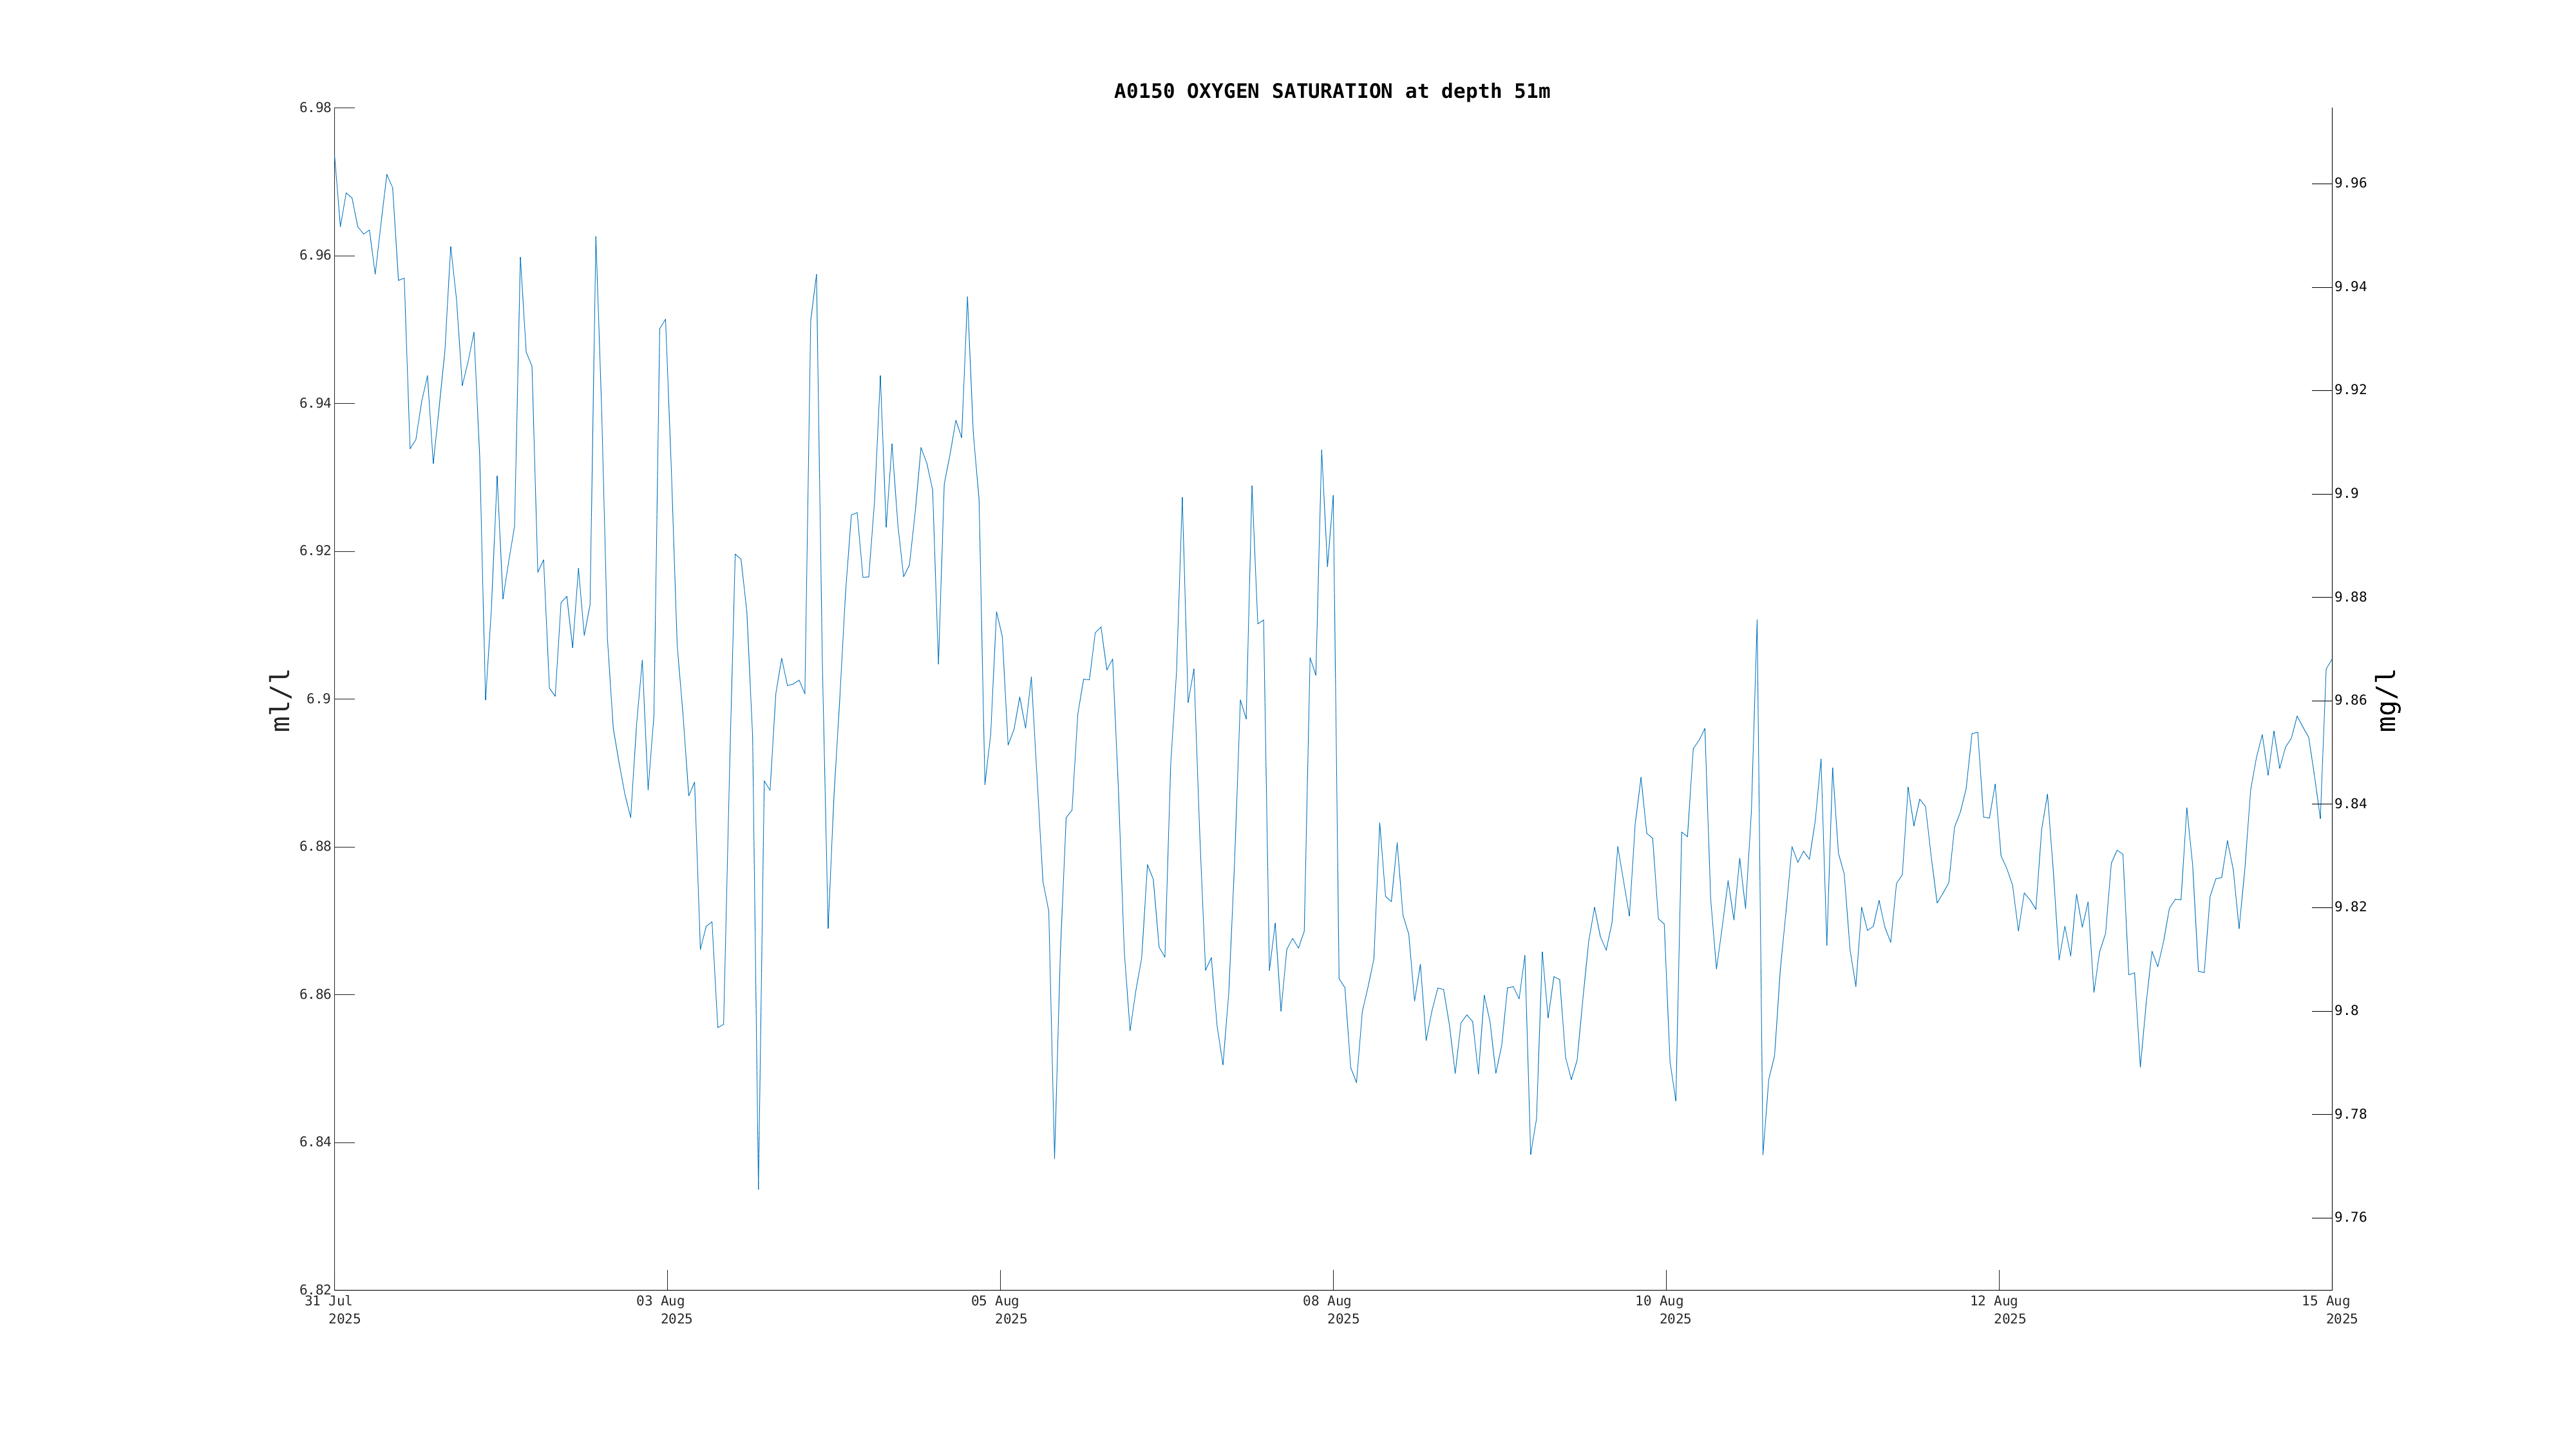
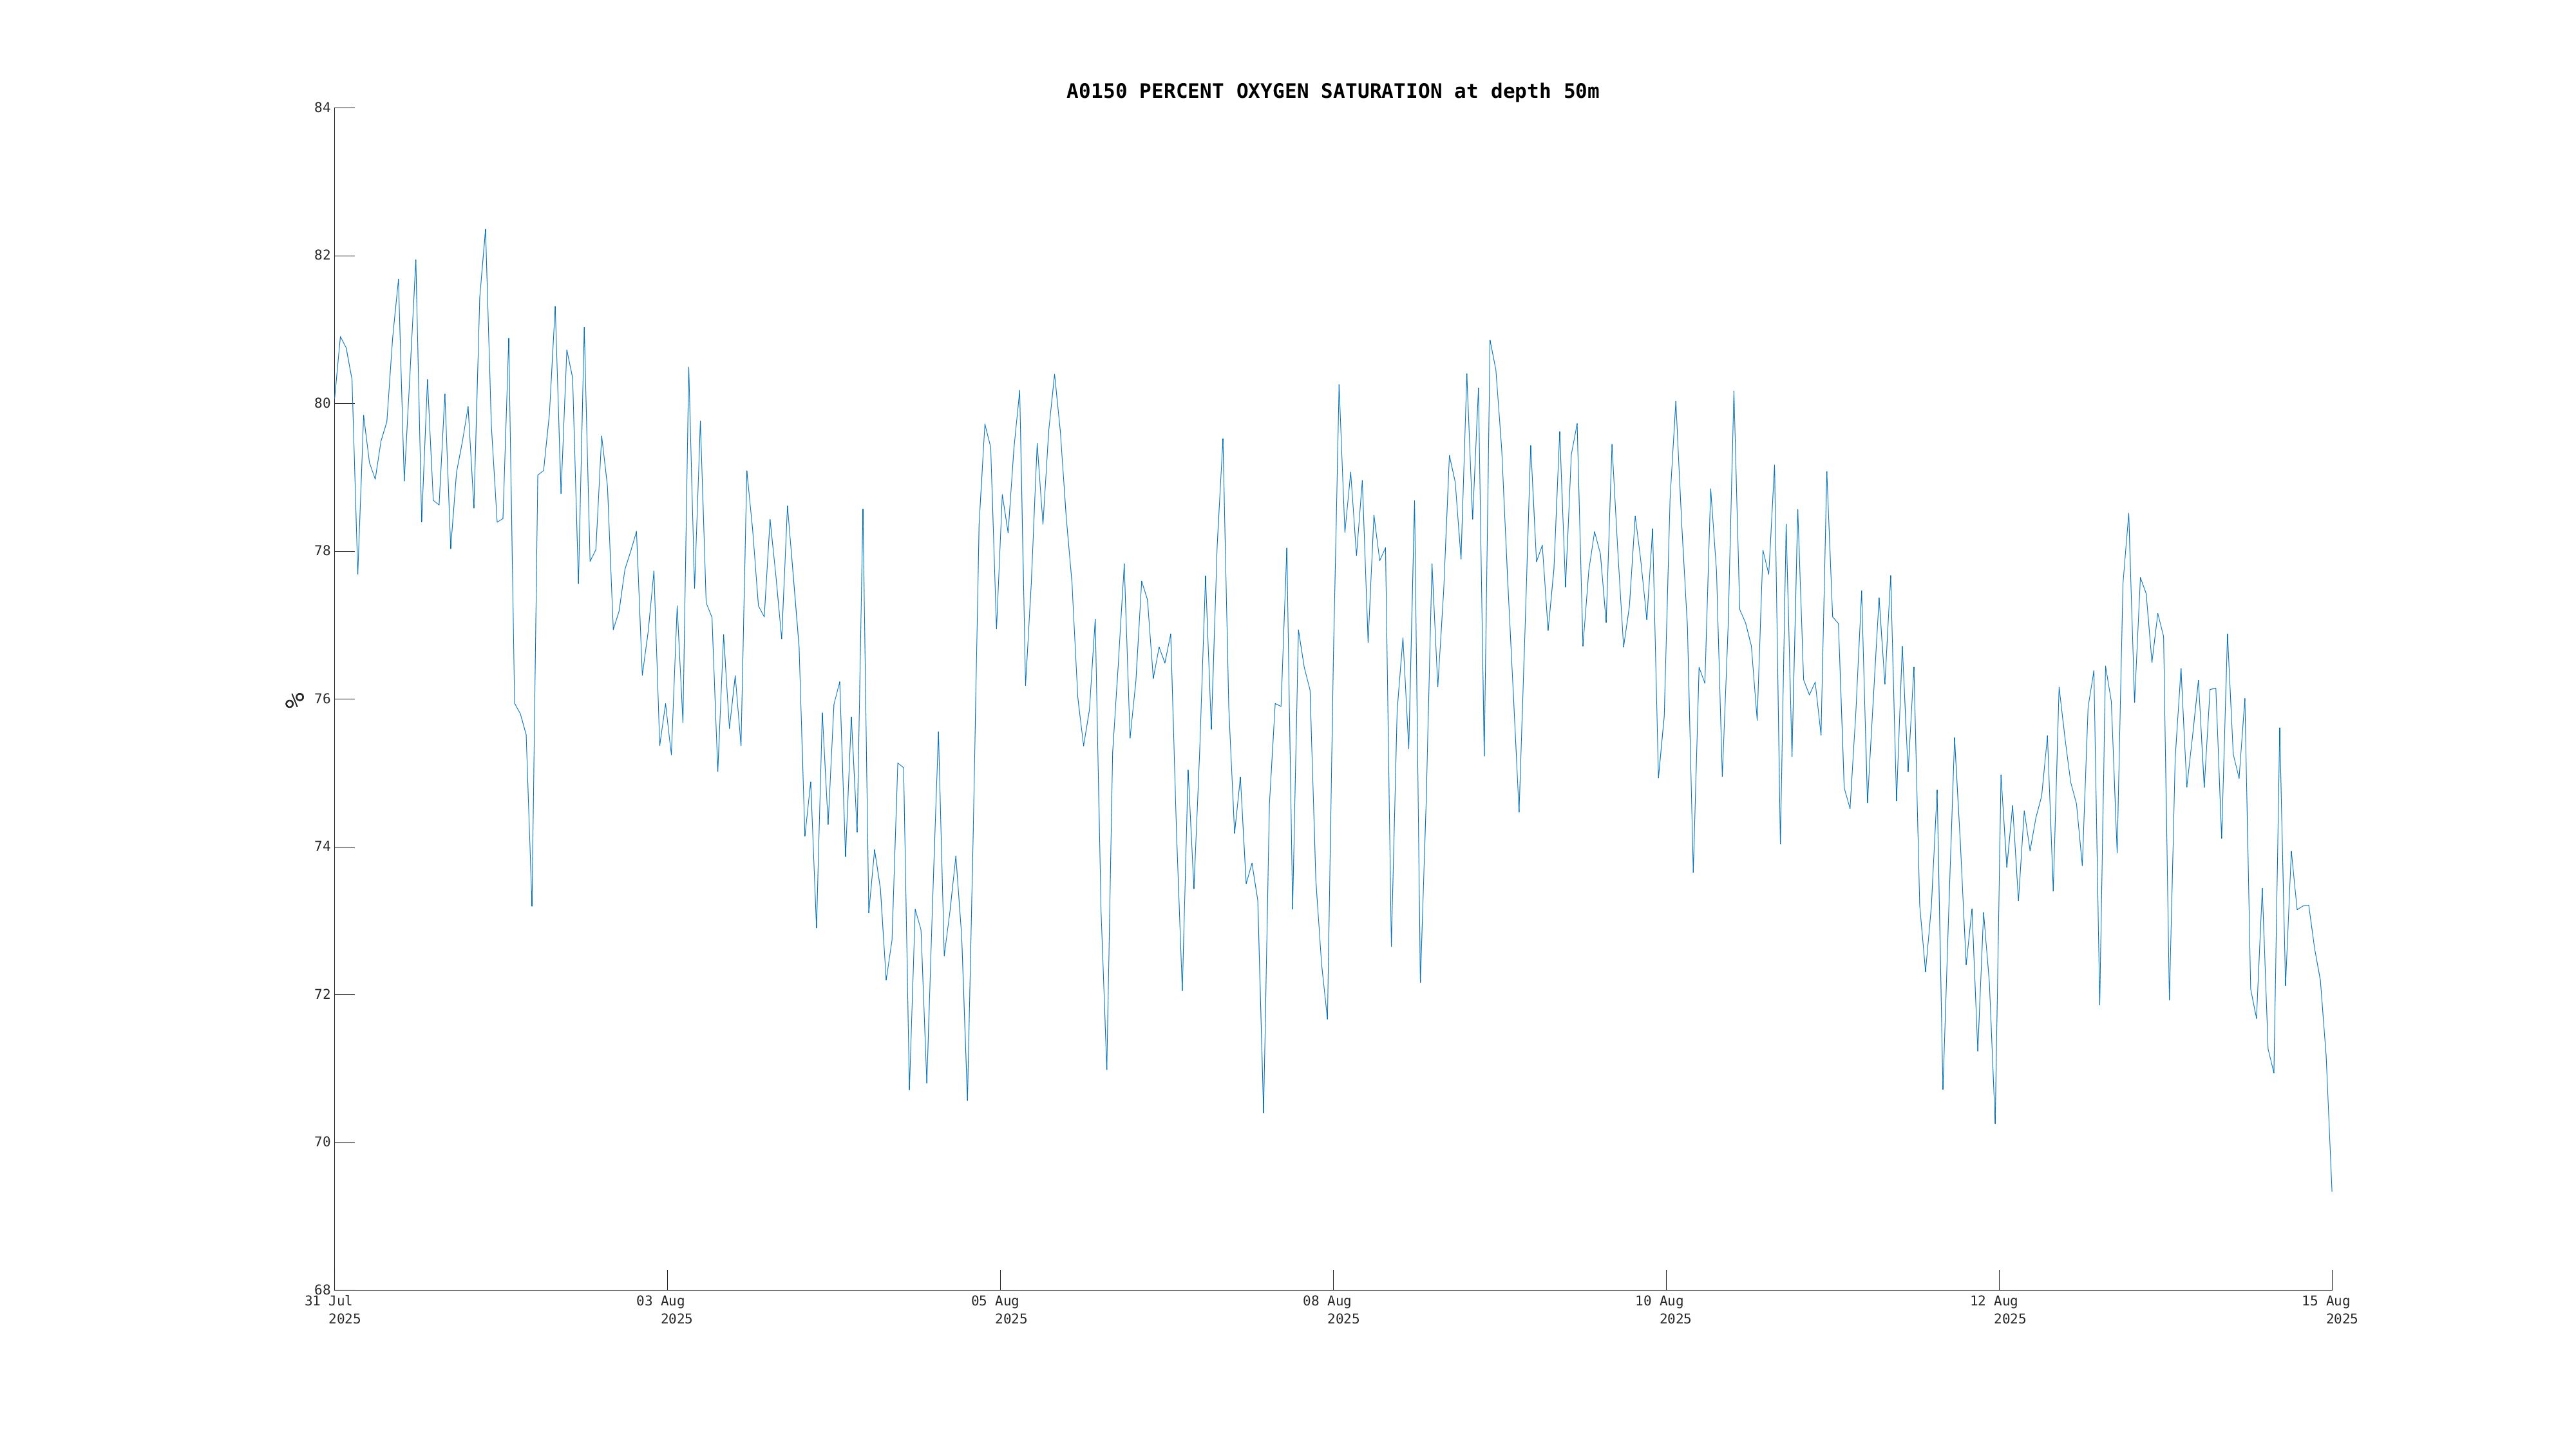
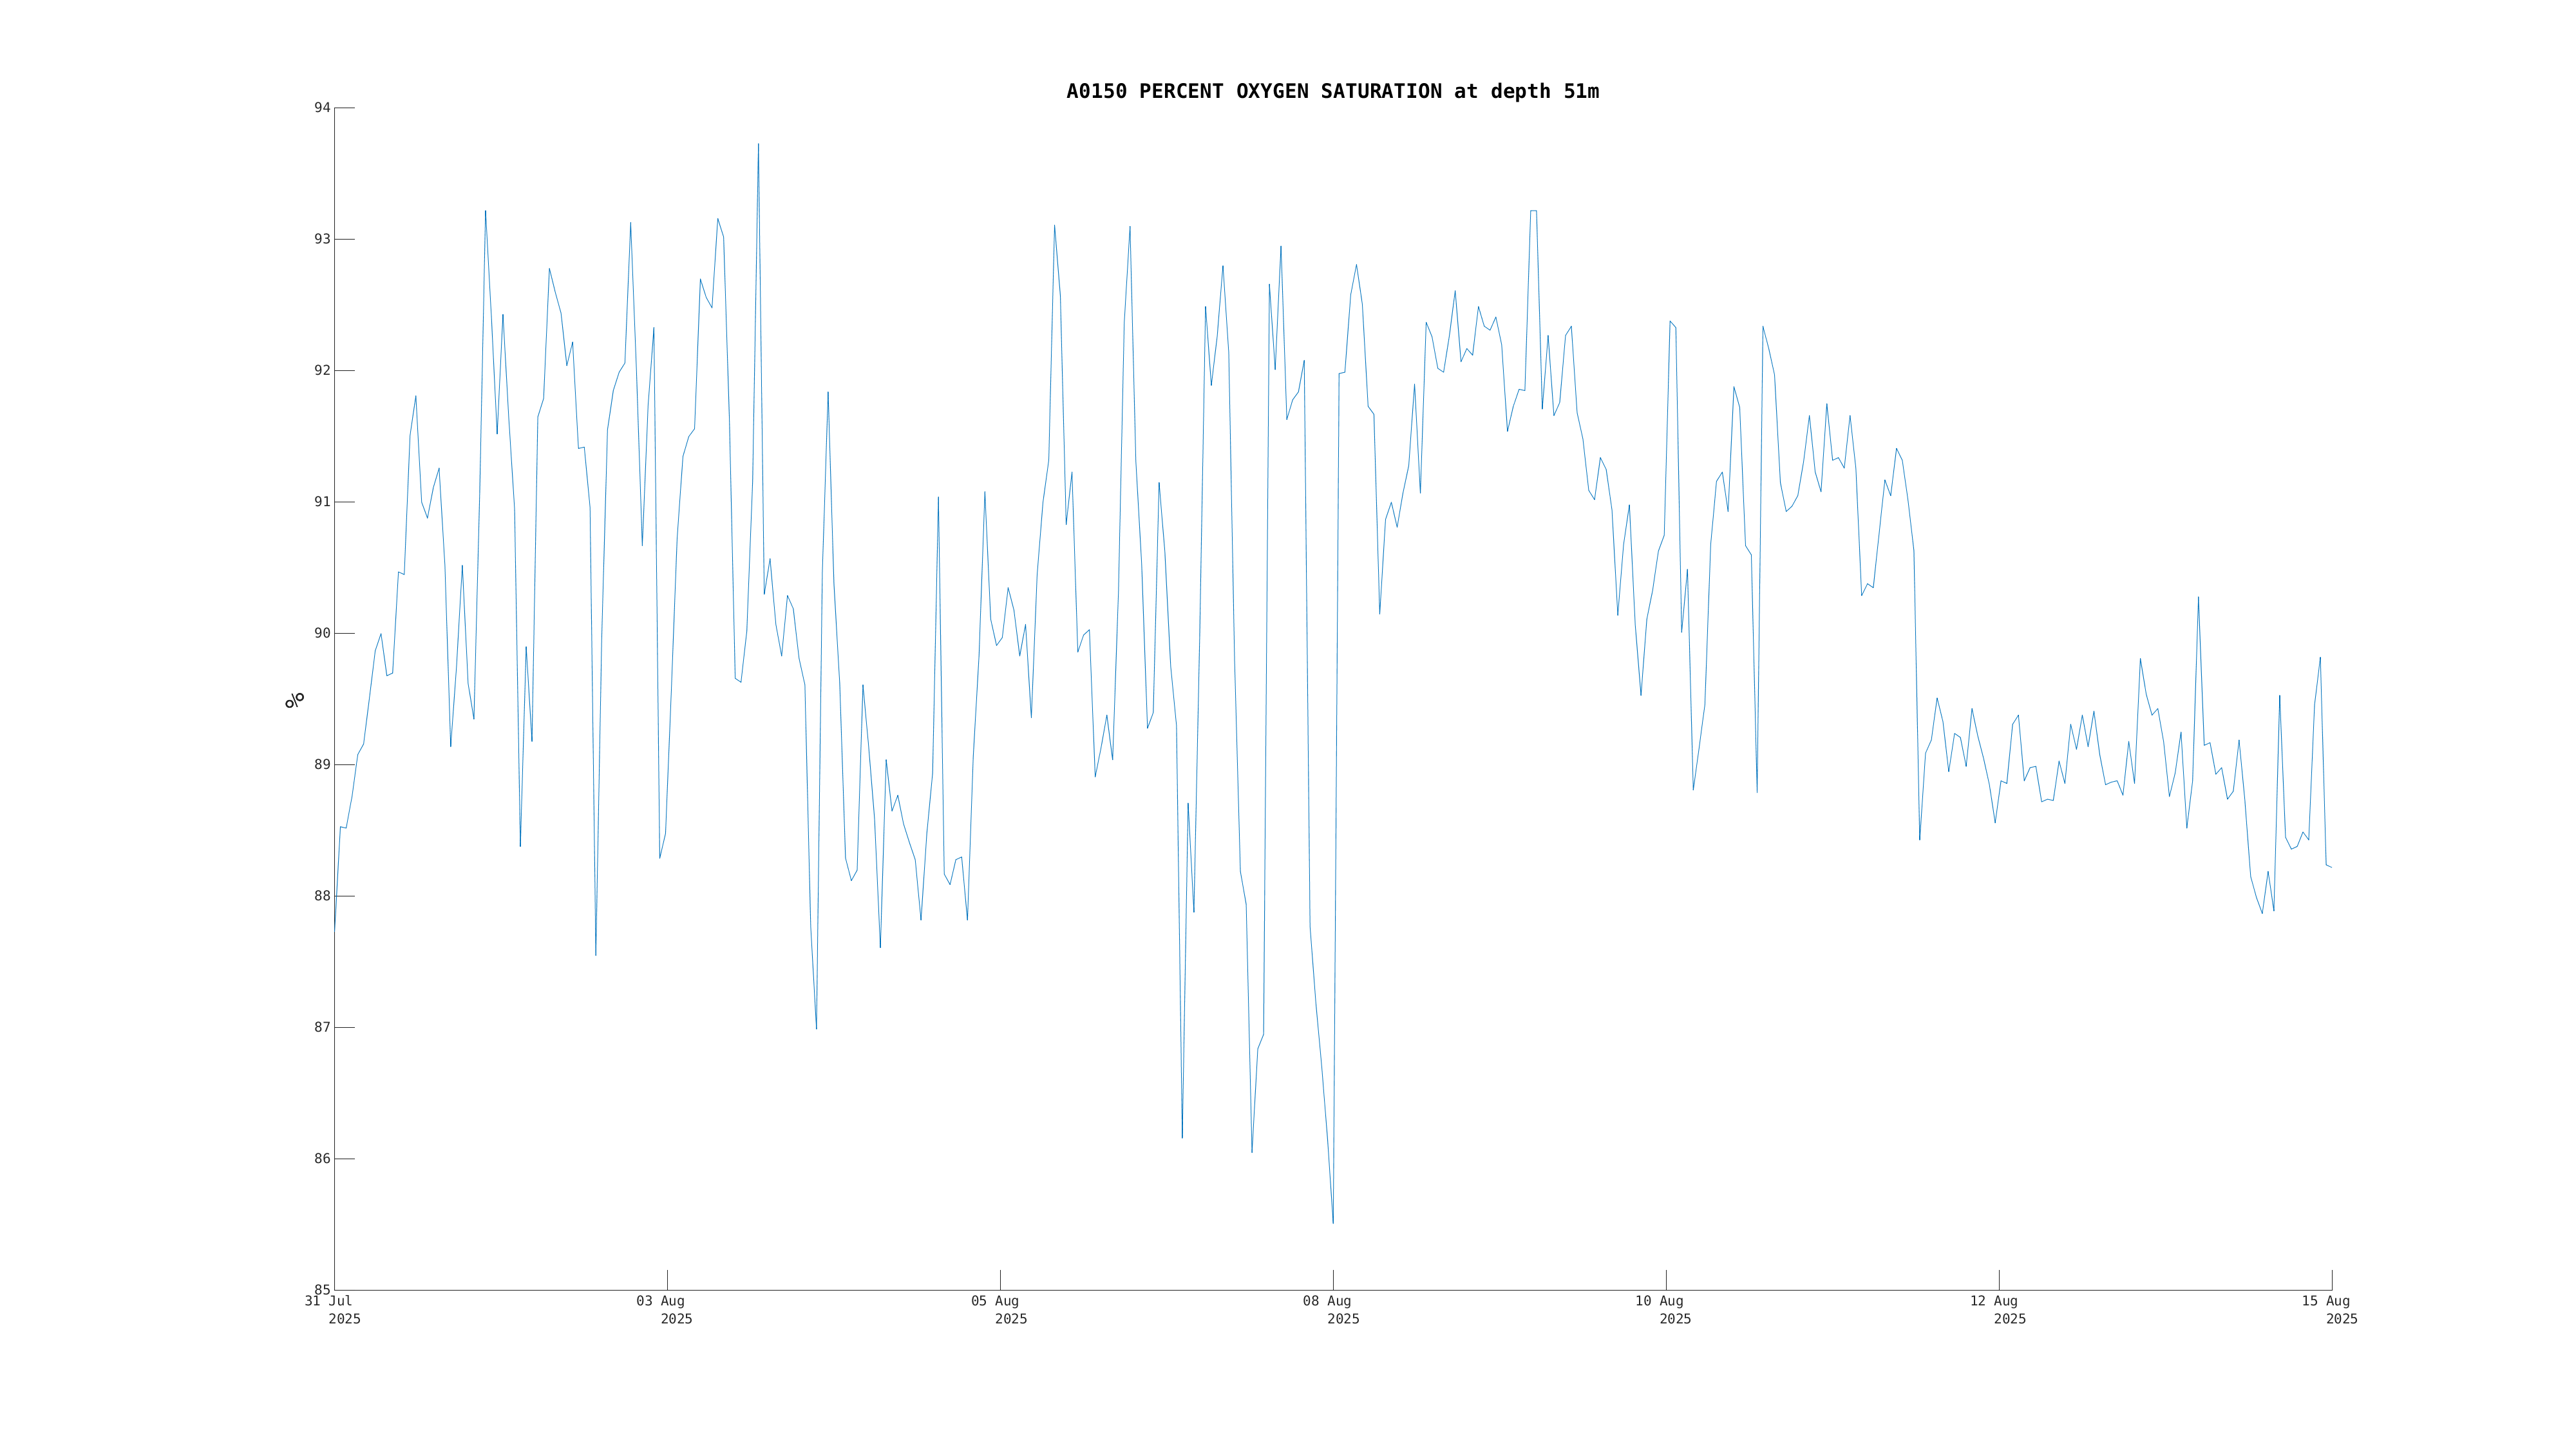
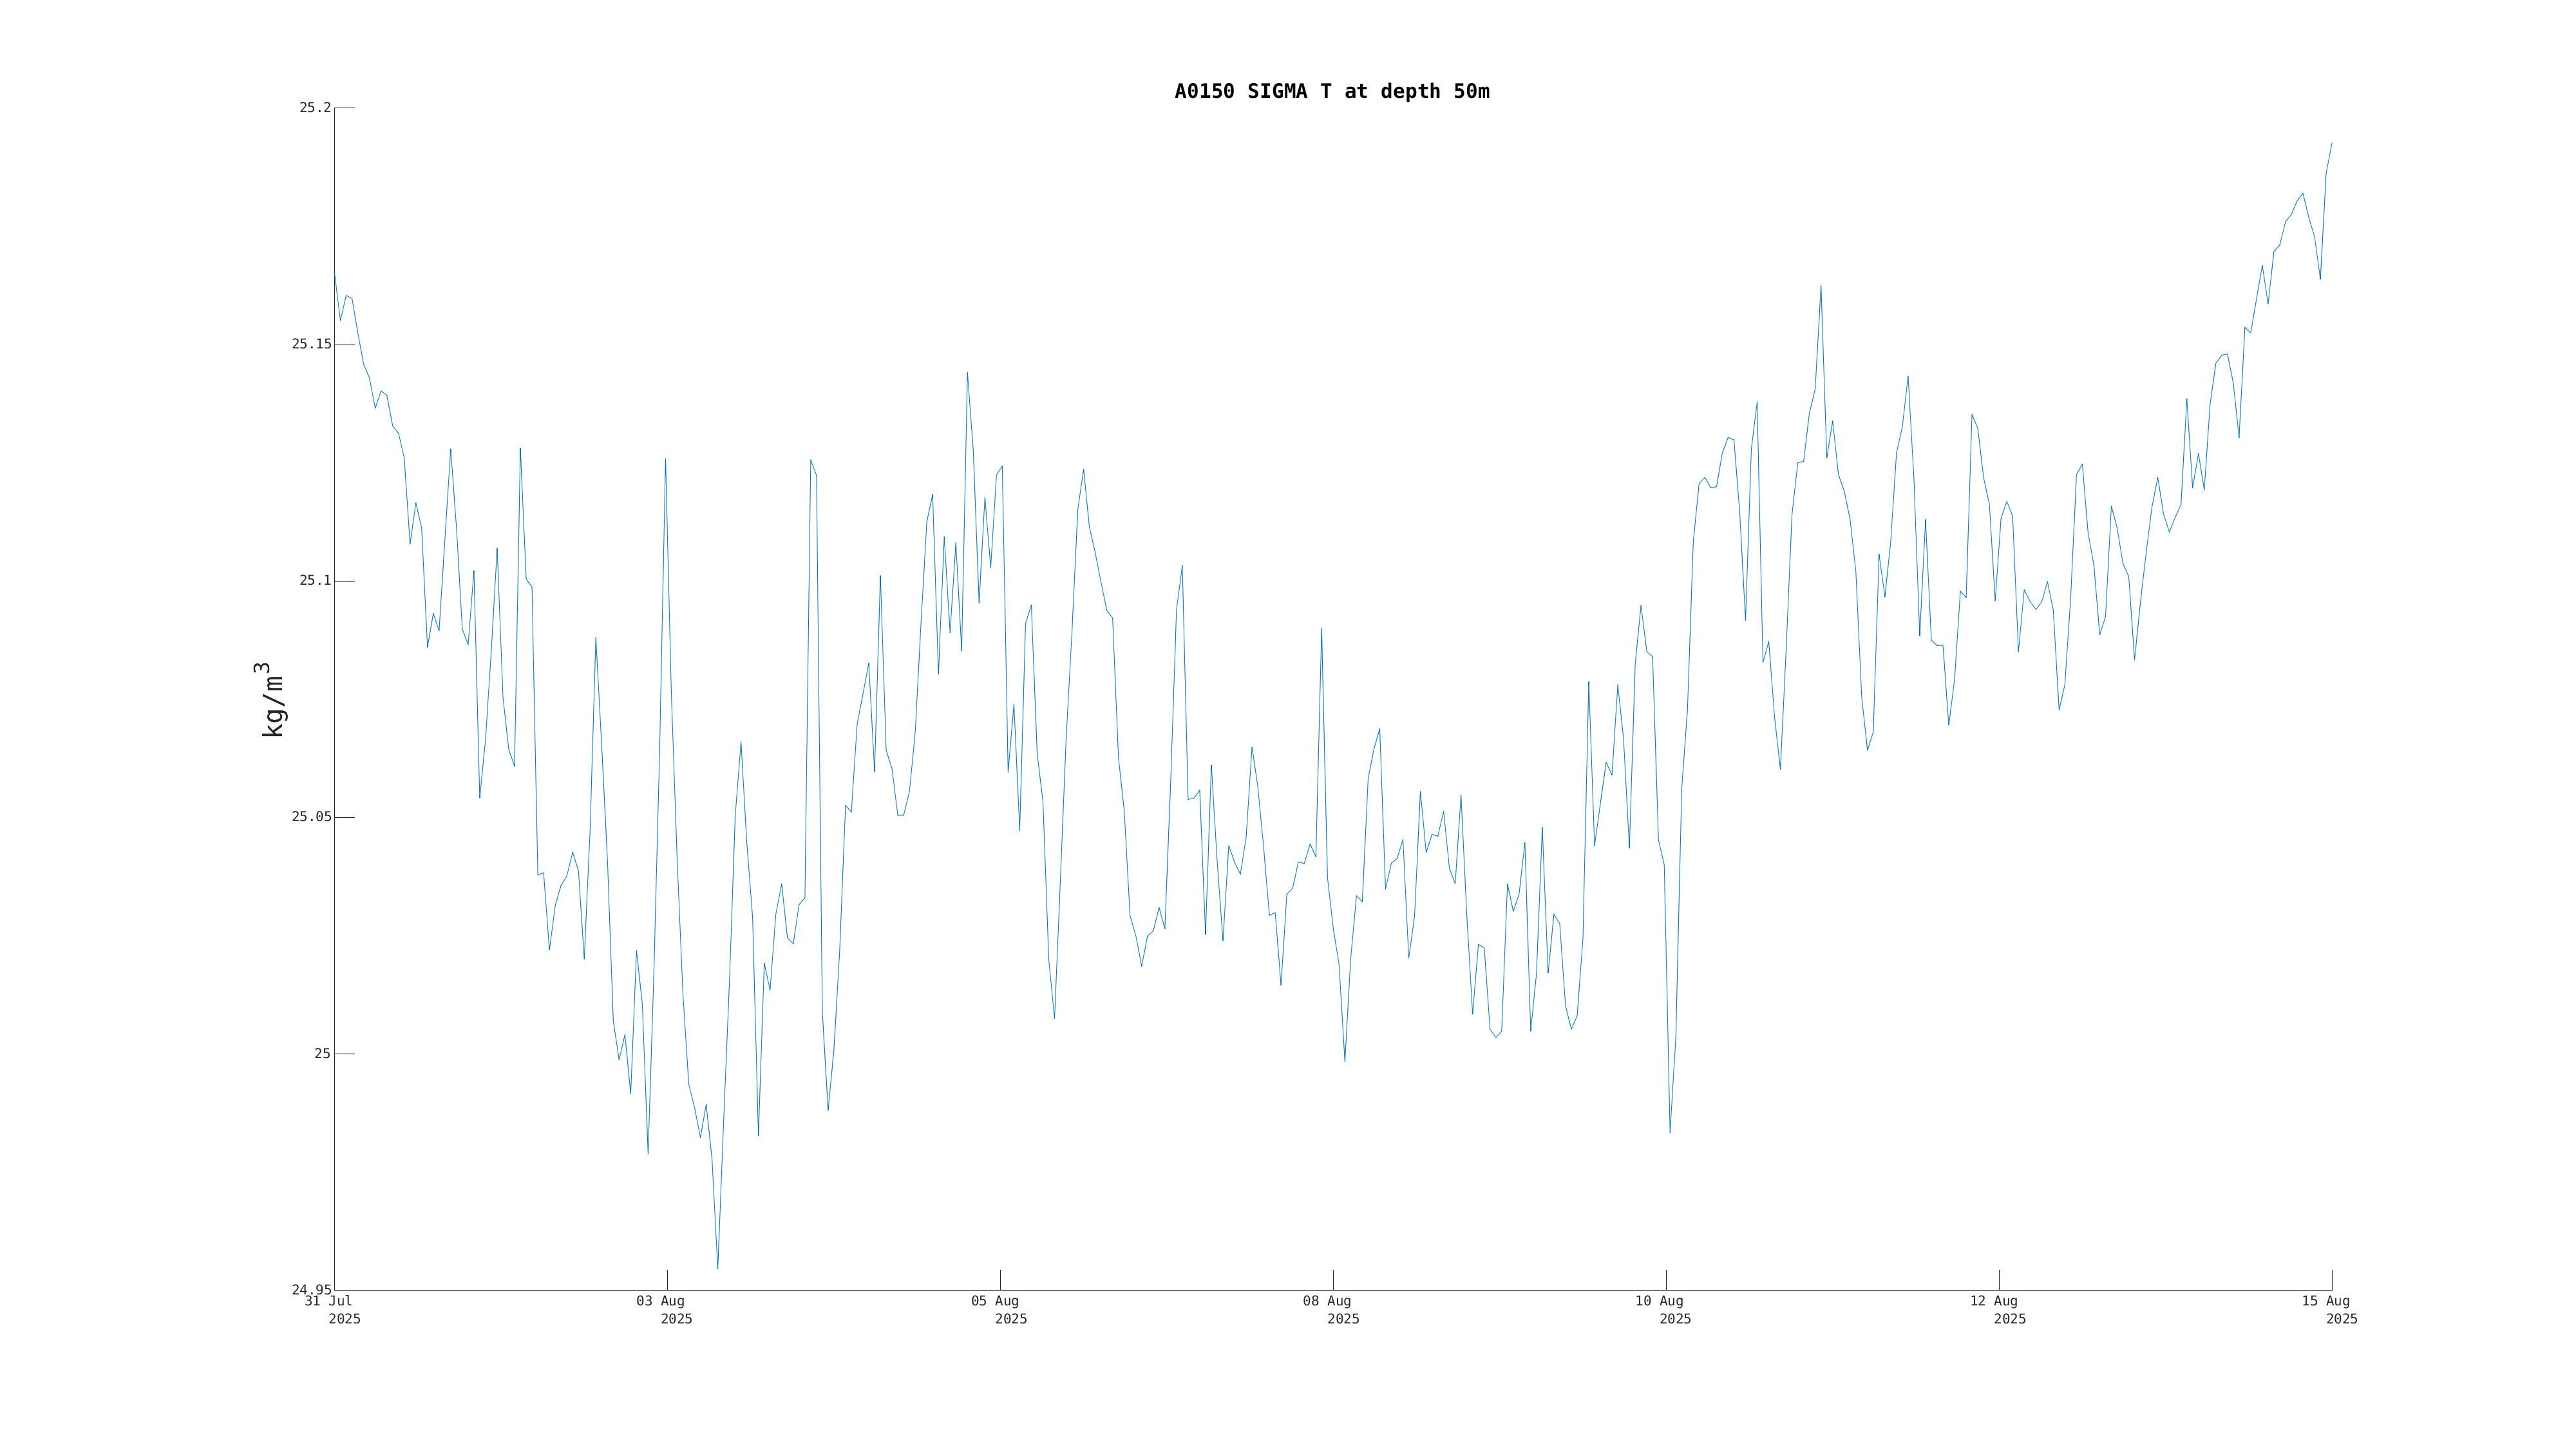
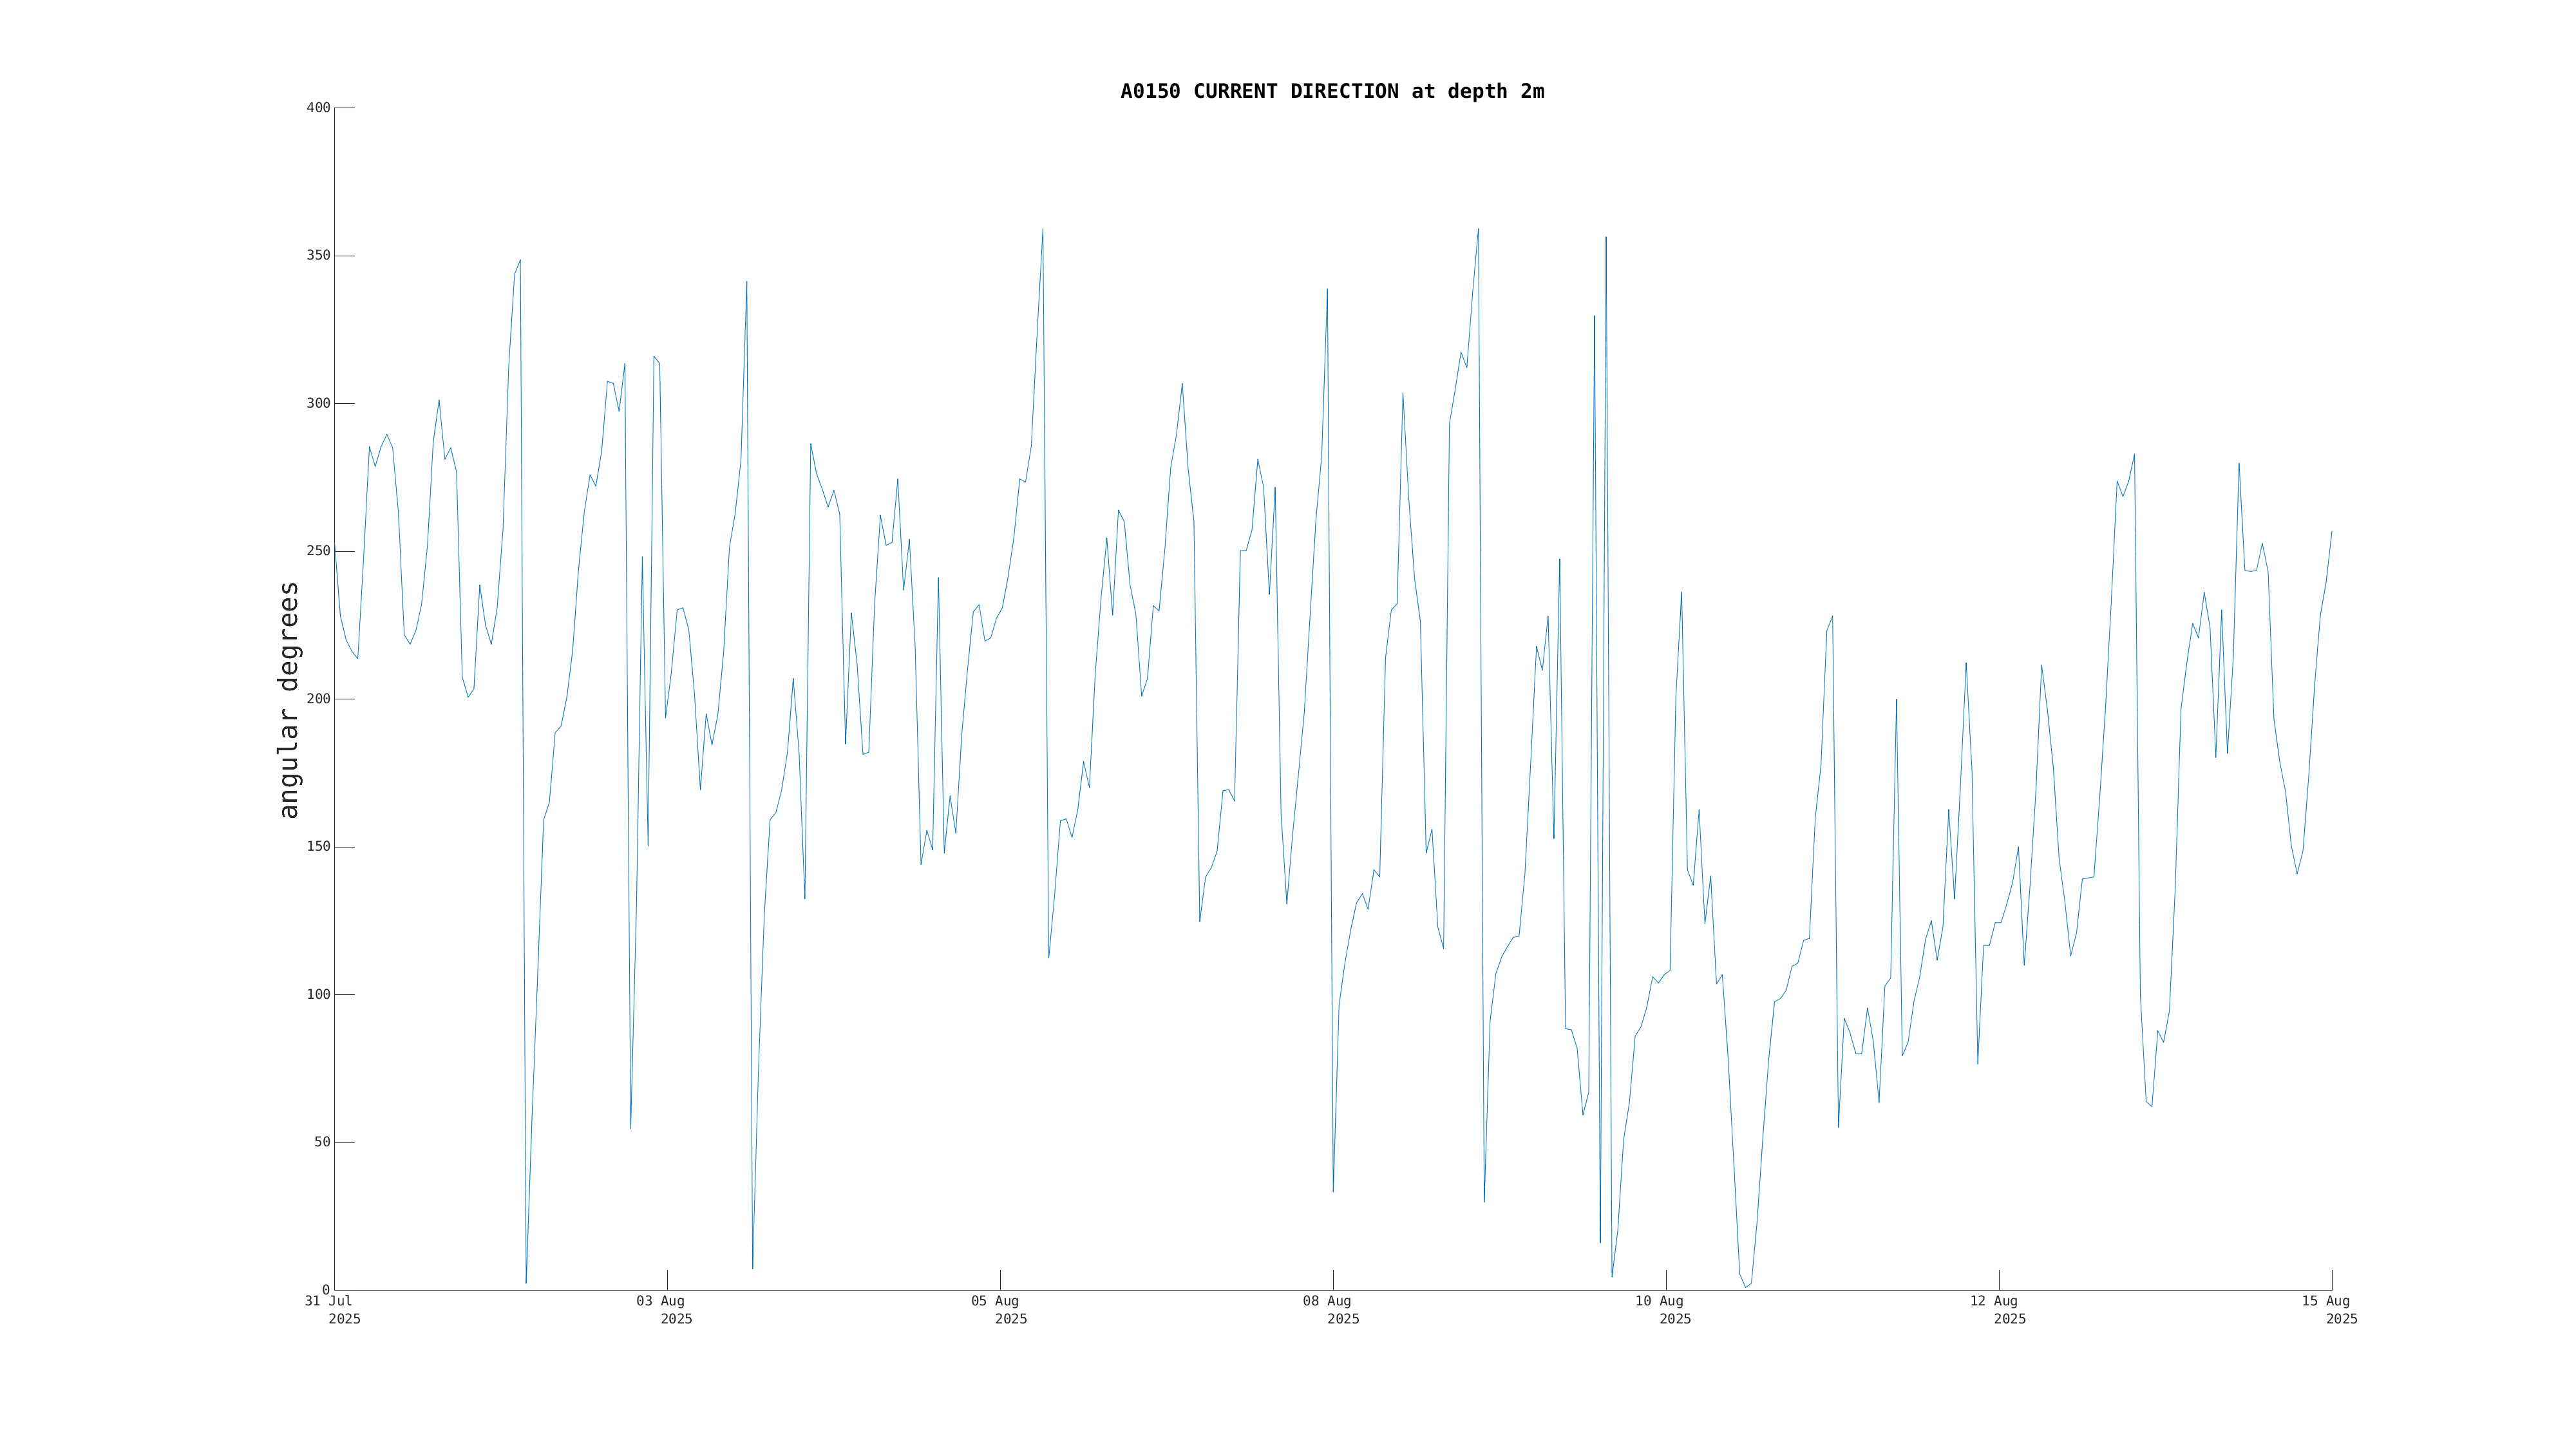
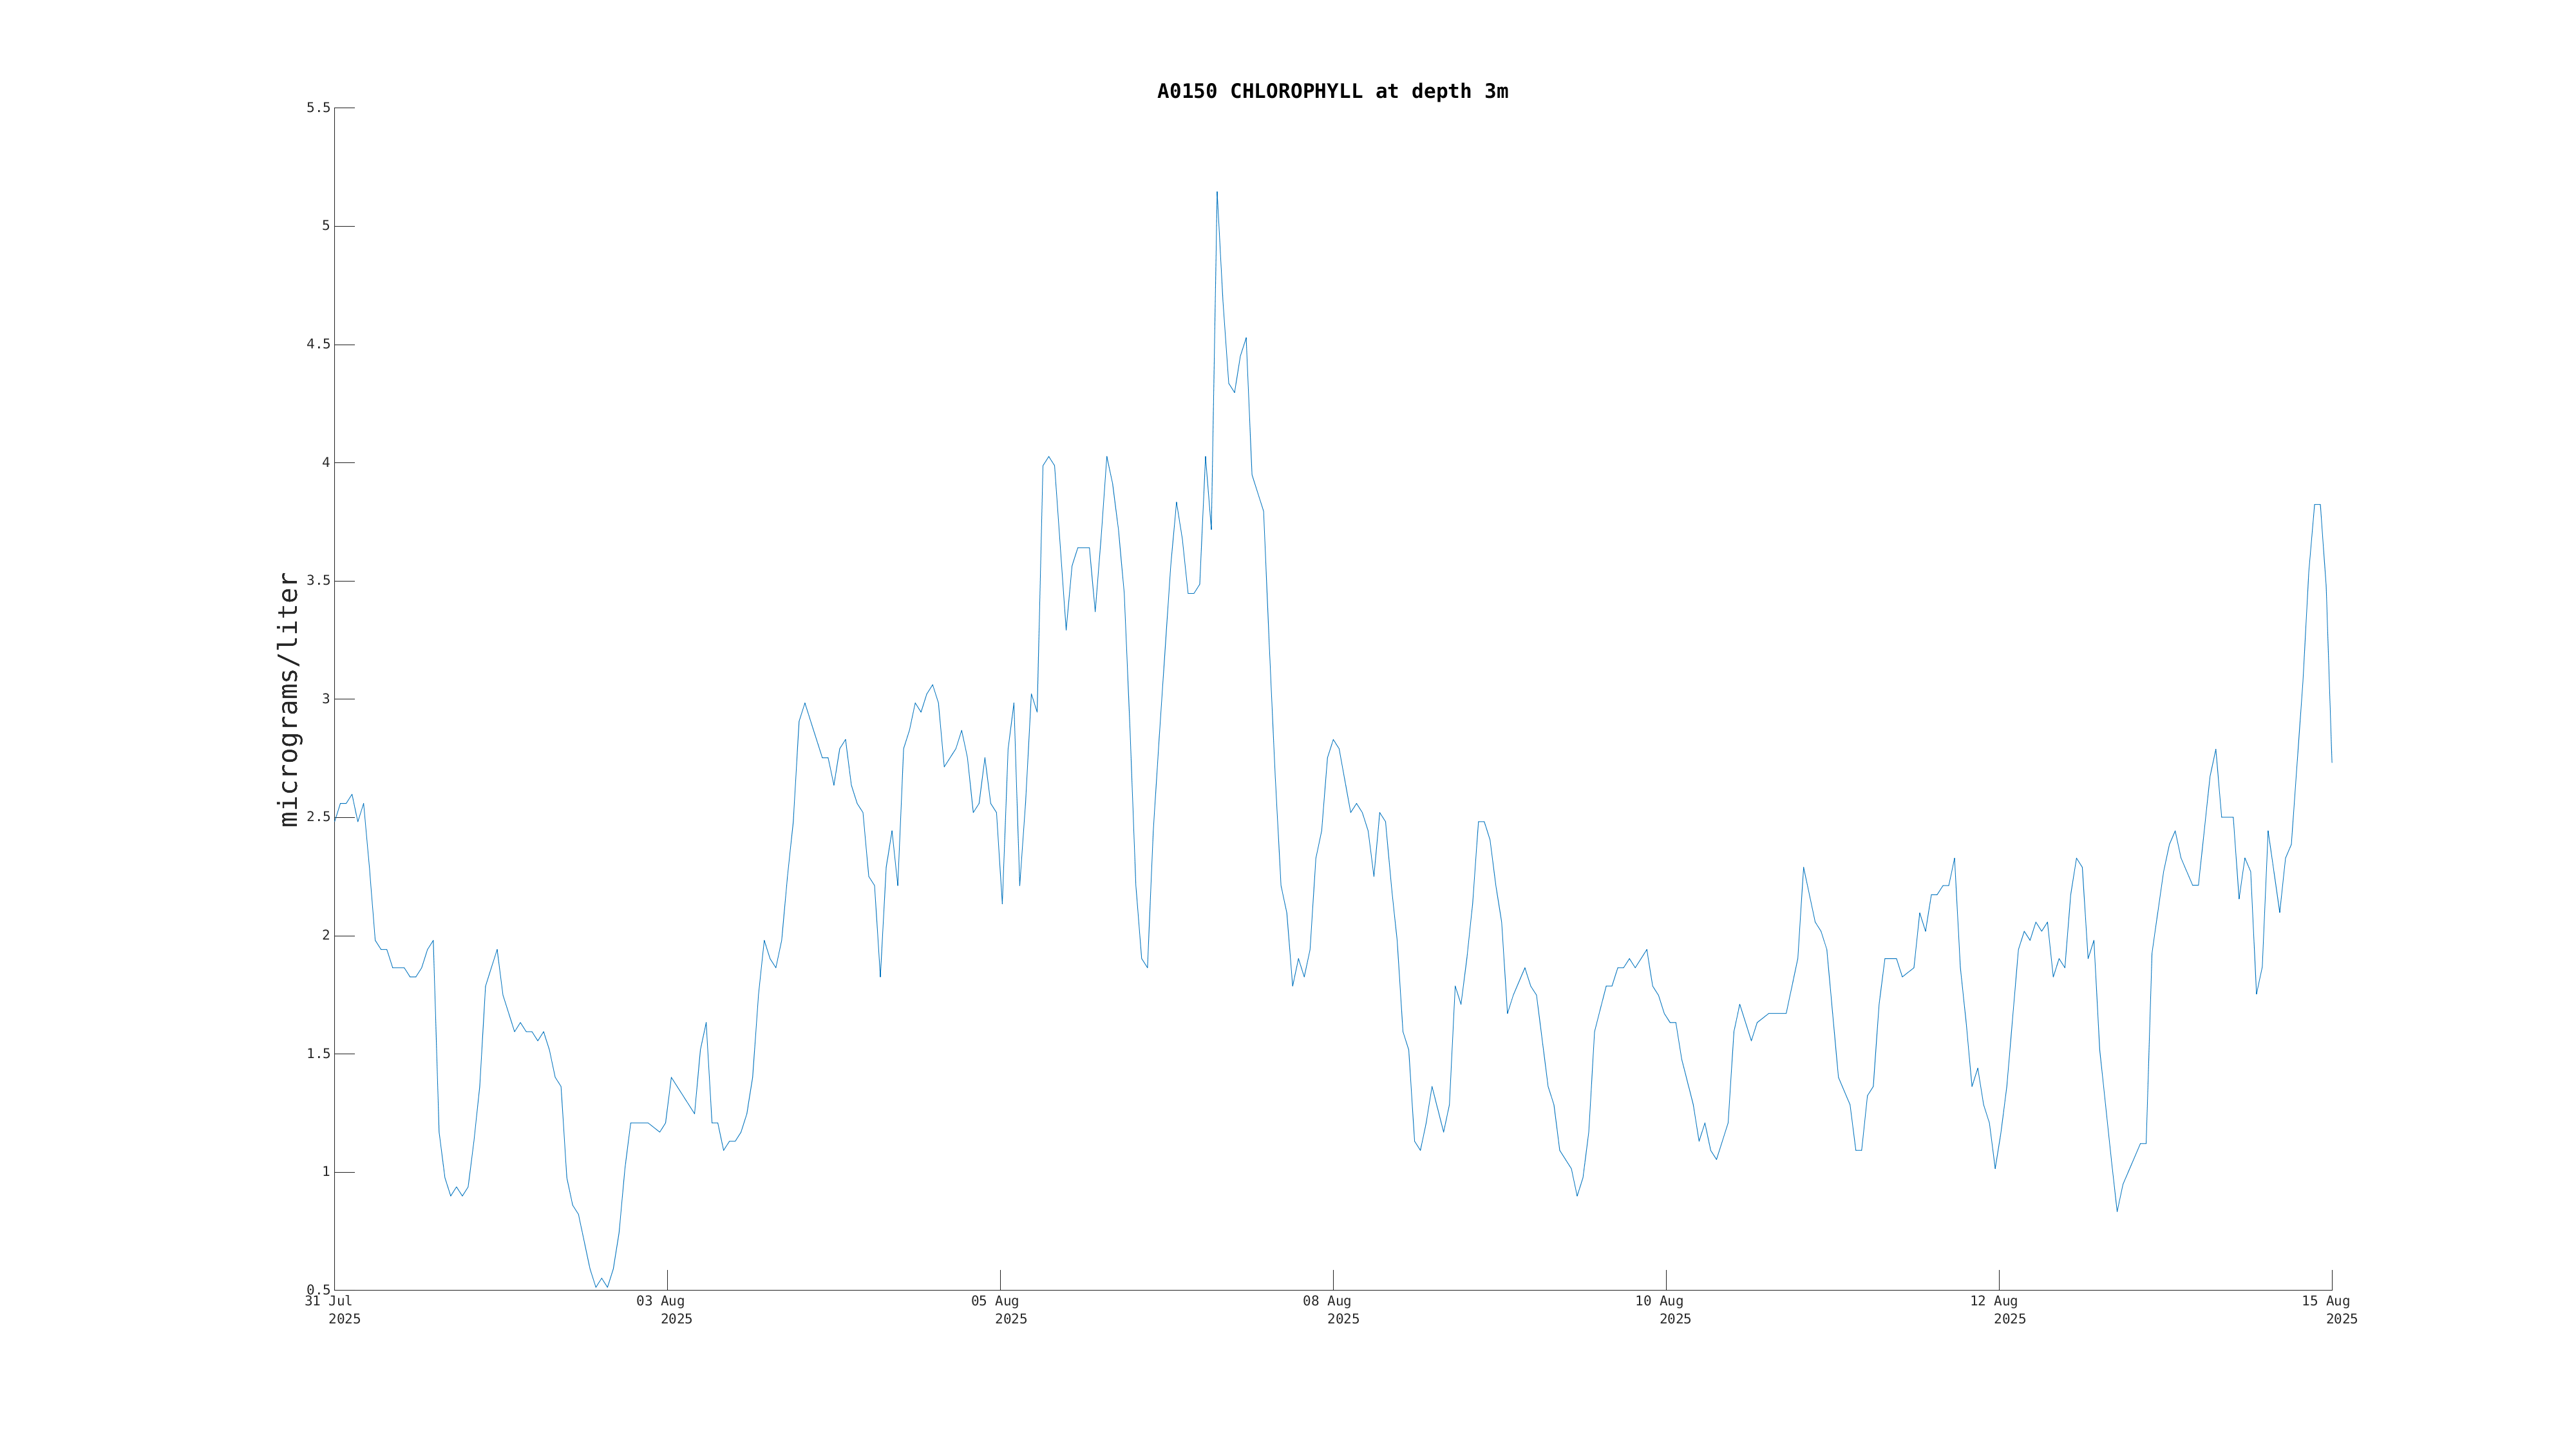
 This Deployment:
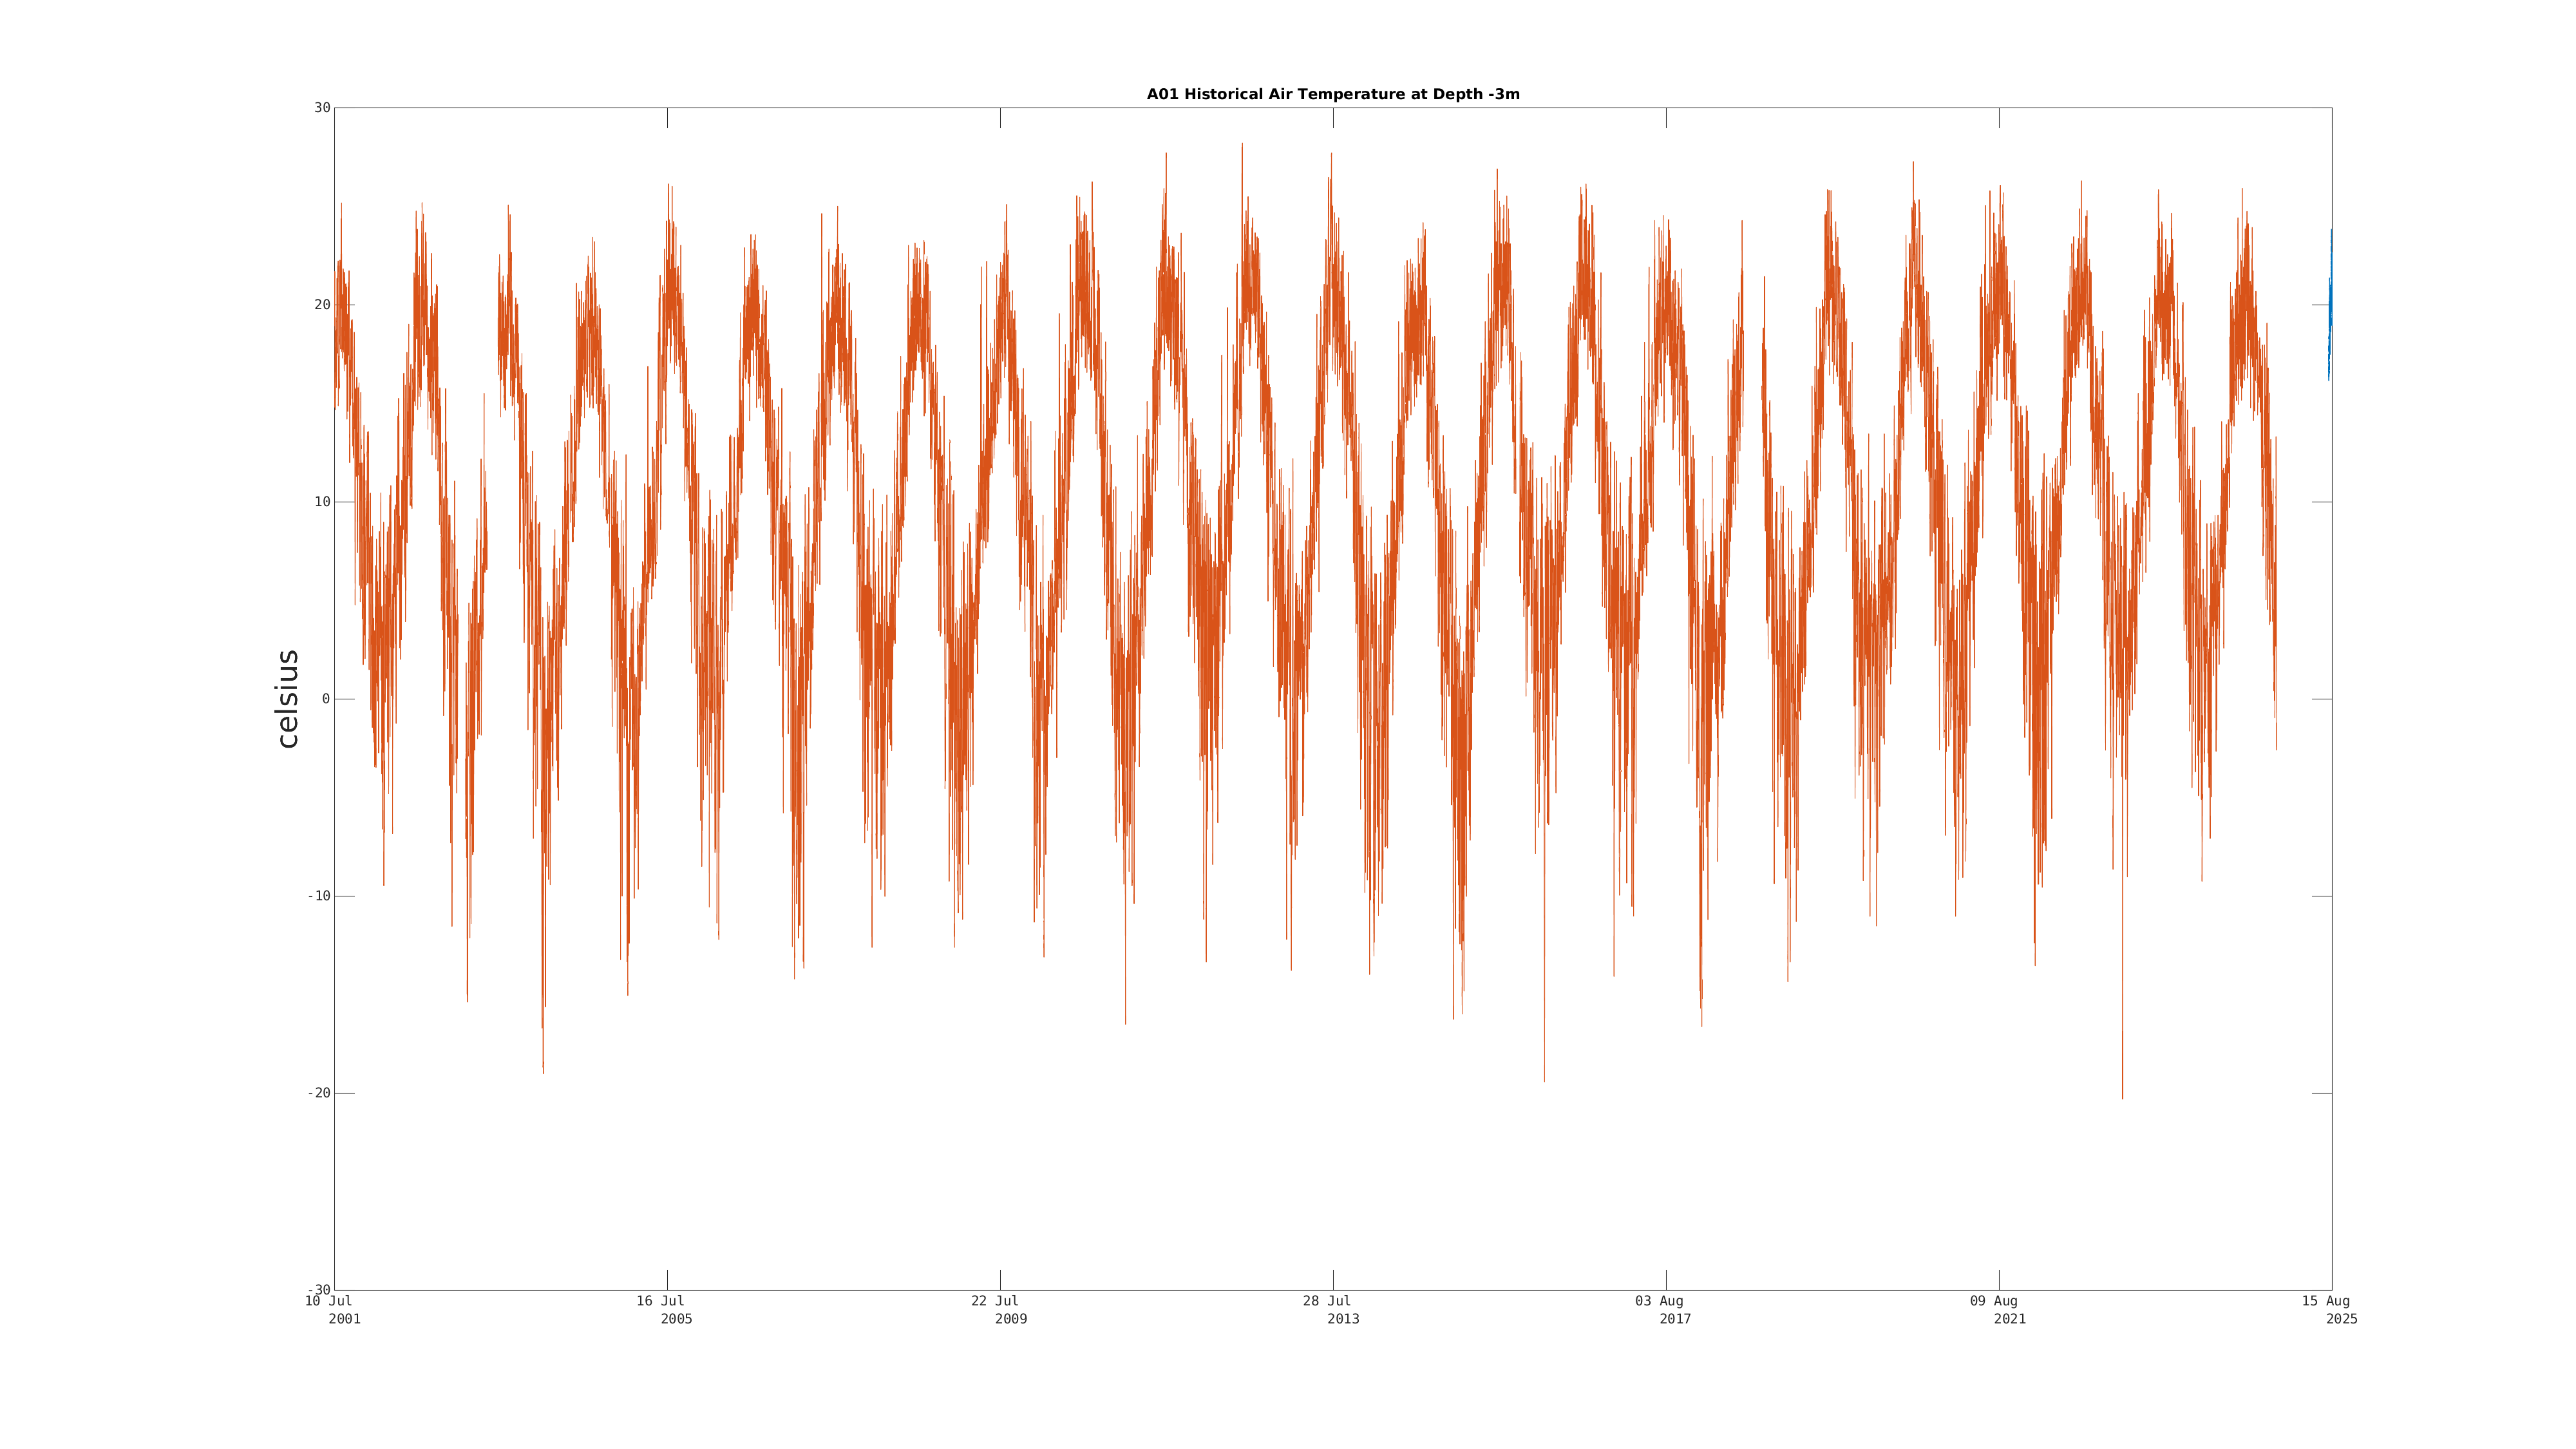
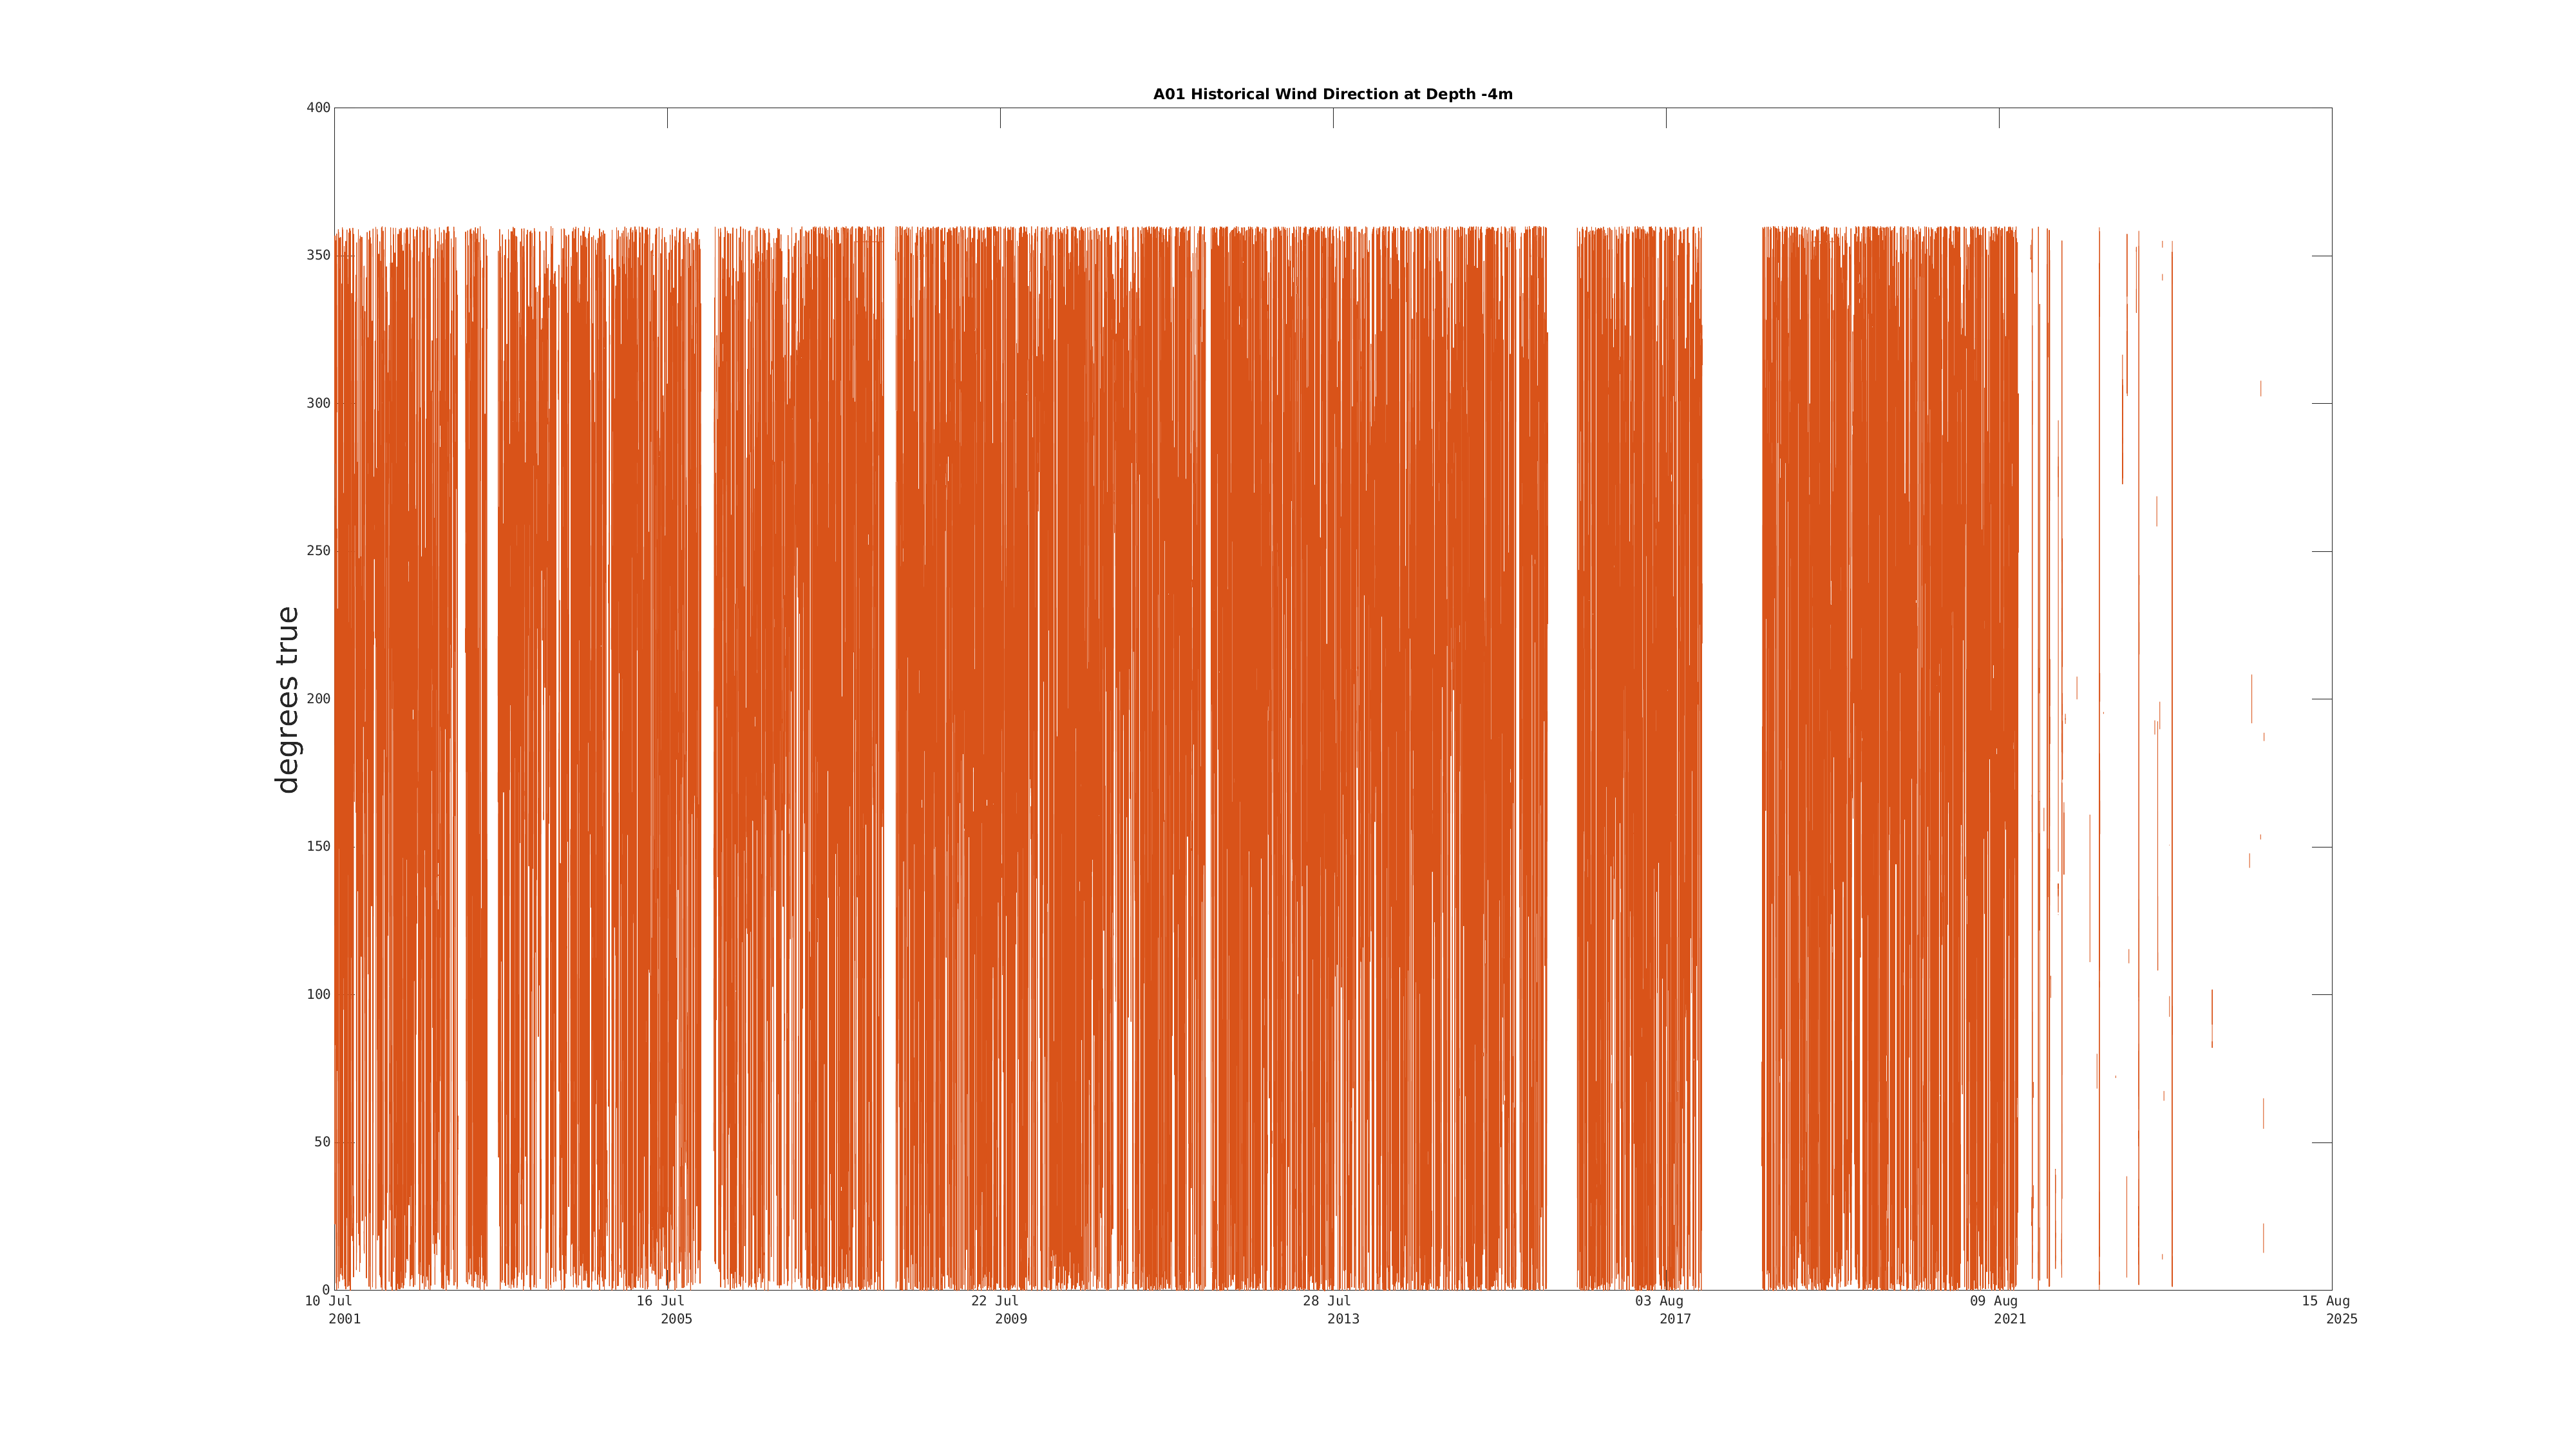
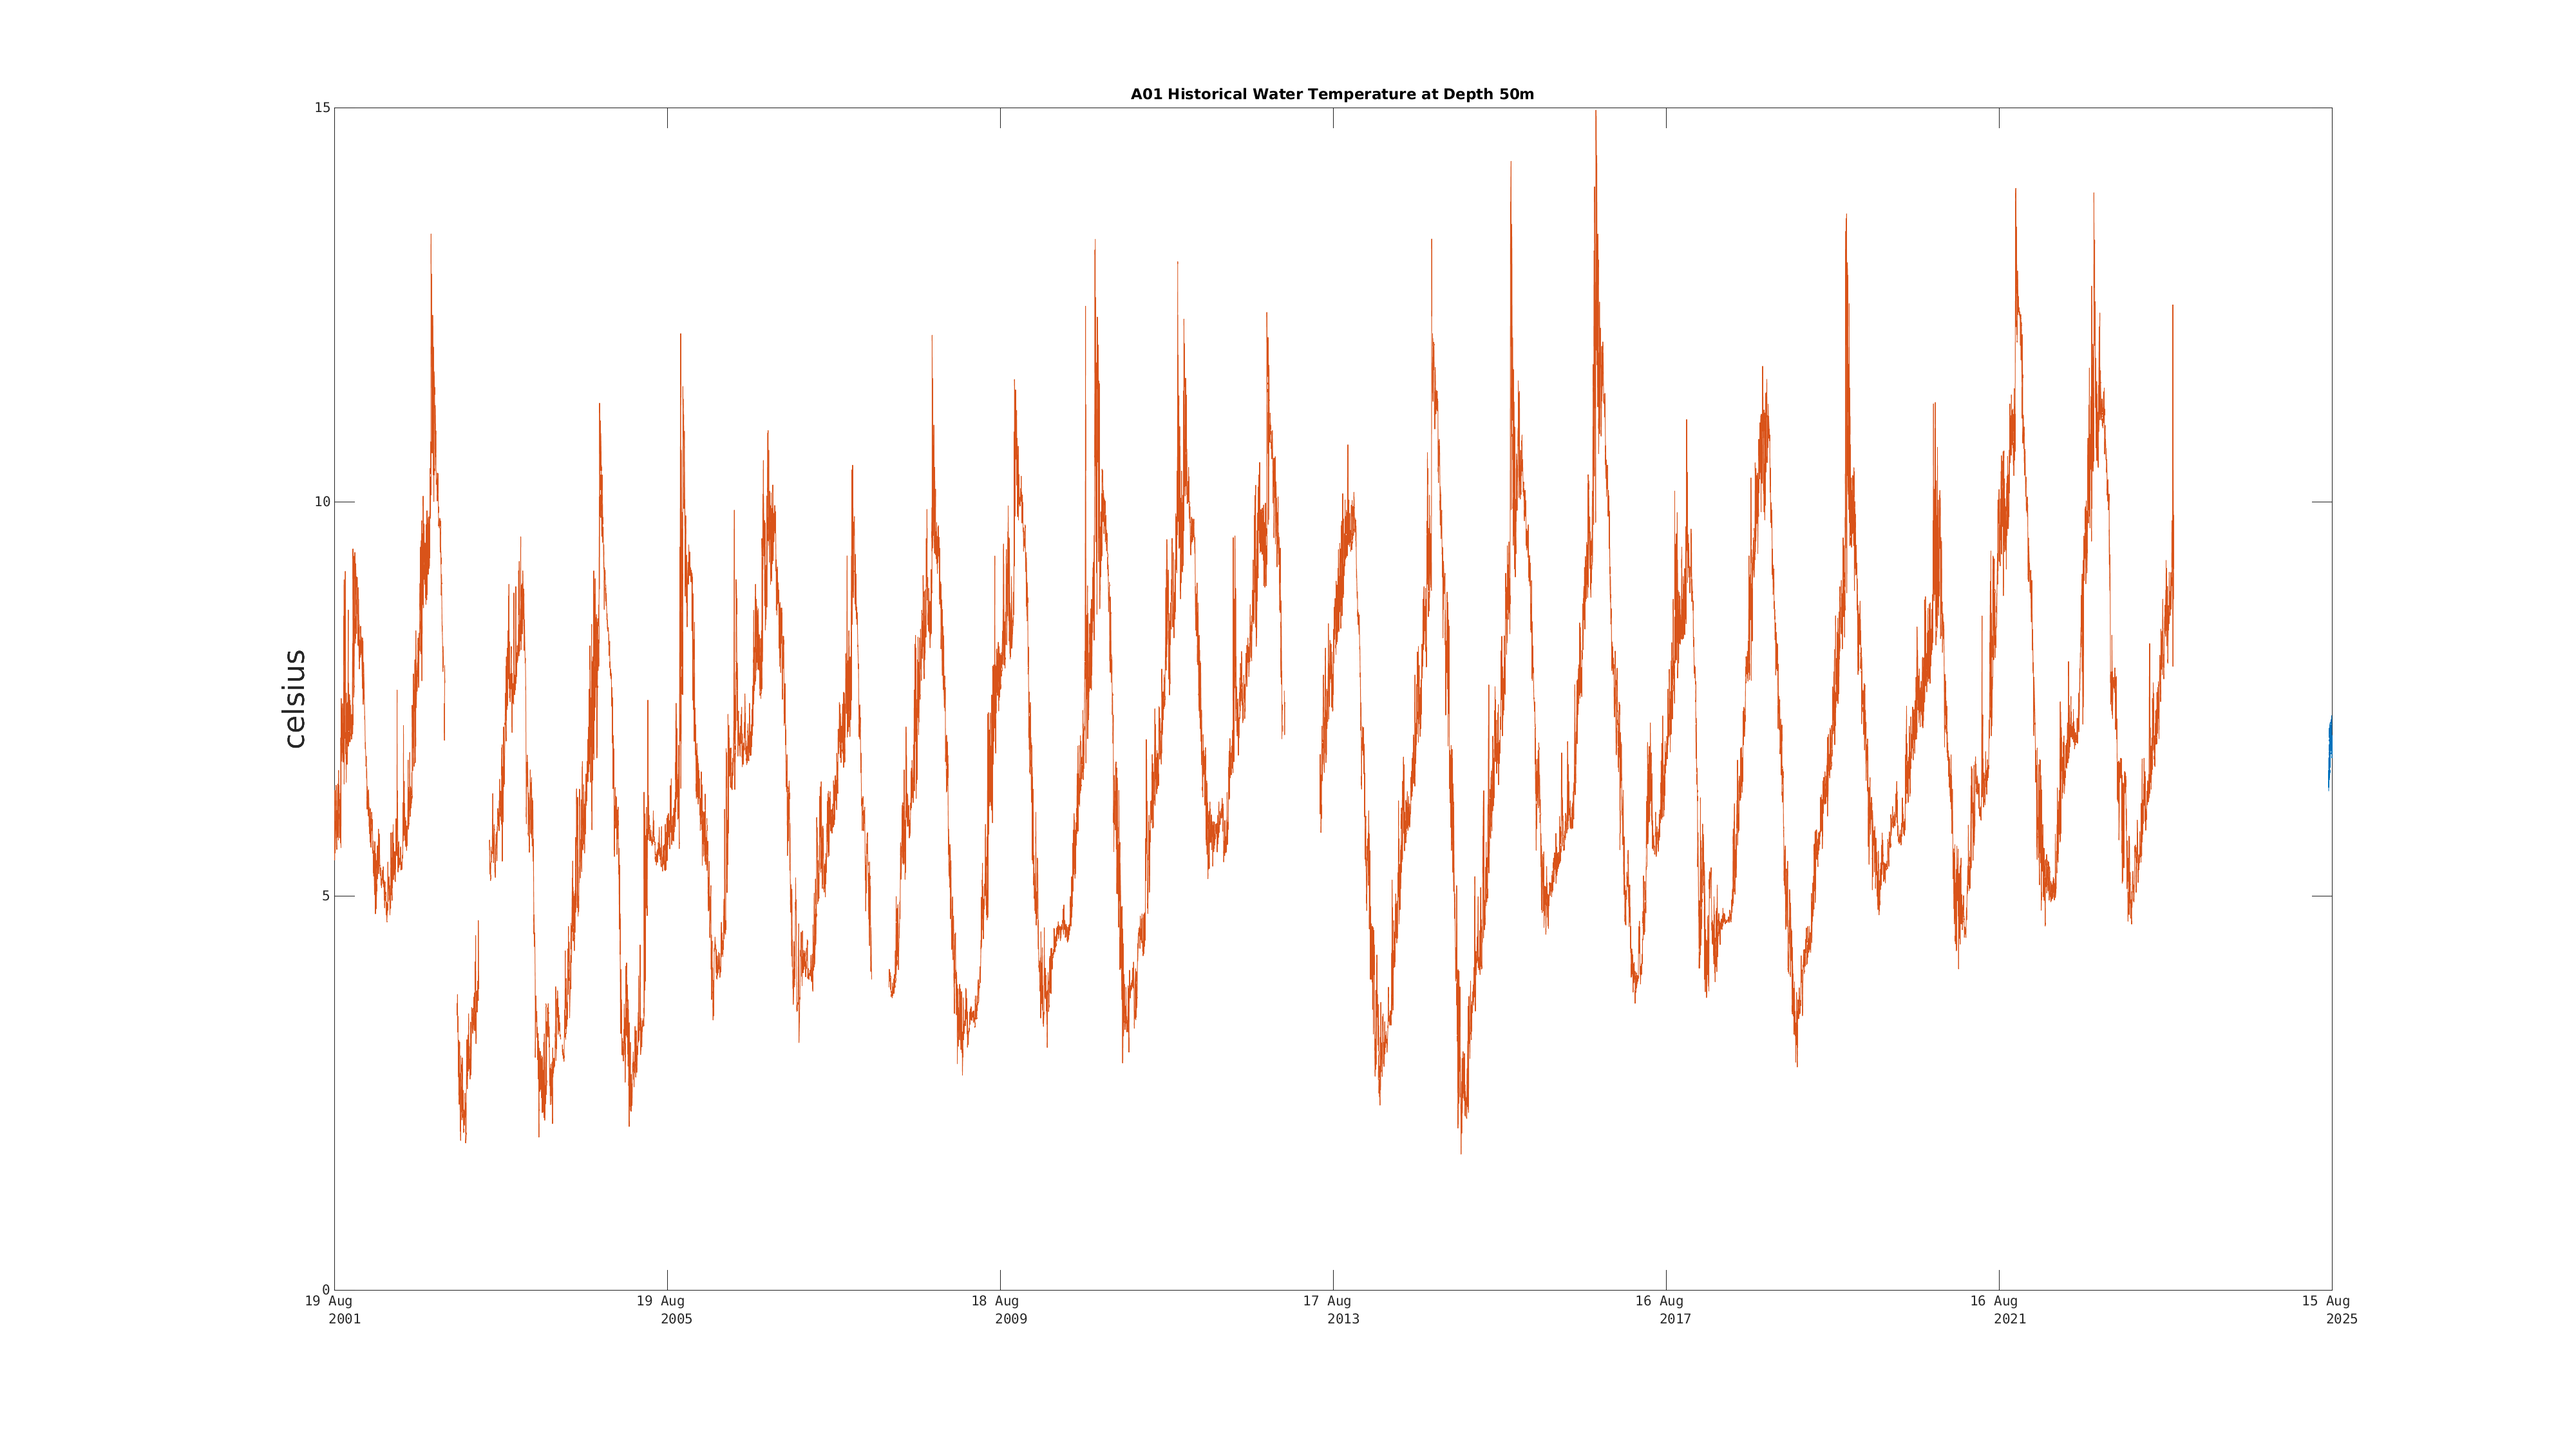
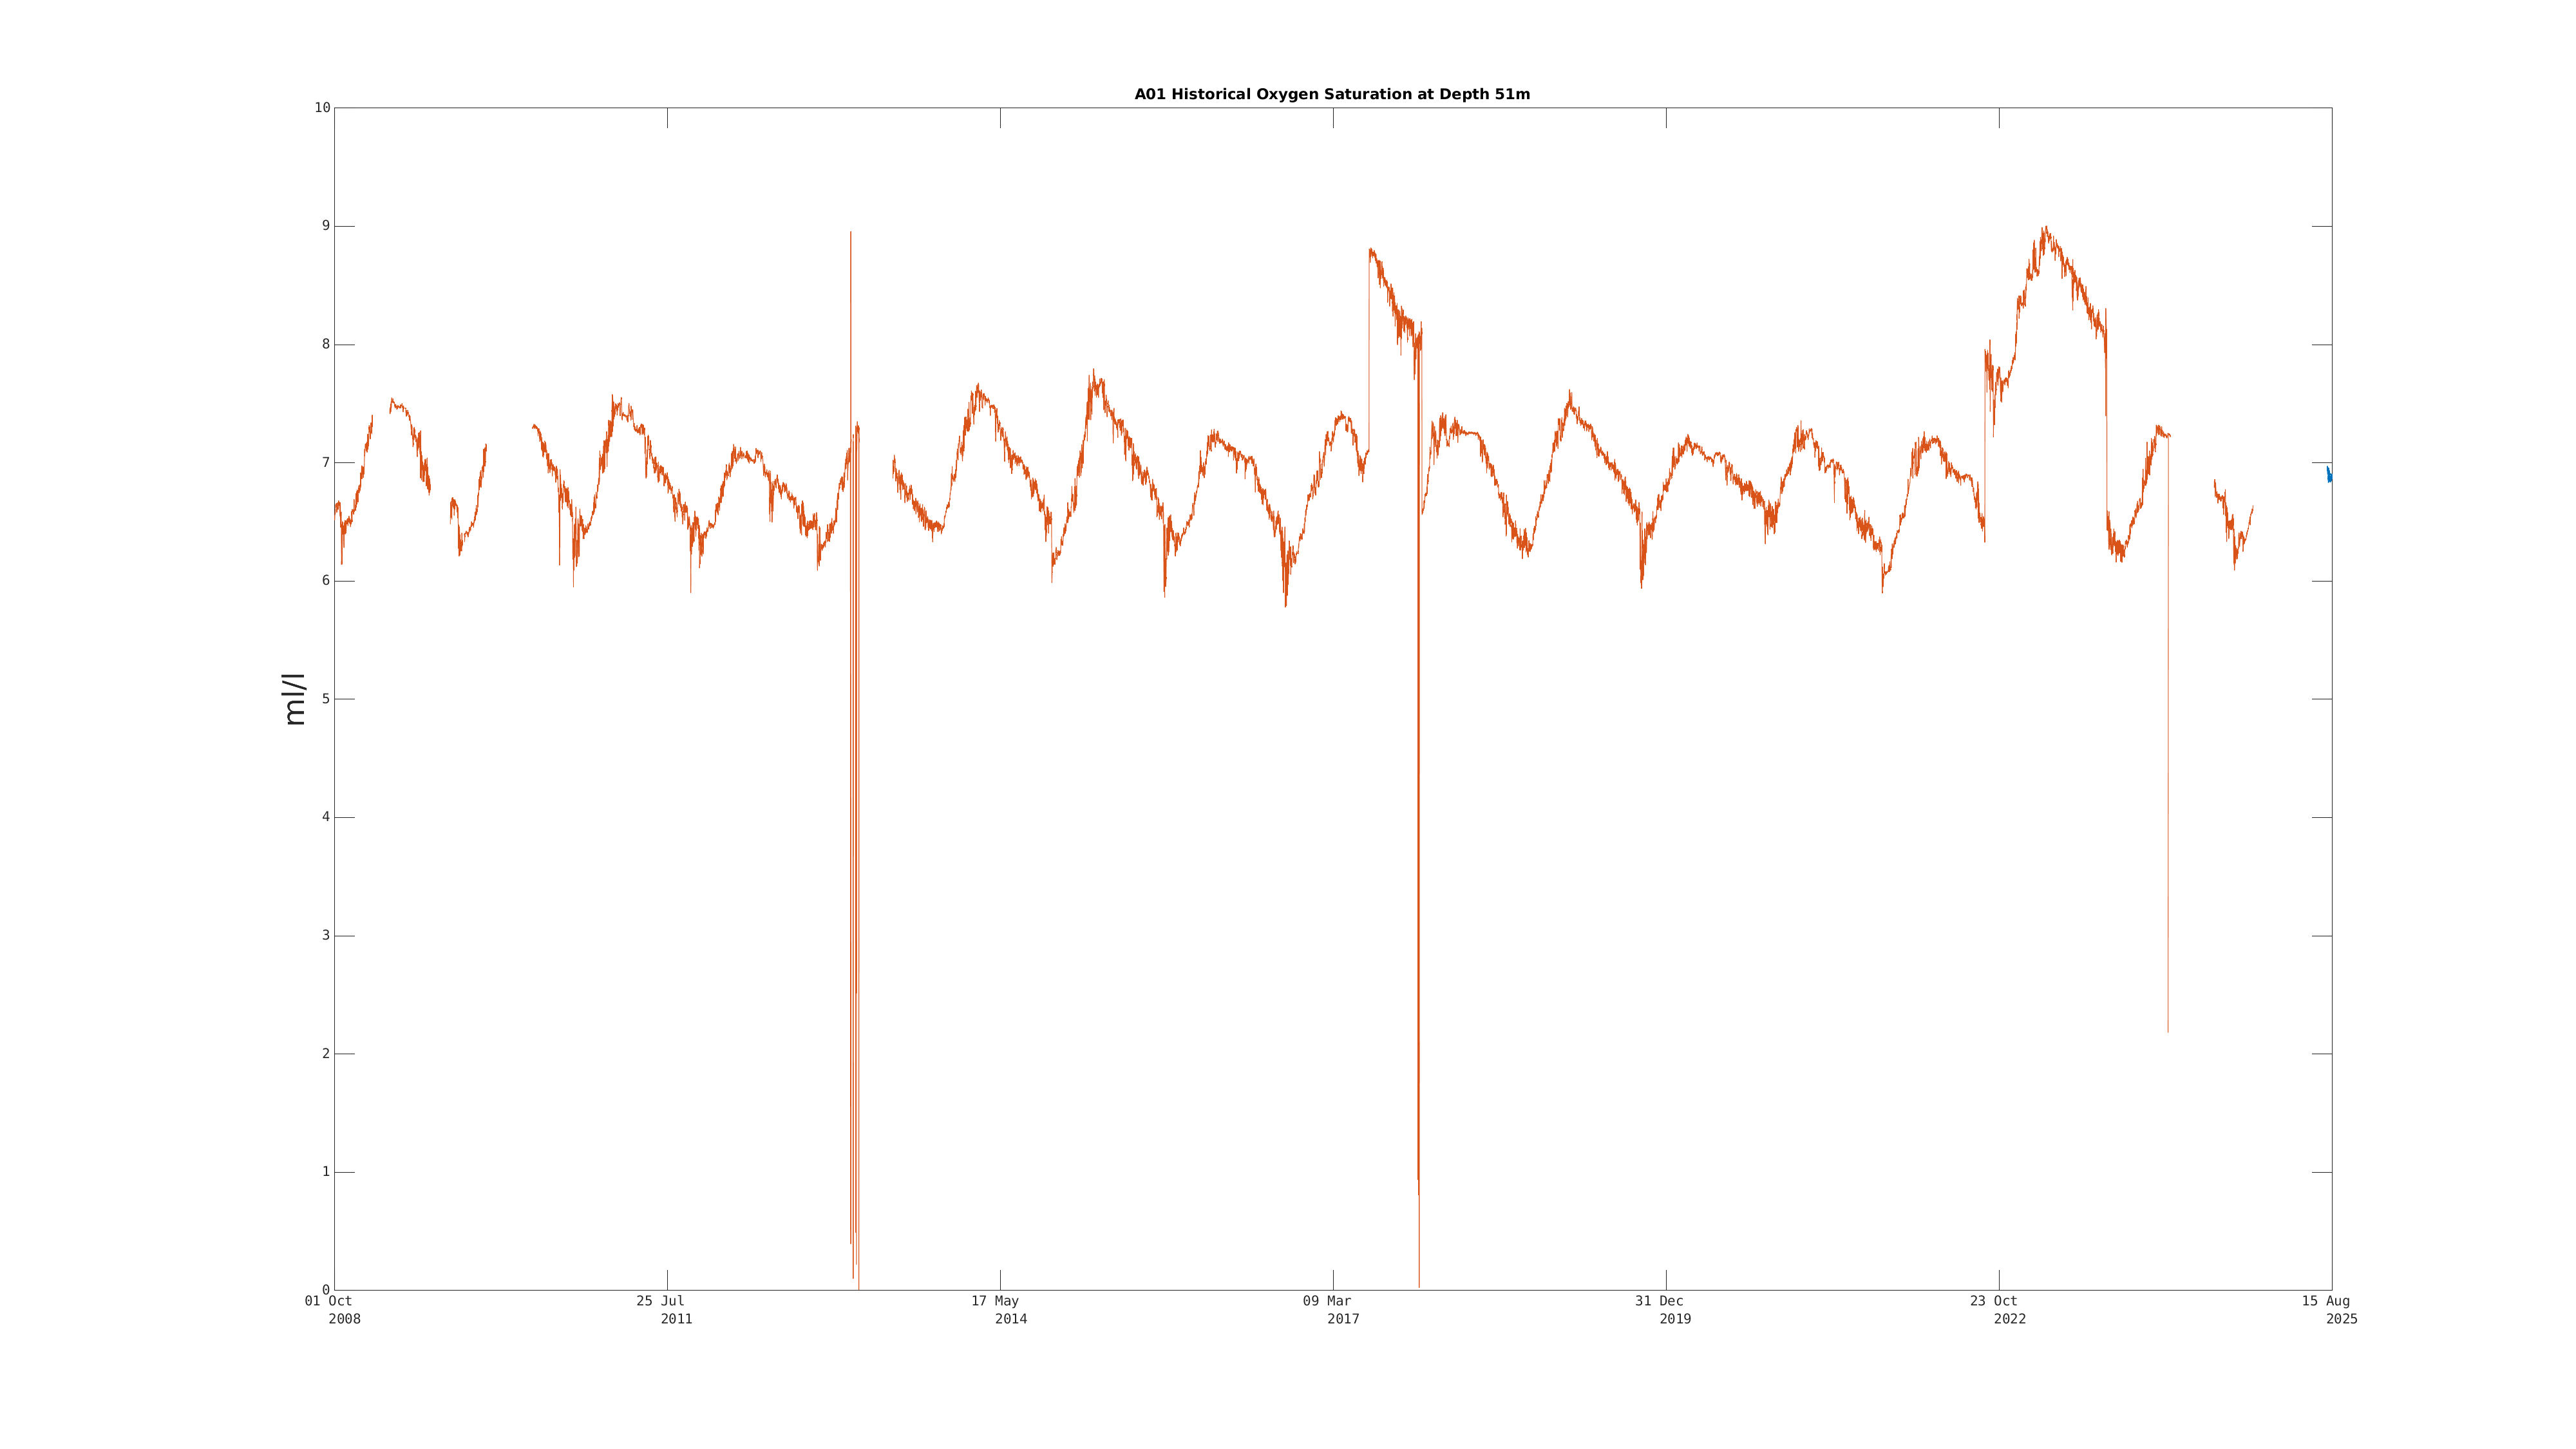
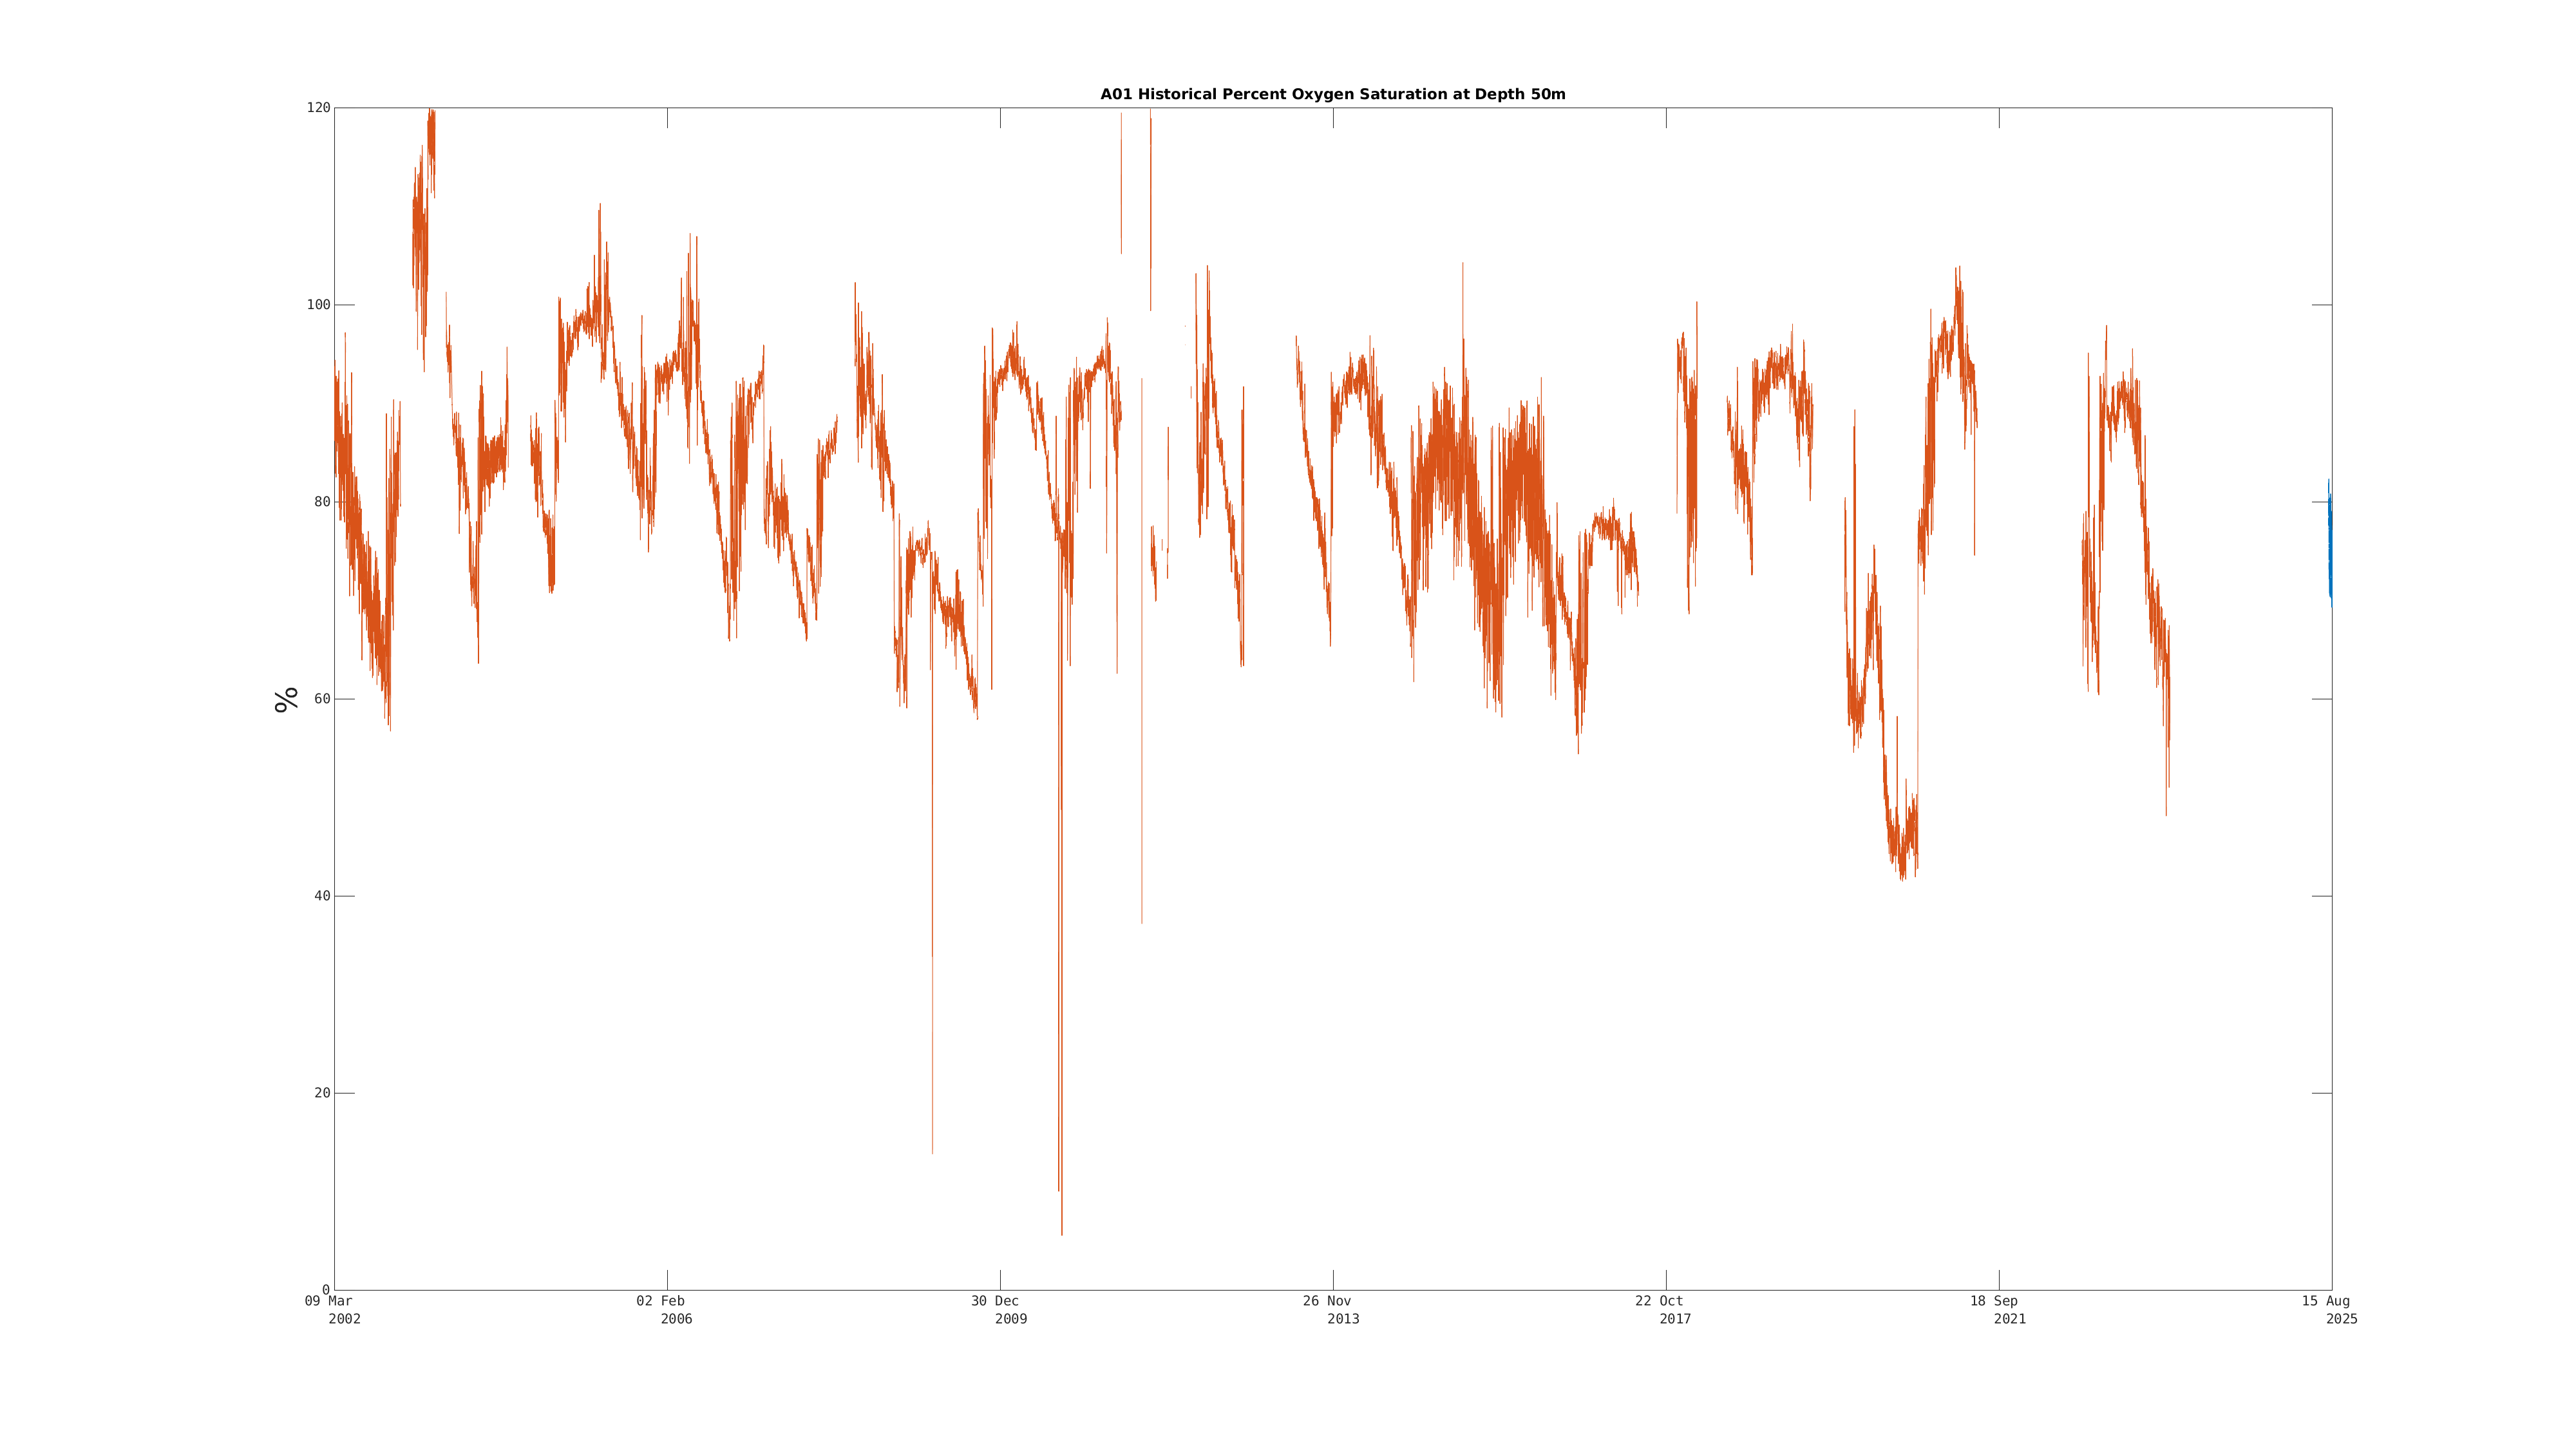
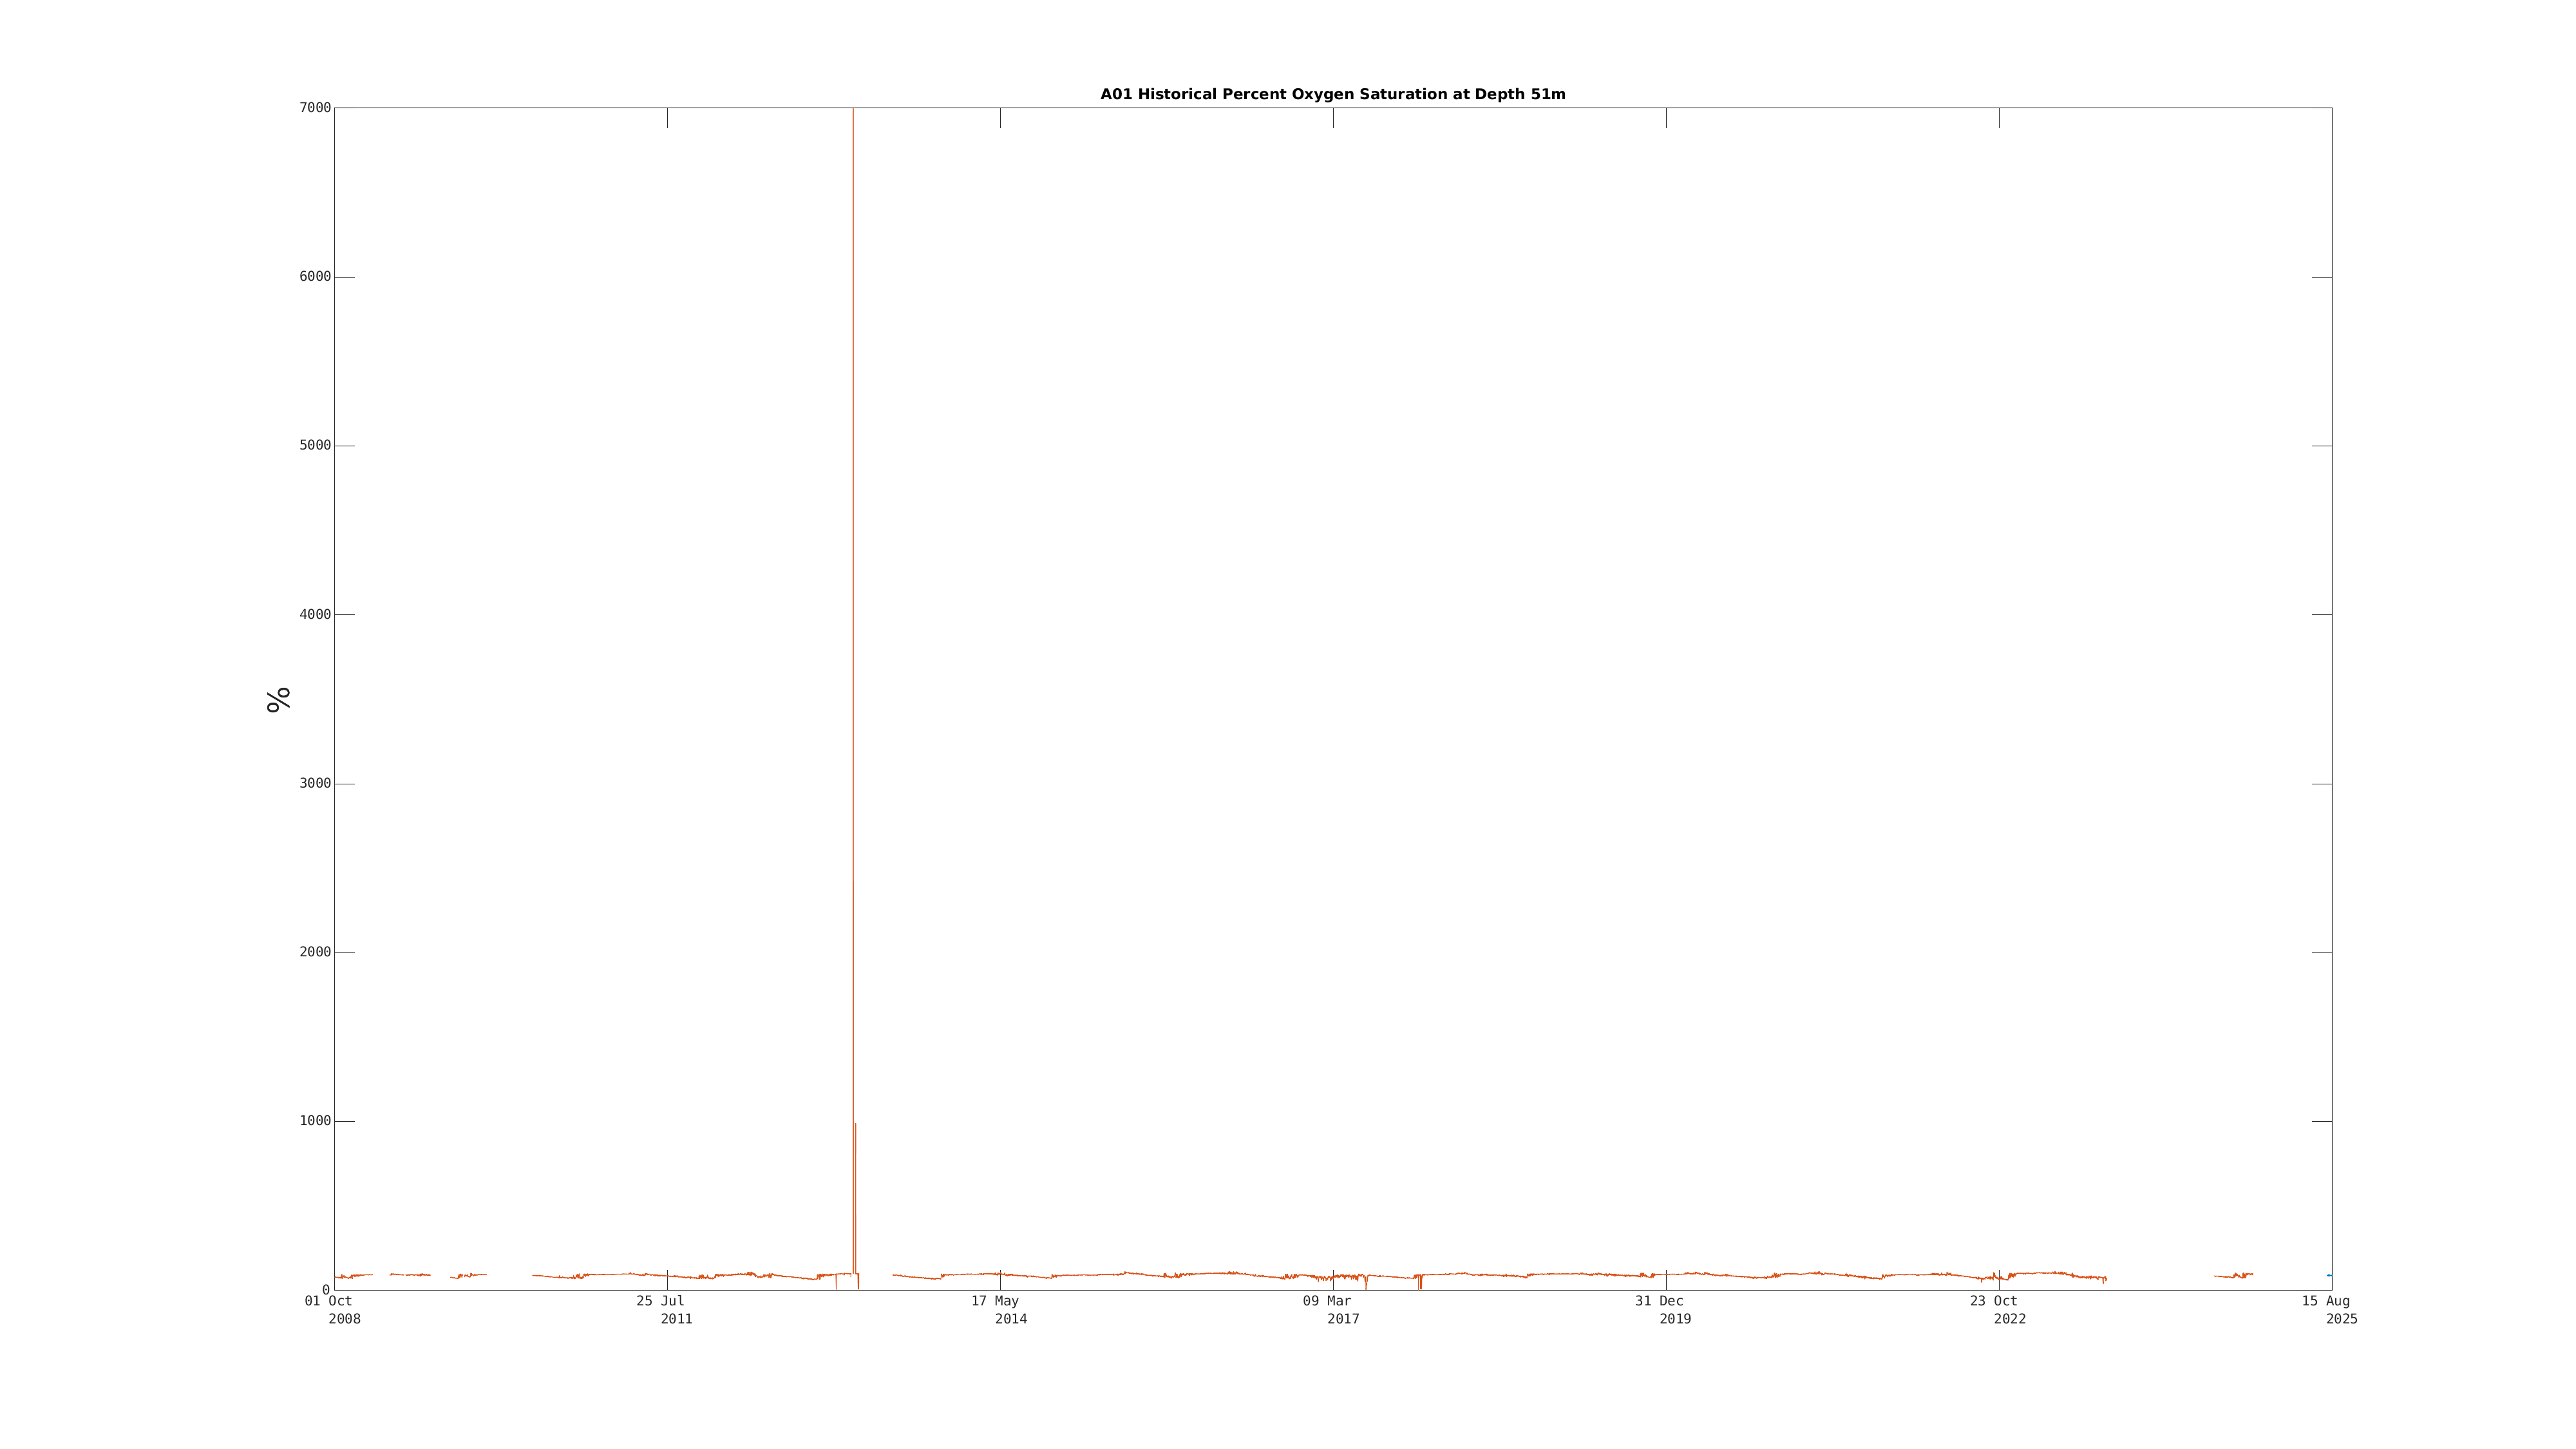
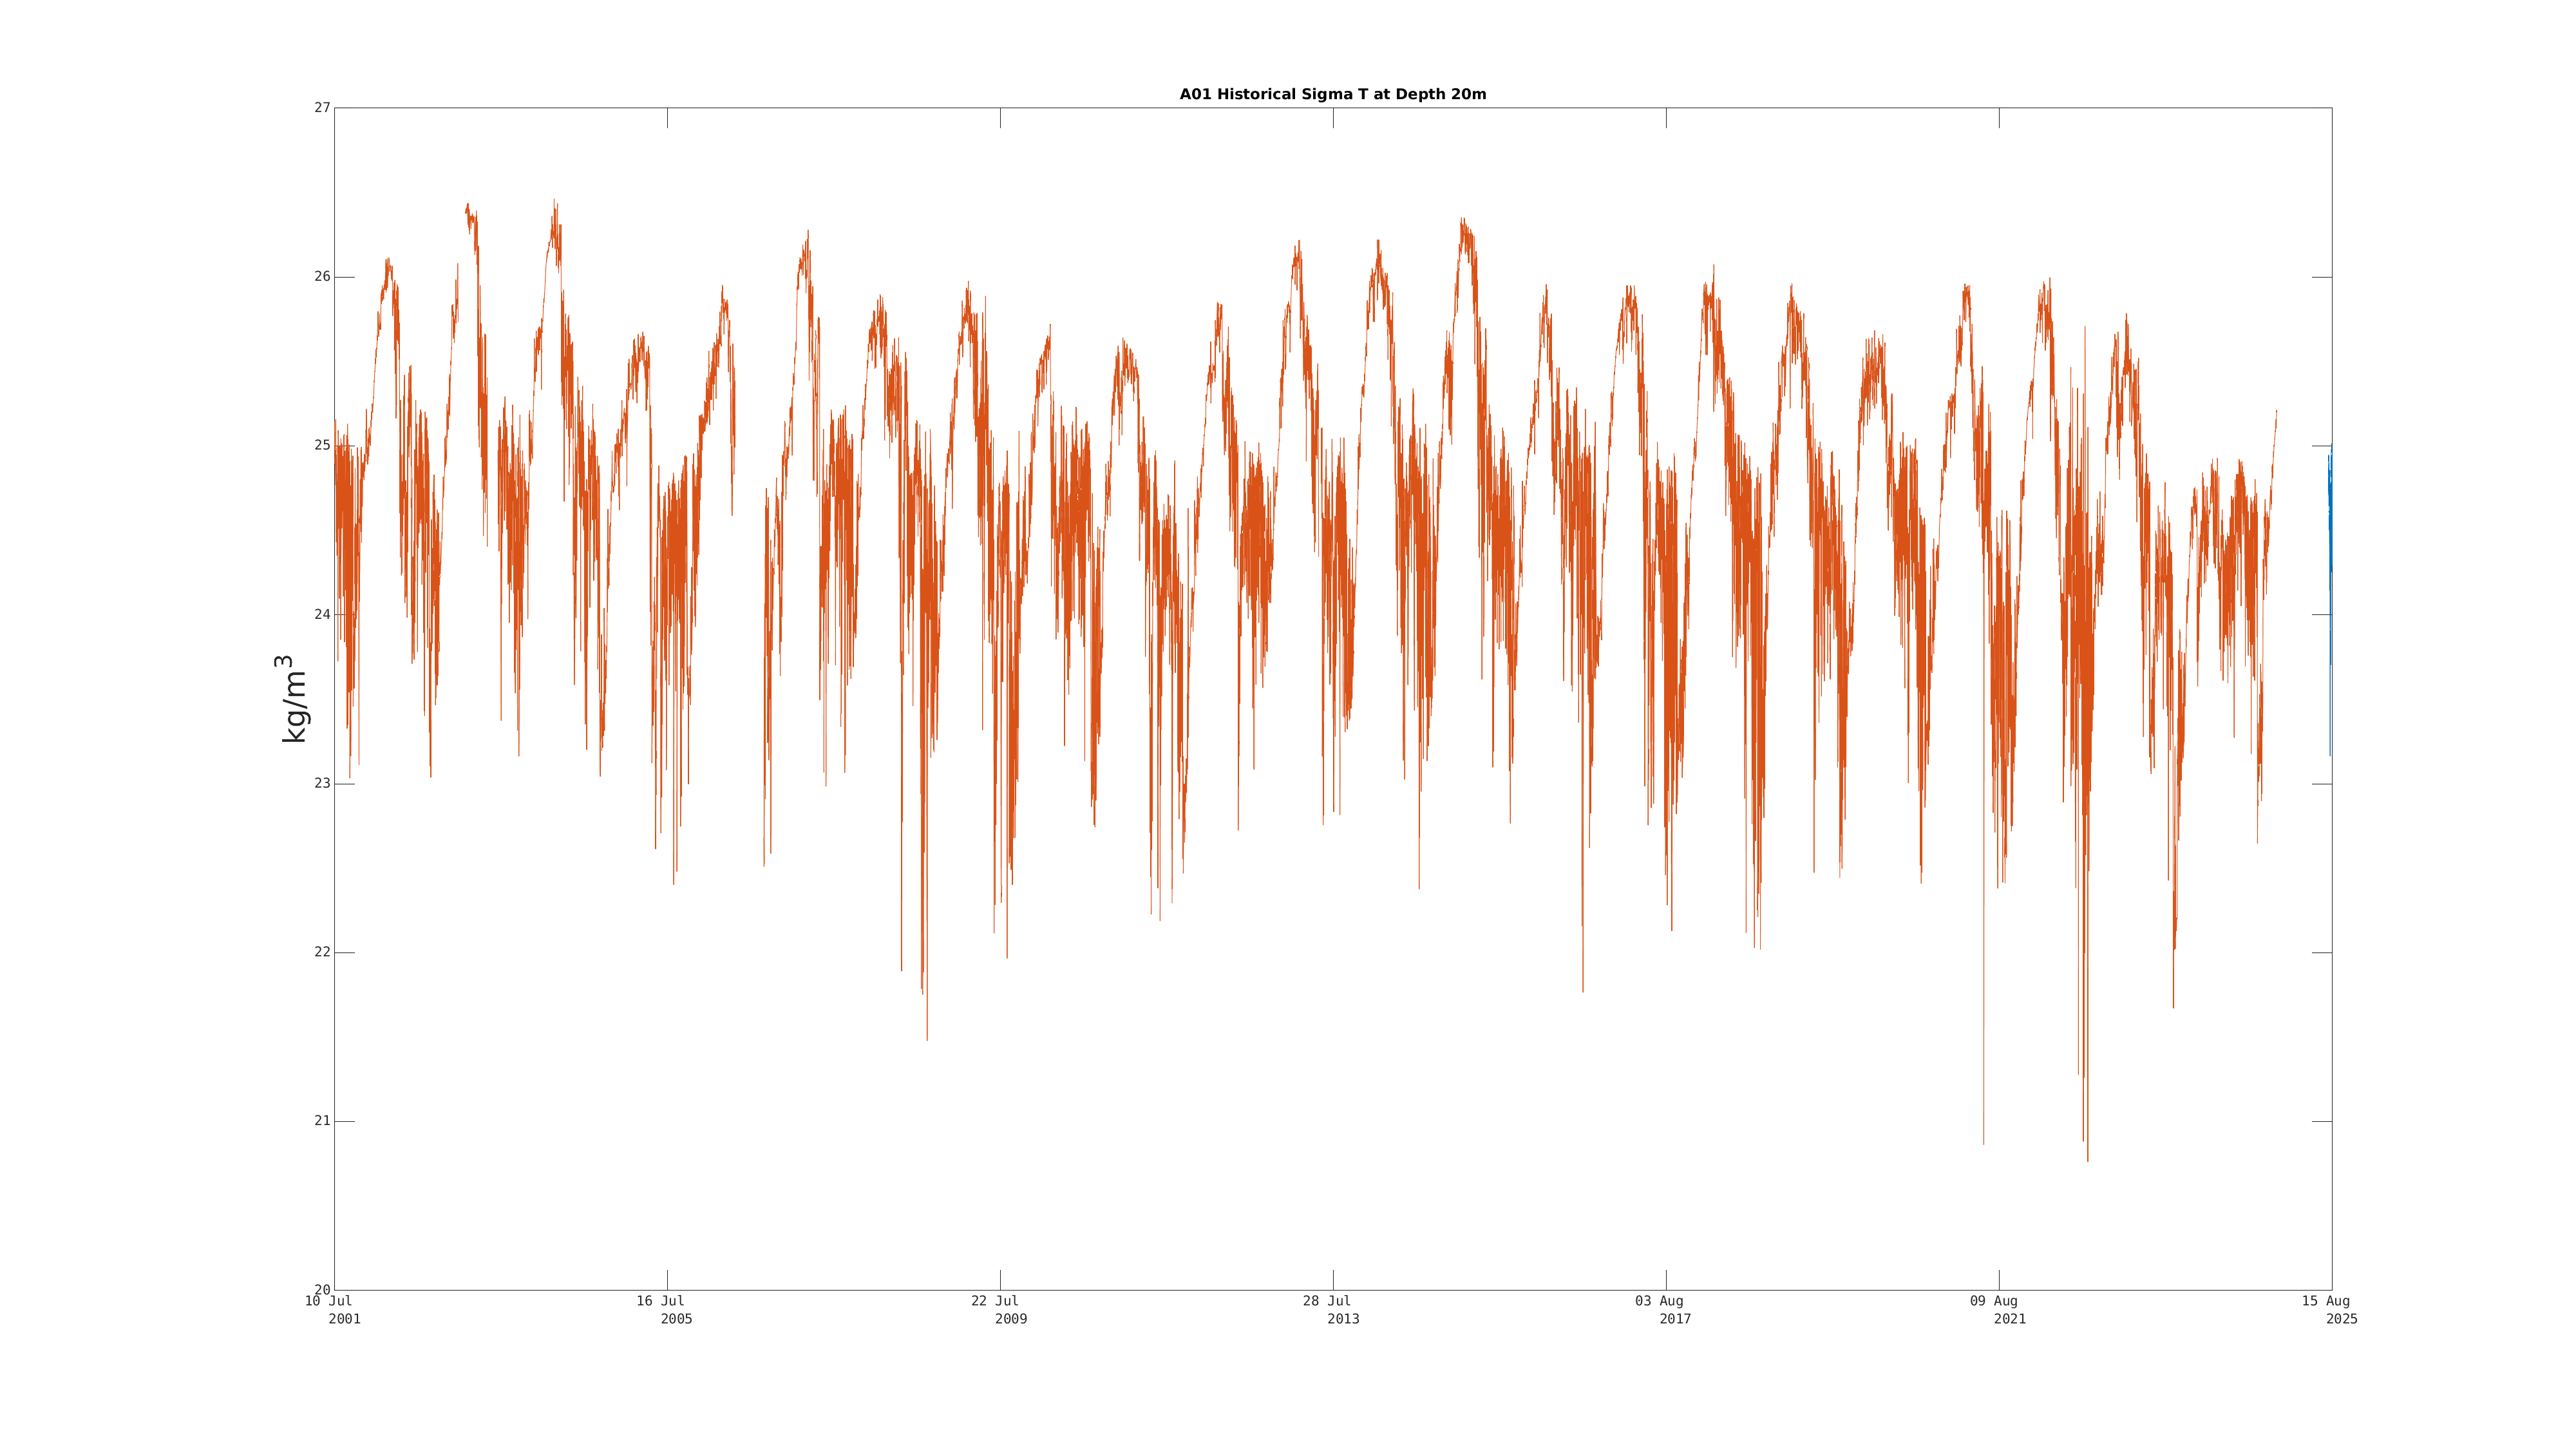
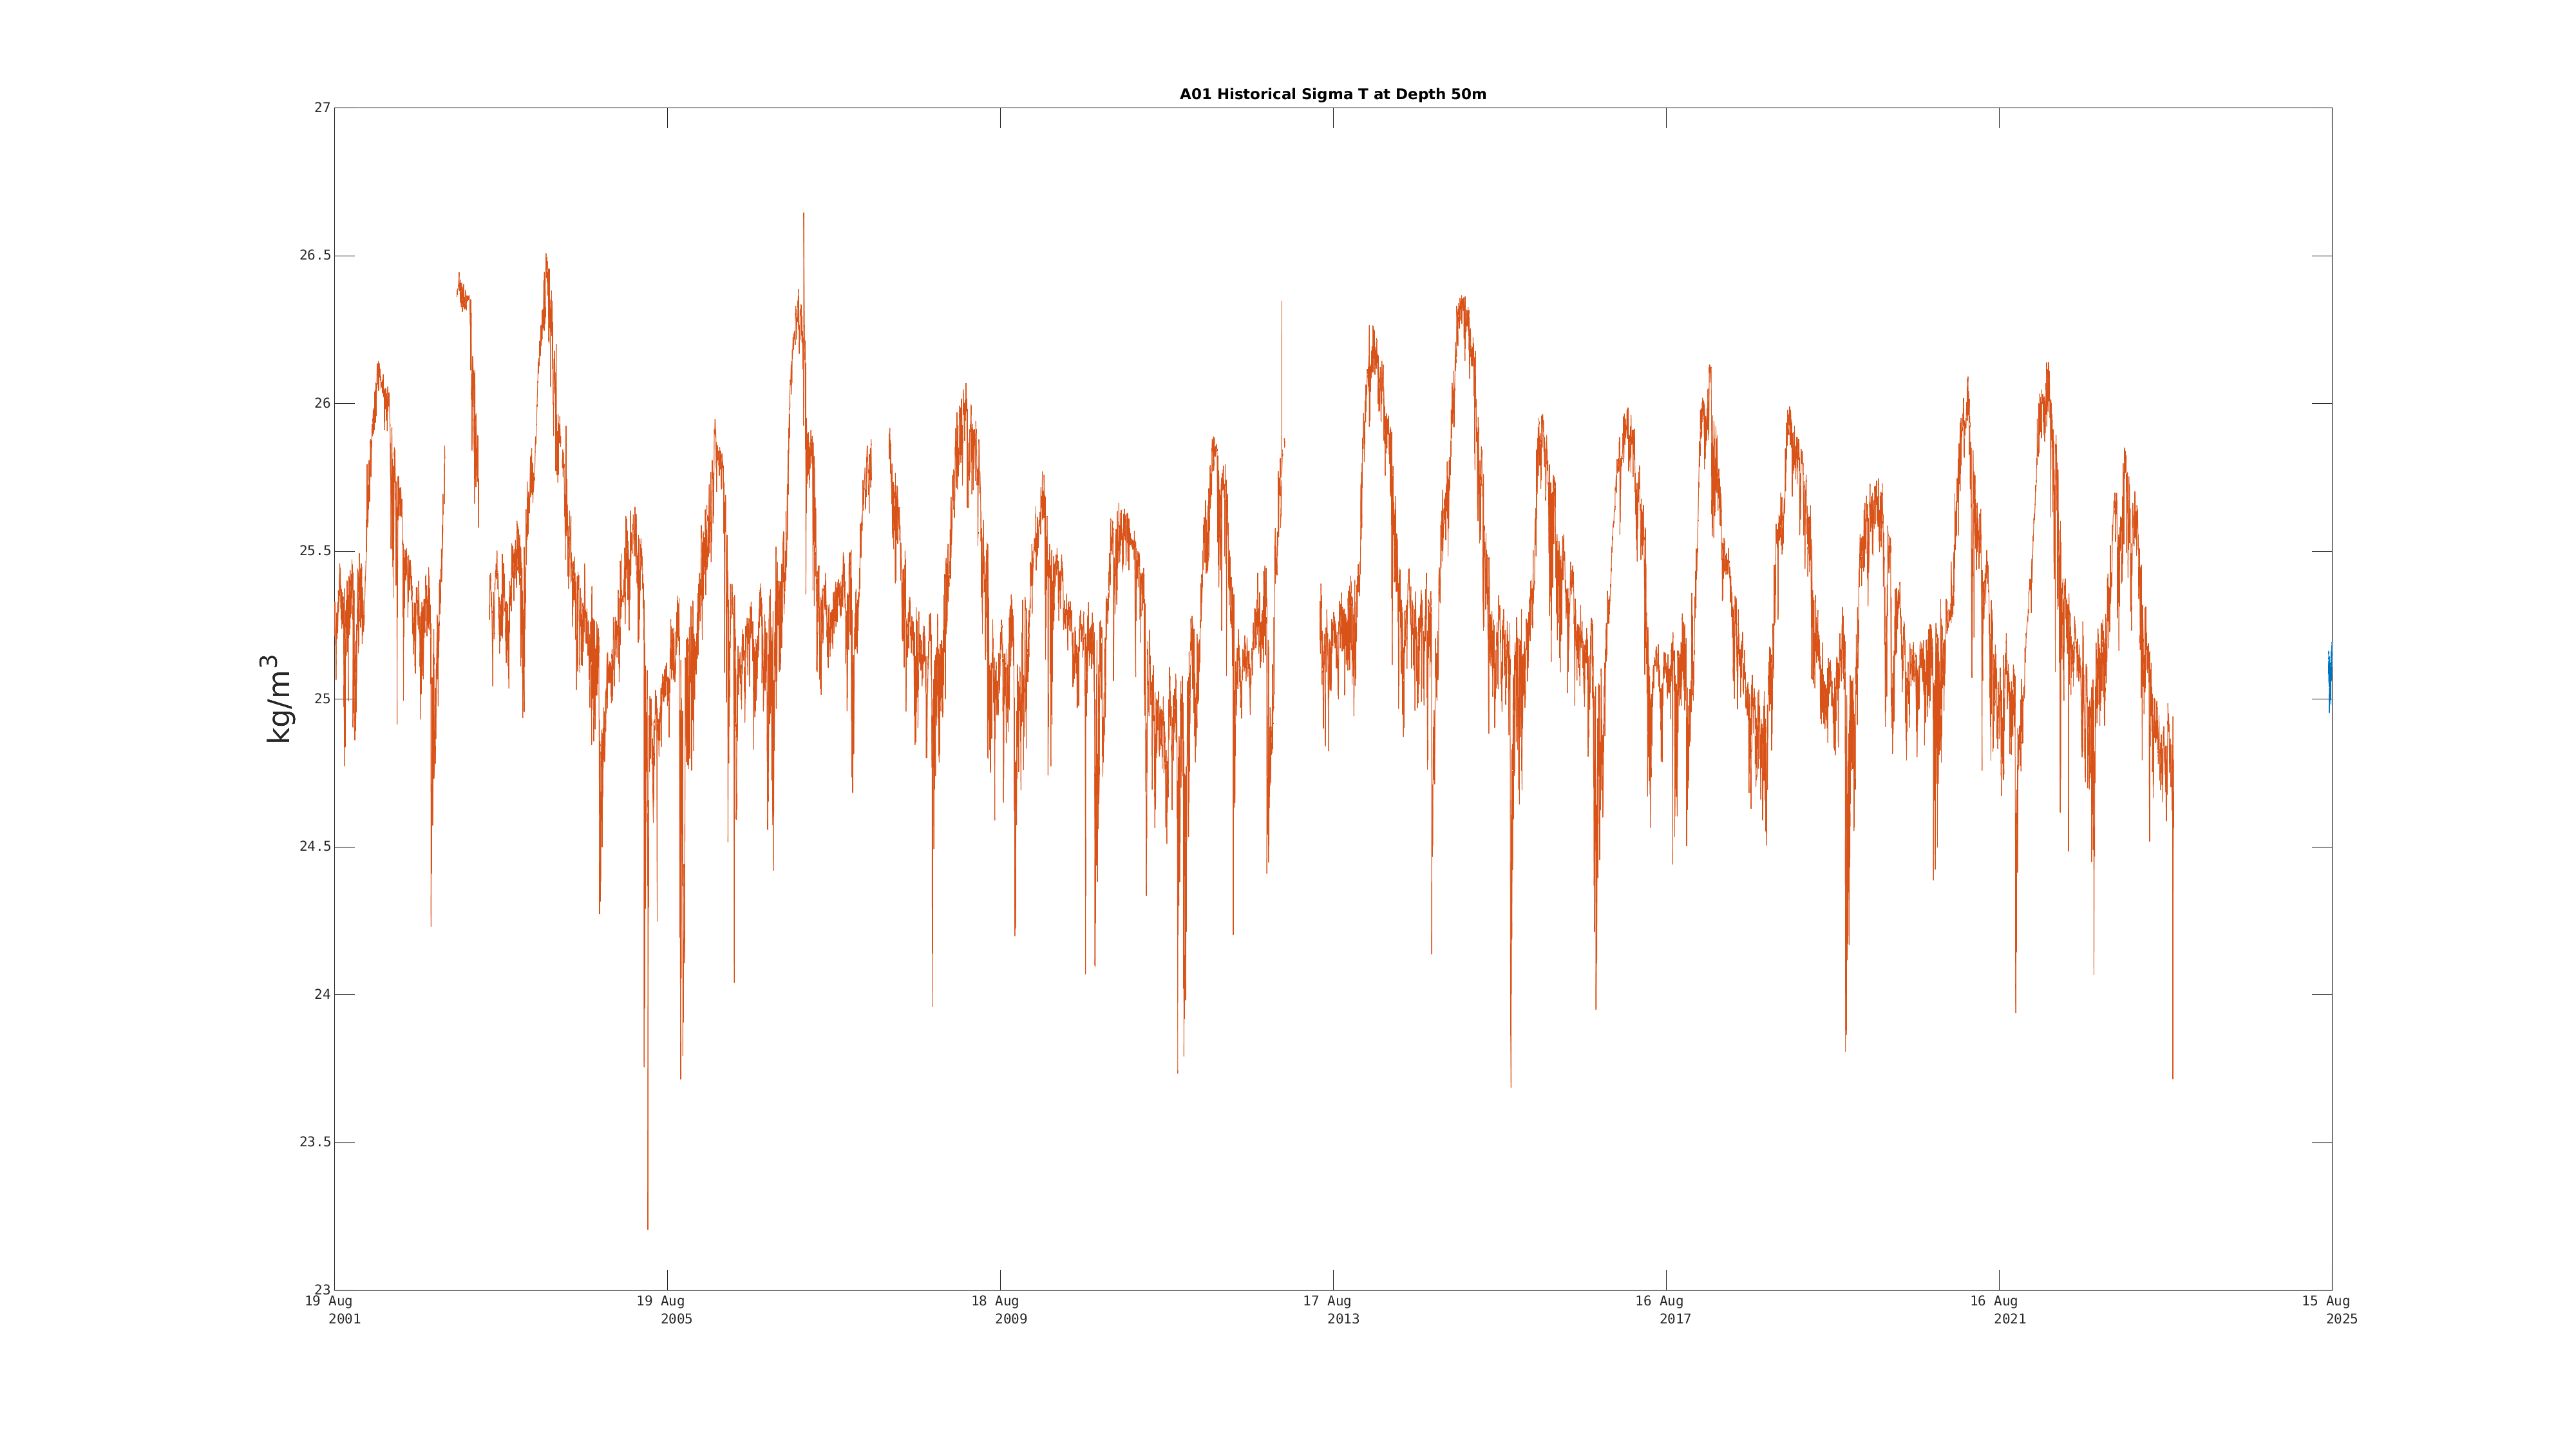
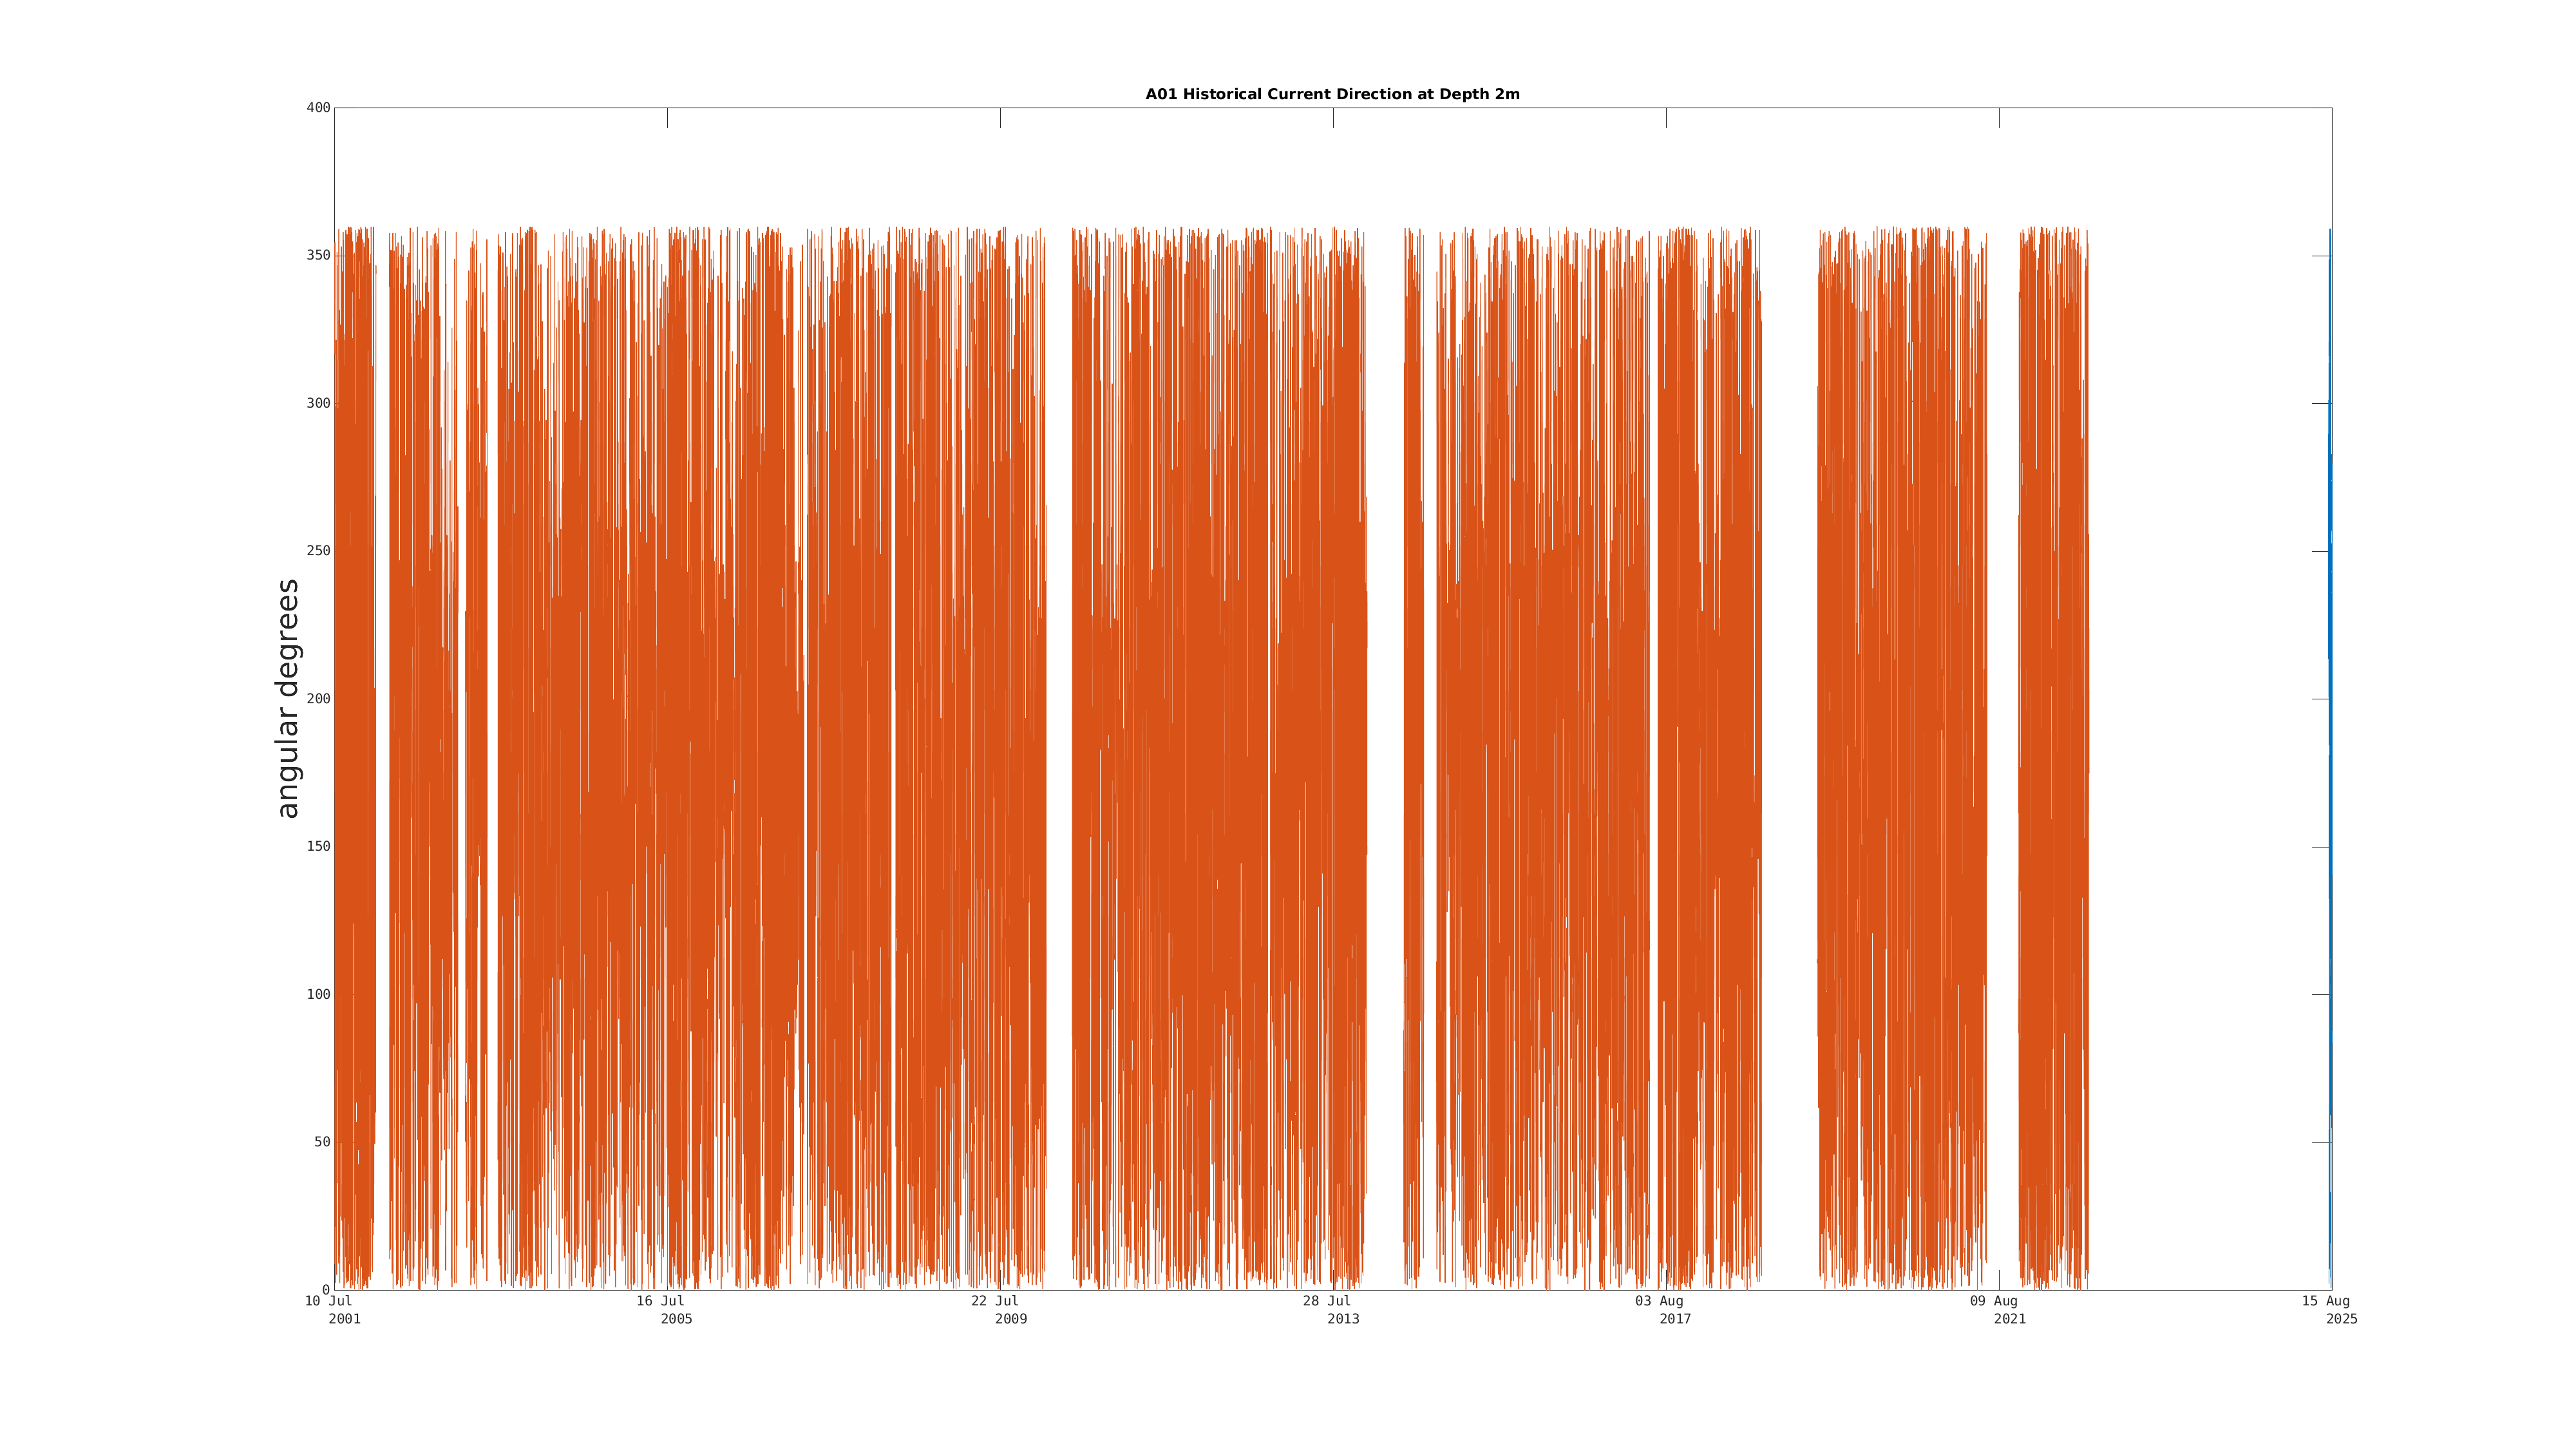
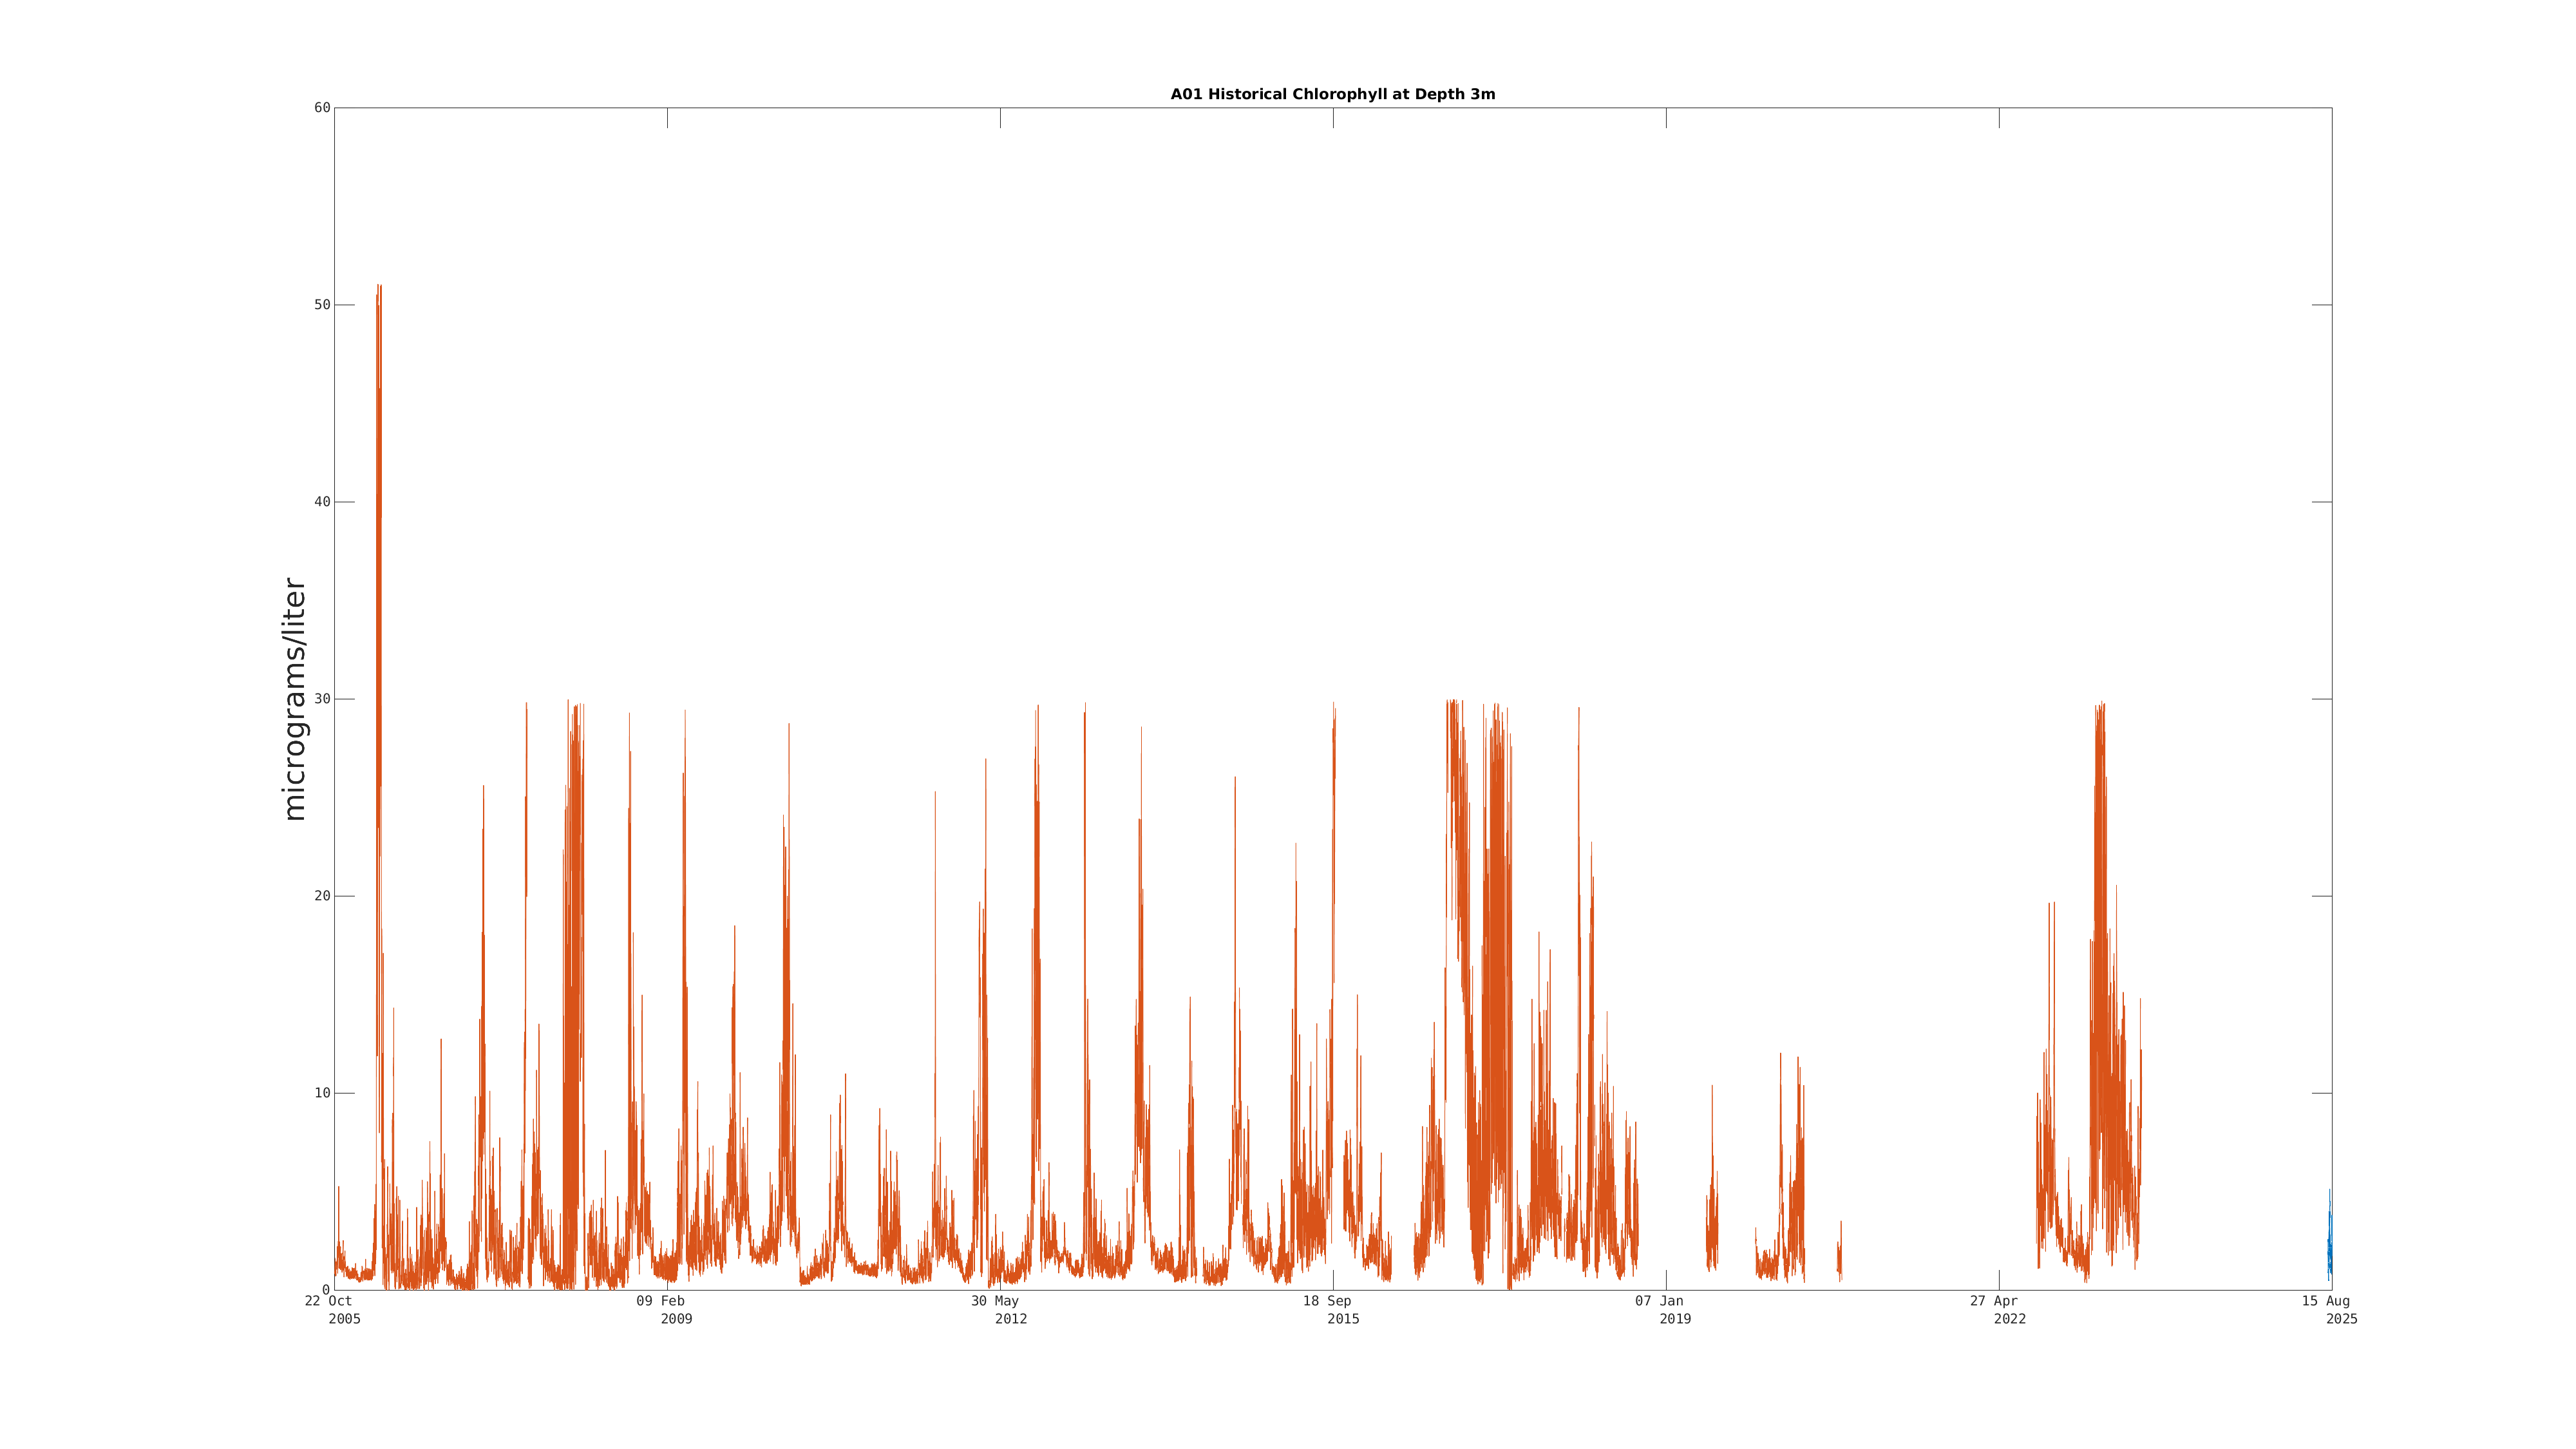
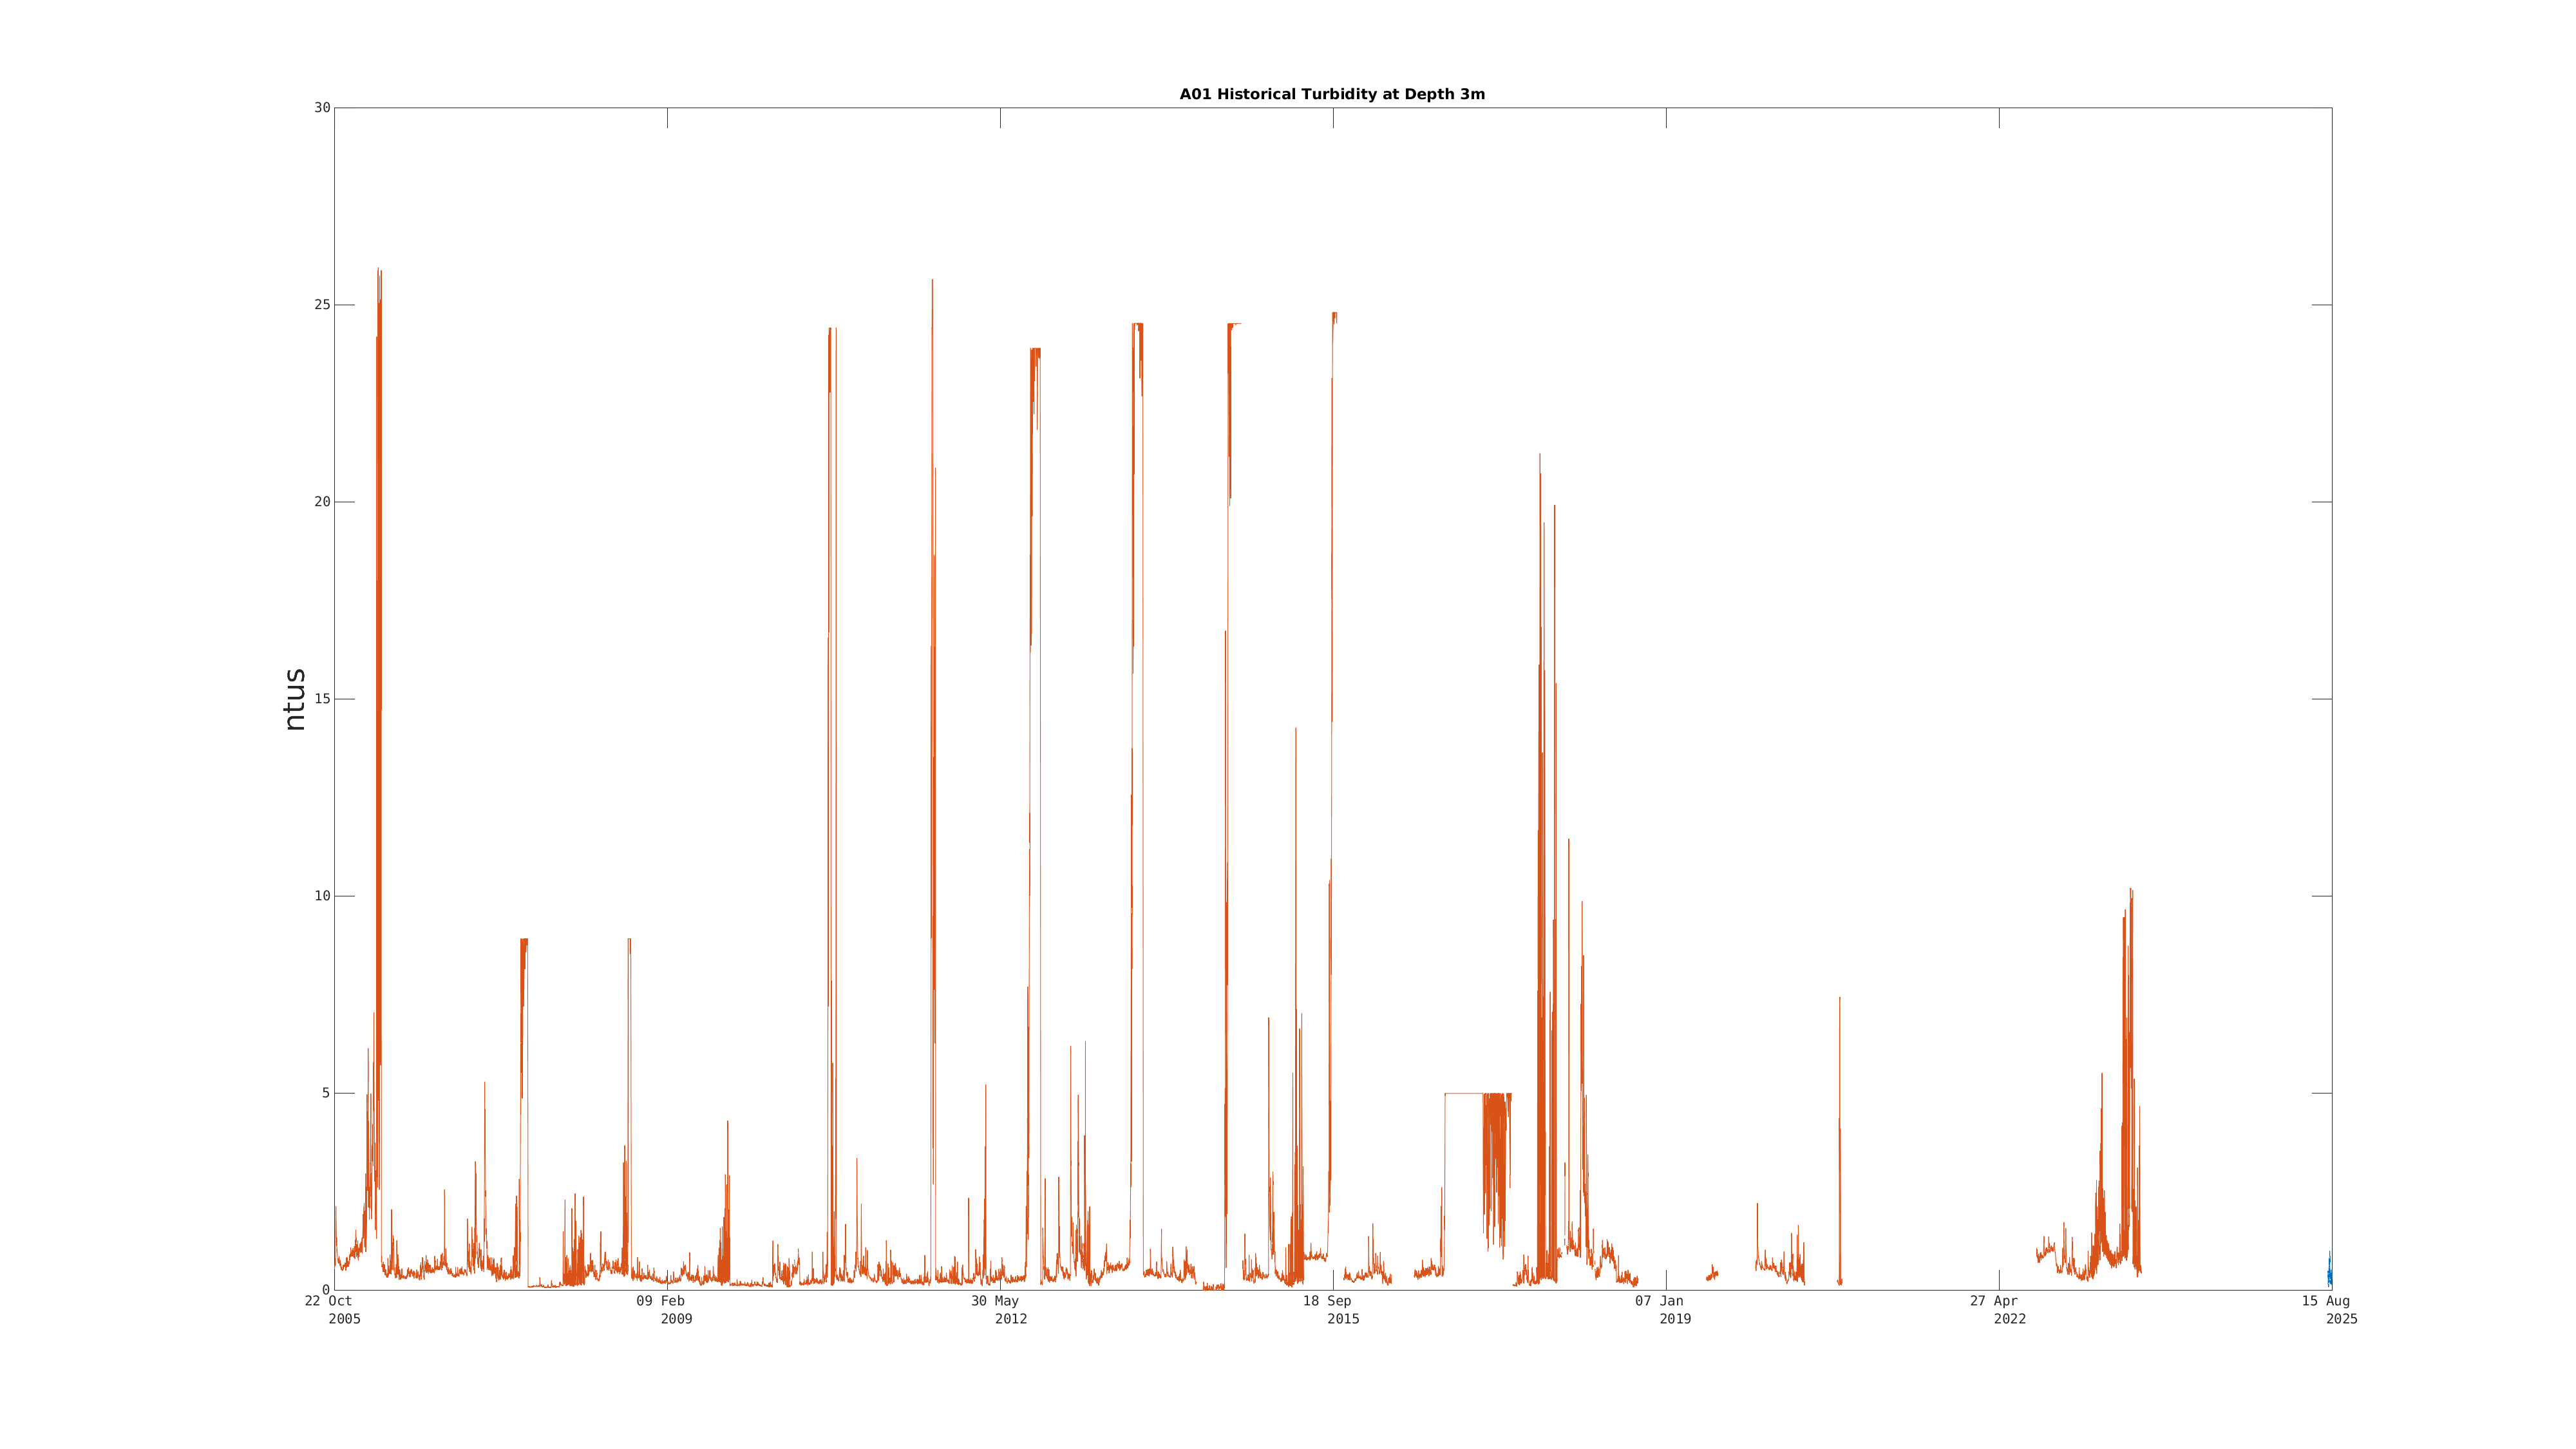
 Entire Position History:
 Latest Month's:
 This Deployment:
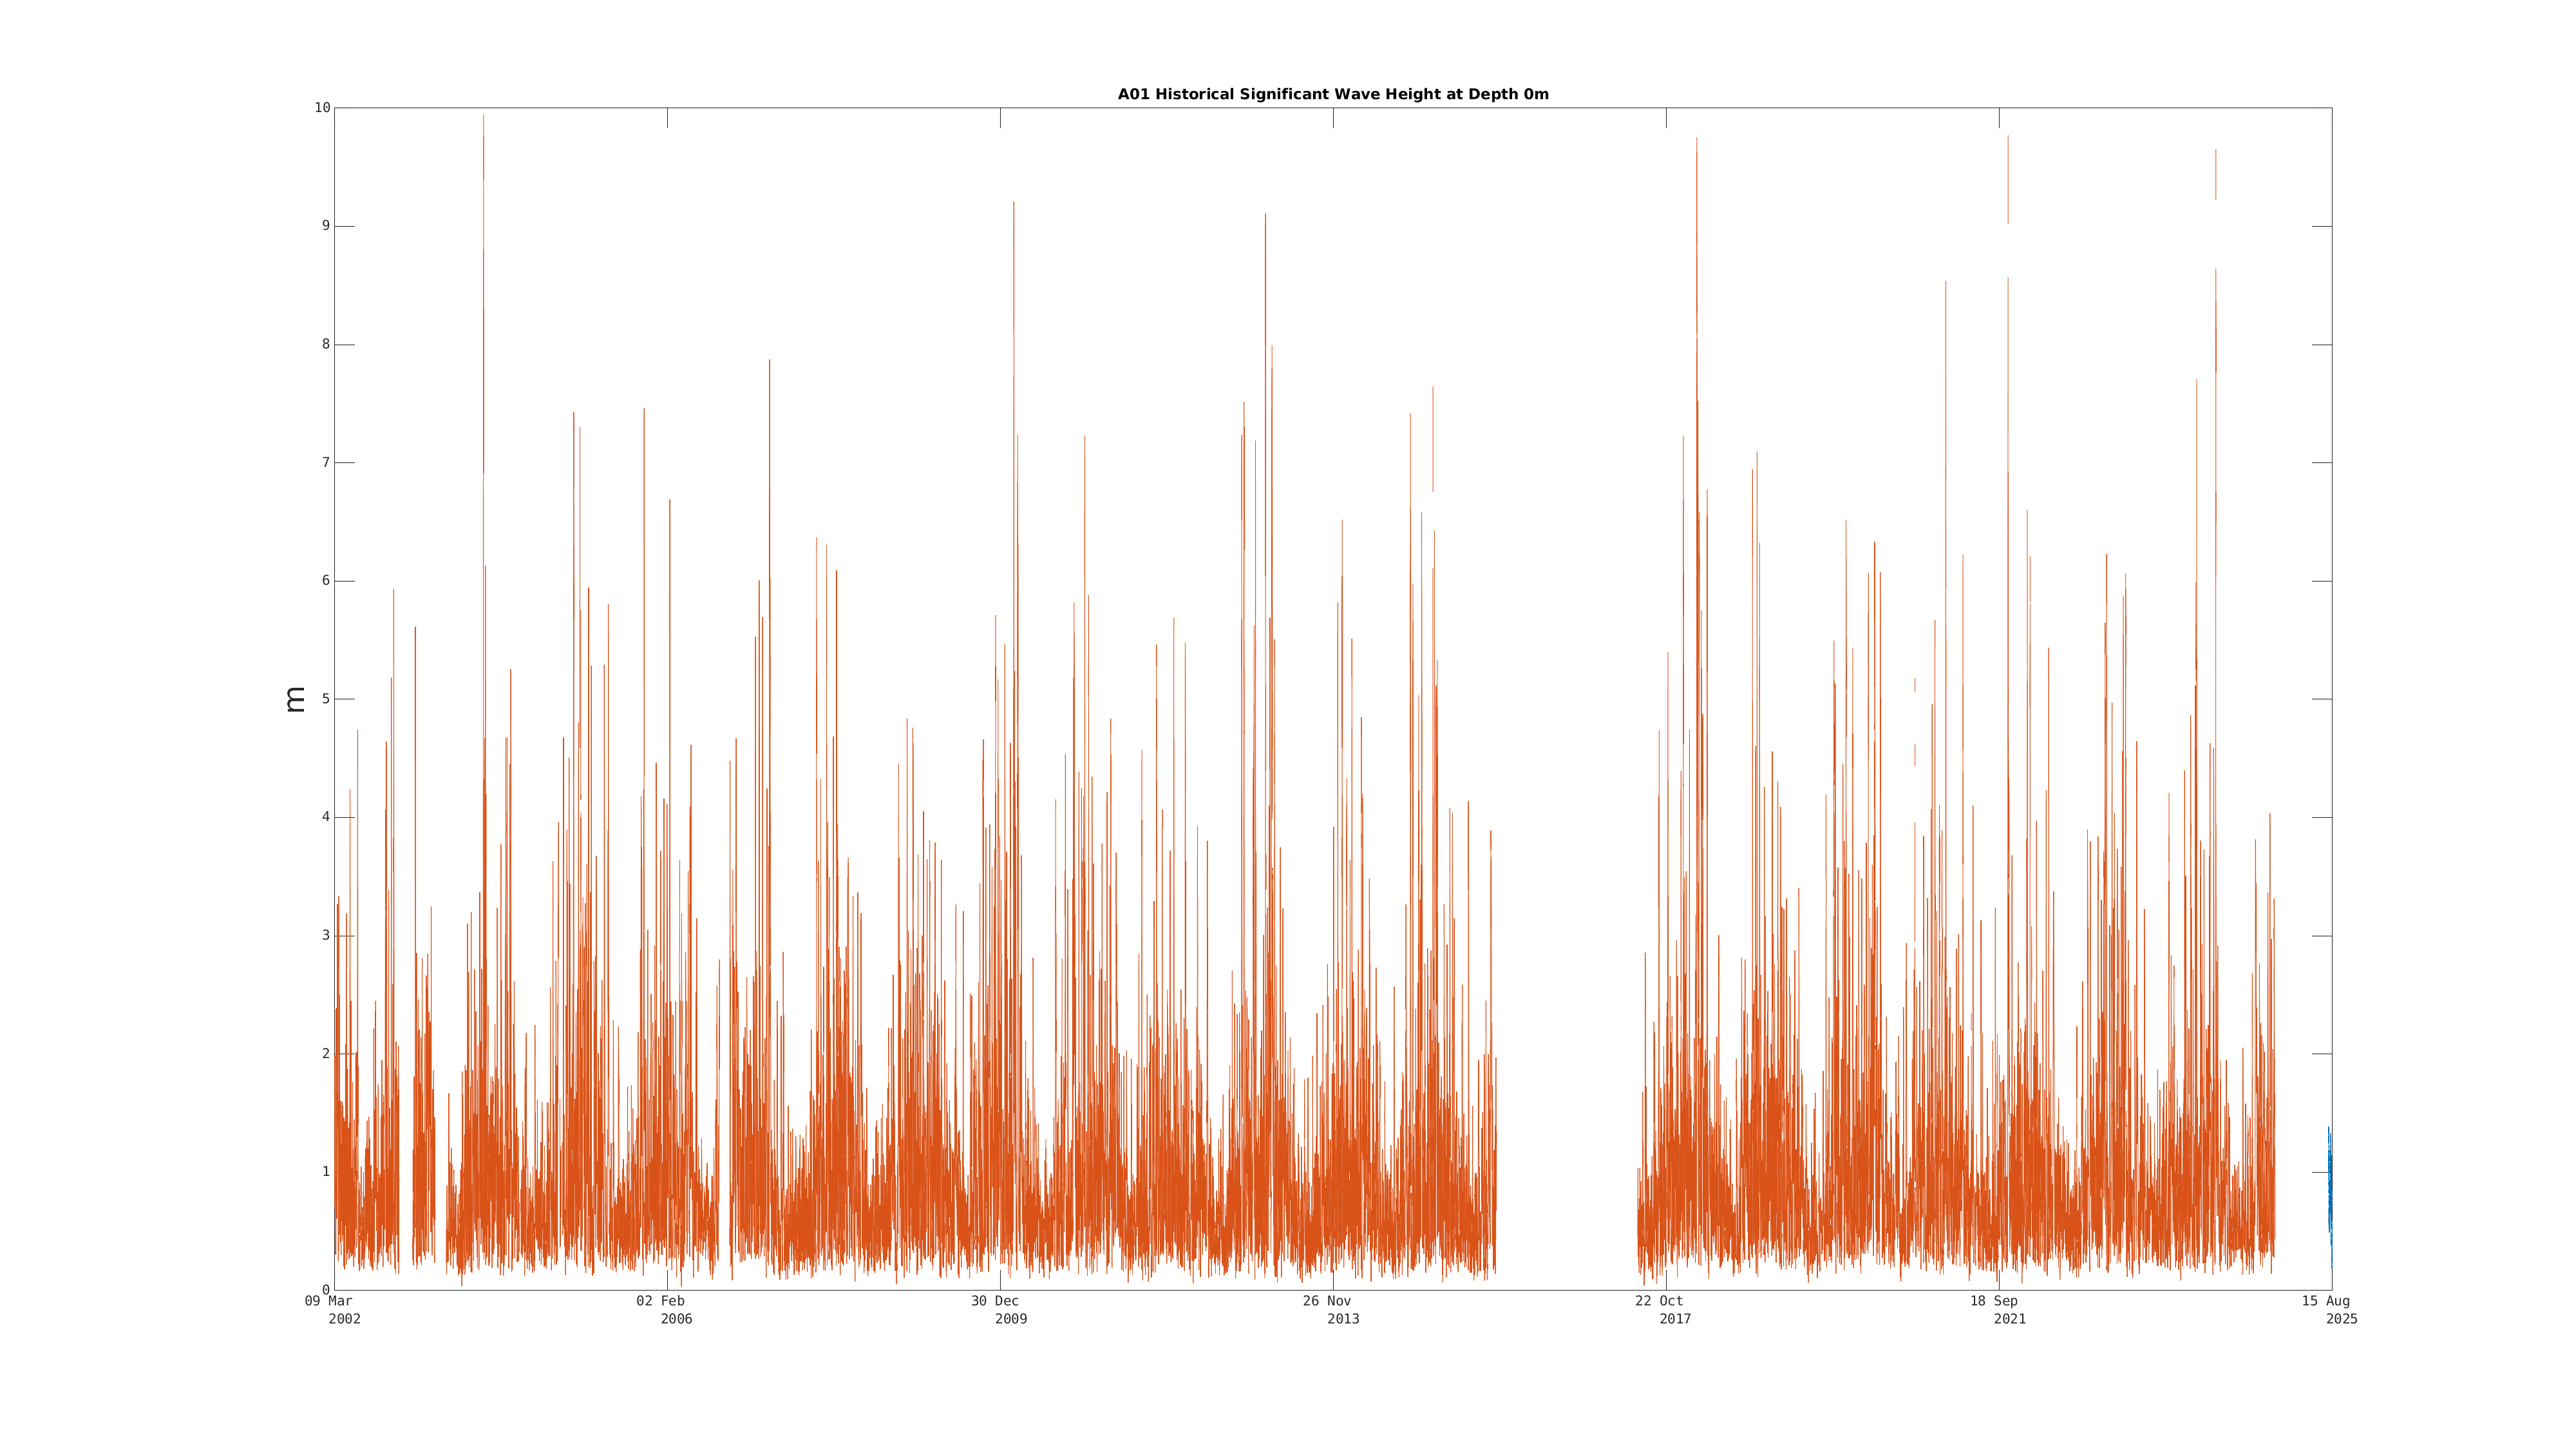
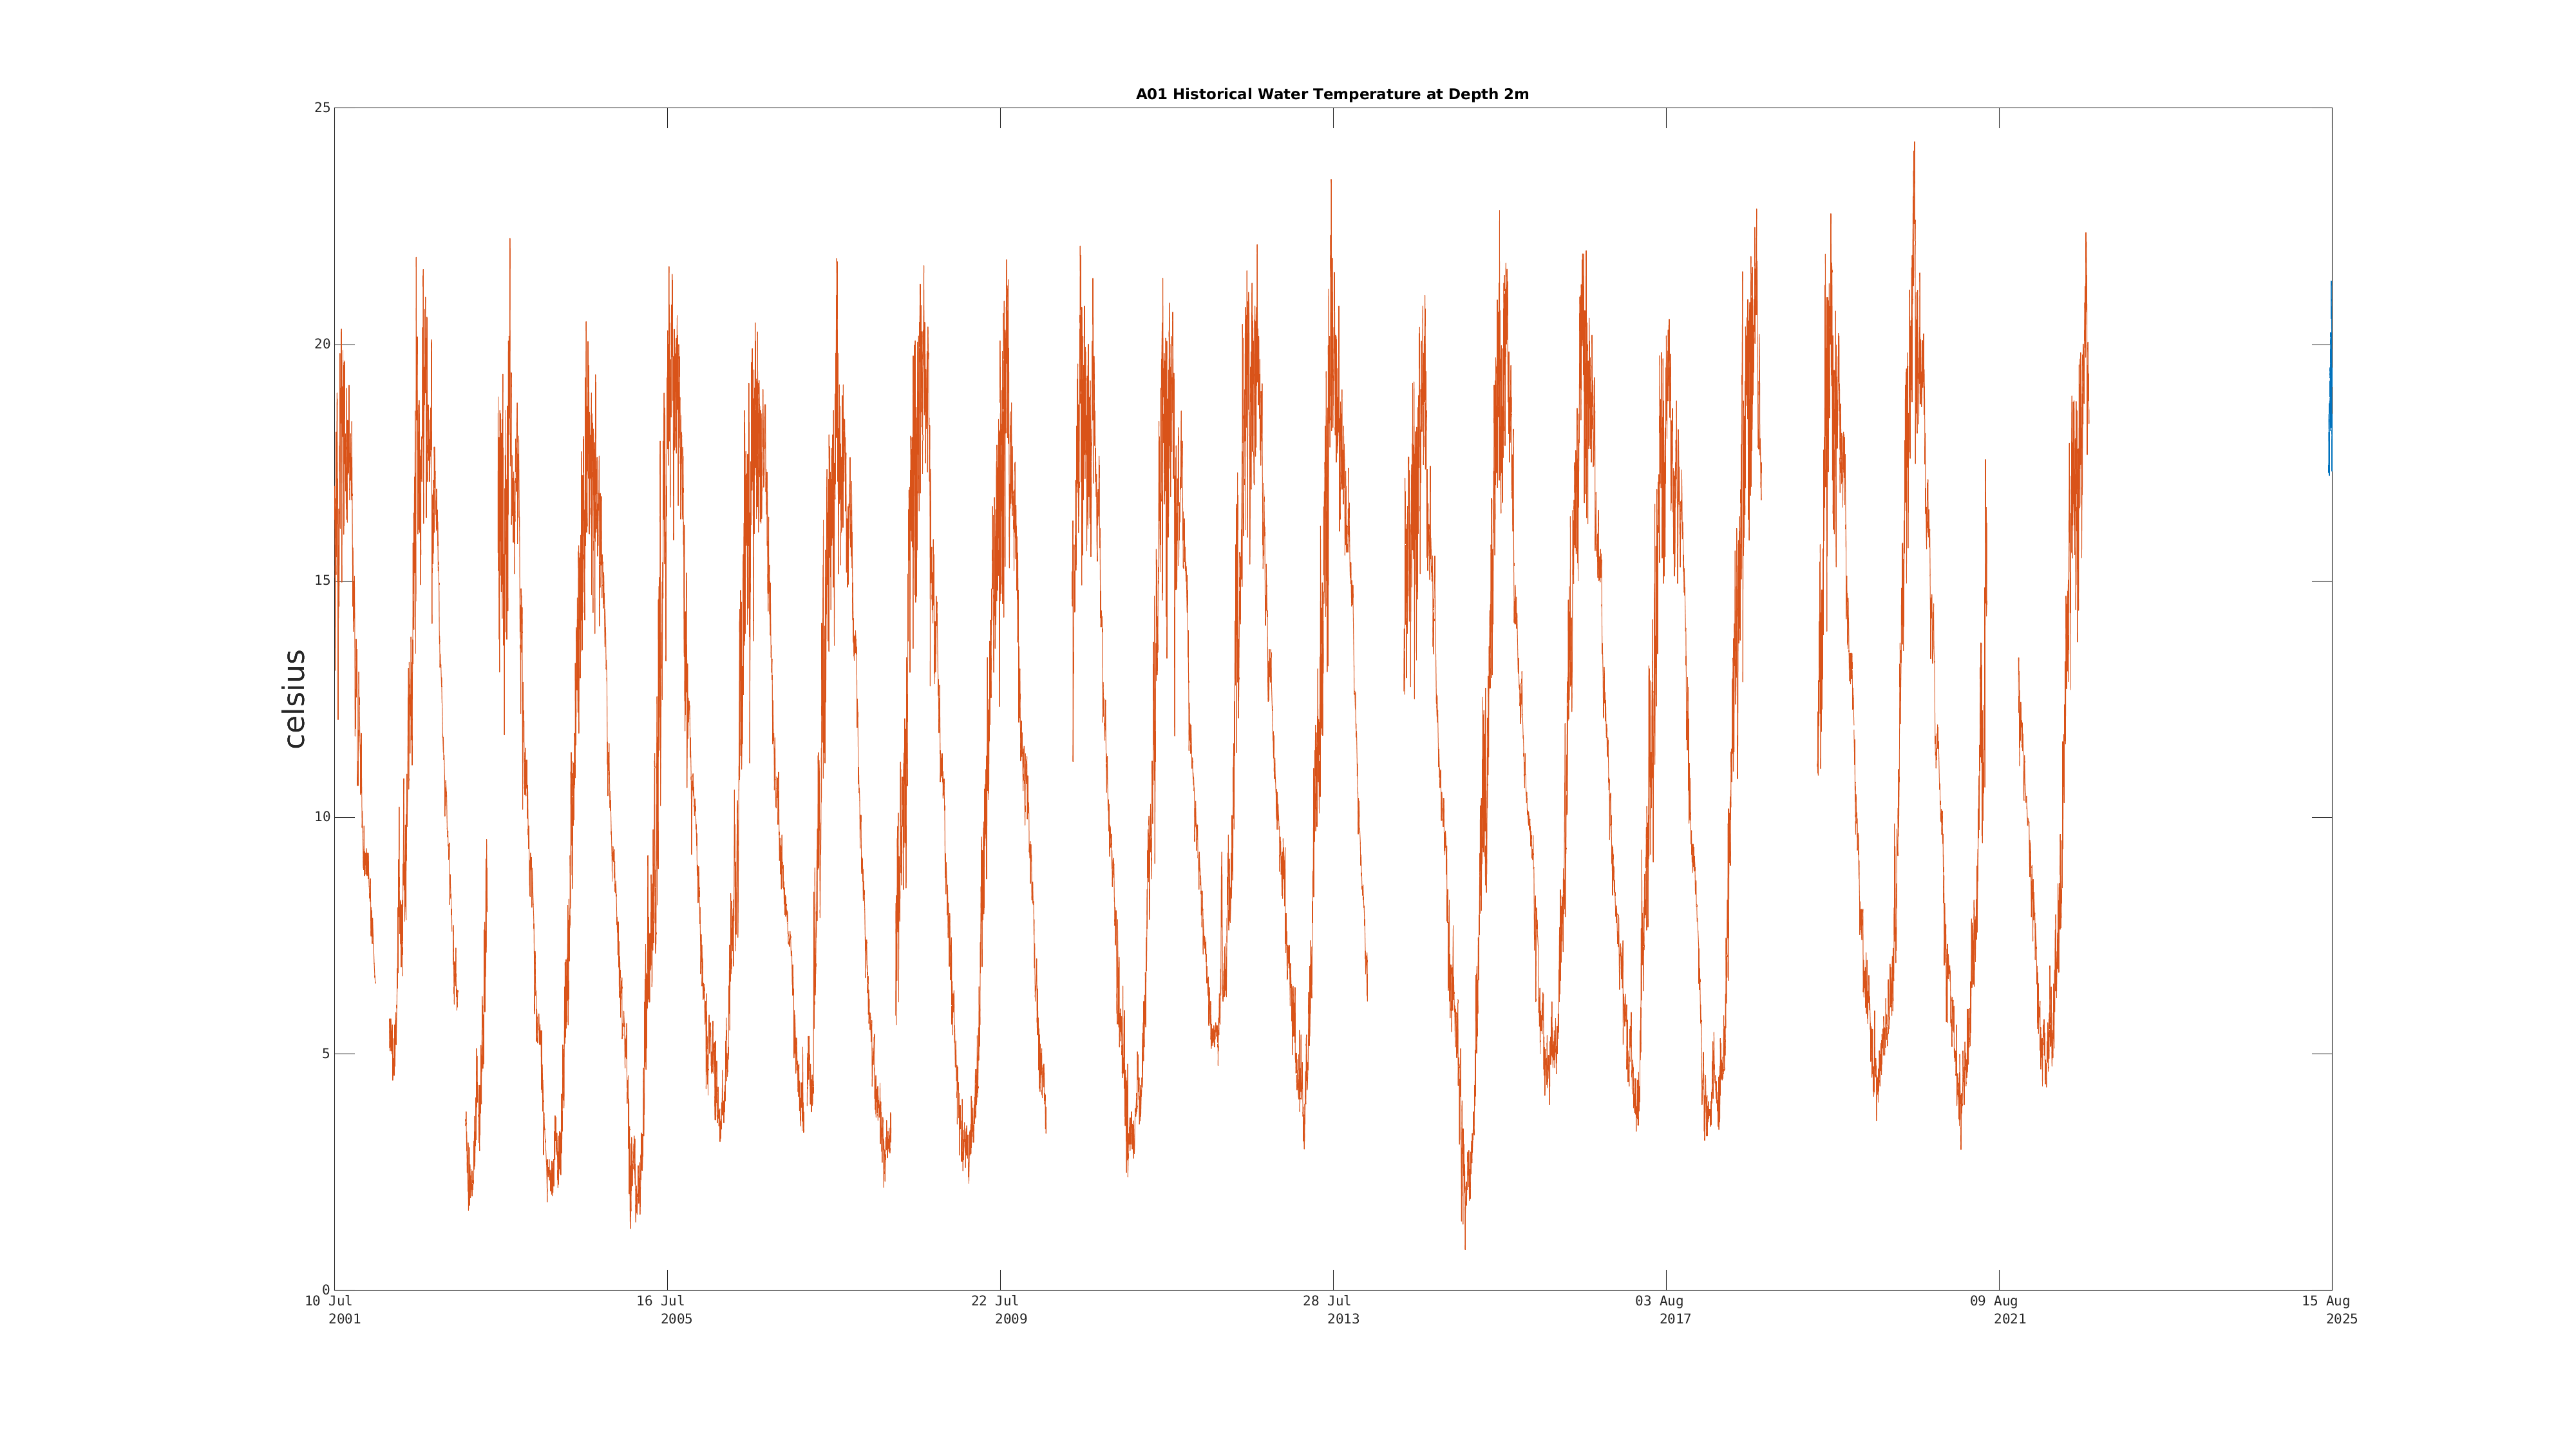
 Entire Position History: