|
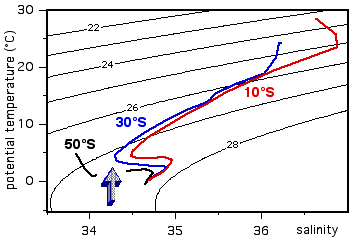
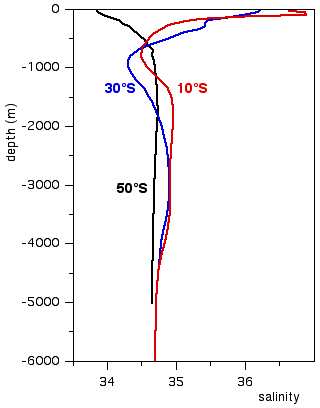
Let us see how curves in the TS-diagram relate to observations in space. 
The arrow in the TS-diagram points to a minimum in the salinity observed at 30°S. Can you identify this minimum in the vertical salinity profiles on the right? Click on the minimum in the corresponding profile. If you need help, click here. |

|