|
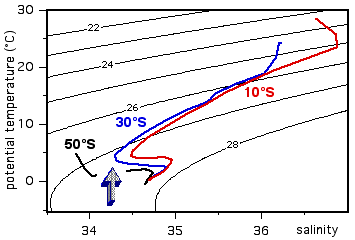
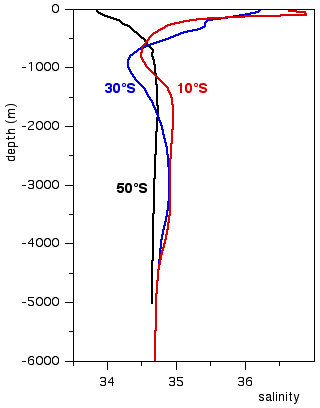
You are asked to identify the point on one of the curves in the right diagram that corresponds to the salinity minimum in the TS-diagram of the station at 30°S. This involves these steps: 
|

|
|
You are asked to identify the point on one of the curves in the right diagram that corresponds to the salinity minimum in the TS-diagram of the station at 30°S. This involves these steps: 
|

|