Exercise 4: Water masses.

Page 6

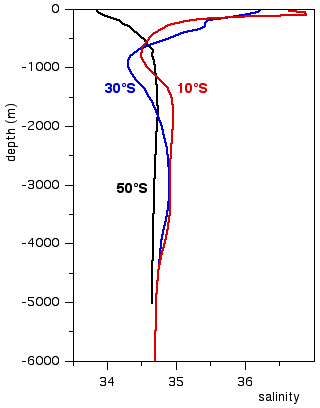
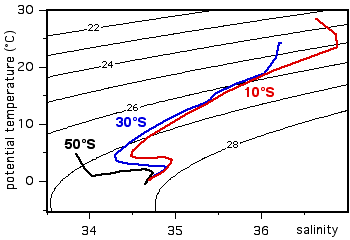
Let us look at the structure of the ocean in a TS-diagram. The diagram on the right gives the distribution of salinity with depth which we know already. The diagram on the left shows the same stations in a TS-diagram; it includes isopycnals (contours of constant σt). Strictly speaking it is actually a ΘS-diagram, since it uses potential temperature as the vertical axis. But most oceanographers use the term TS-diagram for this situation as well.

Note that the TS-diagram does not indicate depth but displays only changes of S against T or Θ. Temperature and salinity usually go through much larger changes in the upper 1000 m of the water column than at greater depth. Regions whithout change in properties are displayed in a TS-diagram as a single point, regardless of their extent in space.

Features to note from the TS-diagram are:

  1. All TS-curves converge towards the same point in the diagram at great depth (lowest temperatures). This indicates that the water at the bottom of the ocean is the same everywhere.

  2. Going up from the bottom towards the surface, all TS-curves (in the Atlantic Ocean and most other ocean regions) show a salinity increase until they reach a subsurface salinity maximum. In the Atlantic Ocean this maximum reaches higher salinity values in the north than in the south (compare the TS-curves near Θ = 3.5°C at 10°S and 30°S).

  3. Further up in the water column, all TS-curves go through a subsurface salinity minimum. Salinities at the minimum are higher in the north than in the south (compare the TS-curves at 10°S and 30°S near Θ = 5°C). The subsurface minimum is not observed in polar regions, where the lowest salinity is found at the surface.

  4. TS-curves from different stations in the tropics and subtropics in the upper 1000 m of the water column are nearly identical, indicating that this depth range is occupied by the same water. Exceptions occur close to the surface, where tropical stations reach higher temperatures than subtropical stations.


back to contents © 2000 m. Tomczak
contact address:
home page: http://www.es.flinders.edu.au/~mattom
web address of Exercises in Oceanography: http://www.es.flinders.edu.au/~mattom/IntExerc
This page last updated 5 December 1999