  |
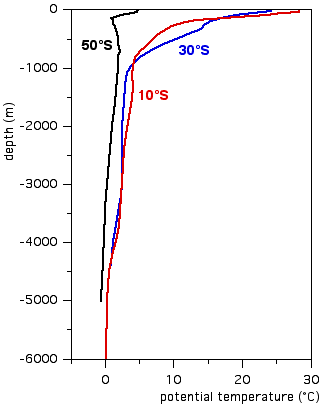
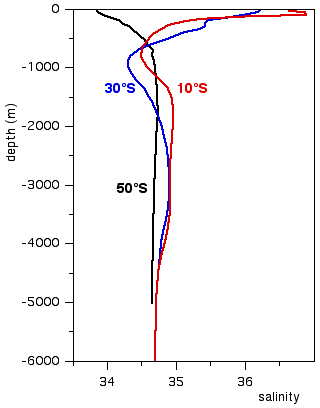
The ocean is of course deeper than 2000 m, so let us have a look at the same stations but extend them to the ocean floor. The water depth at 53.5°S is only 3500 m, so we shift the polar station slightly north to 50°S.
|
Notice that the diagram on the left now shows potential temperature. The concept of potential temperature will be explained in the next page.
For the moment, points to note with respect to (potential) temperature and salinity at great depth are:
Below 1000 - 1500 m depth temperature changes very little with depth or with latitude. Temperatures at these depths are well below 5°C.
At great depth (below 5000 m) potential temperature from all locations converges towards values in the range from -0.5°C to 1.5°C.
Salinity generally shows a minimum near 600 - 1000 m (however, this minimum is not found in the polar regions) and a maximum somewhere in the depth range 1500 - 3500 m. Below the maximum, salinity decreases continuously towards the bottom.
We can get more insight into the reasons for this distribution of temperature and salinity in the ocean by looking at the same data in a TS-diagram. Before we move on to that we have to take a brief look at the situation at very great depth.