
|
Gulf Of Maine Buoy Climatology: Box Plots Physical Oceanography Group School of Marine Sciences University of Maine |
|
|
Gulf Of Maine Buoy Climatology: Box Plots Physical Oceanography Group School of Marine Sciences University of Maine |
| Waves |  |
 |
|
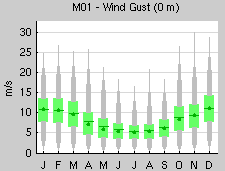
| Winds | 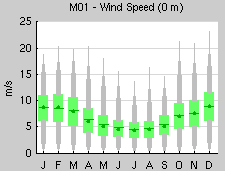 |
 |
|
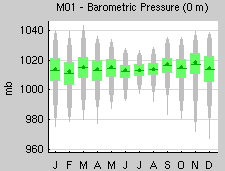
| Air Temp/Pres | 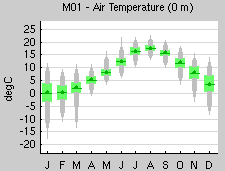 |
 |
|
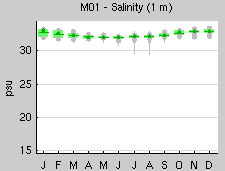
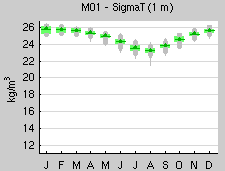
| 1m | 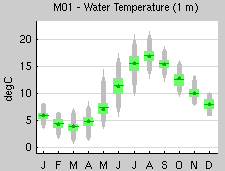 |
 |
 |
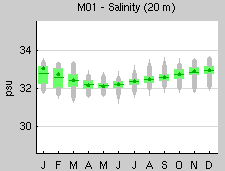
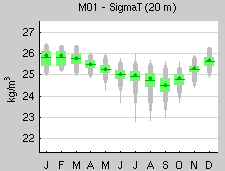
| 20m | 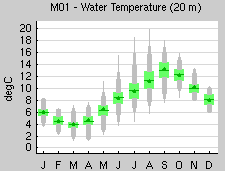 |
 |
 |
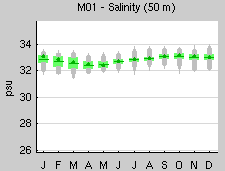
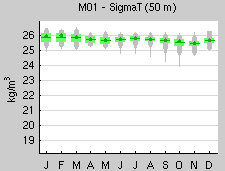
| 50m | 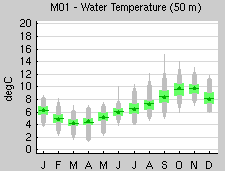 |
 |
 |
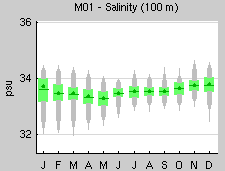
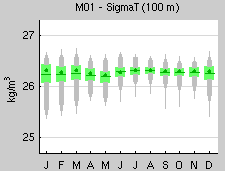
| 100m | 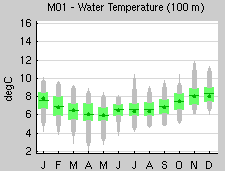 |
 |
 |
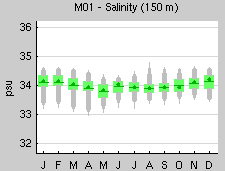
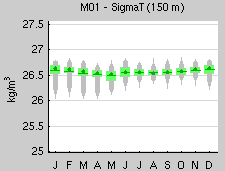
| 150m | 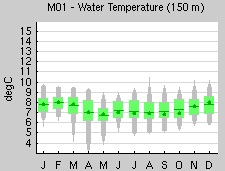 |
 |
 |
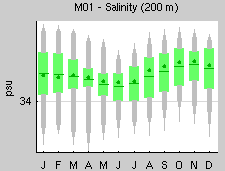
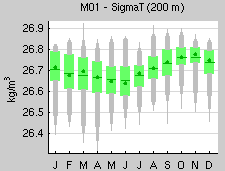
| 200m | 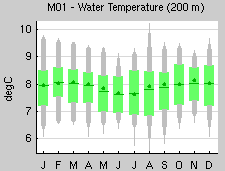 |
 |
 |
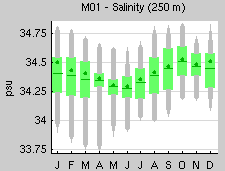
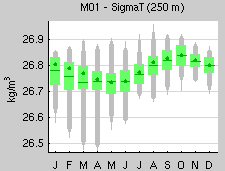
| 250m | 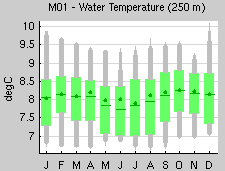 |
 |
 |
| NERACOOS Home | Latest Buoy Data | U.Maine Buoys | U.Maine CODAR | GOM Weather | GOM Wave Modeling | Related Links | Software | Mooring Group | PhOG home |