
|
Physical Oceanography Group School of Marine Sciences University of Maine |
|
|
|
Physical Oceanography Group School of Marine Sciences University of Maine |
|
|
Latitude: 43° 42.88´N Longitude: 69° 21.31´W Location Description: SSE of Port Clyde Deployed: May 04 2024 Coast Guard Light List Letter: E Coast Guard Light List Number 30 (4935) Water Depth: 100 meters (328 feet) Watch Circle Radius: 50 meters (164 feet) Last Cell Phone Transmission: Dec 19, 07 PM EST Last GOES Transmission: Dec 21, 09 PM EST Latest Event: May 04, 10 AM EDT
Deployed by R/V Connecticut |
|

|
Specialized Plots:
 Temperature, Salinity, Density:
|
 Temperature, Salinity, Density (Deployment Only):
|
Click on the graph icons below to see time series plots of the listed variables. The latest conditions are in local time but all plots are in GMT(Summer EDT is 4 hours behind GMT; Winter EST is 5 hours behind GMT; Atlantic AST is always 4 hours behind GMT).
We follow the convention that depth is measure positive "down". That's why parameters like wind speed have negative depths attached to them! The latest eastward and northward subsurface currents are displayed at a subset of available depths; no plots are presently available for current velocity vectors below 2m. Click here for additional Information.
| Variable (measurement depth in meters) | Last Observation |
Last Update (EST) |
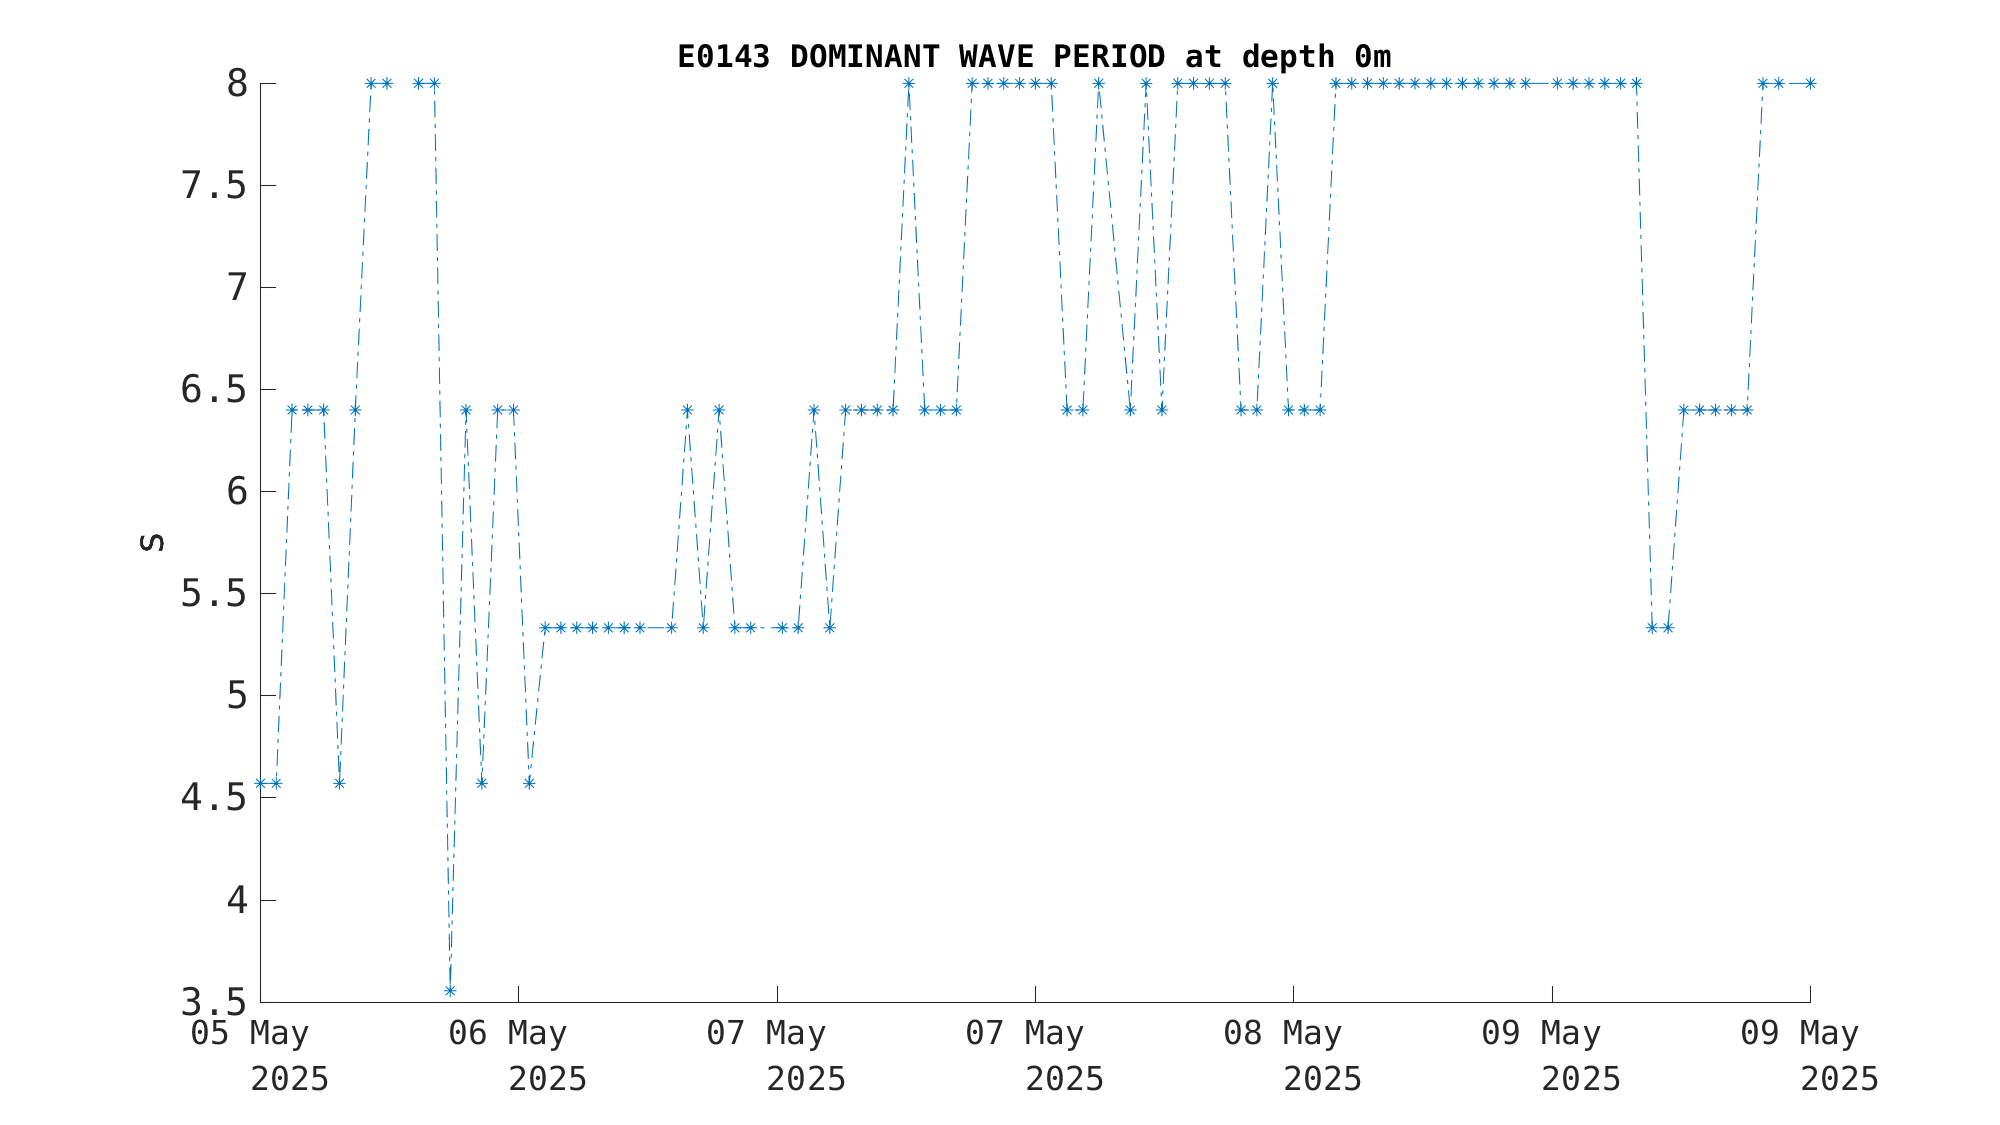
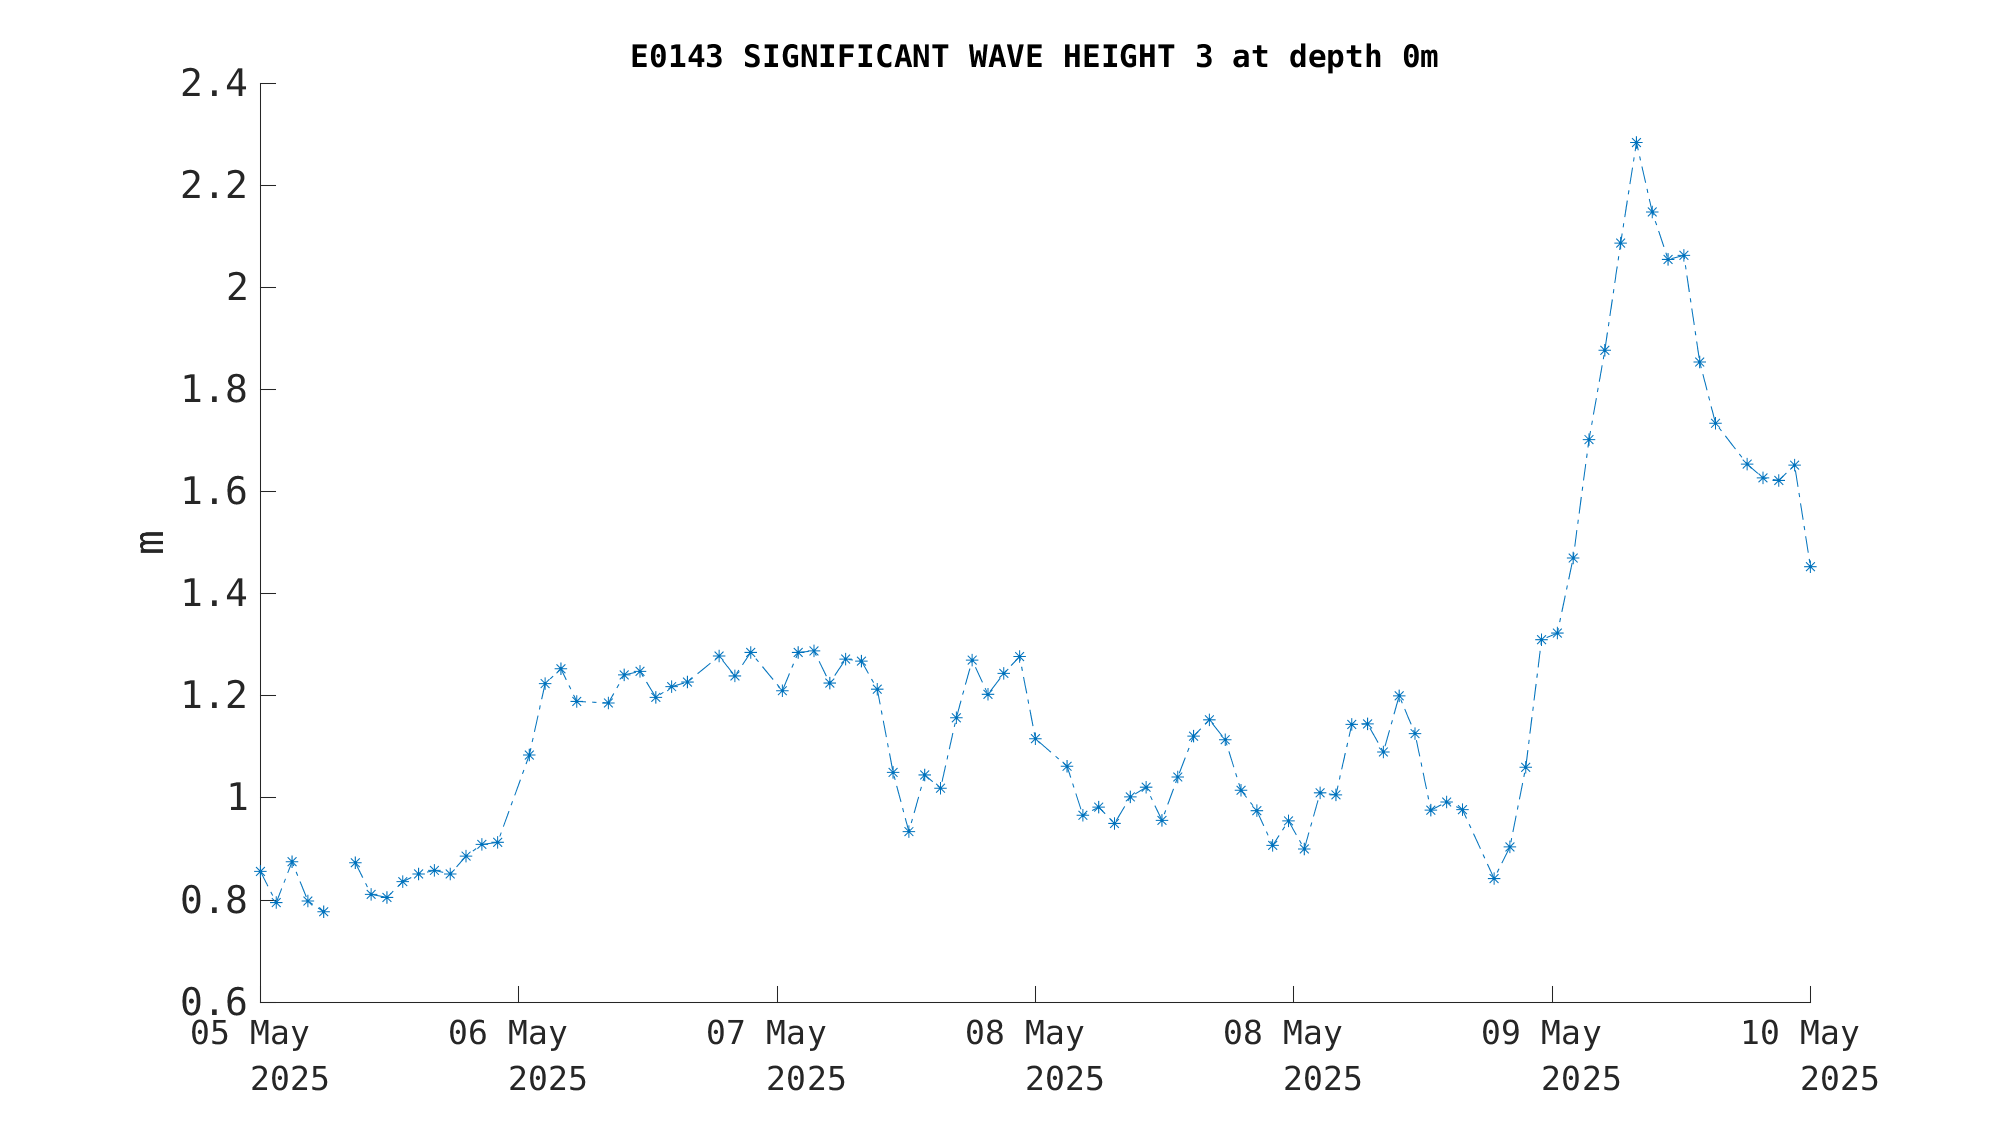
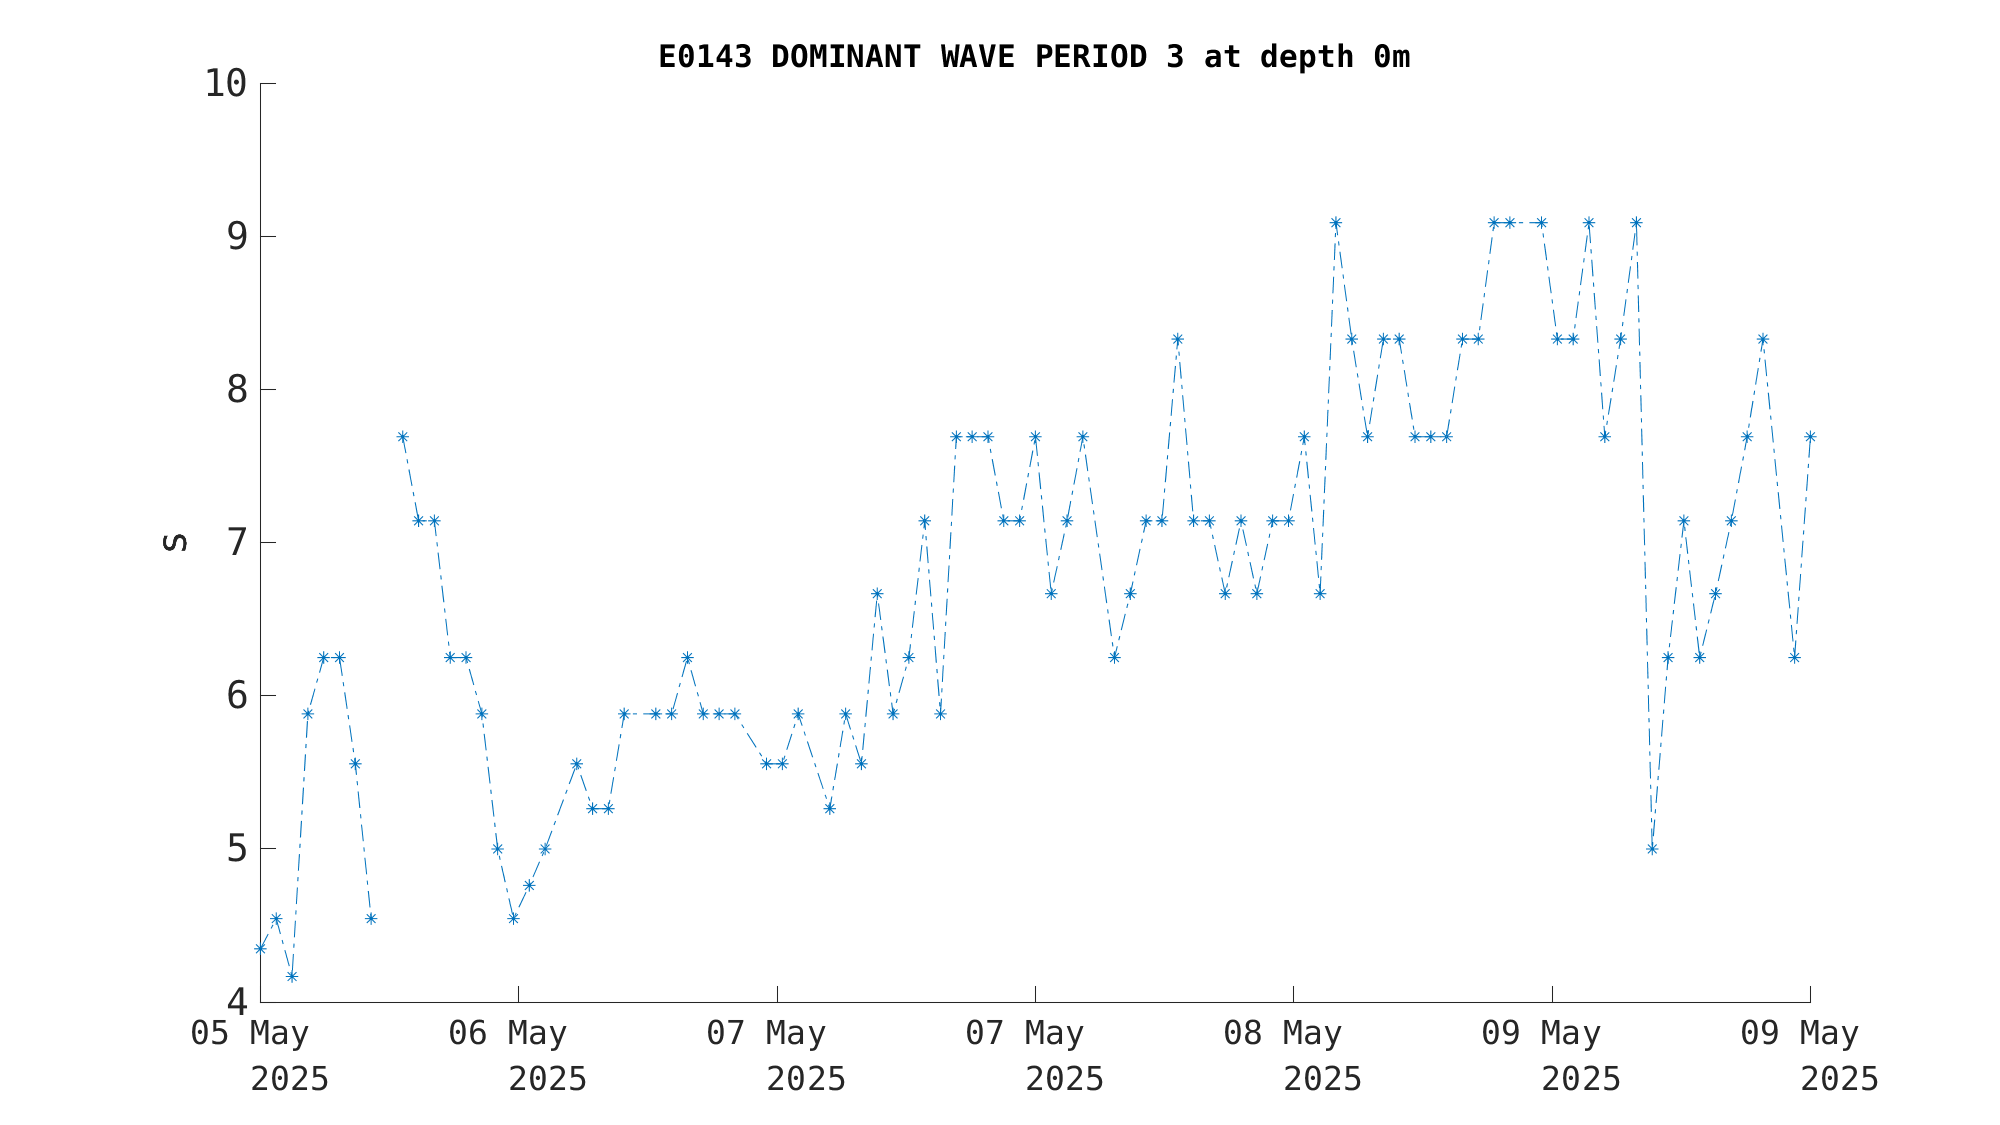
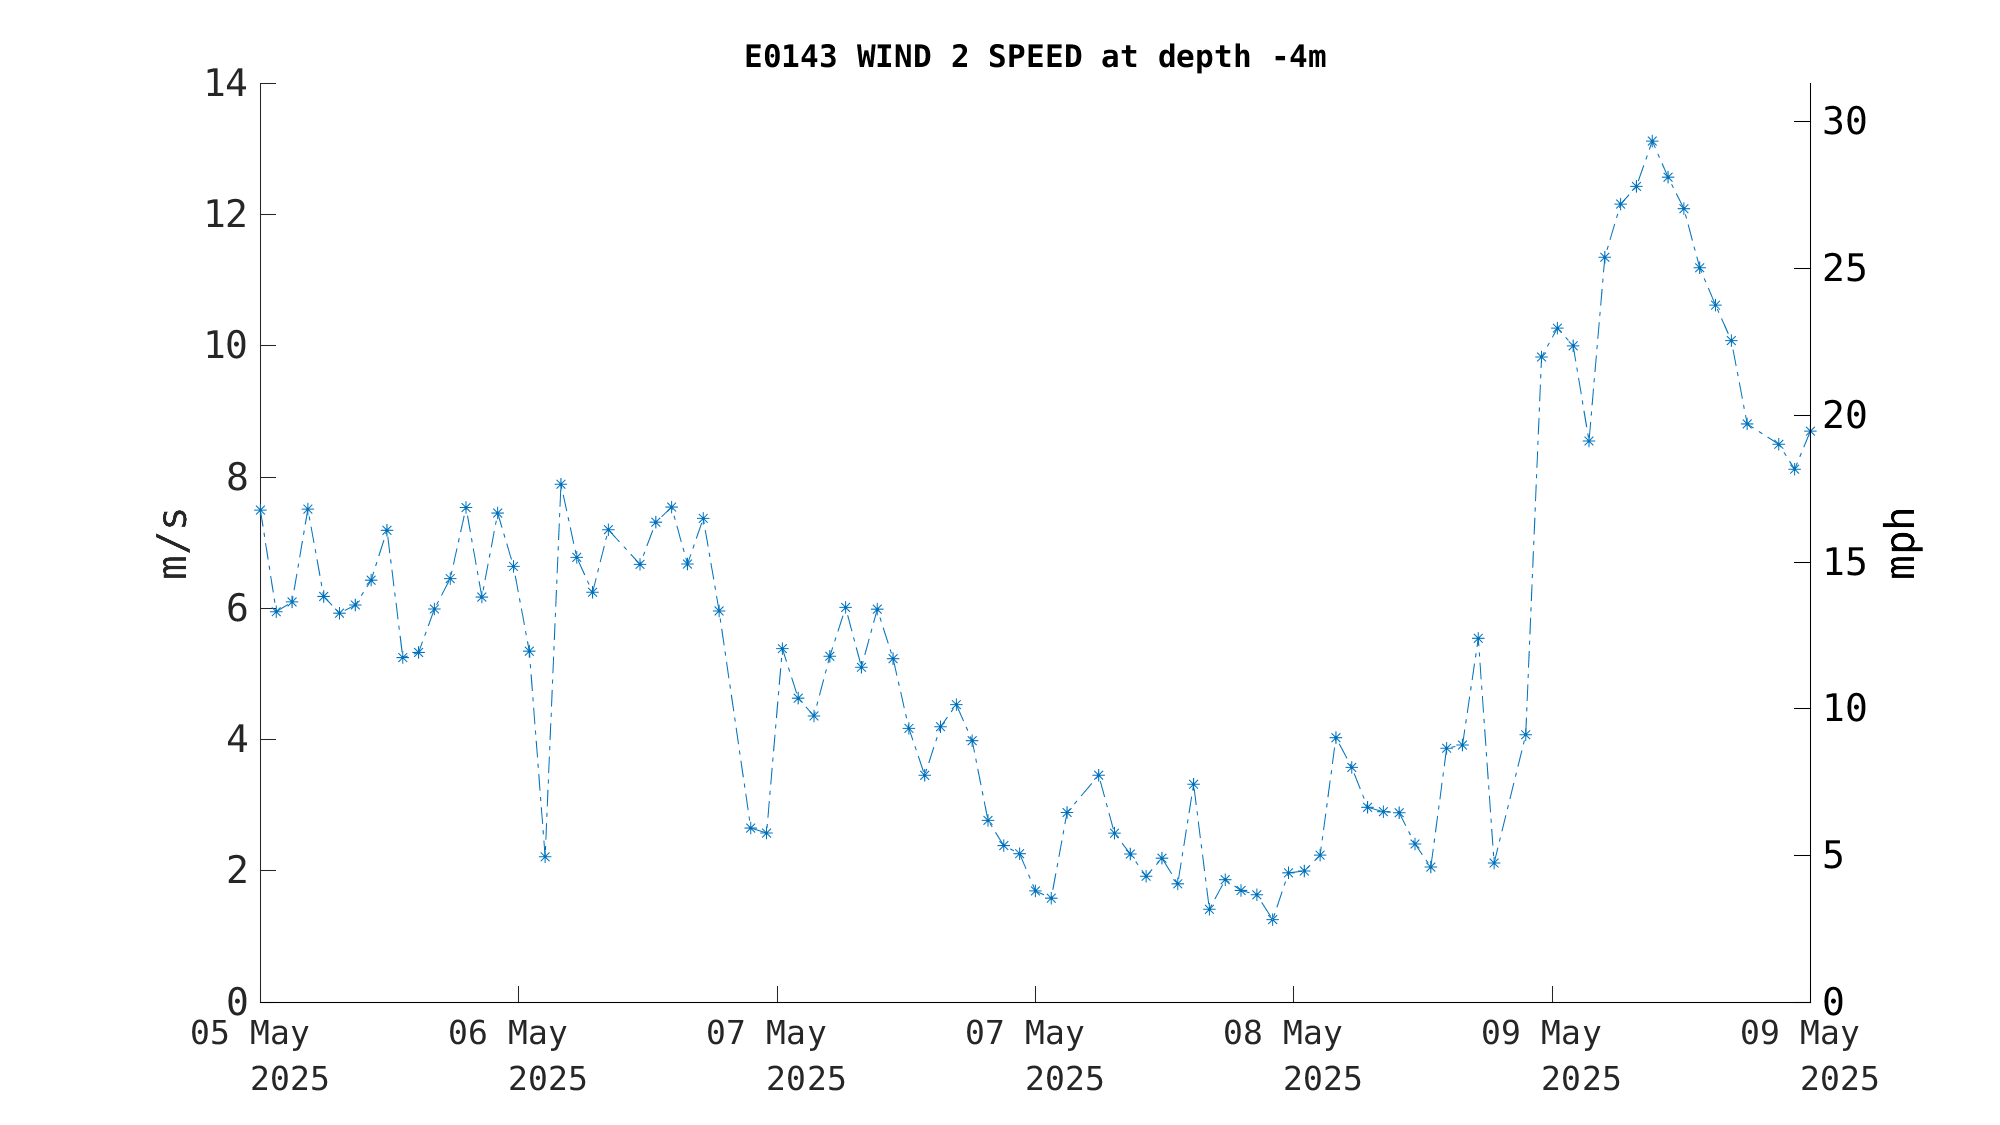
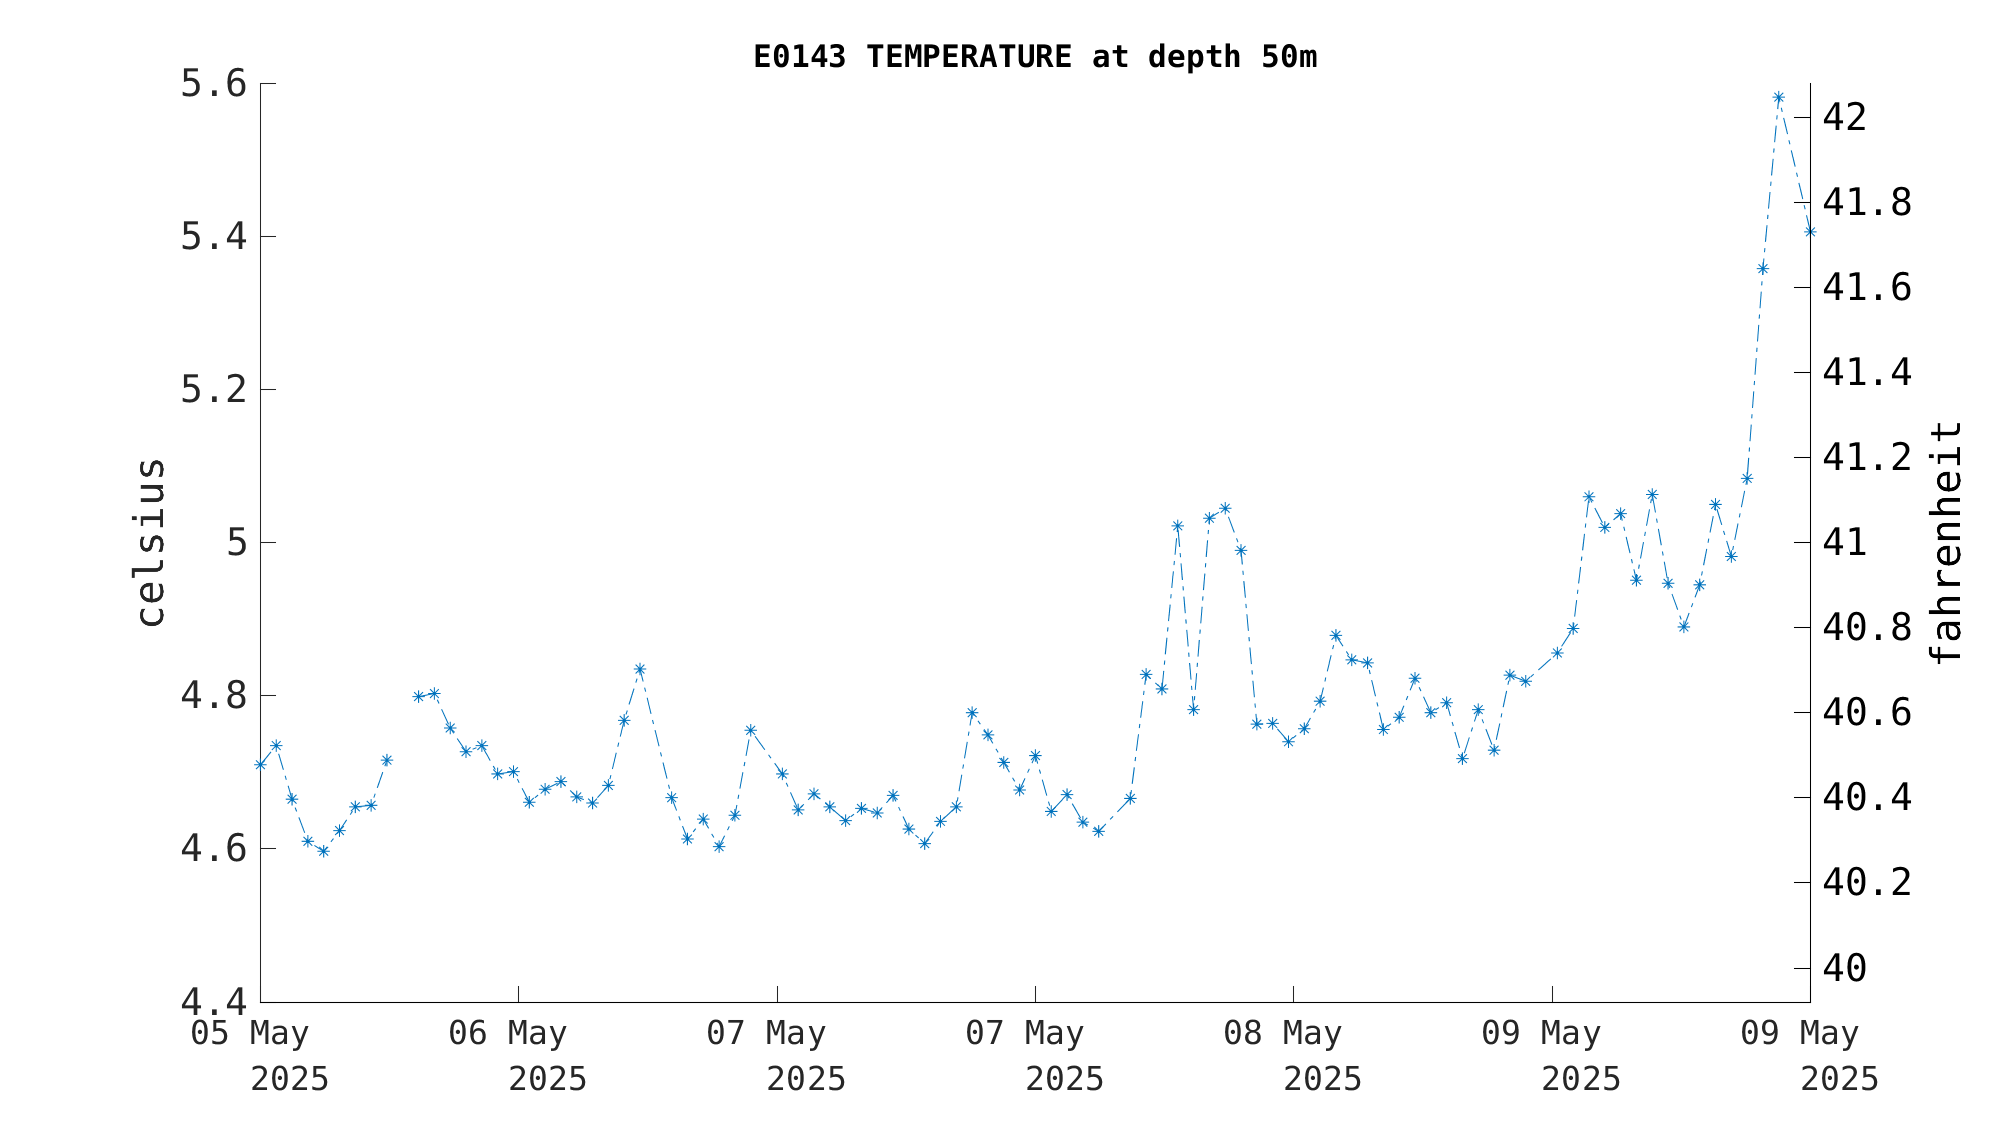
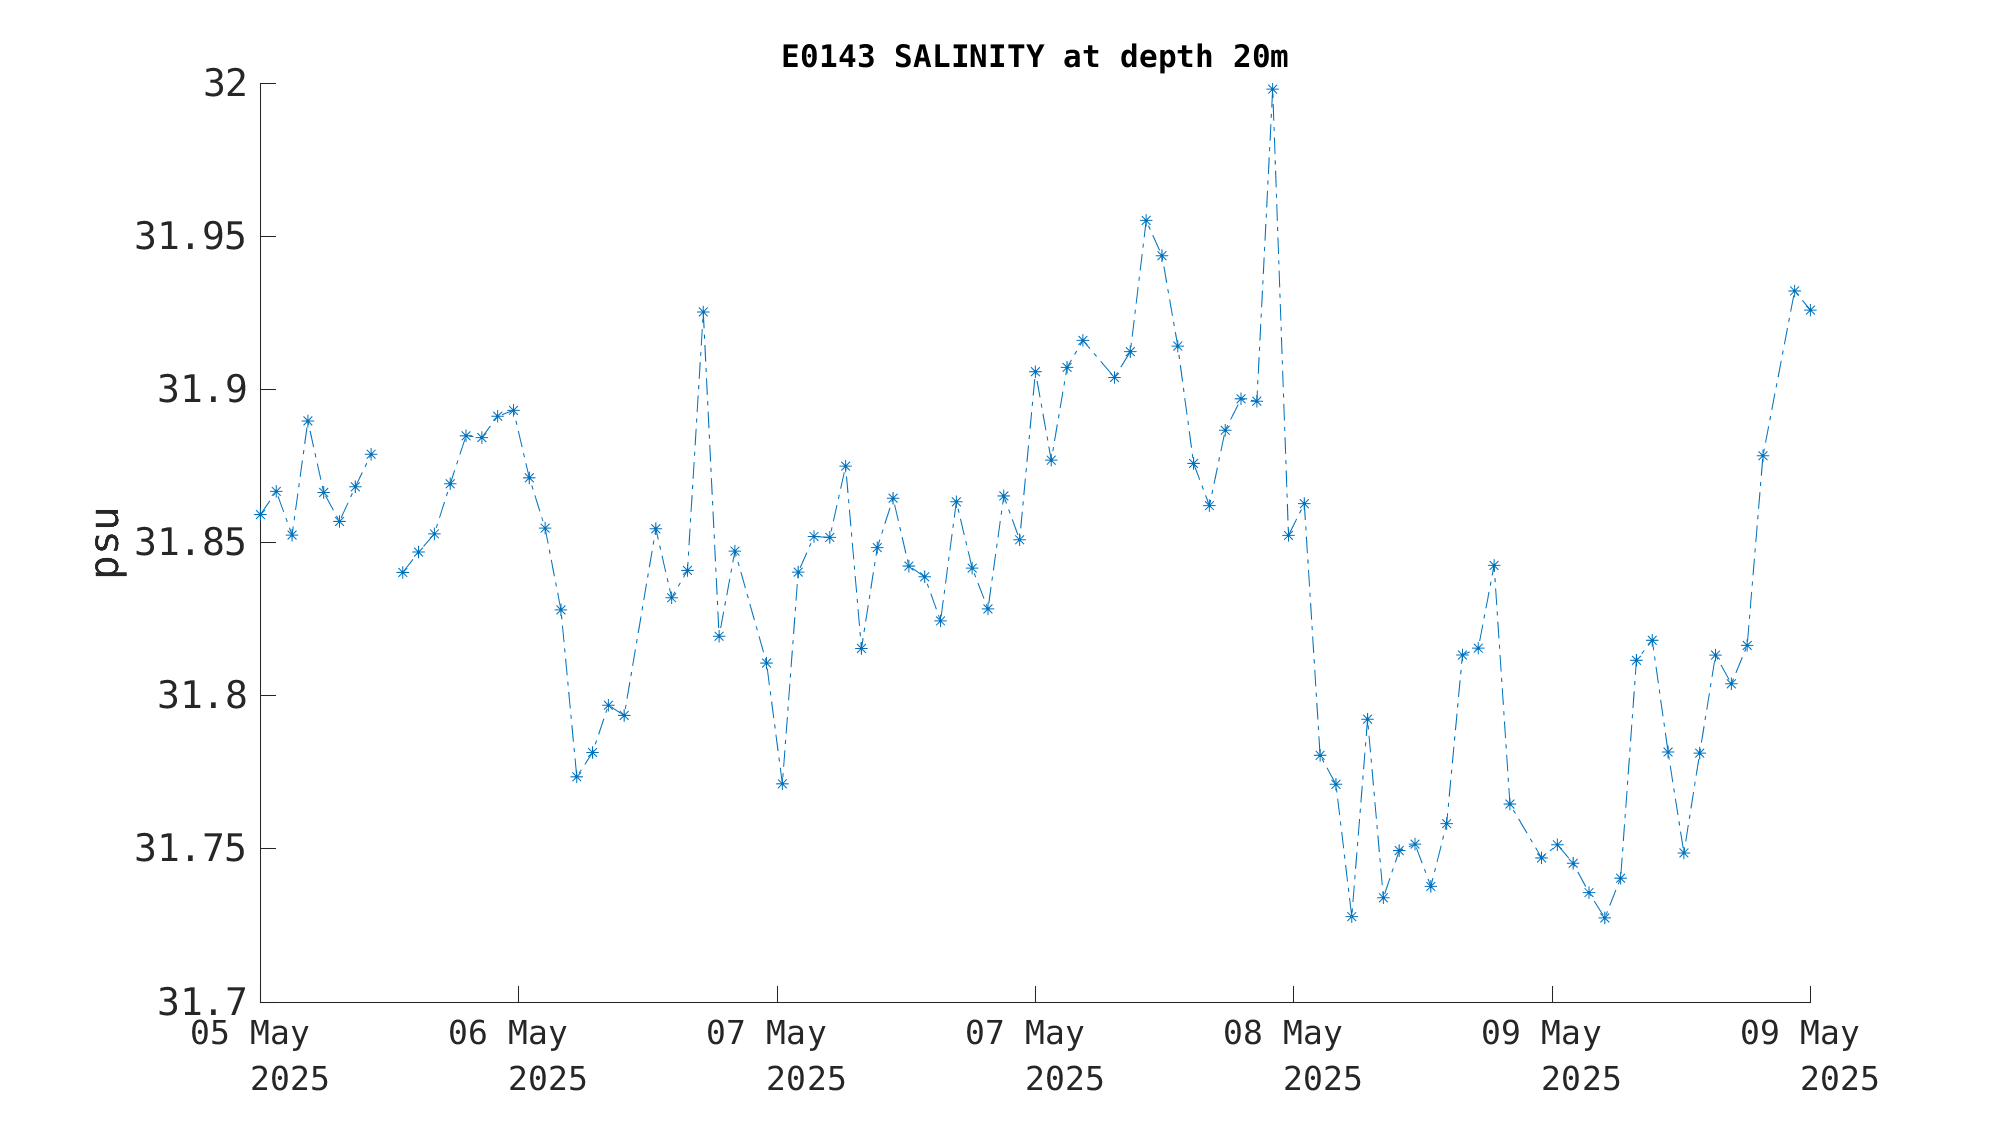
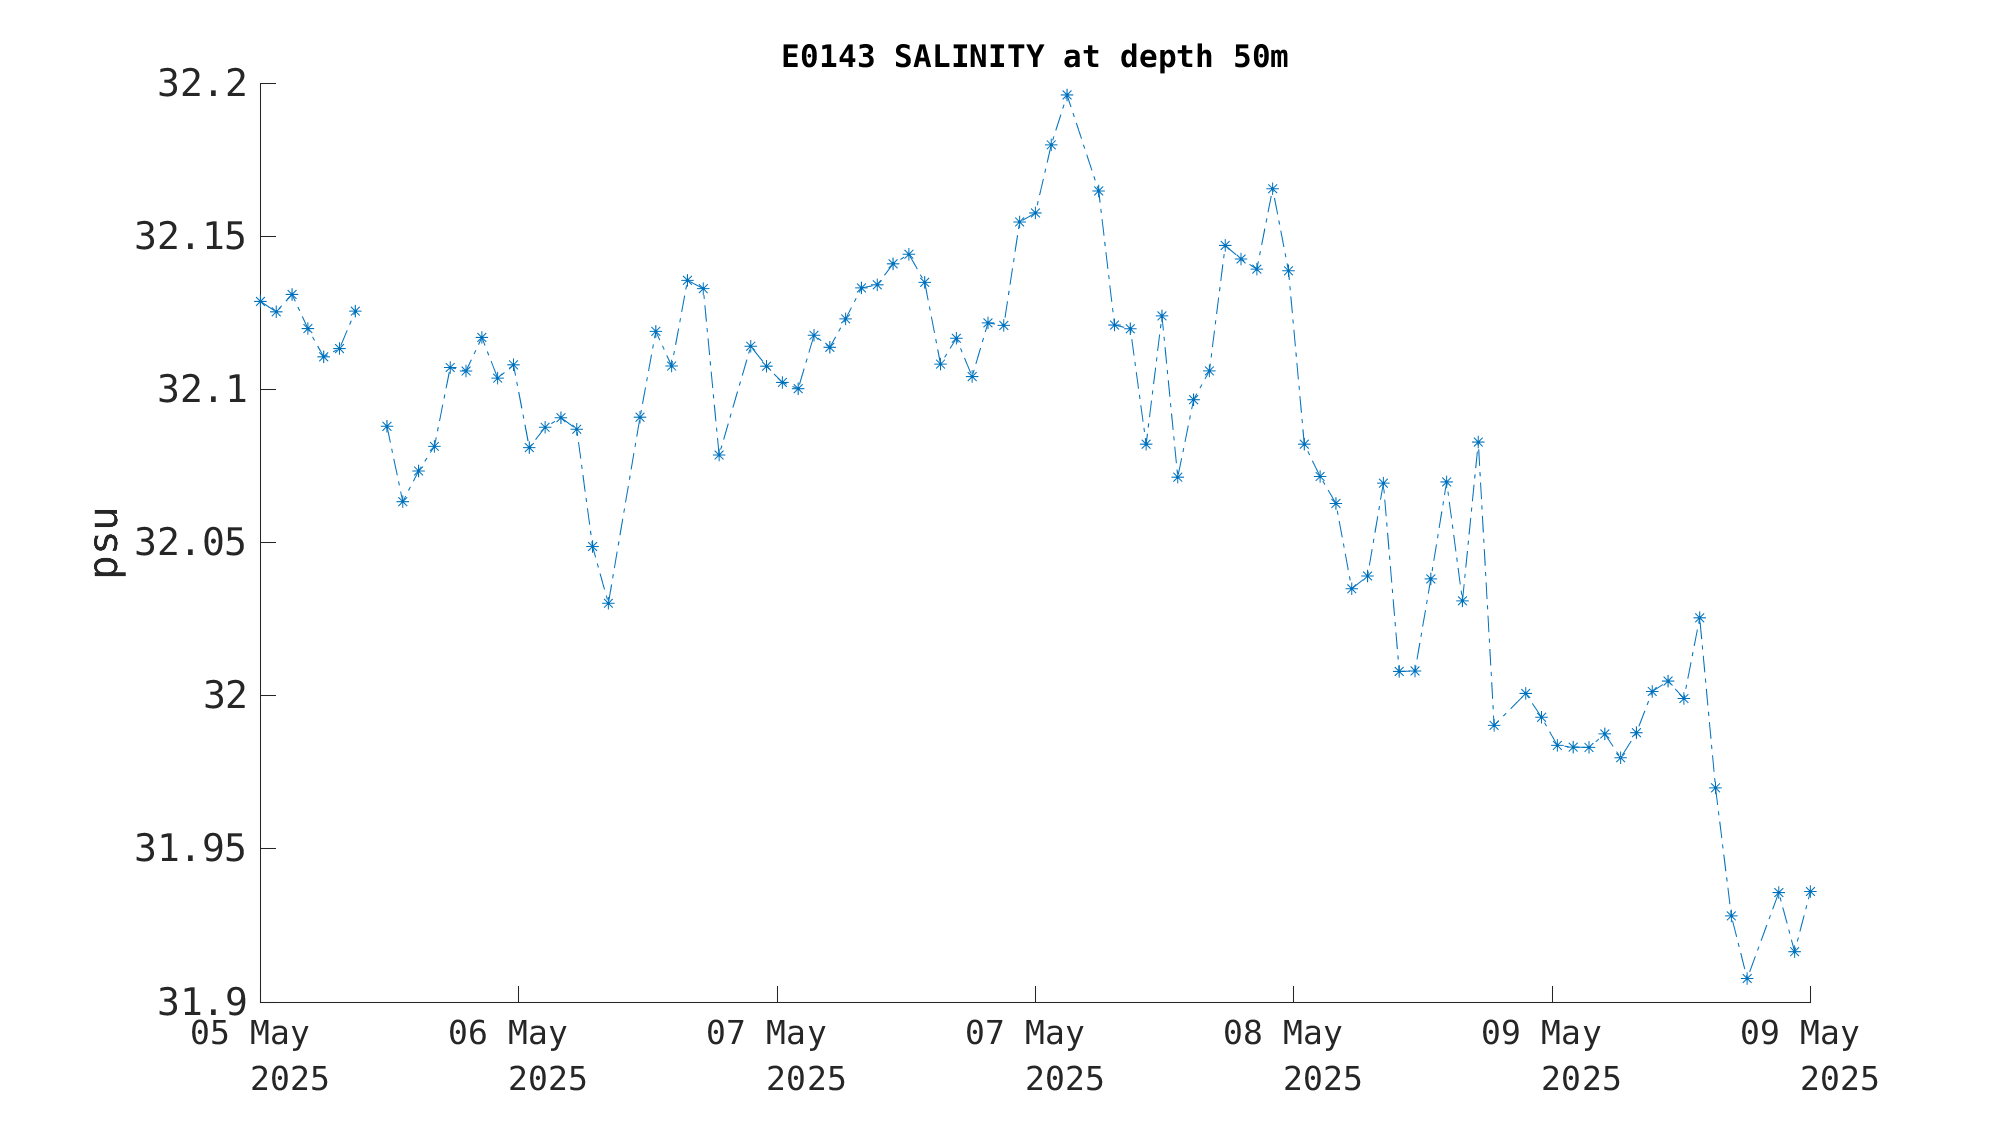
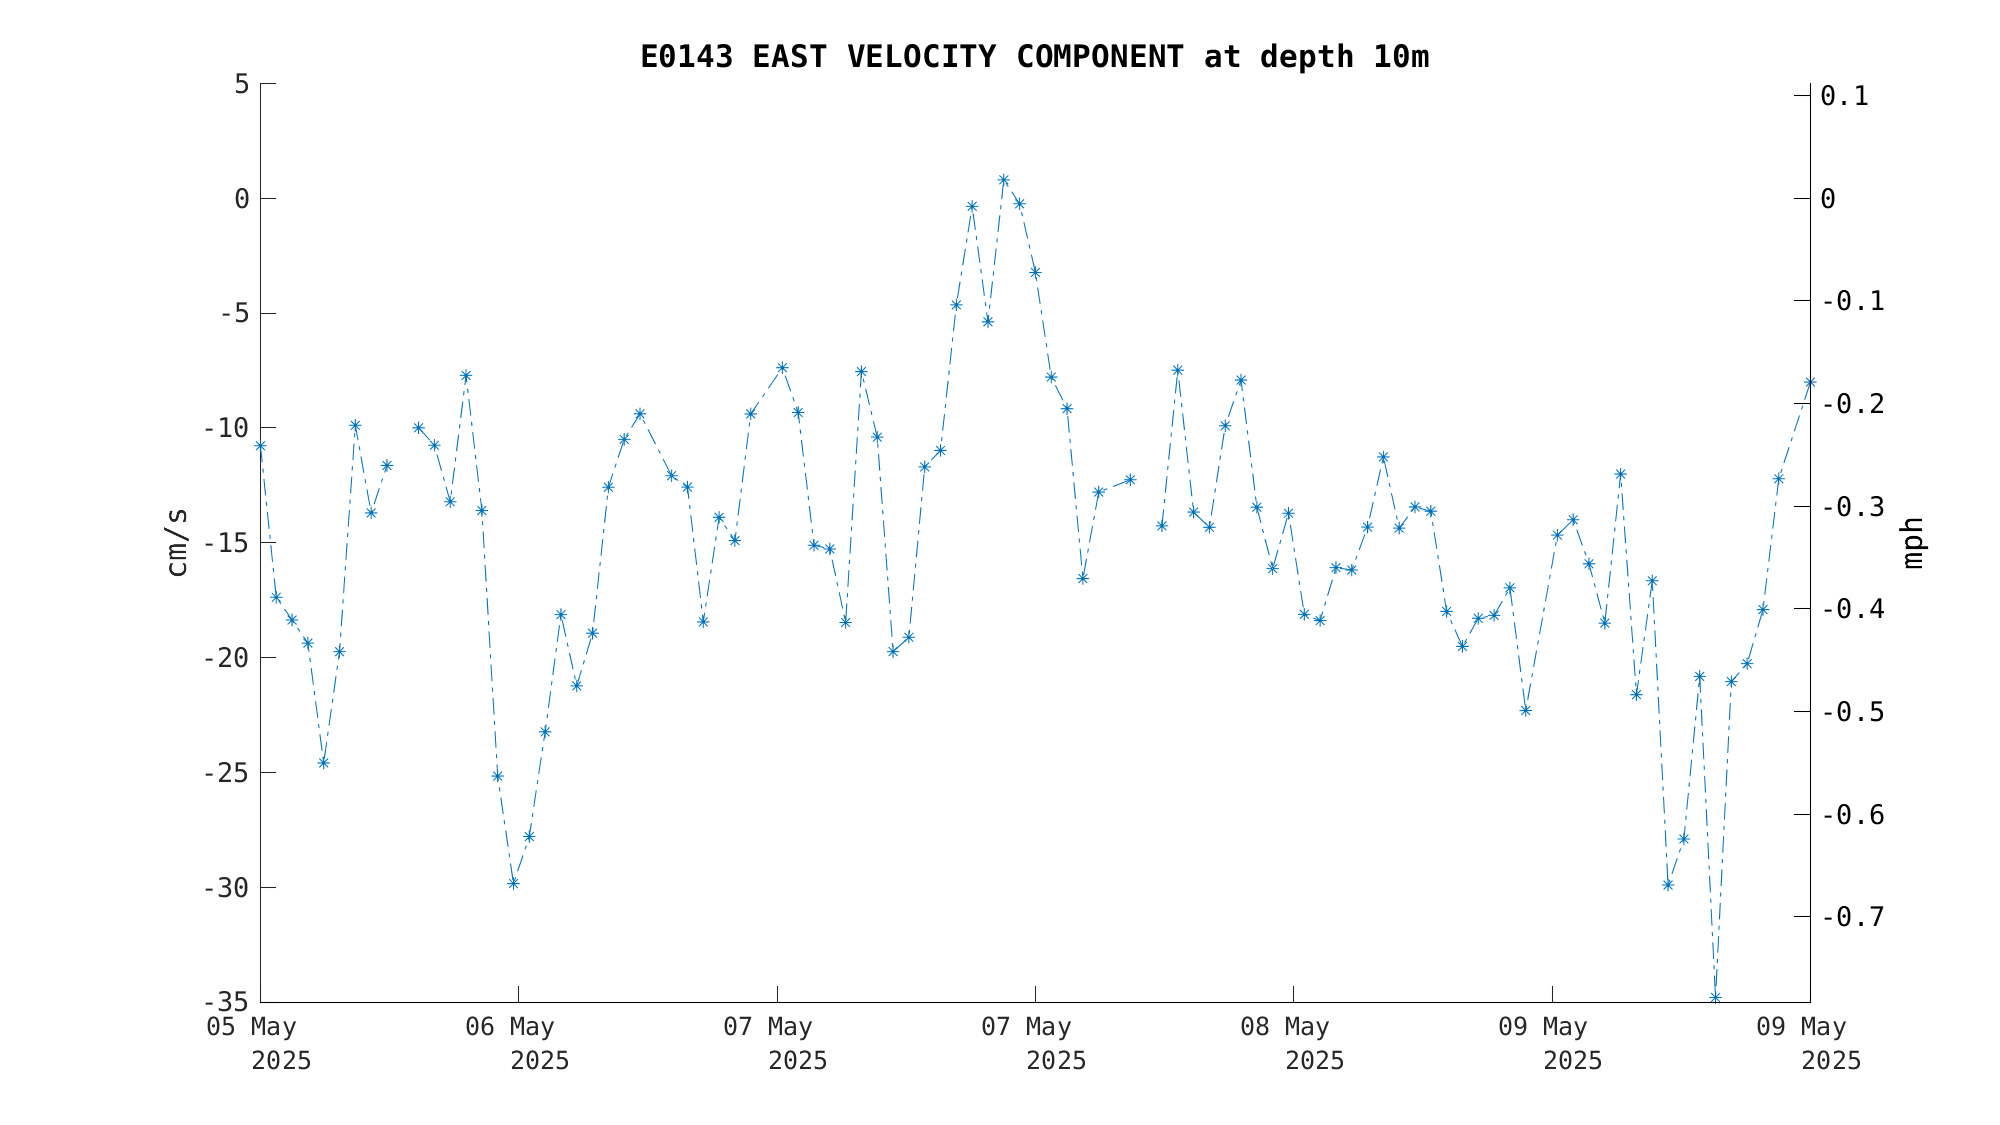
Most Recent Data Plot |
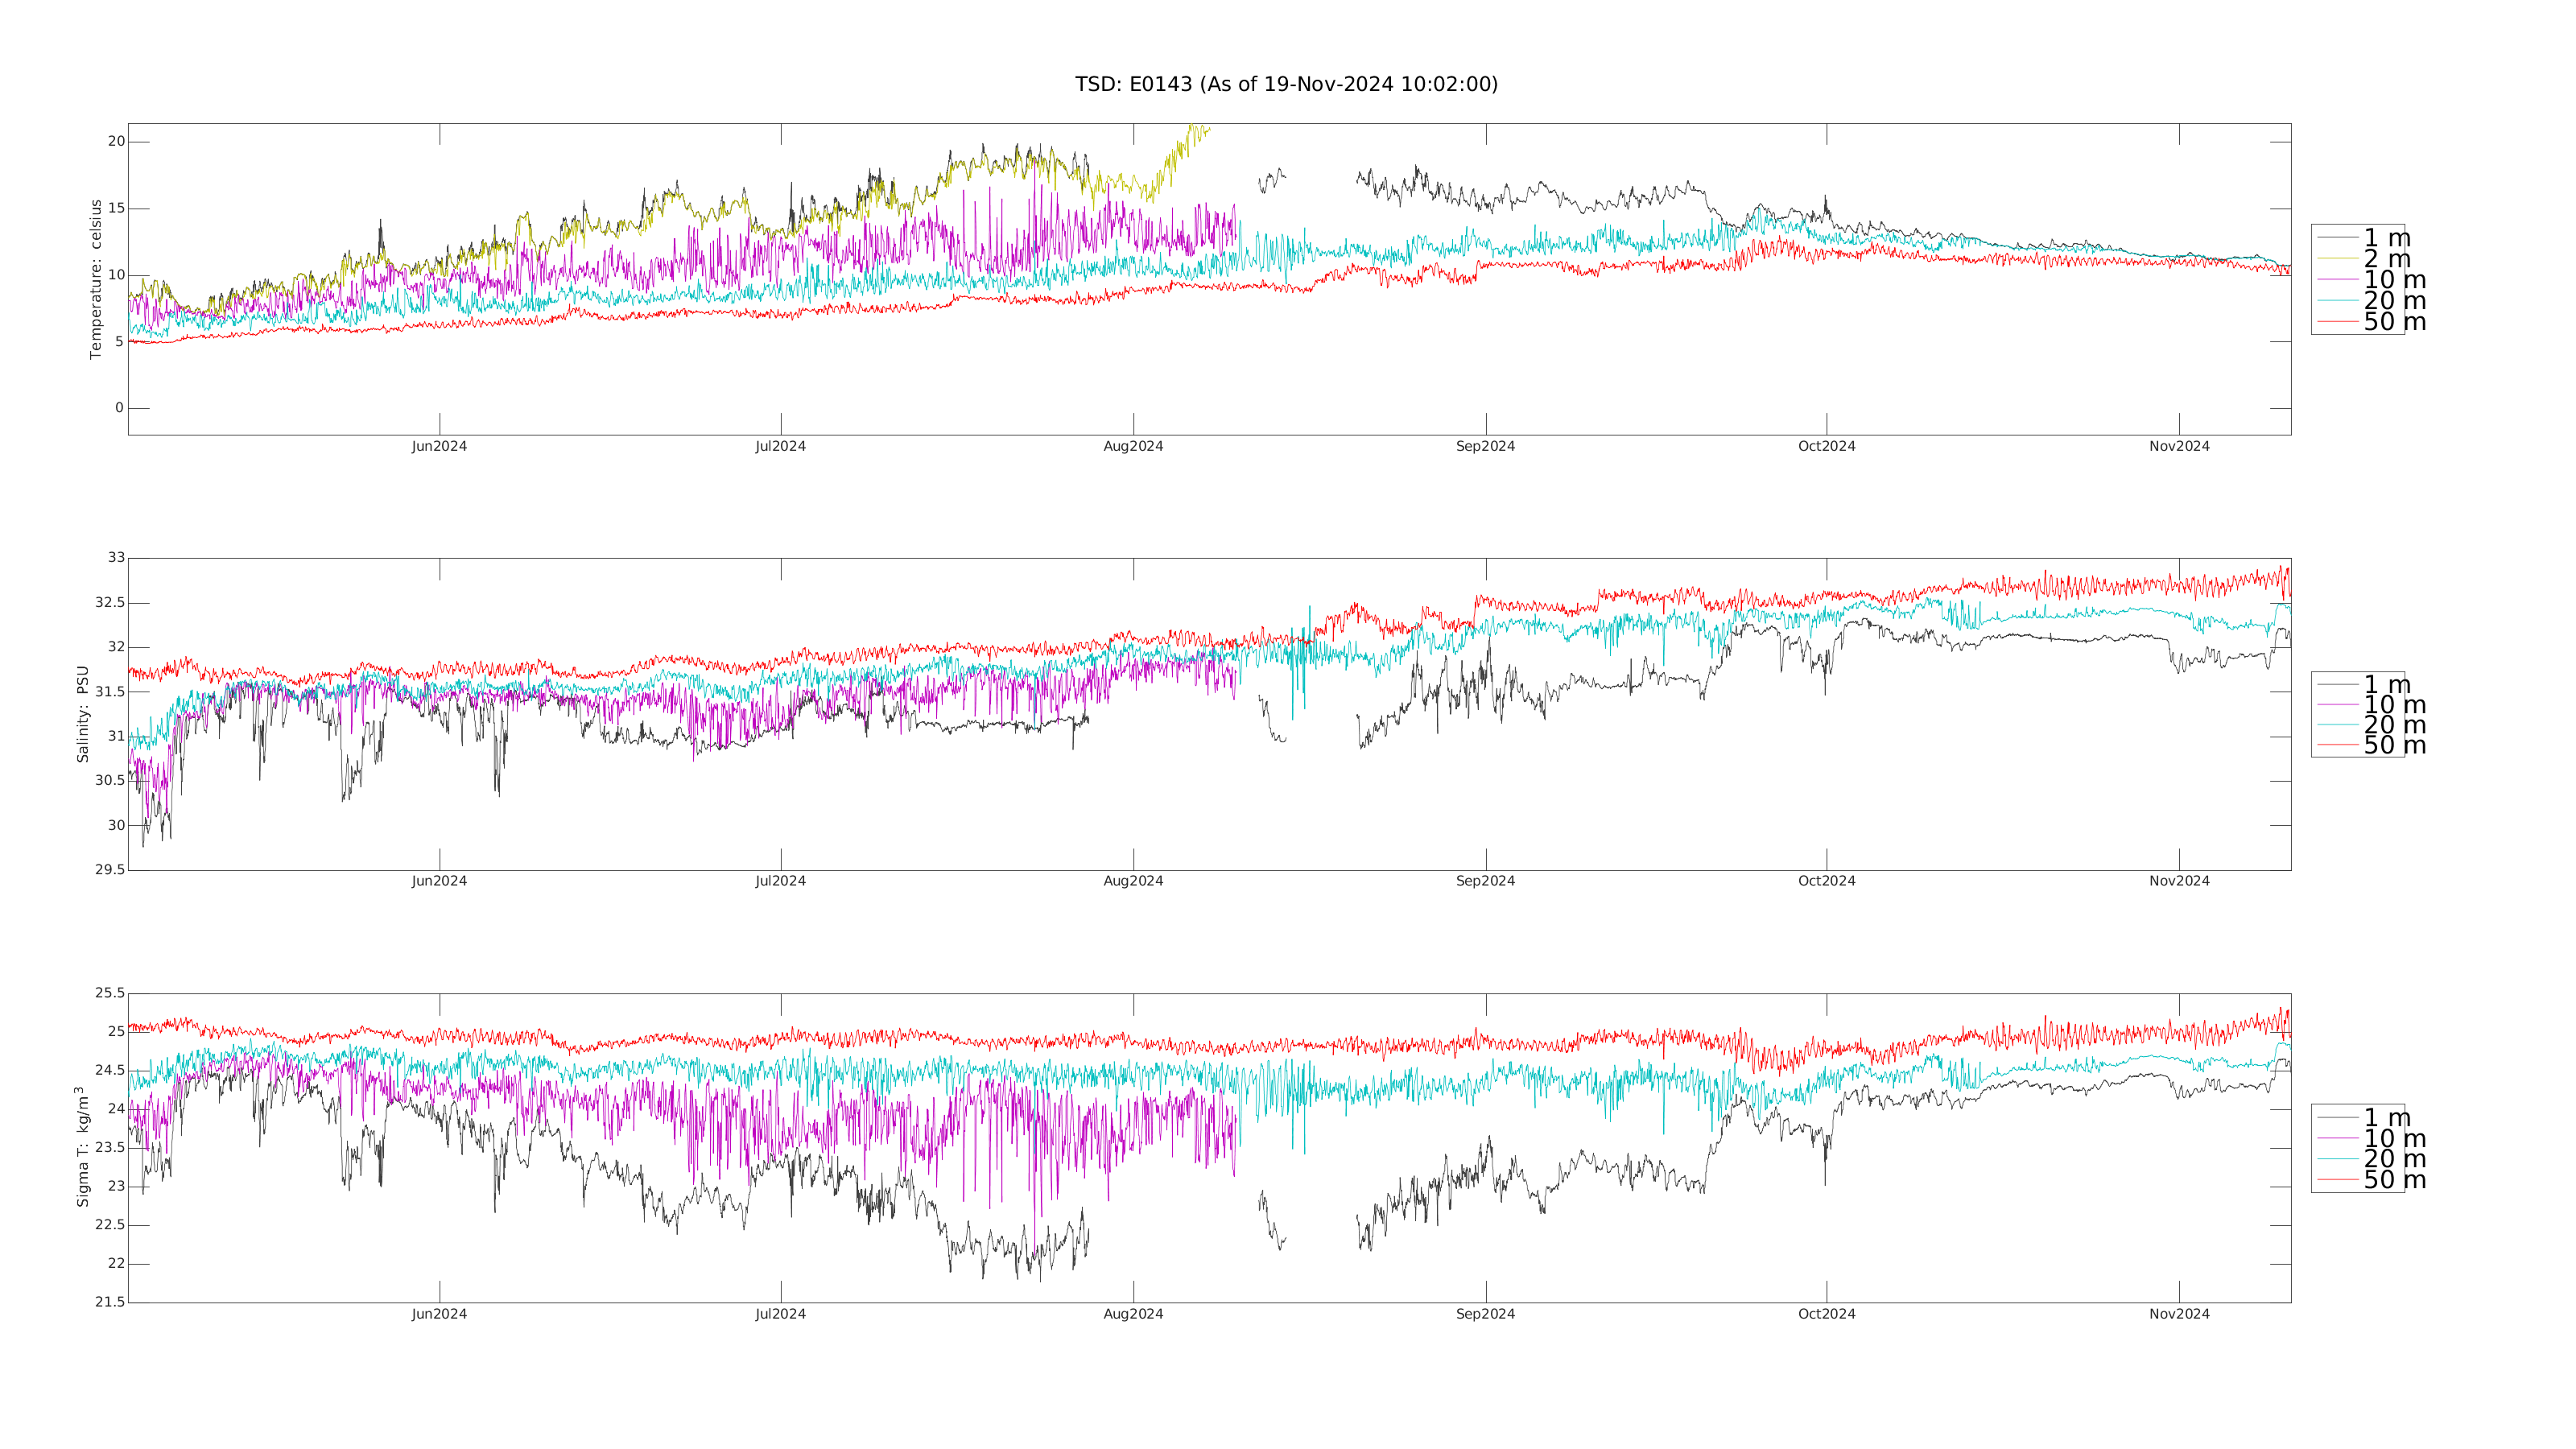
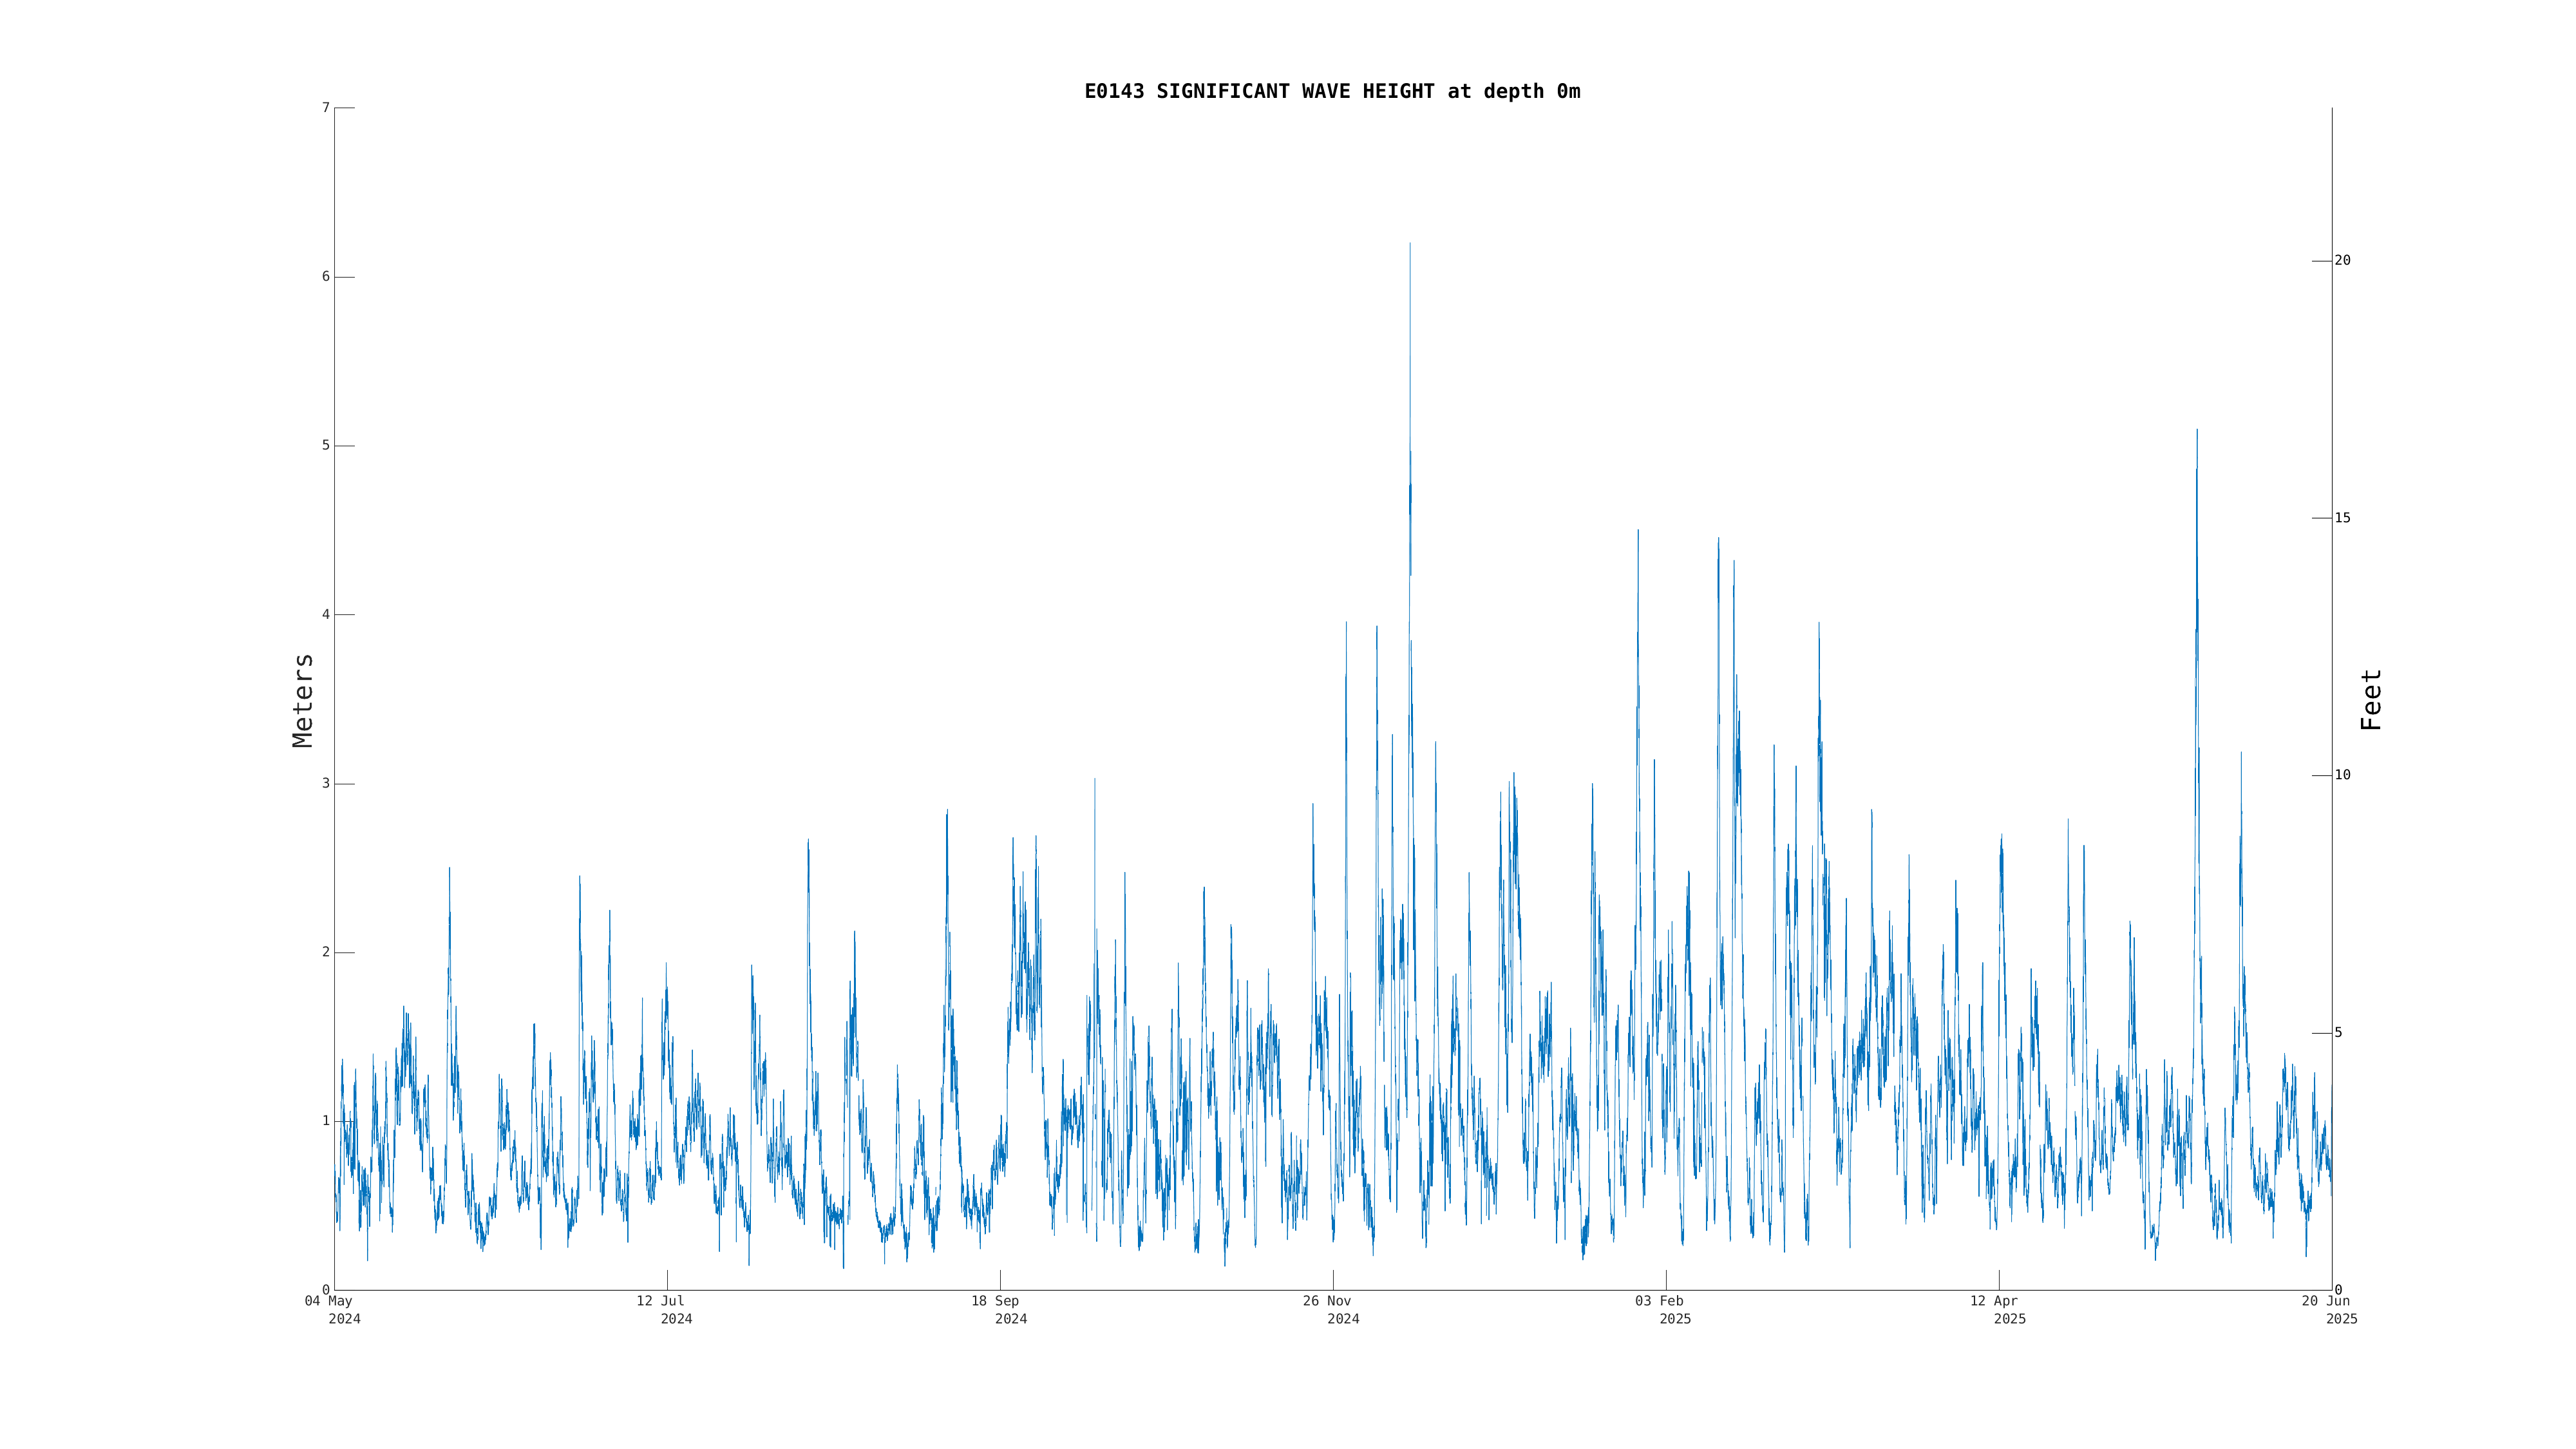
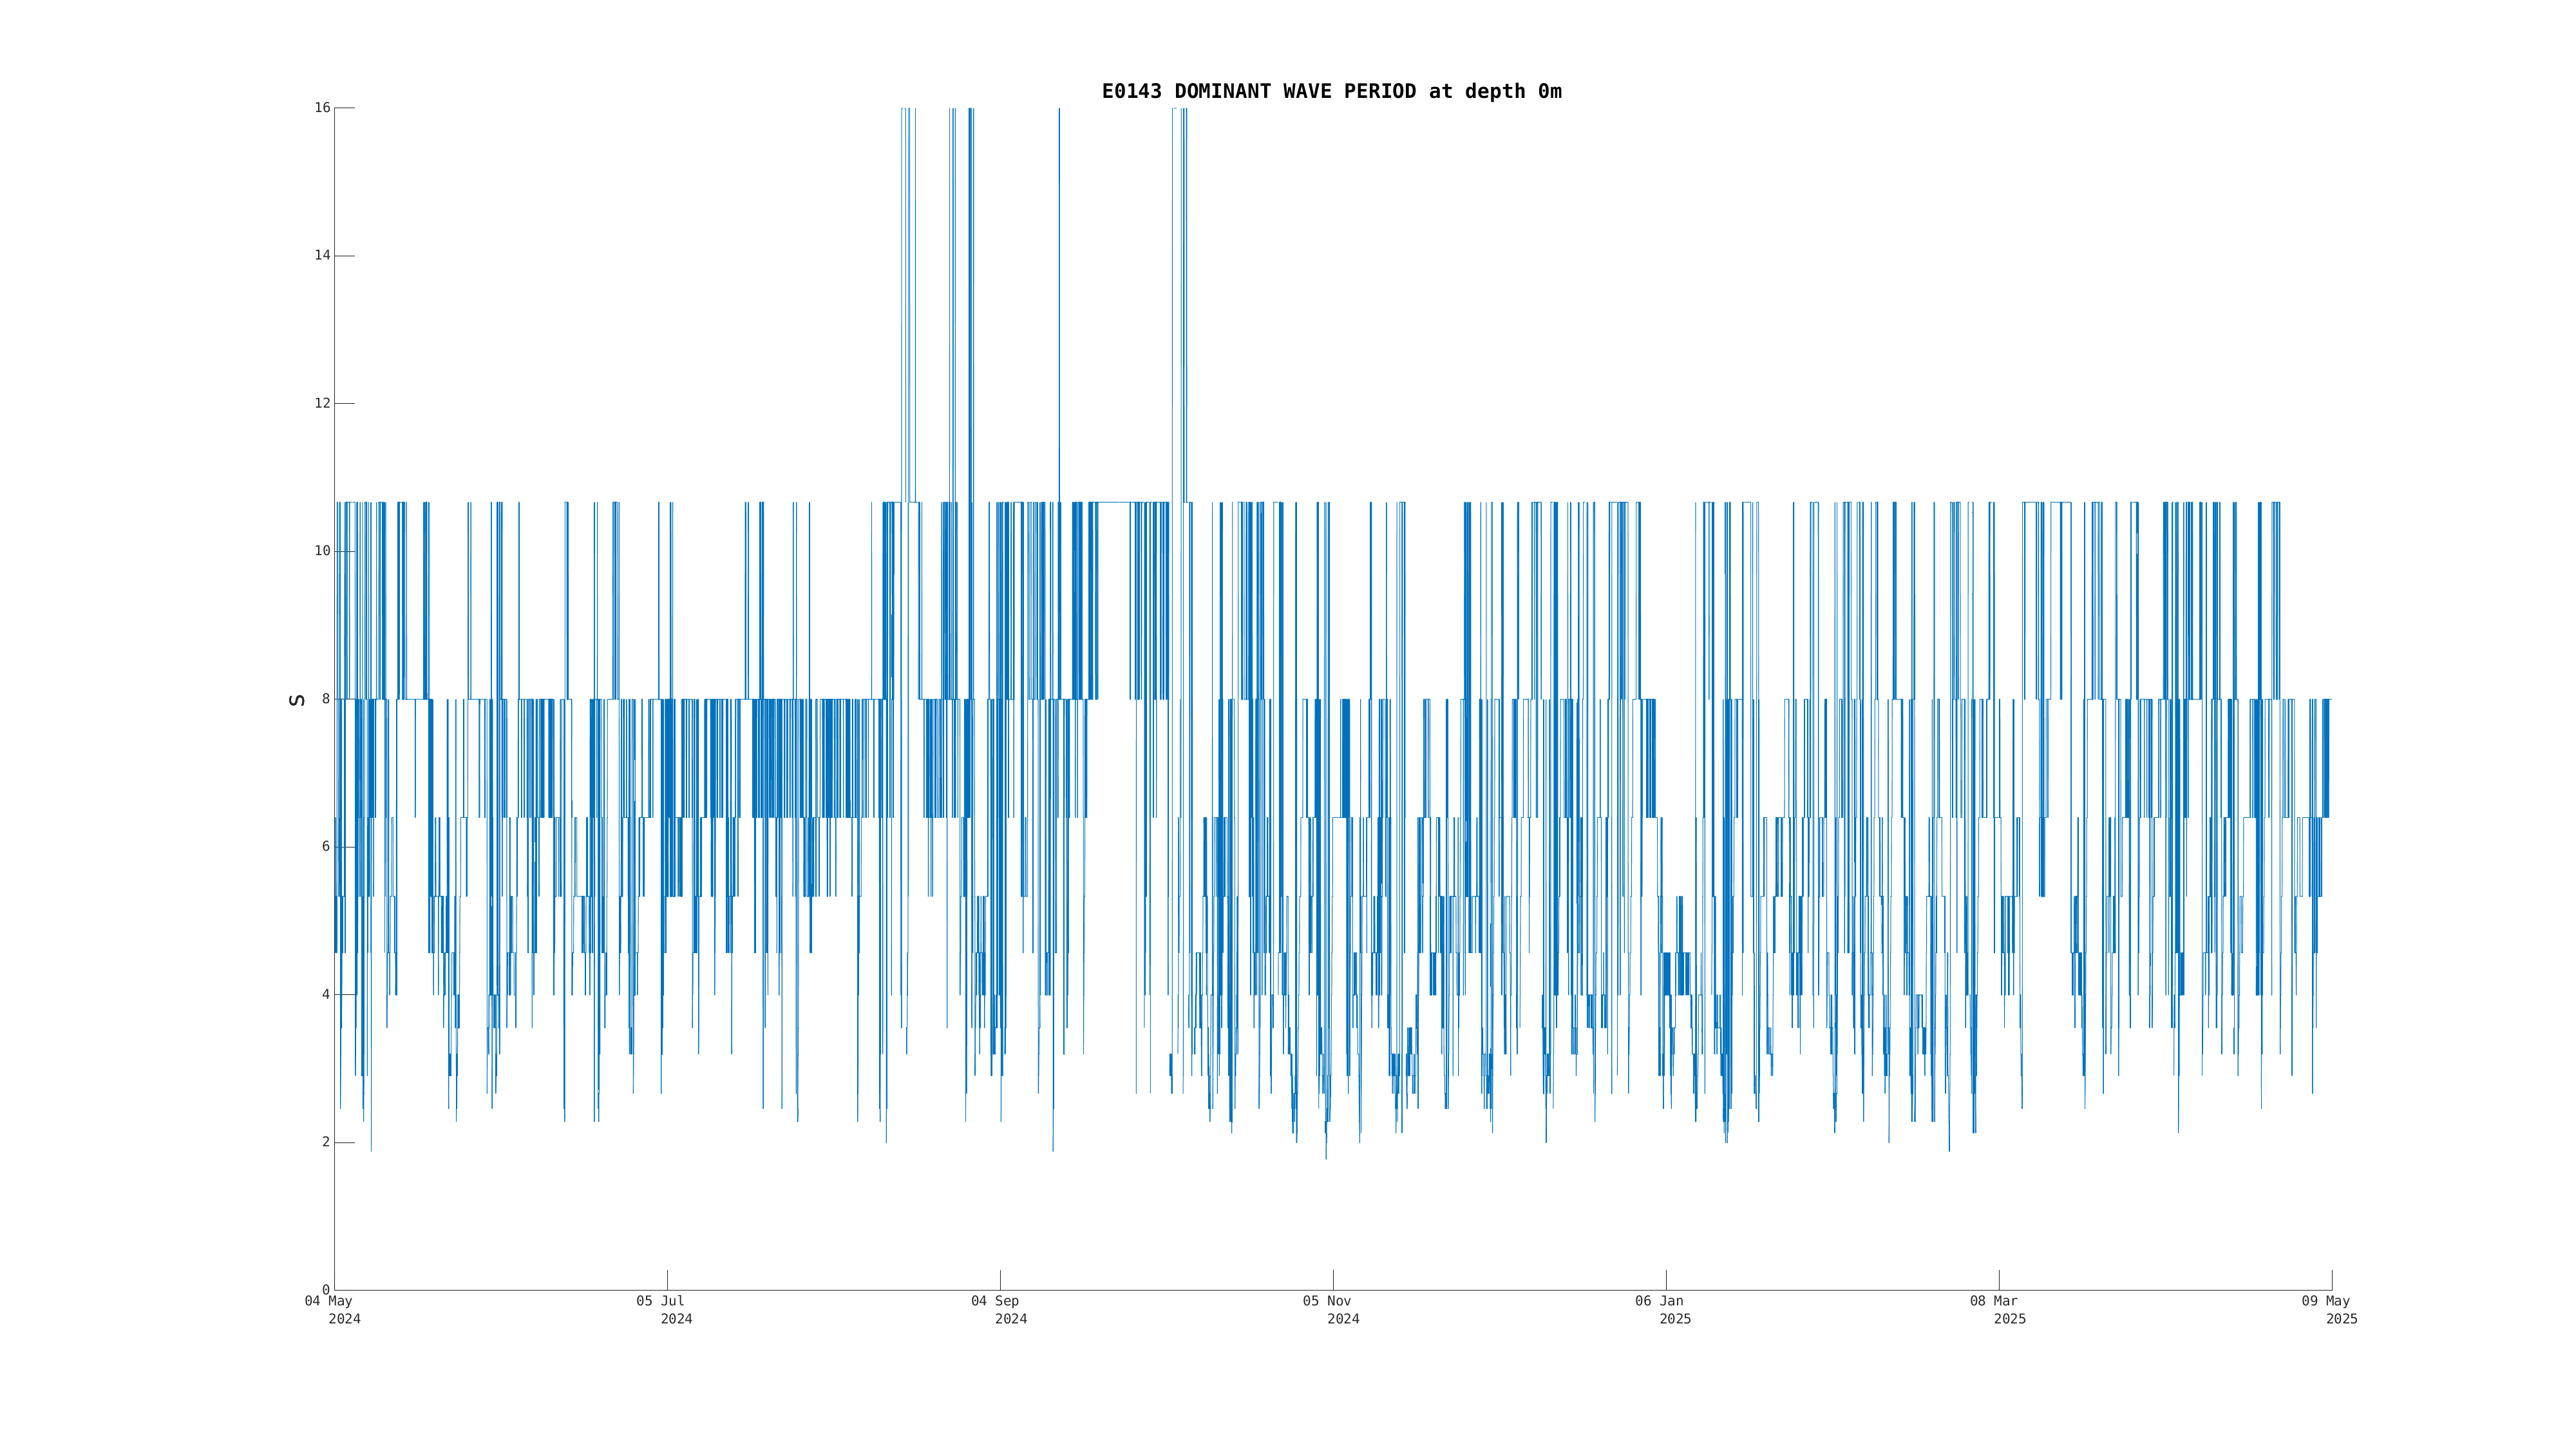
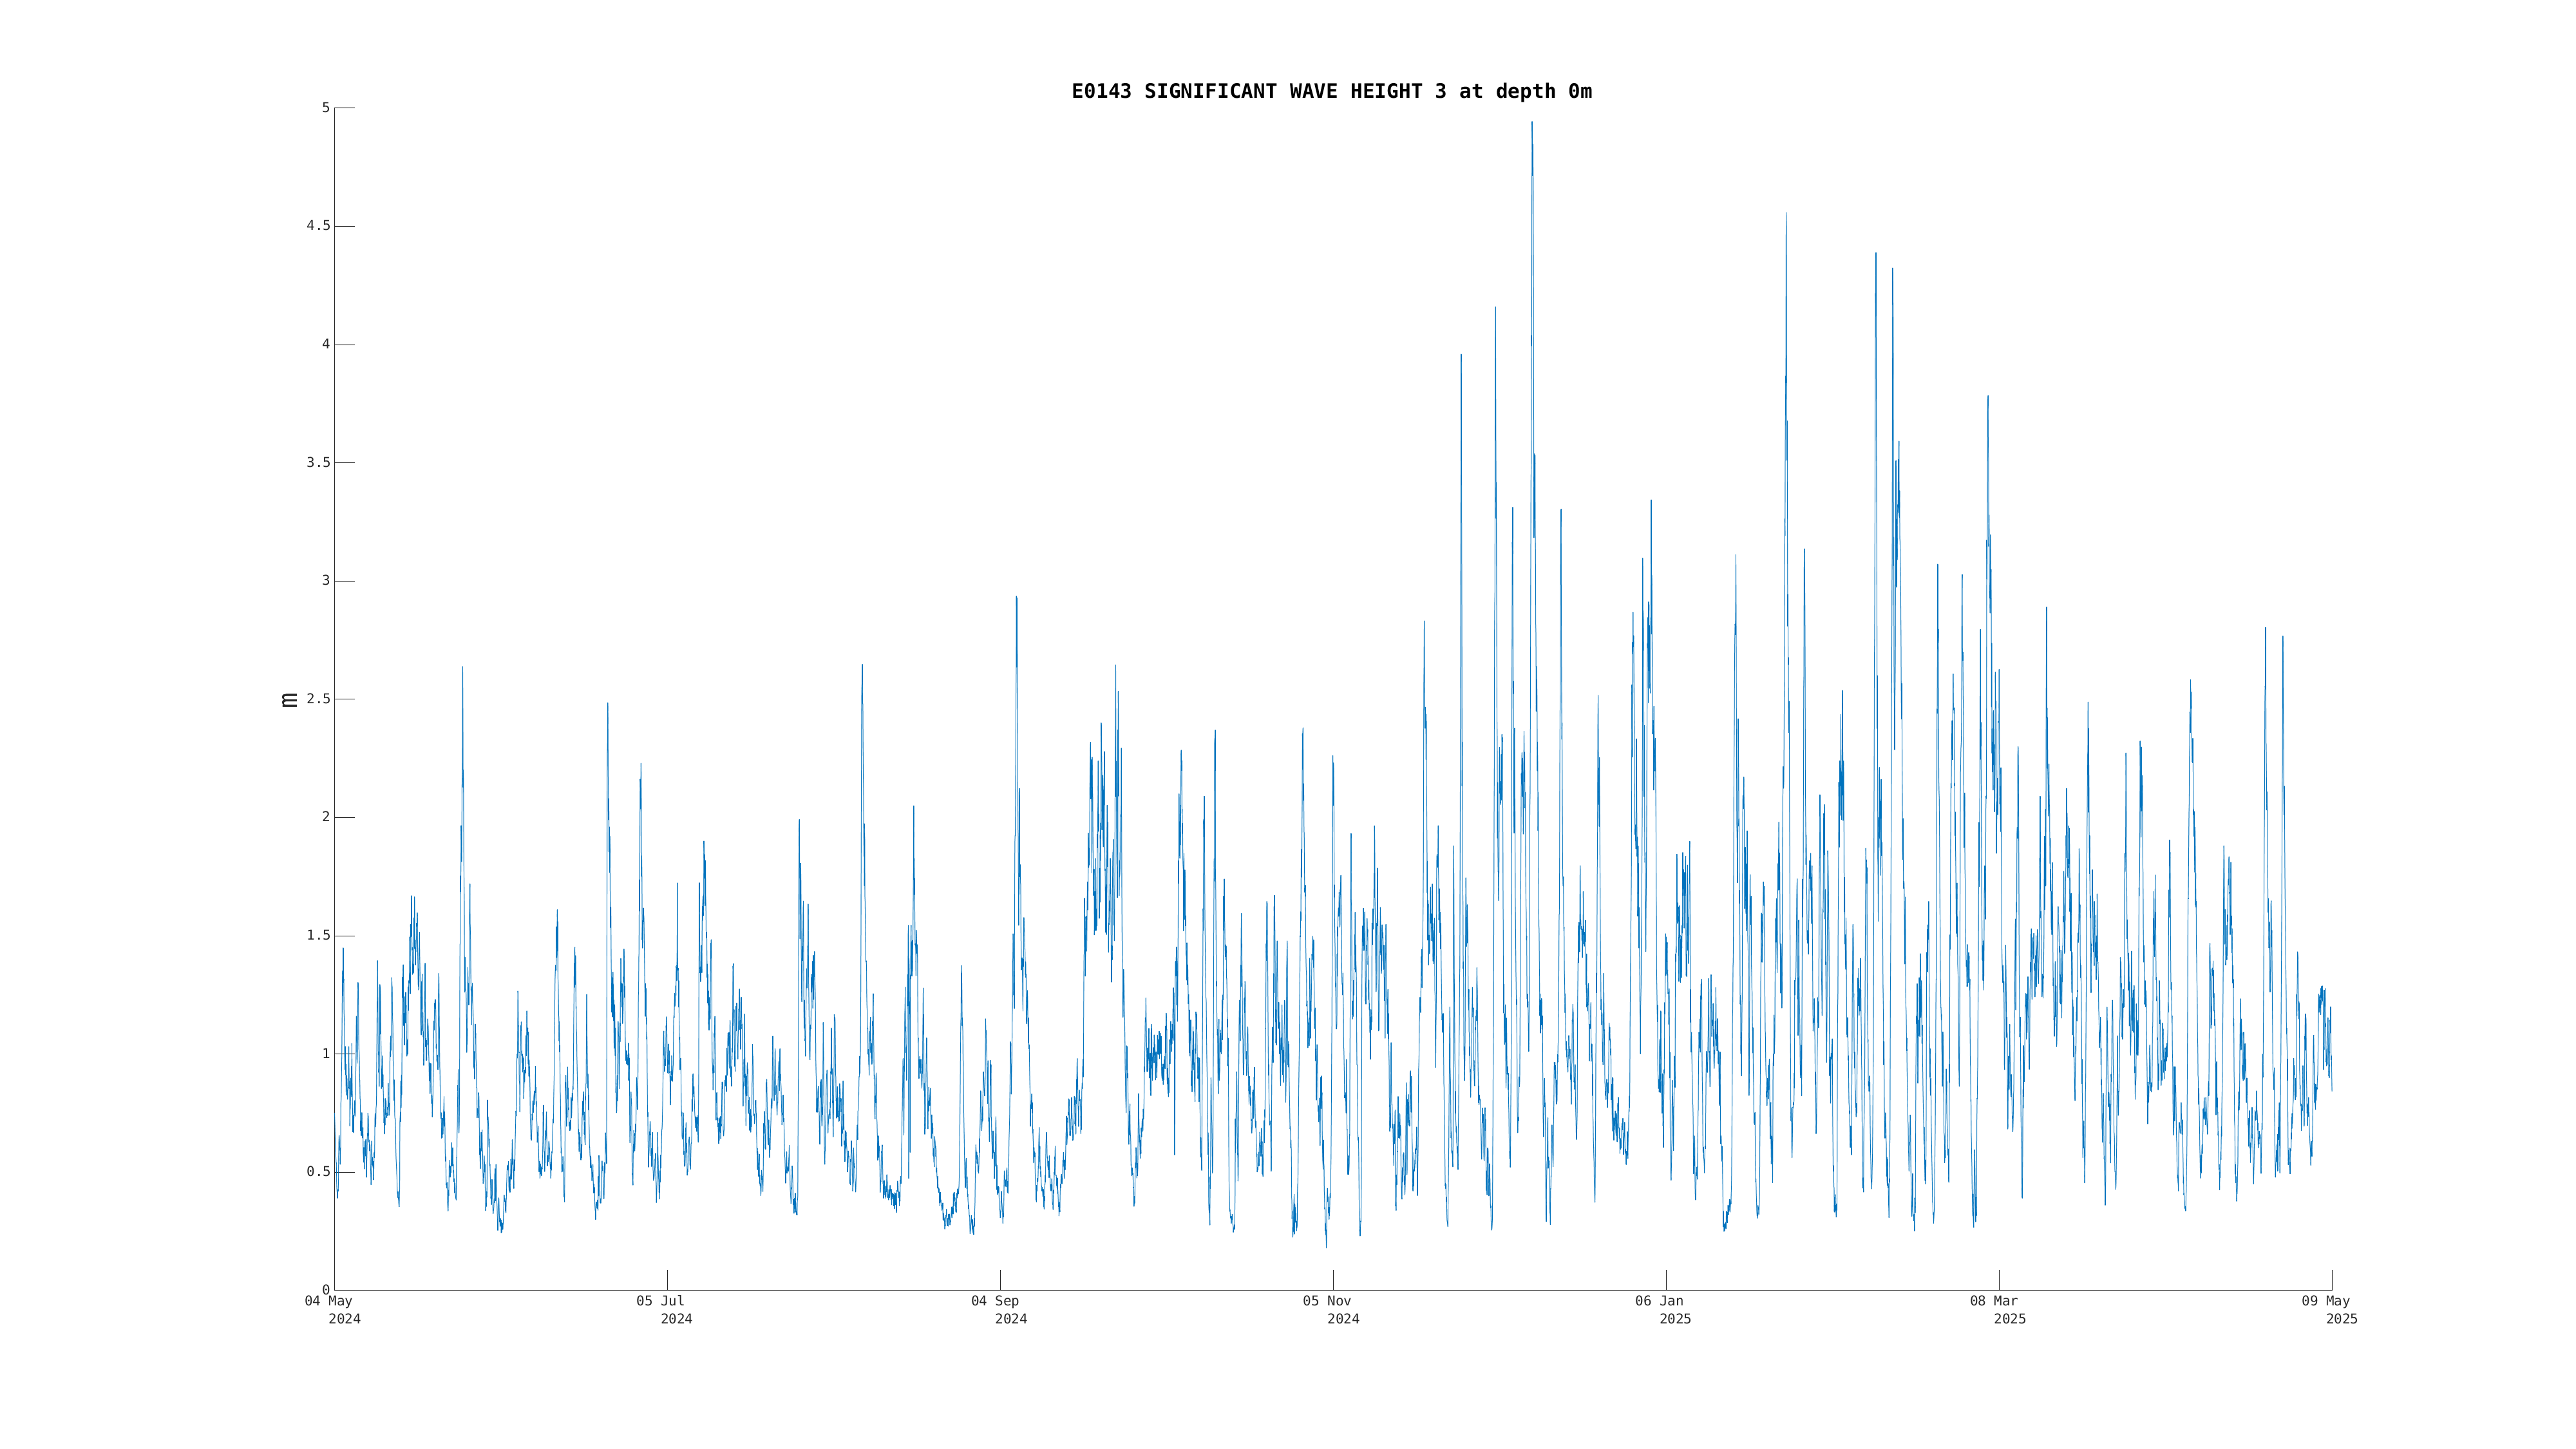
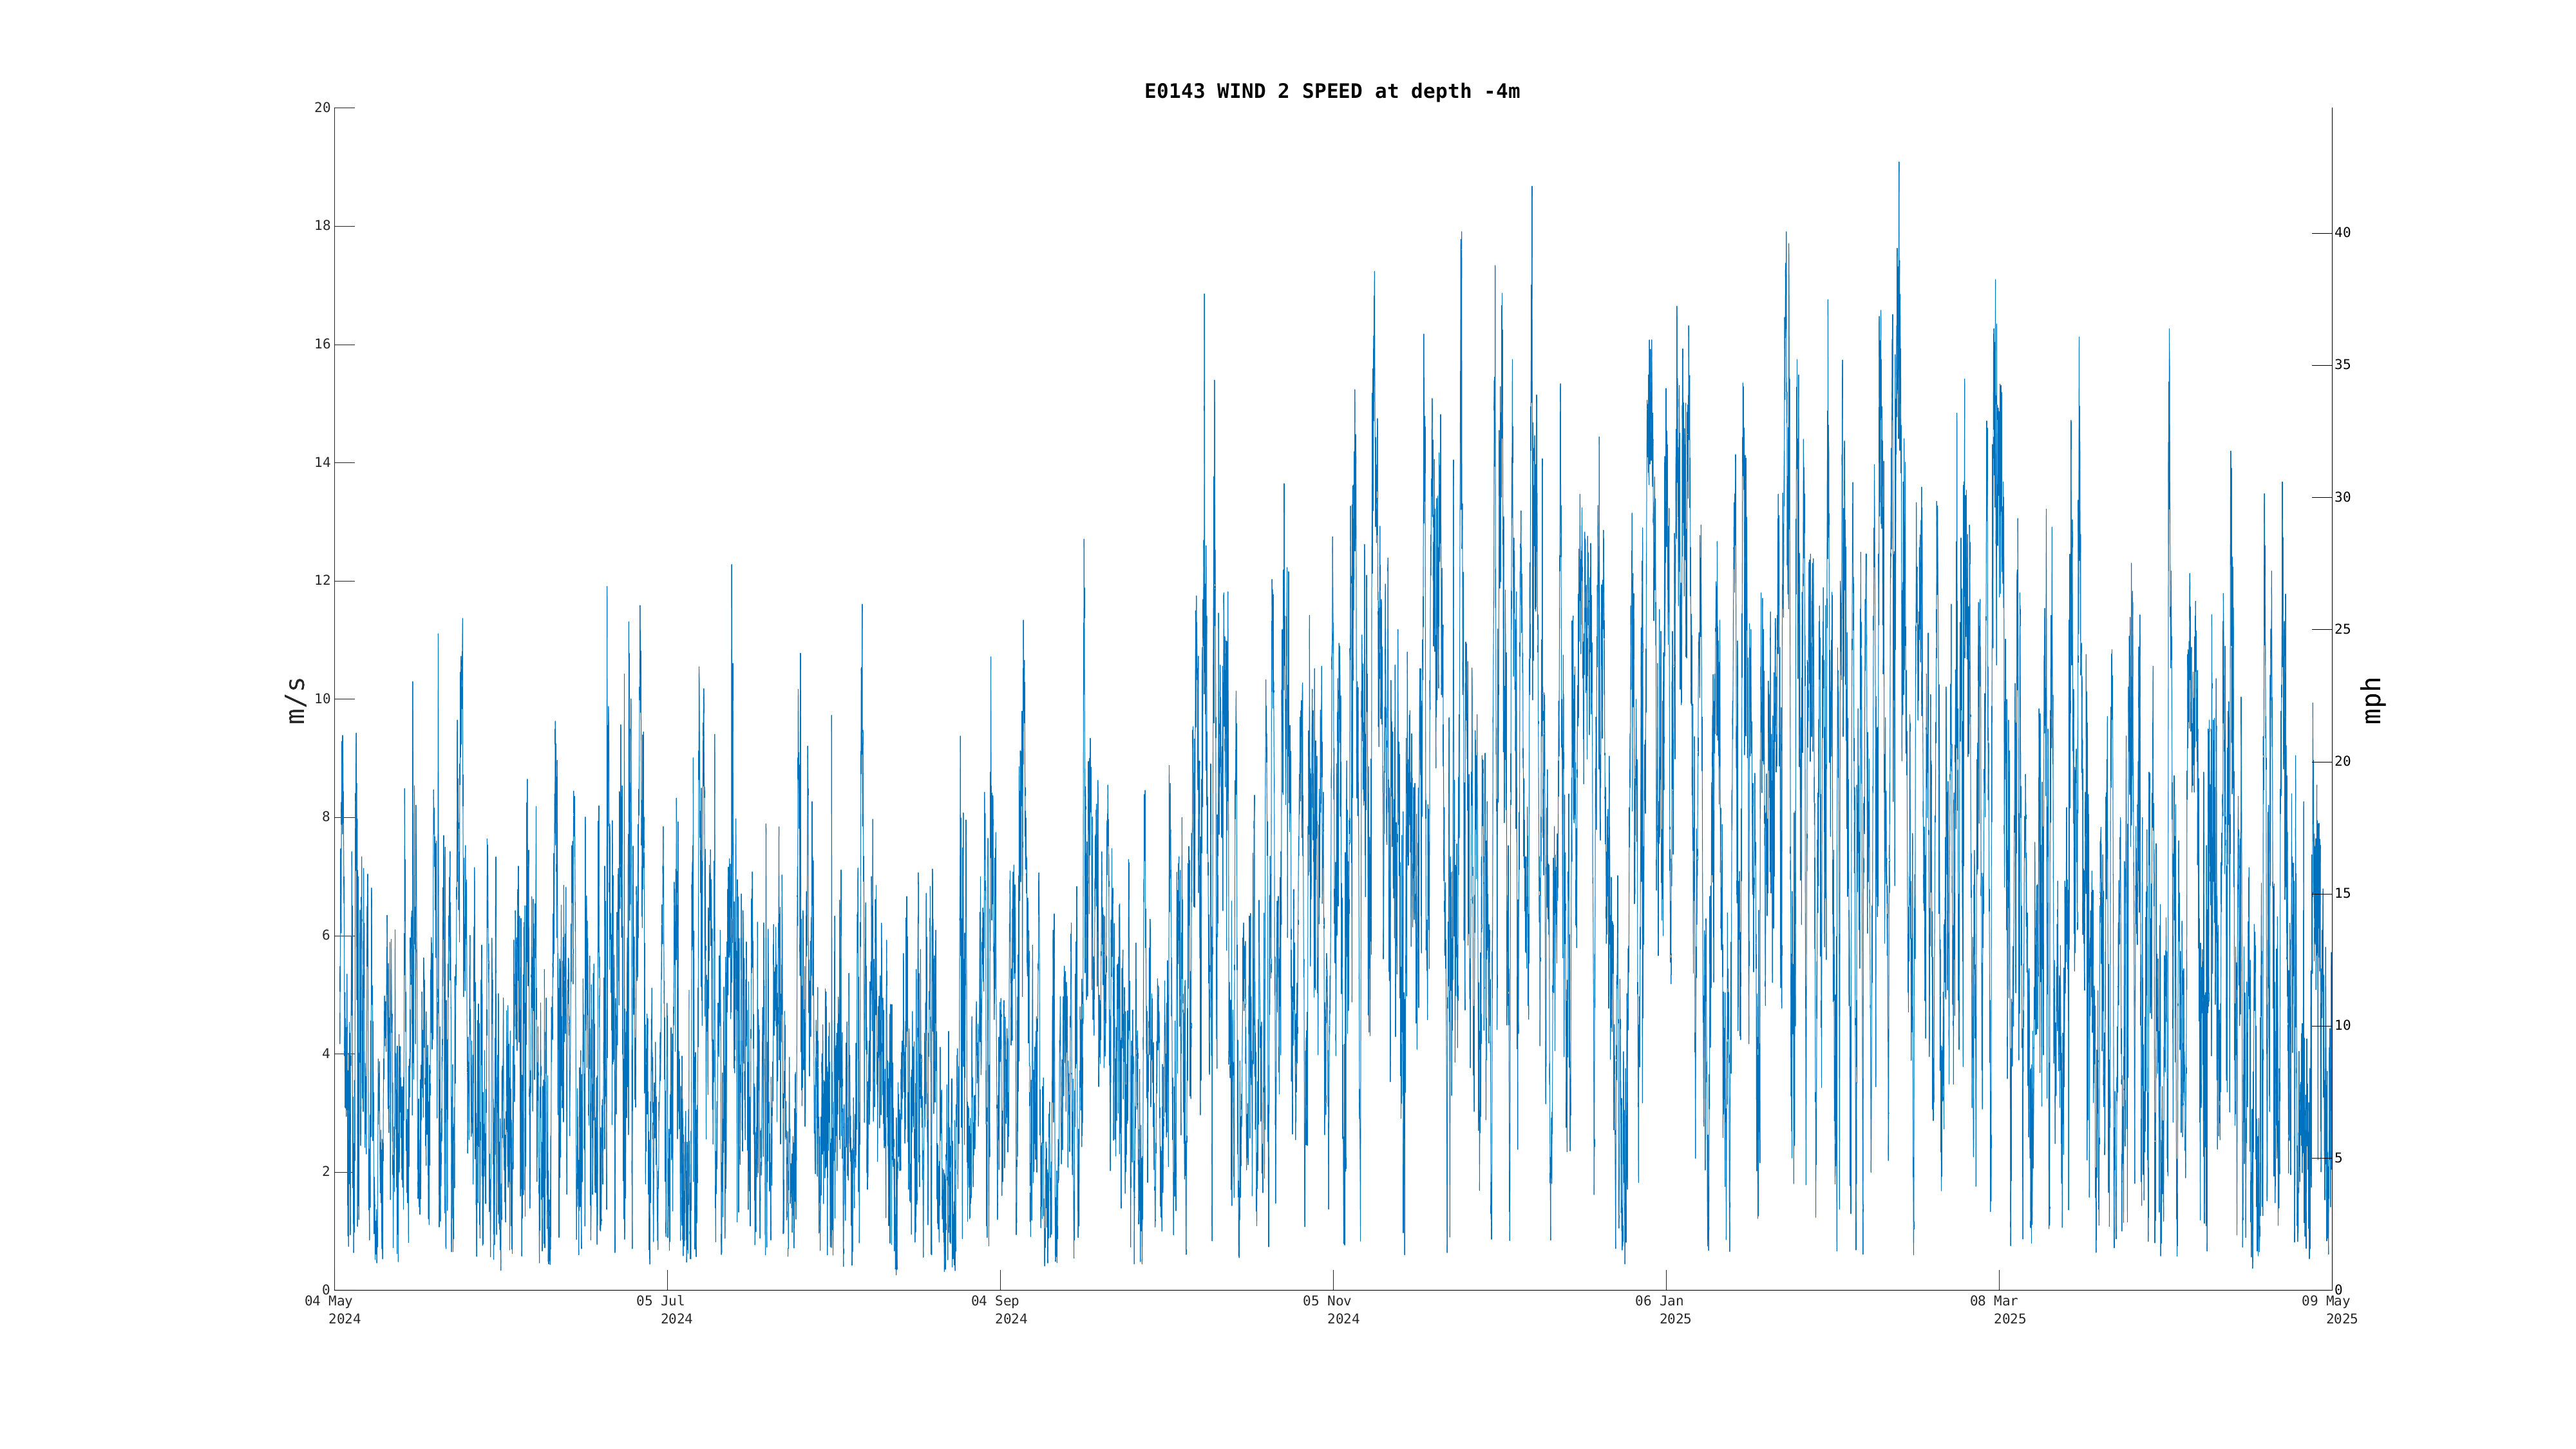
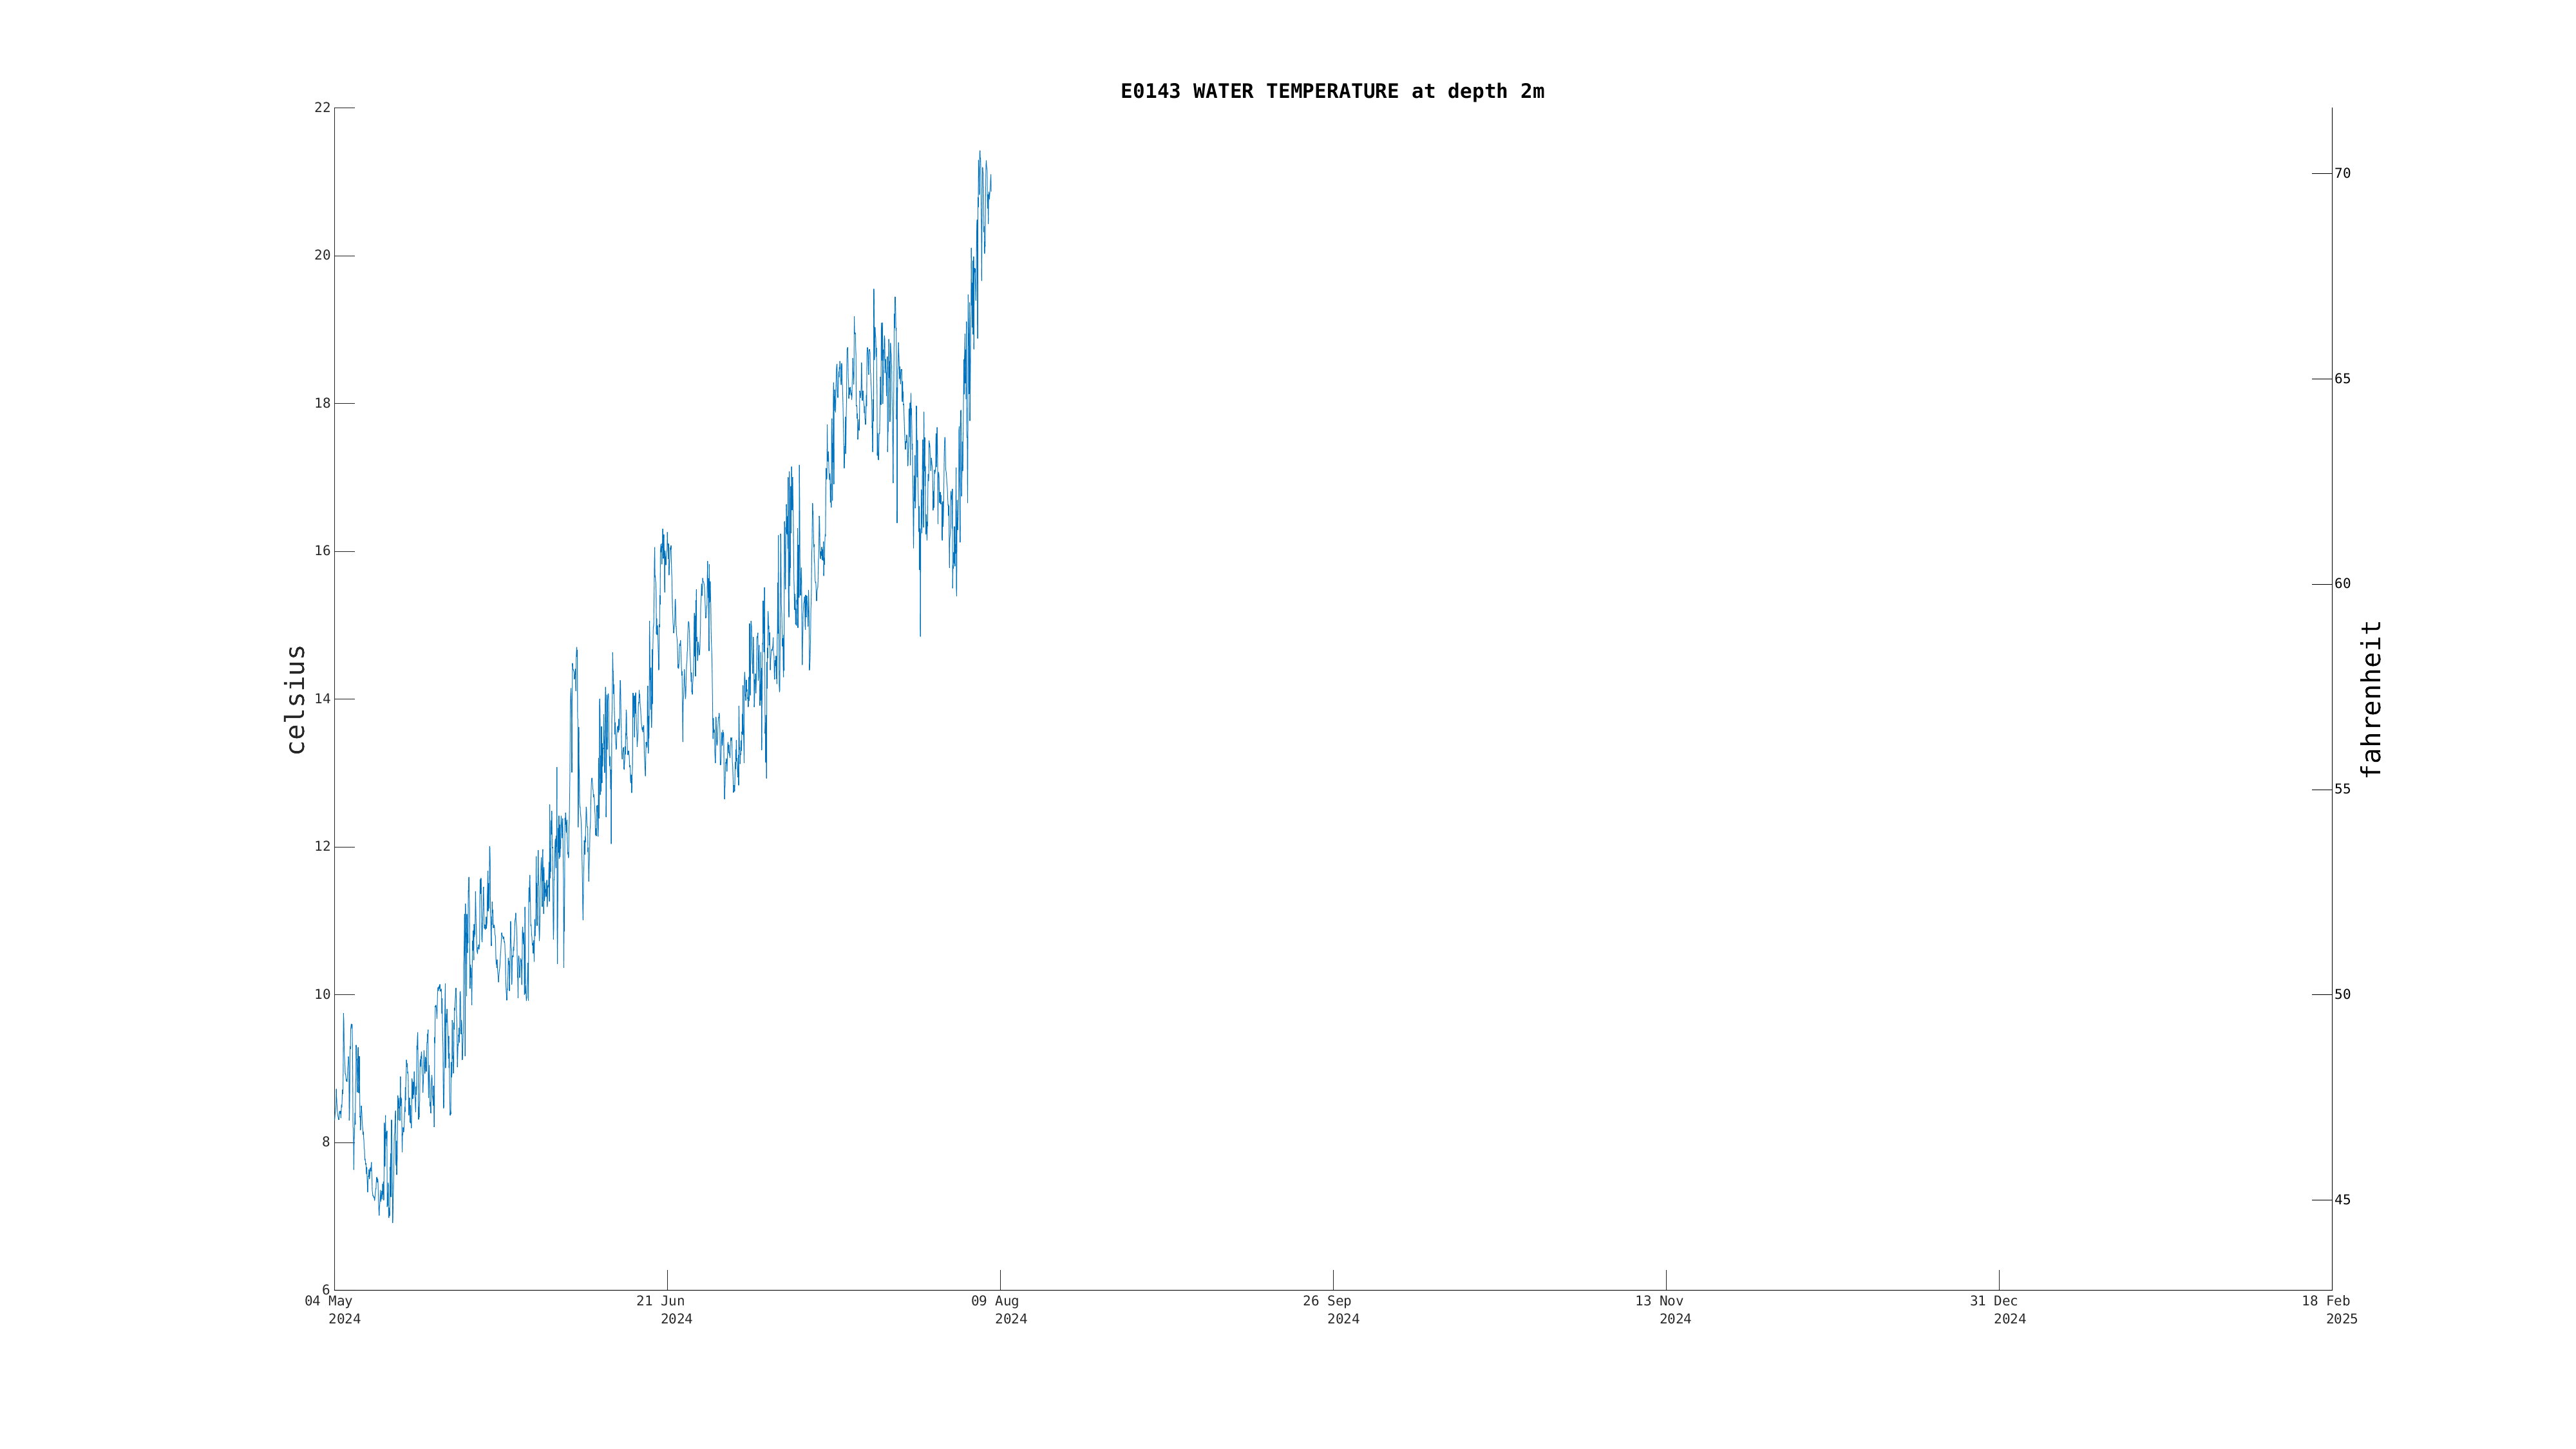
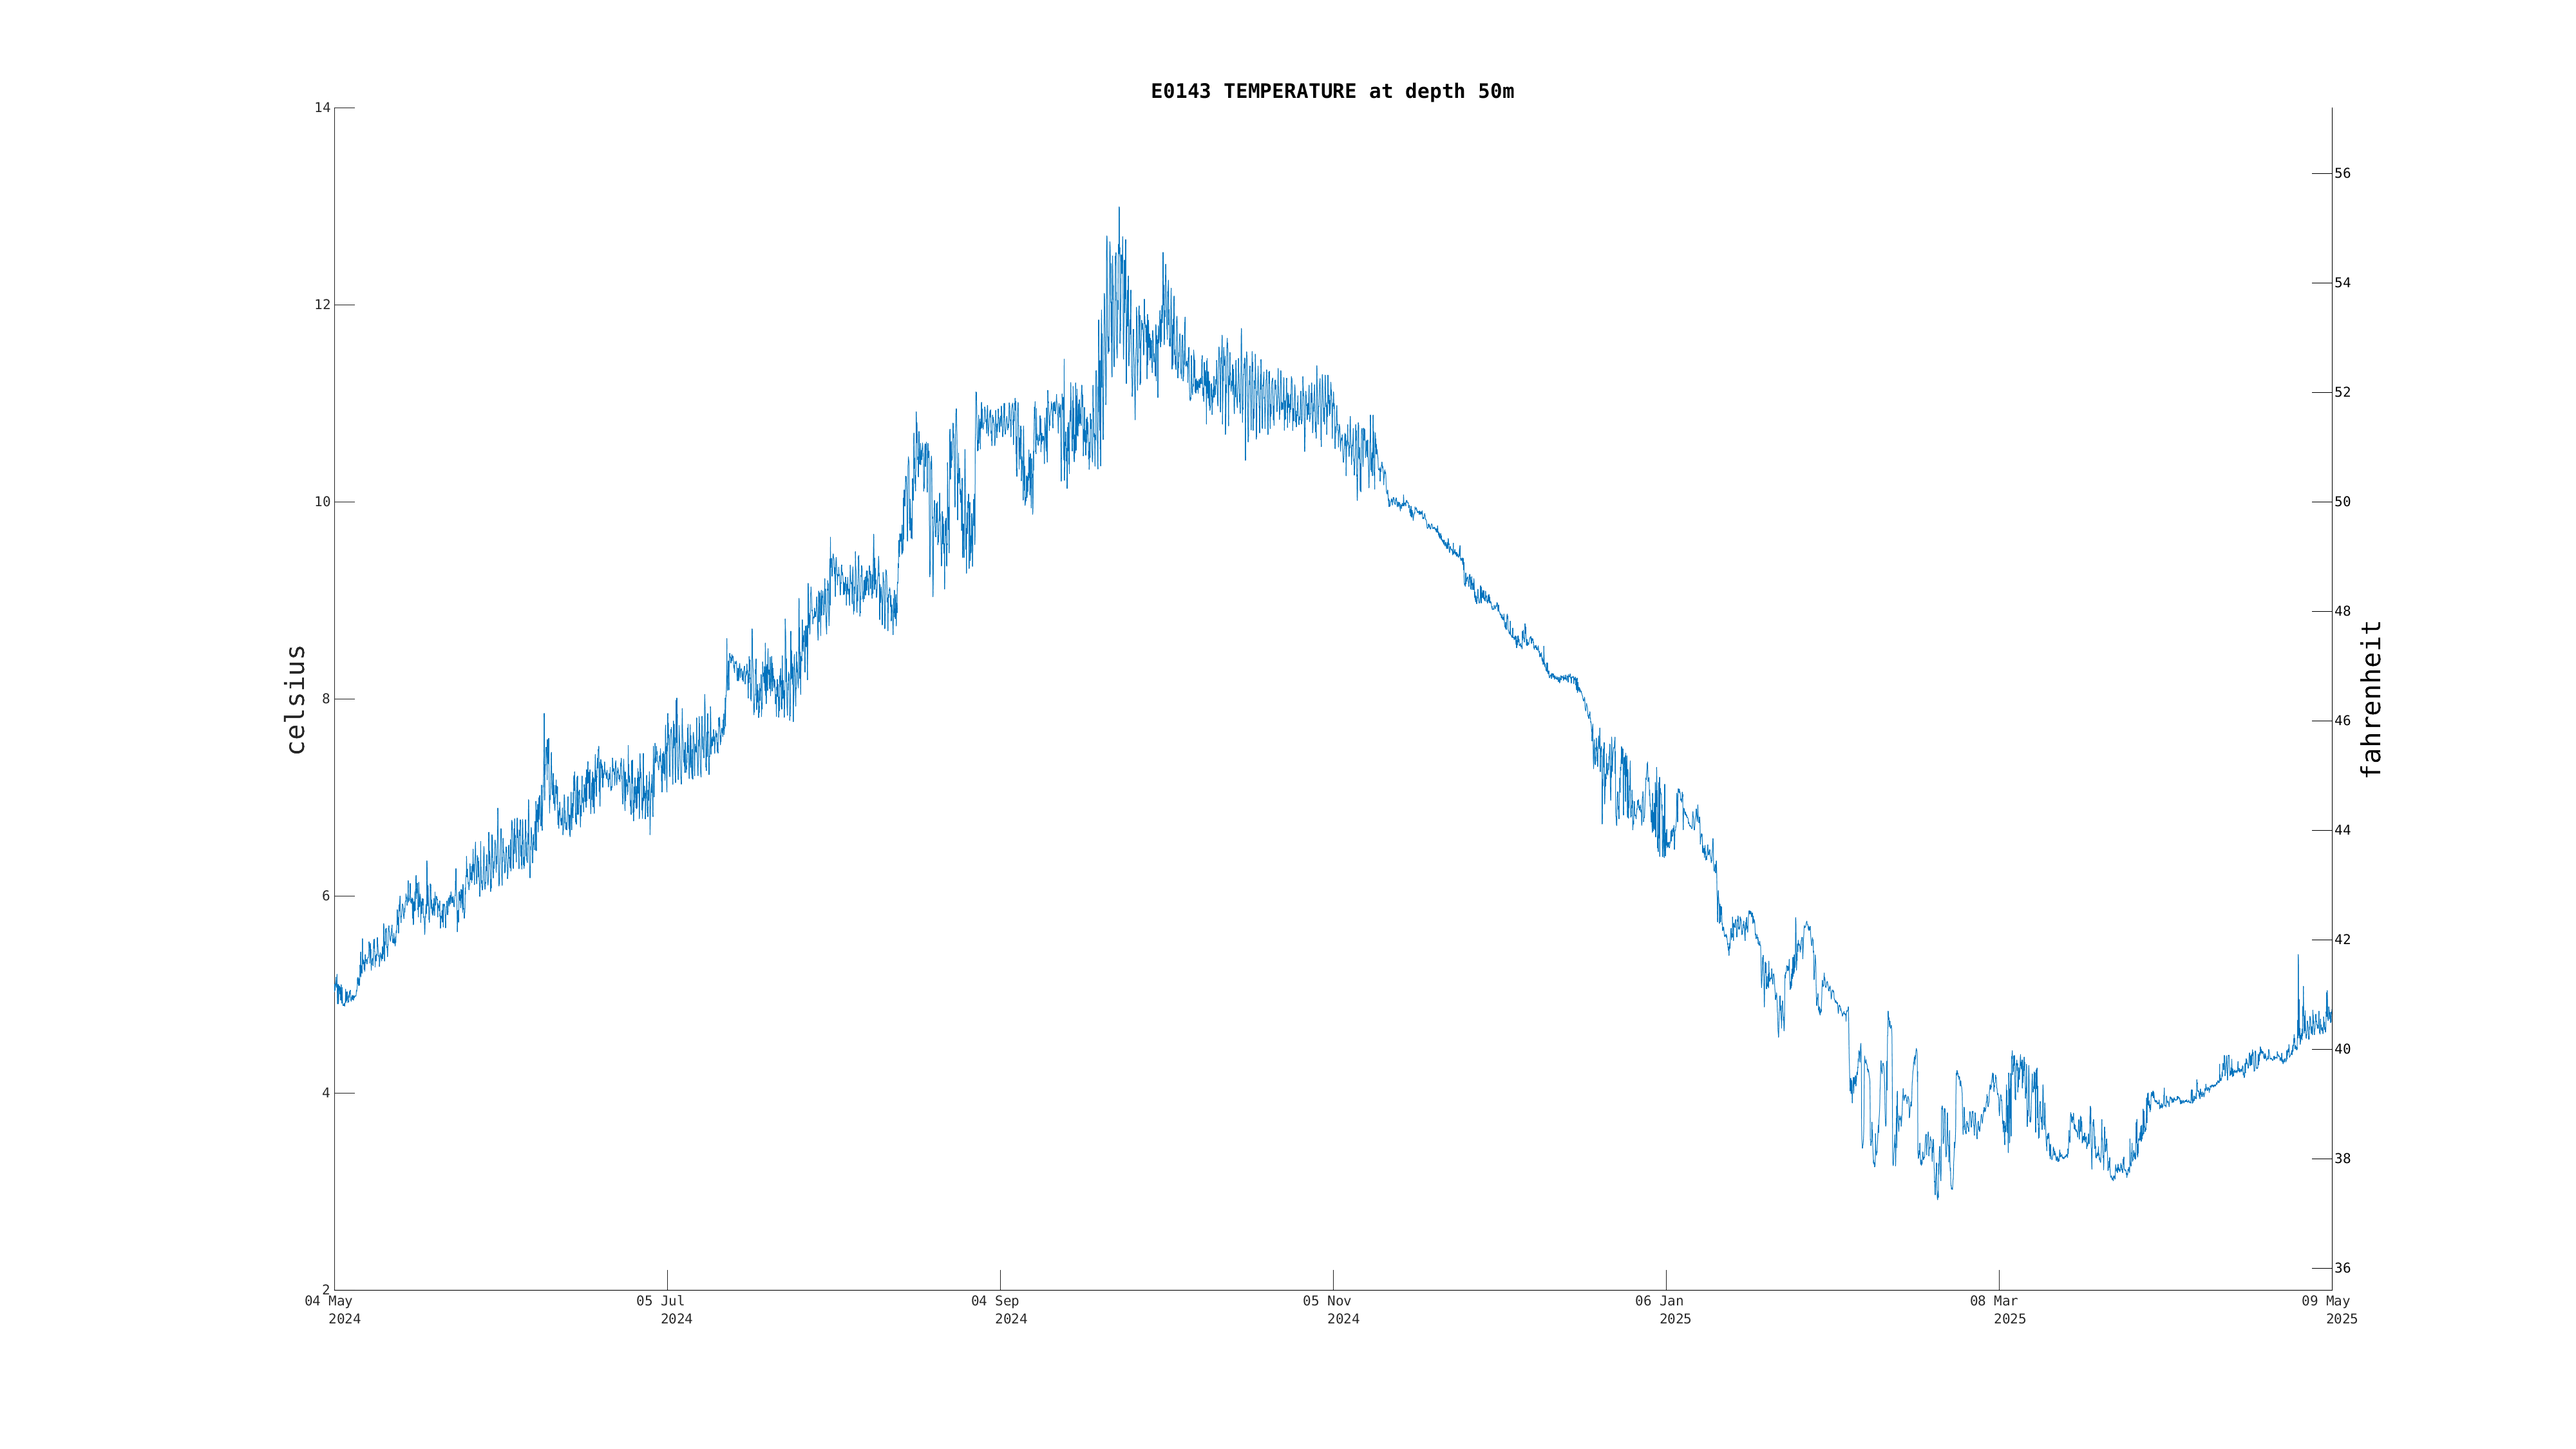
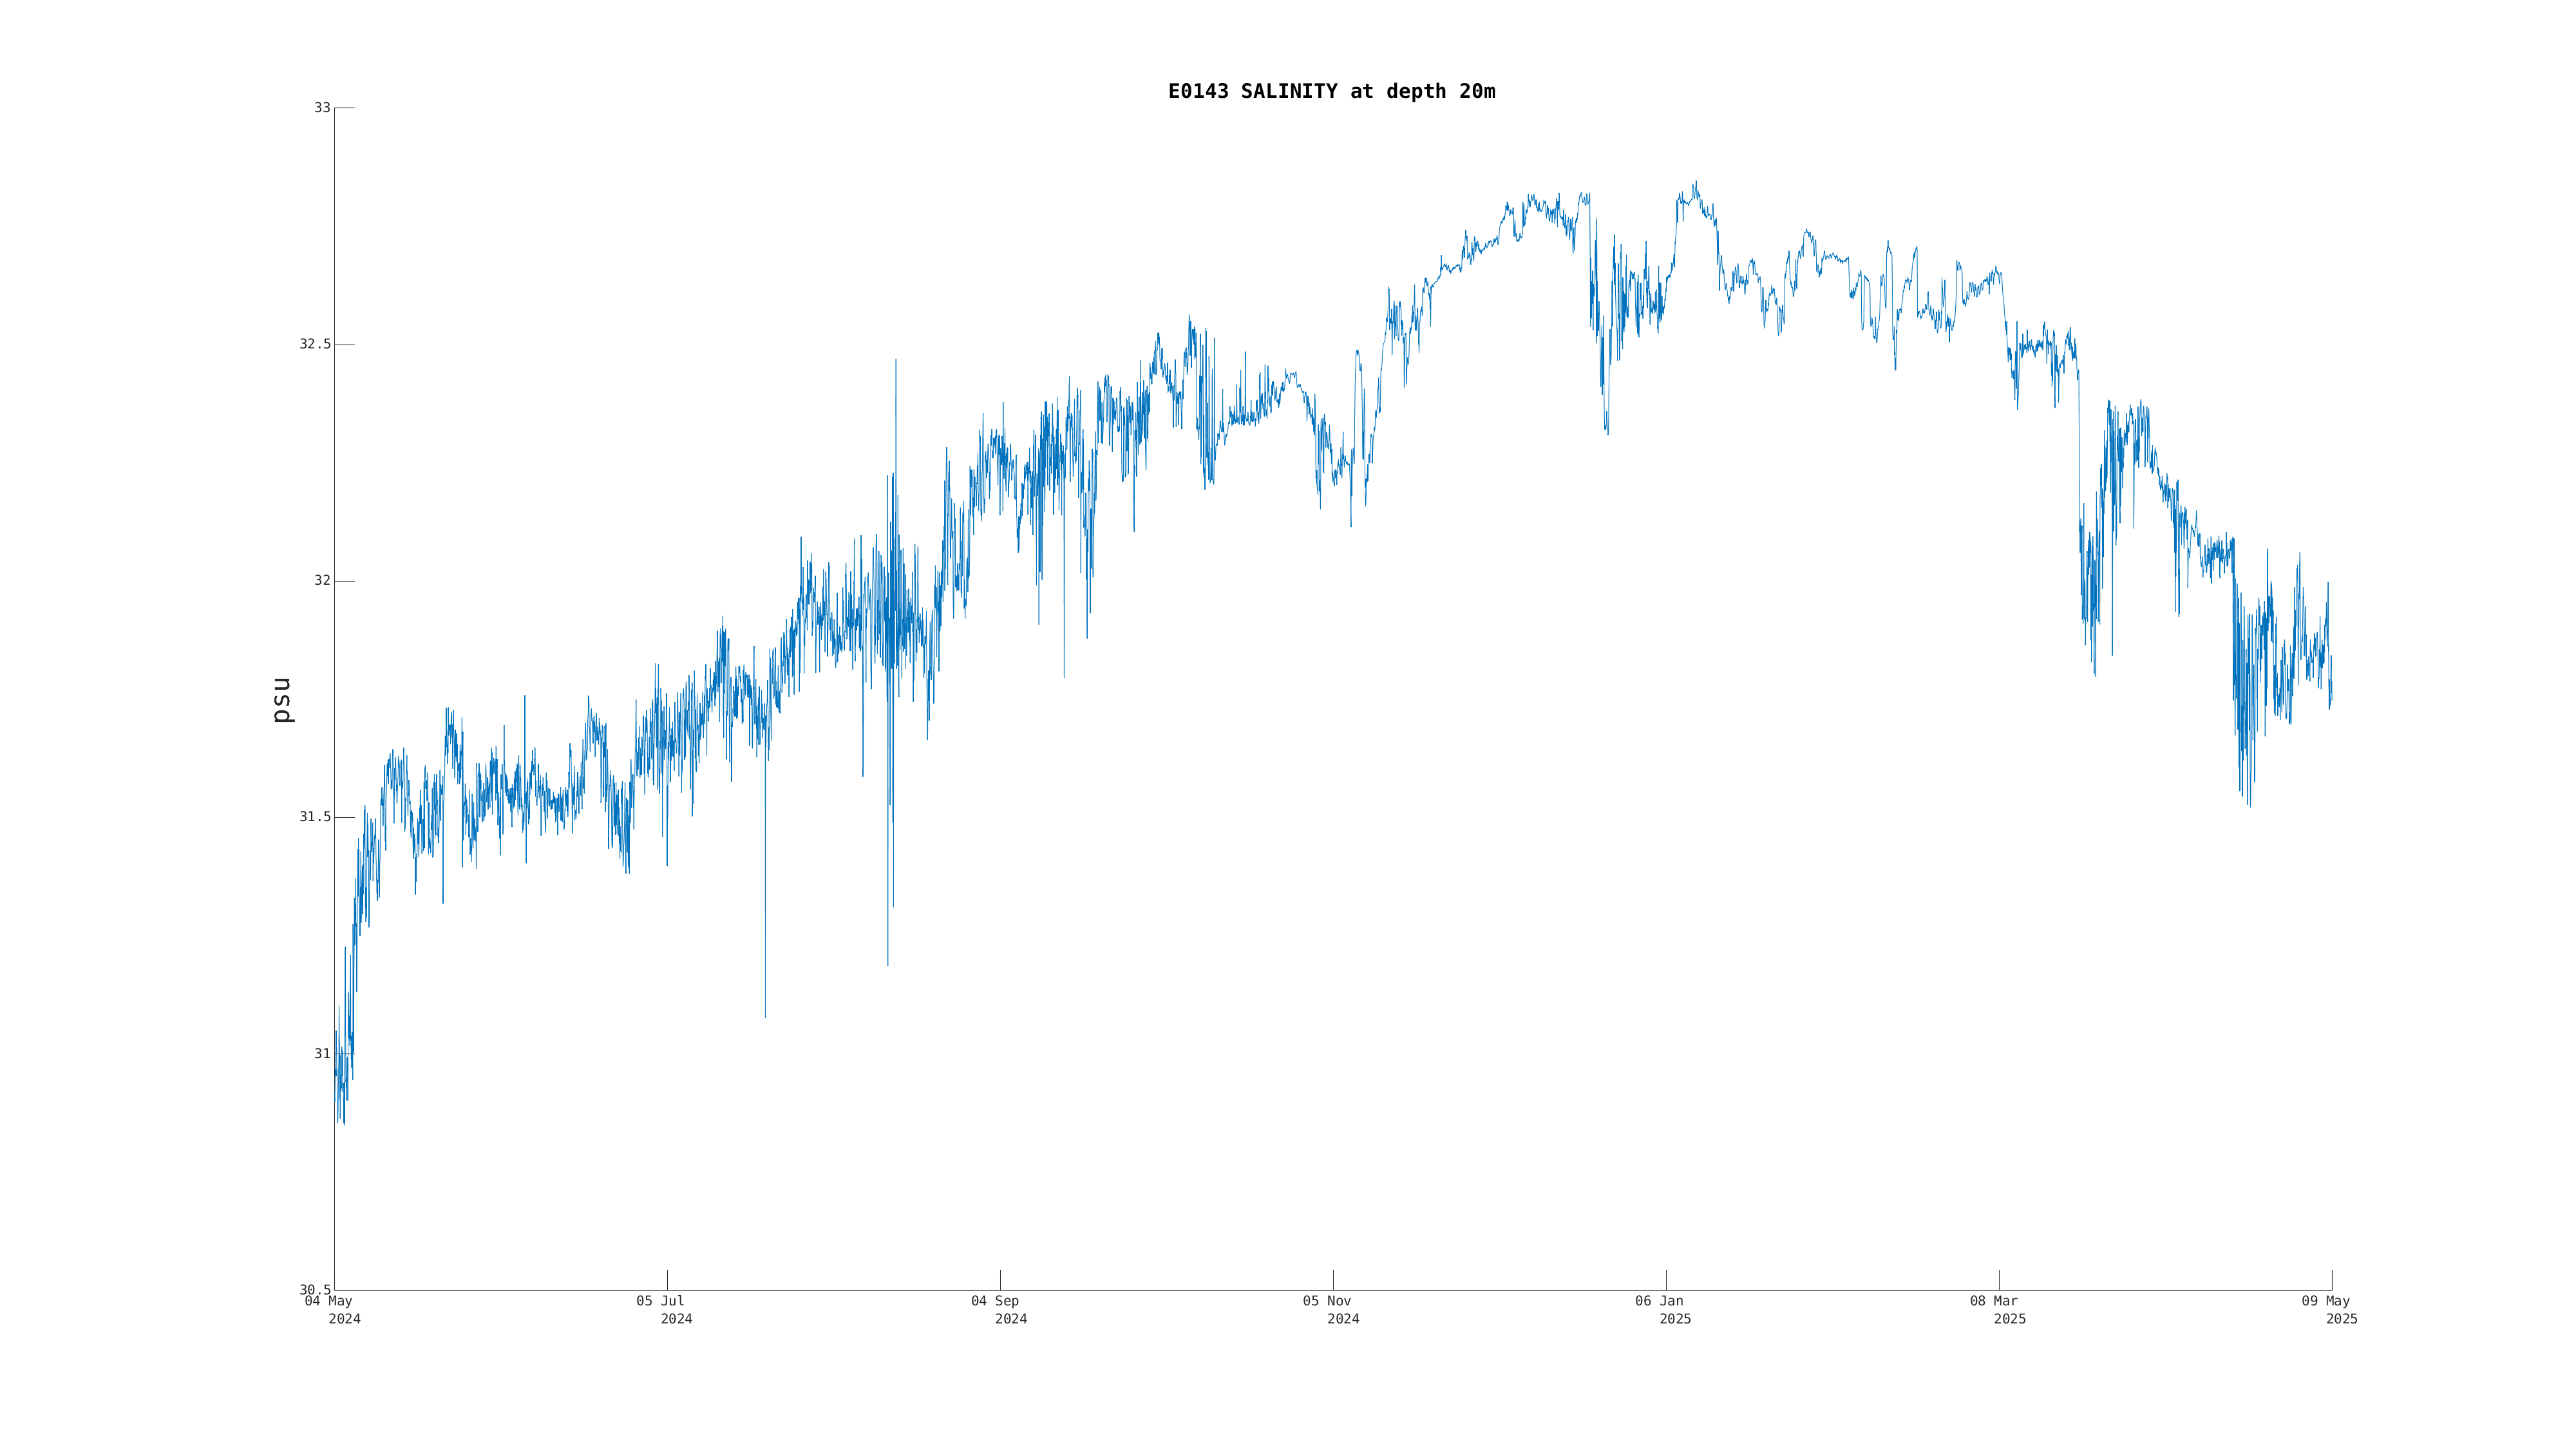
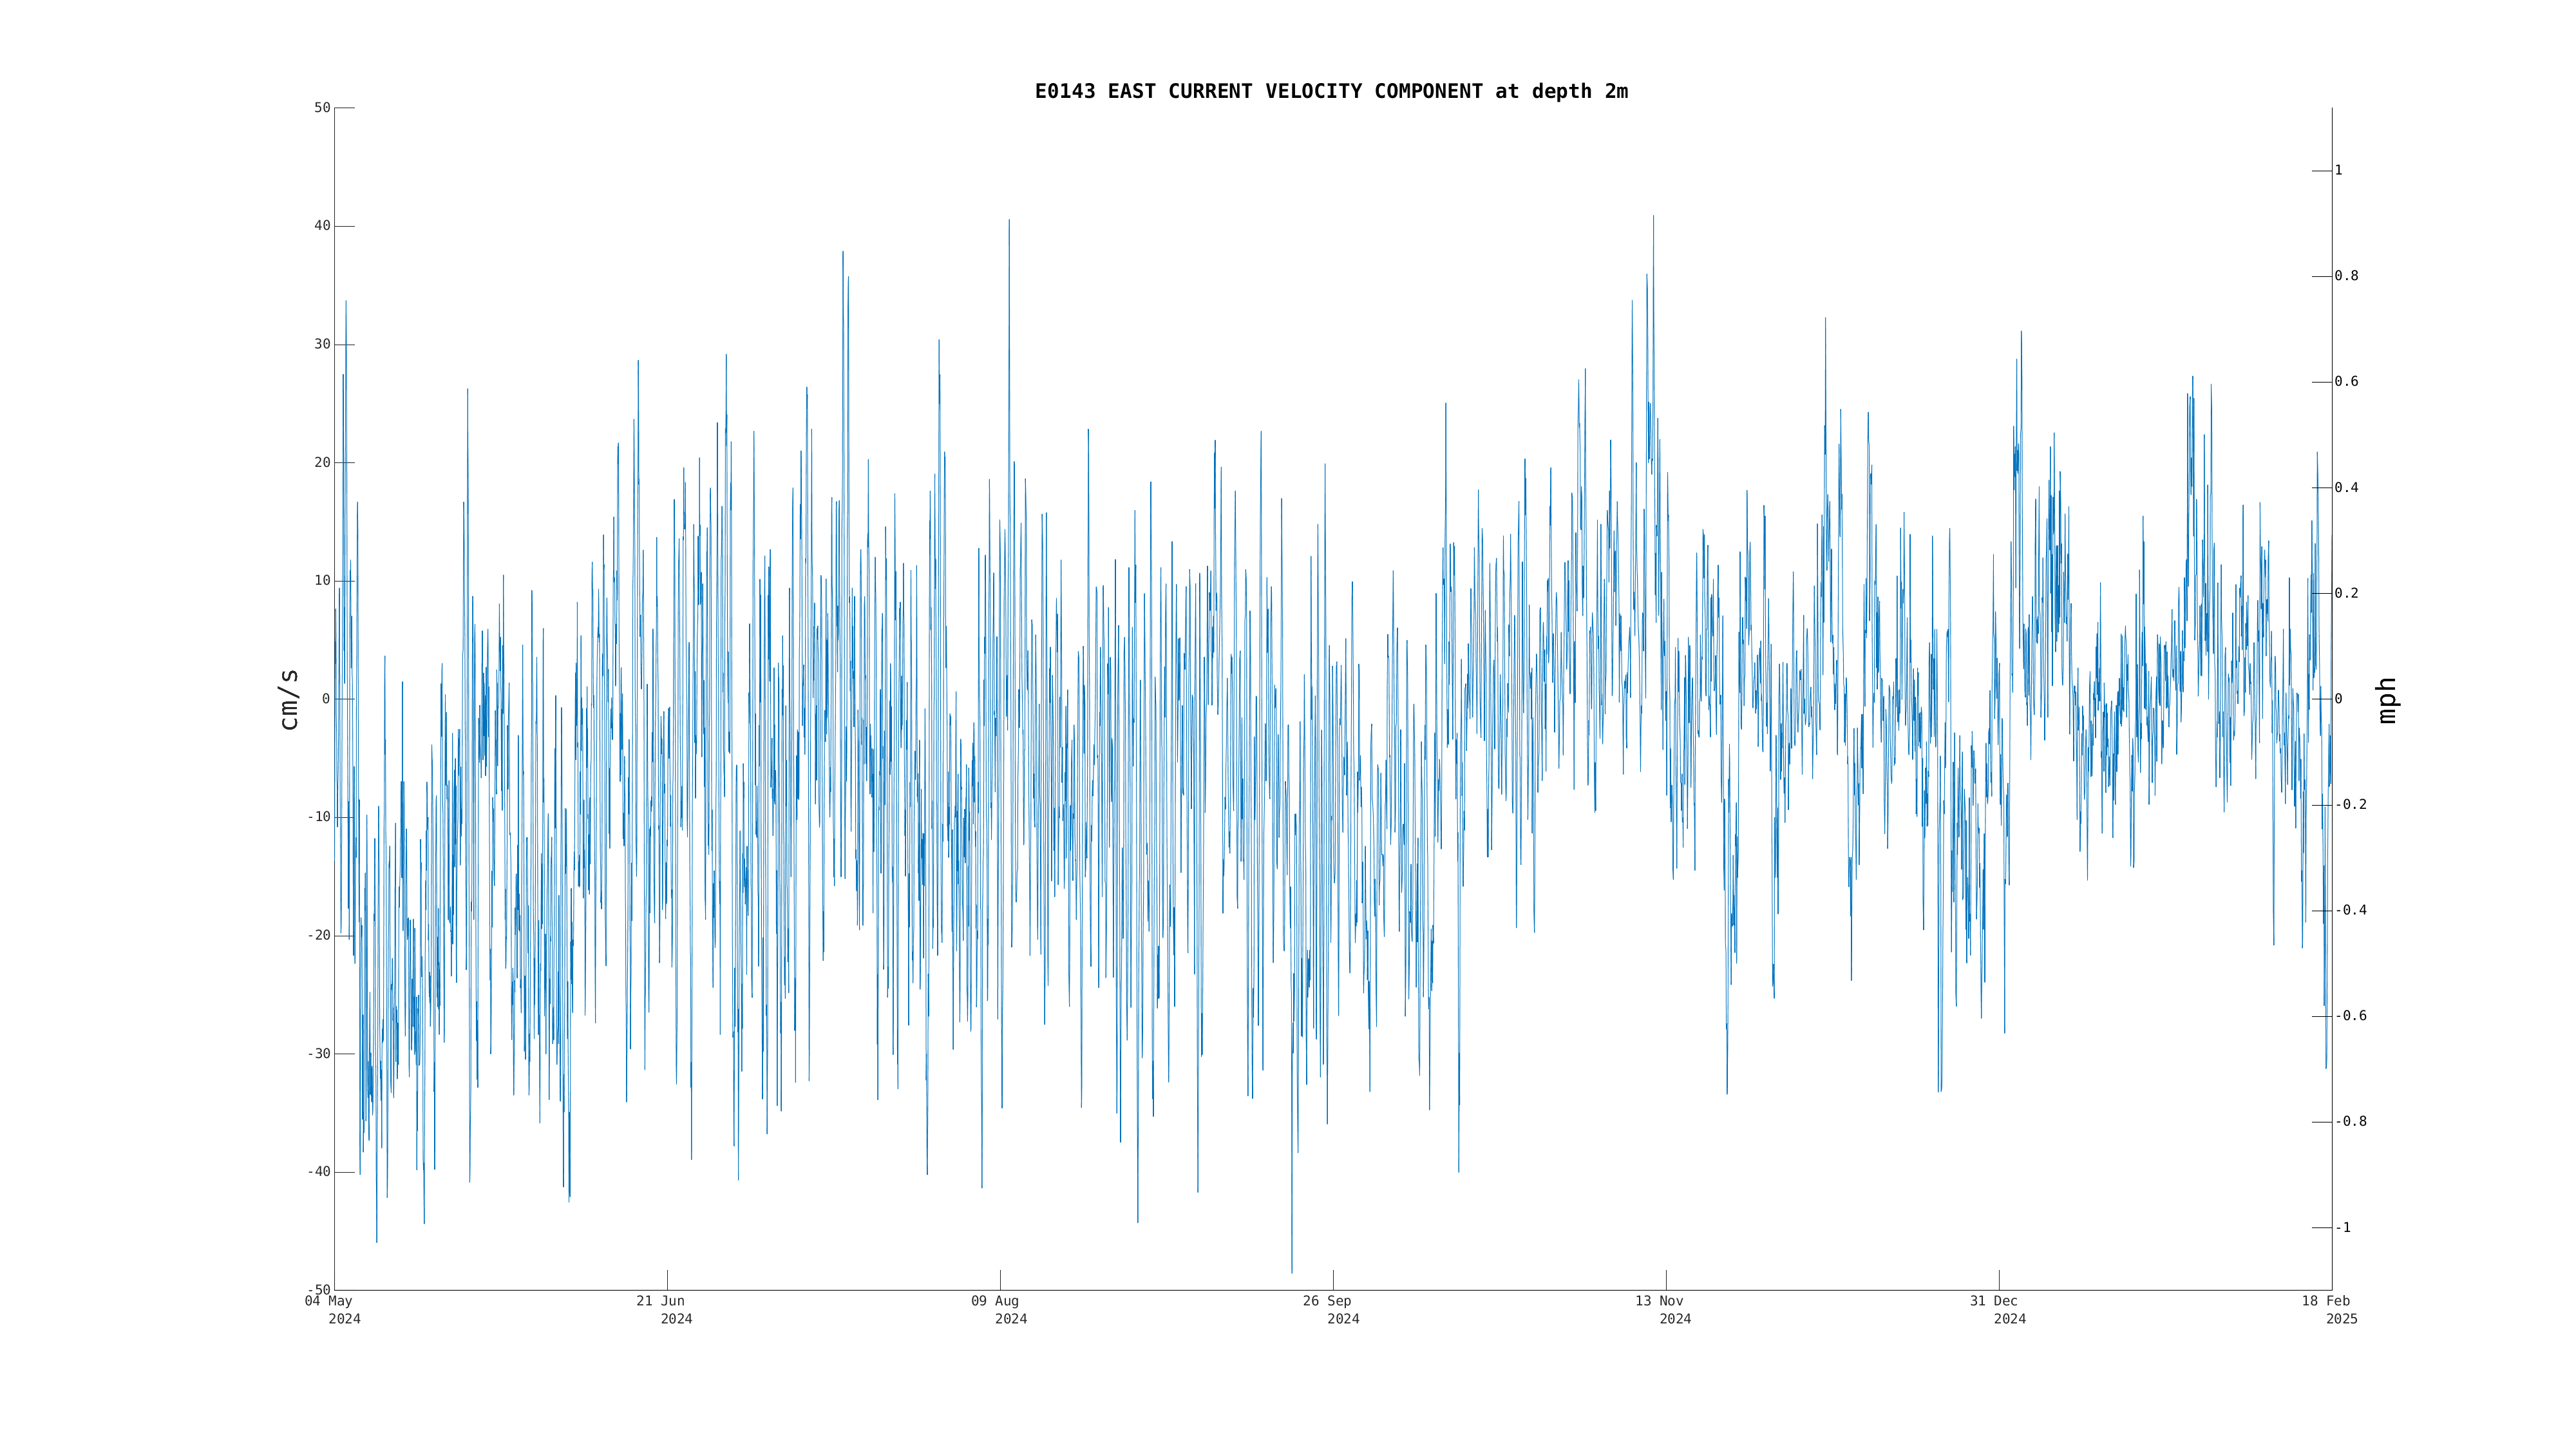
Full Deployment Plot |
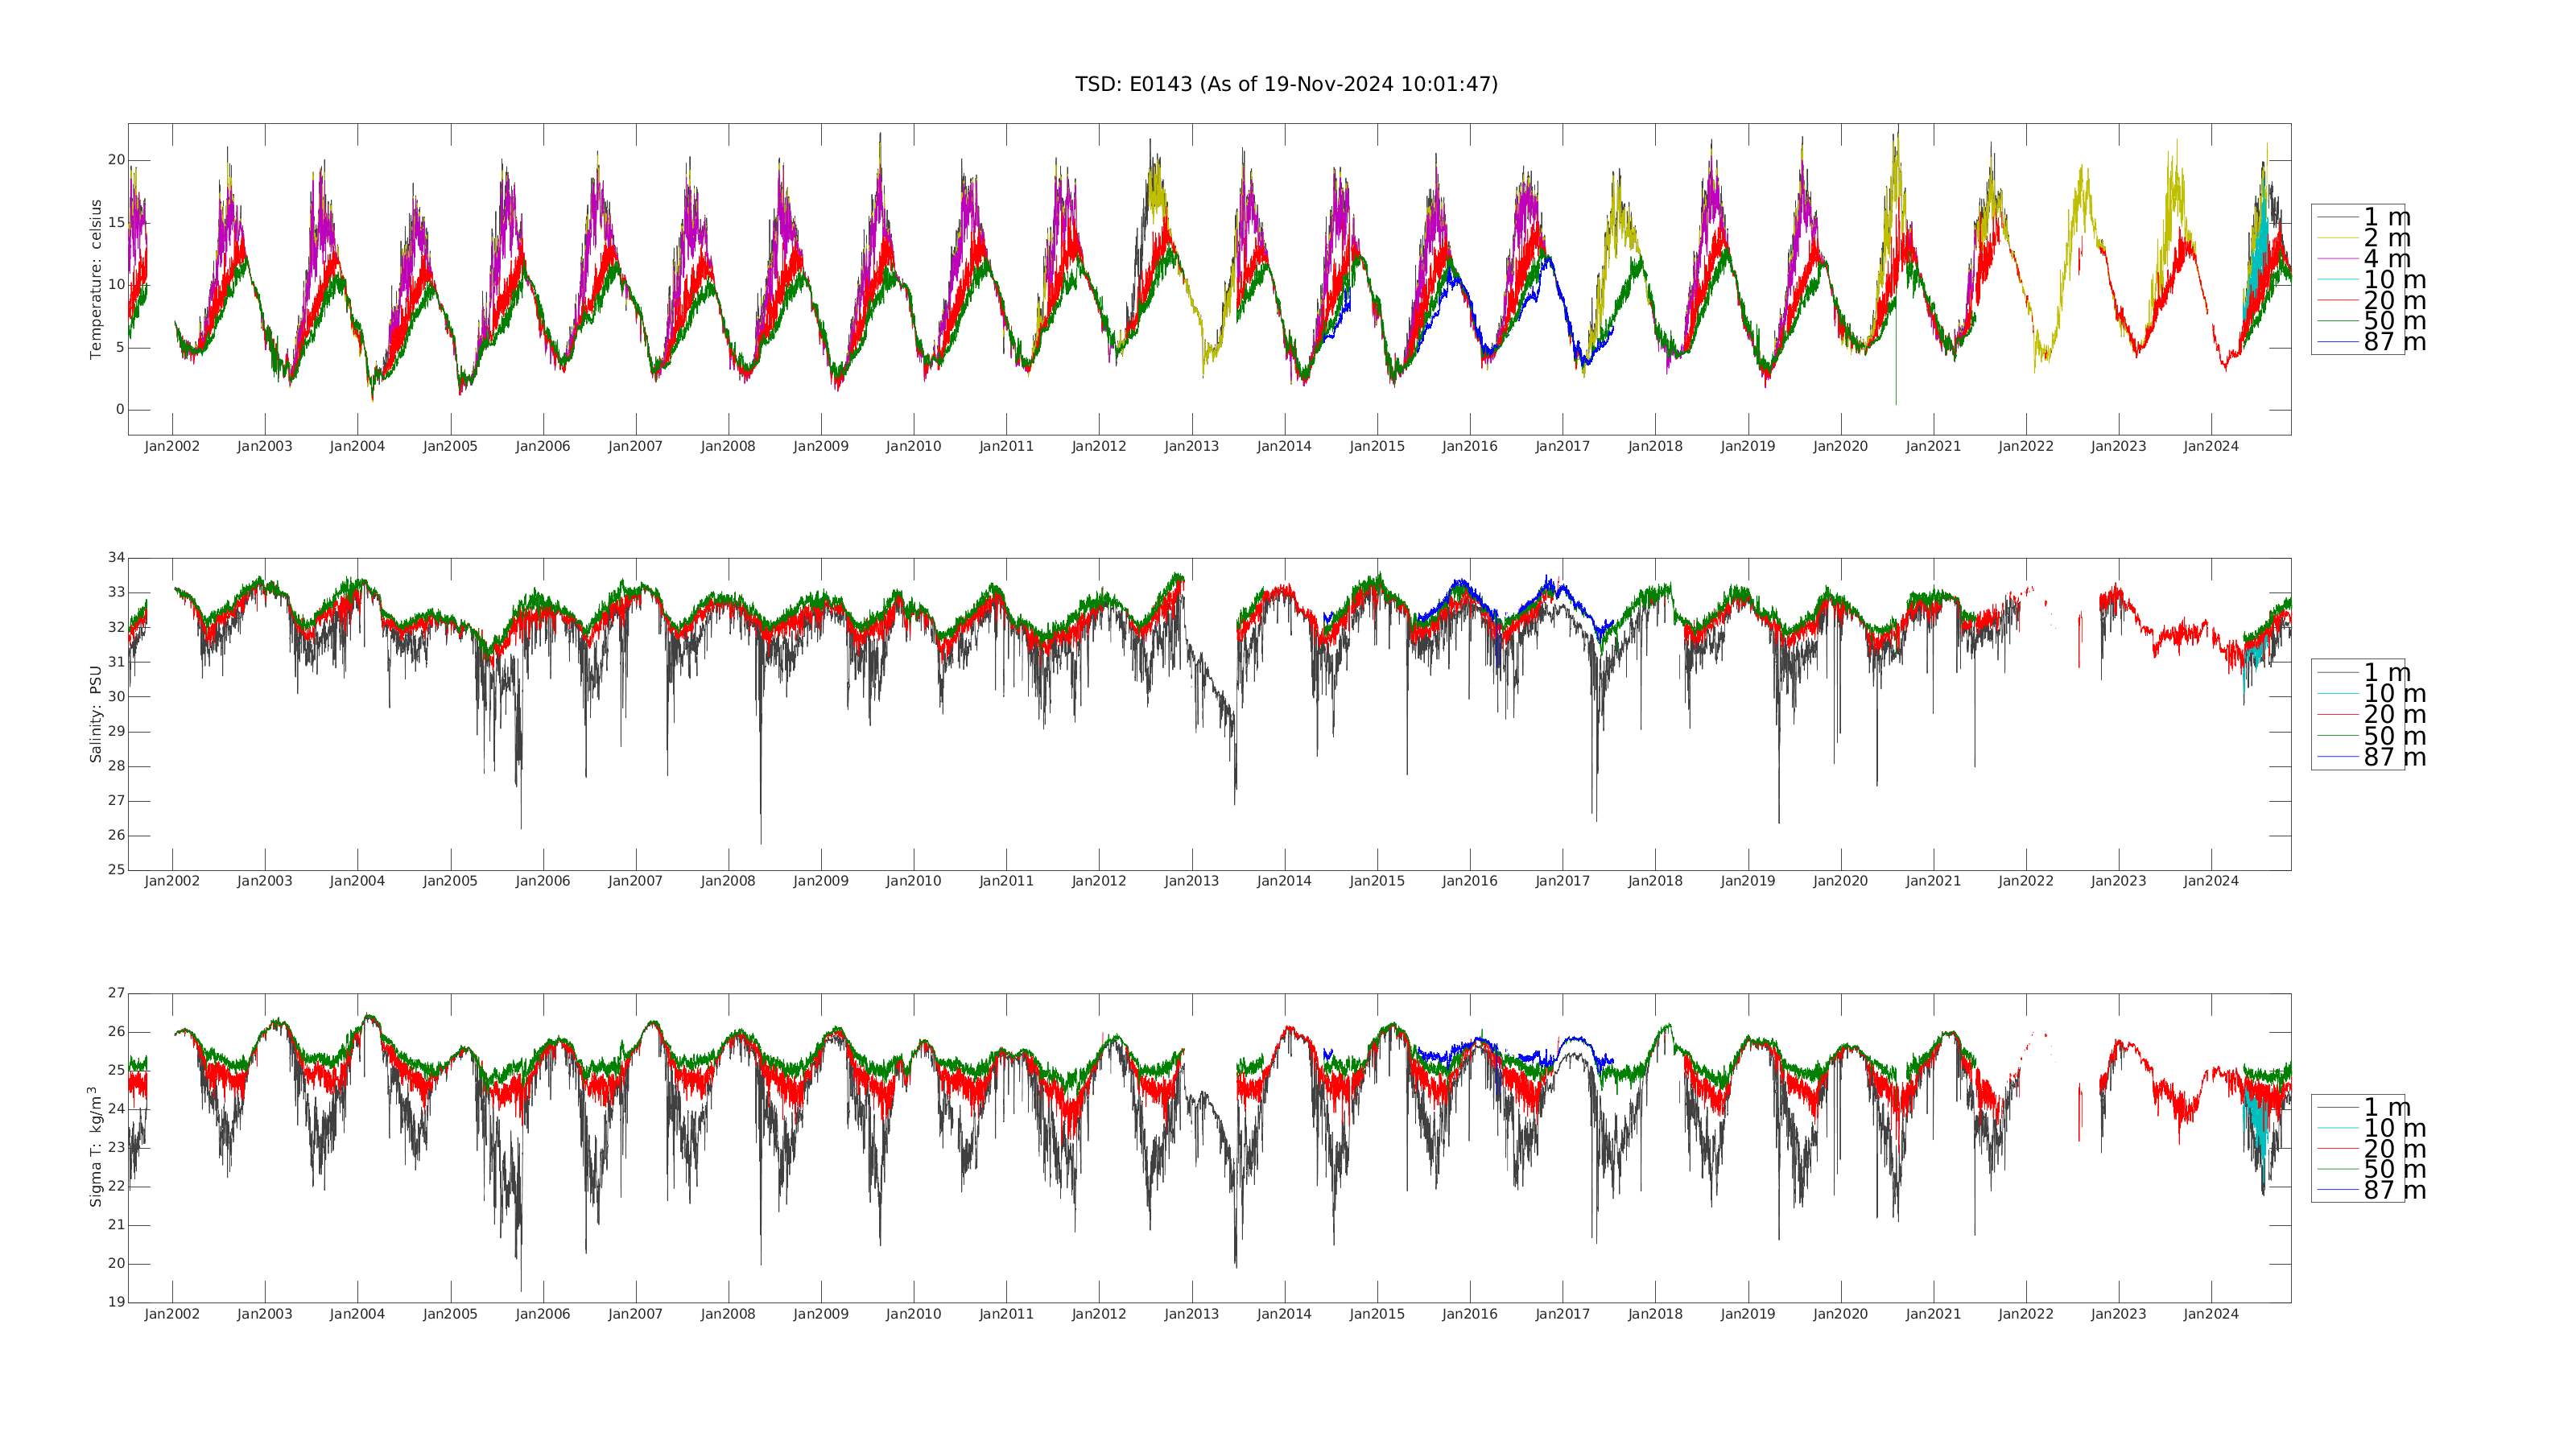
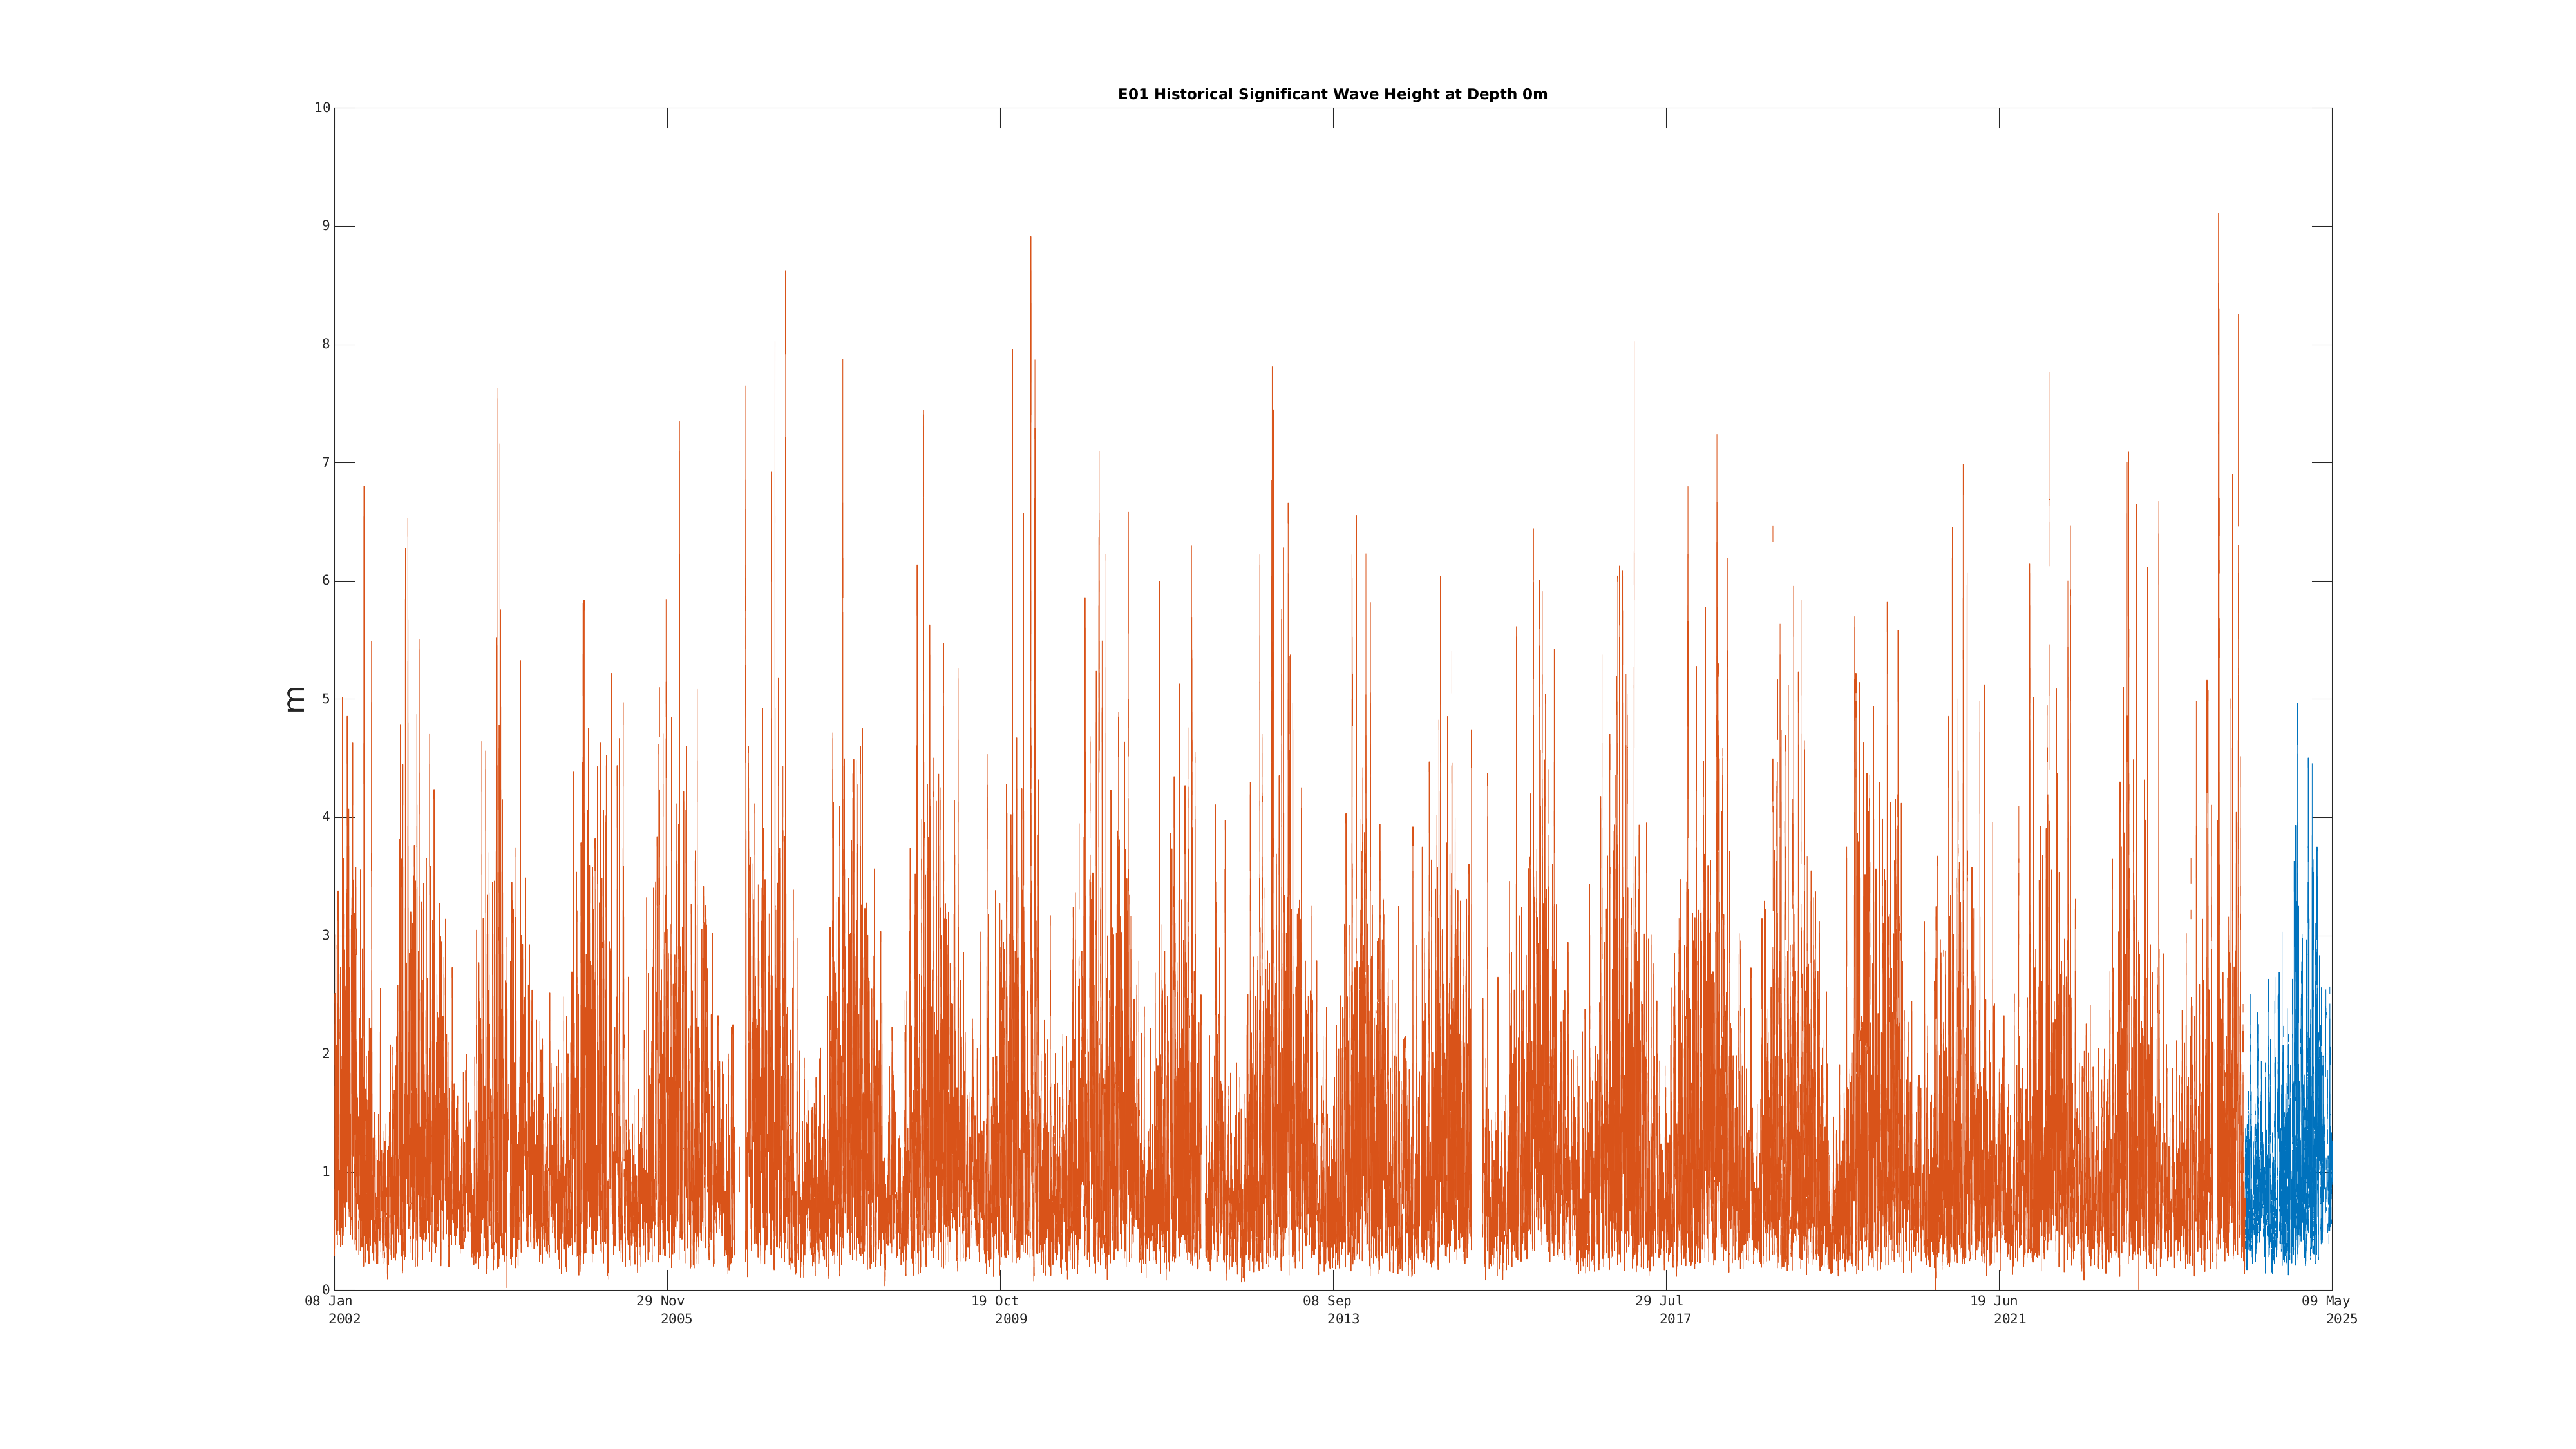
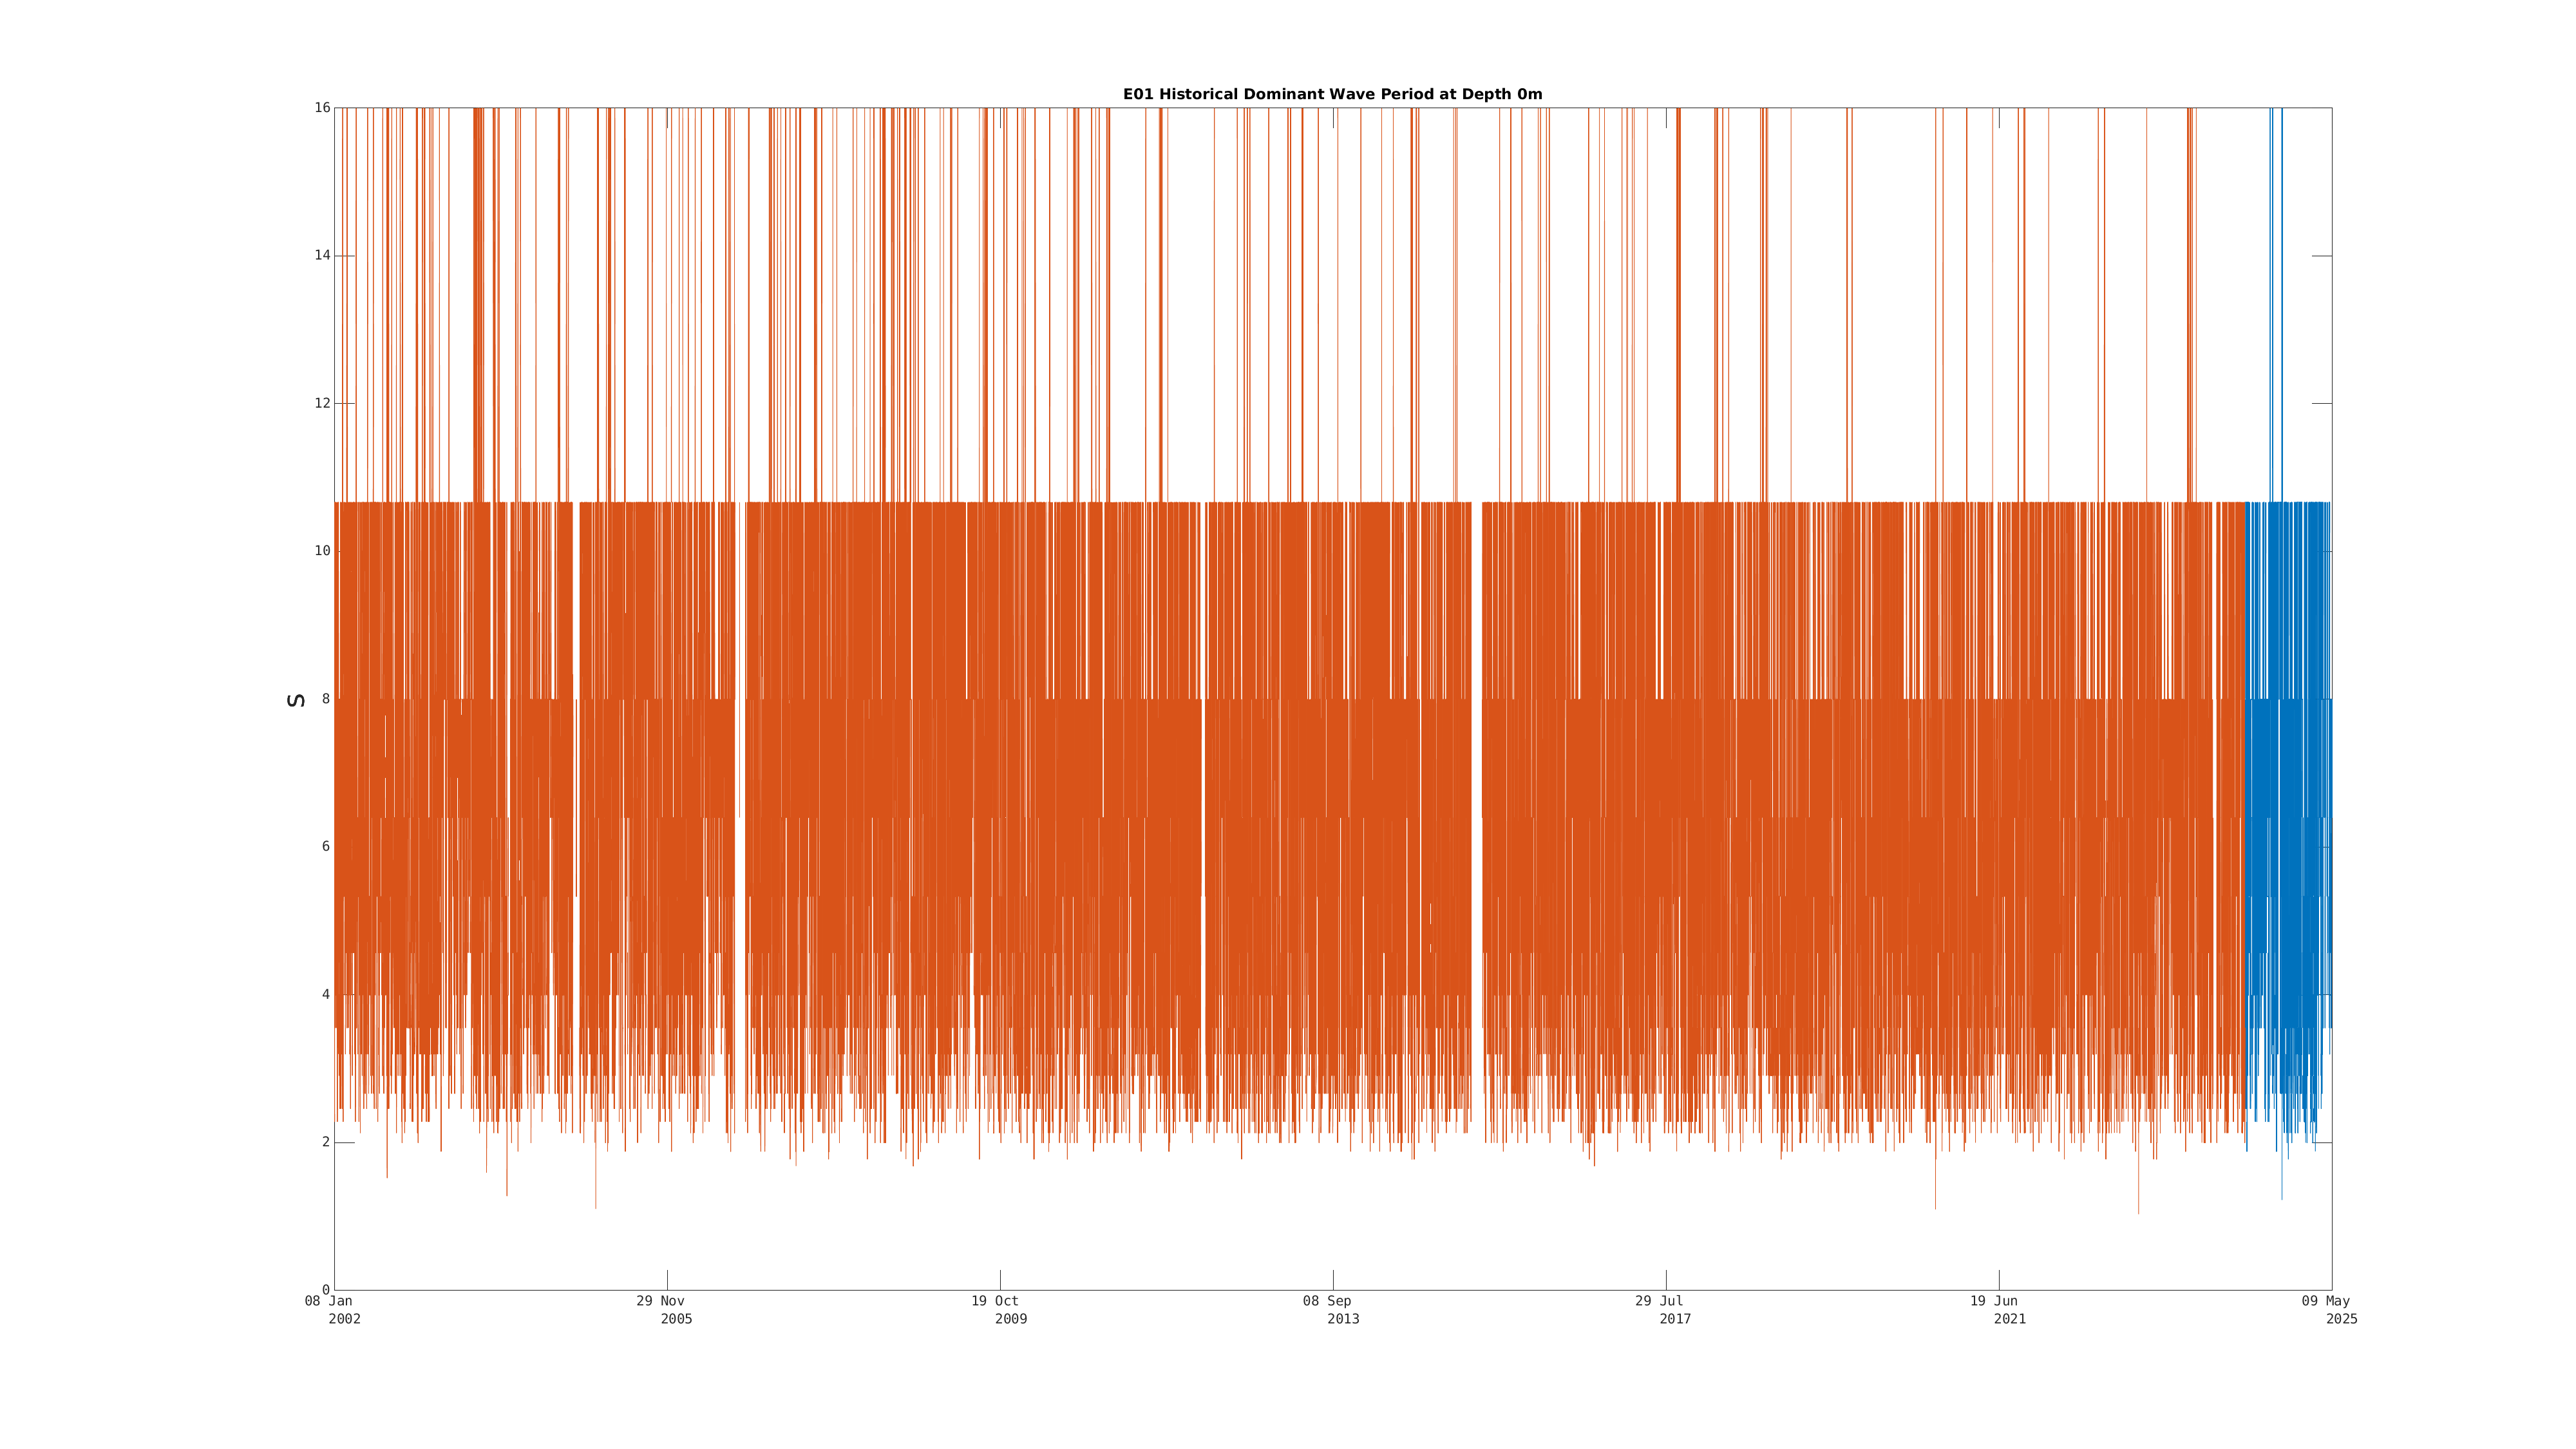
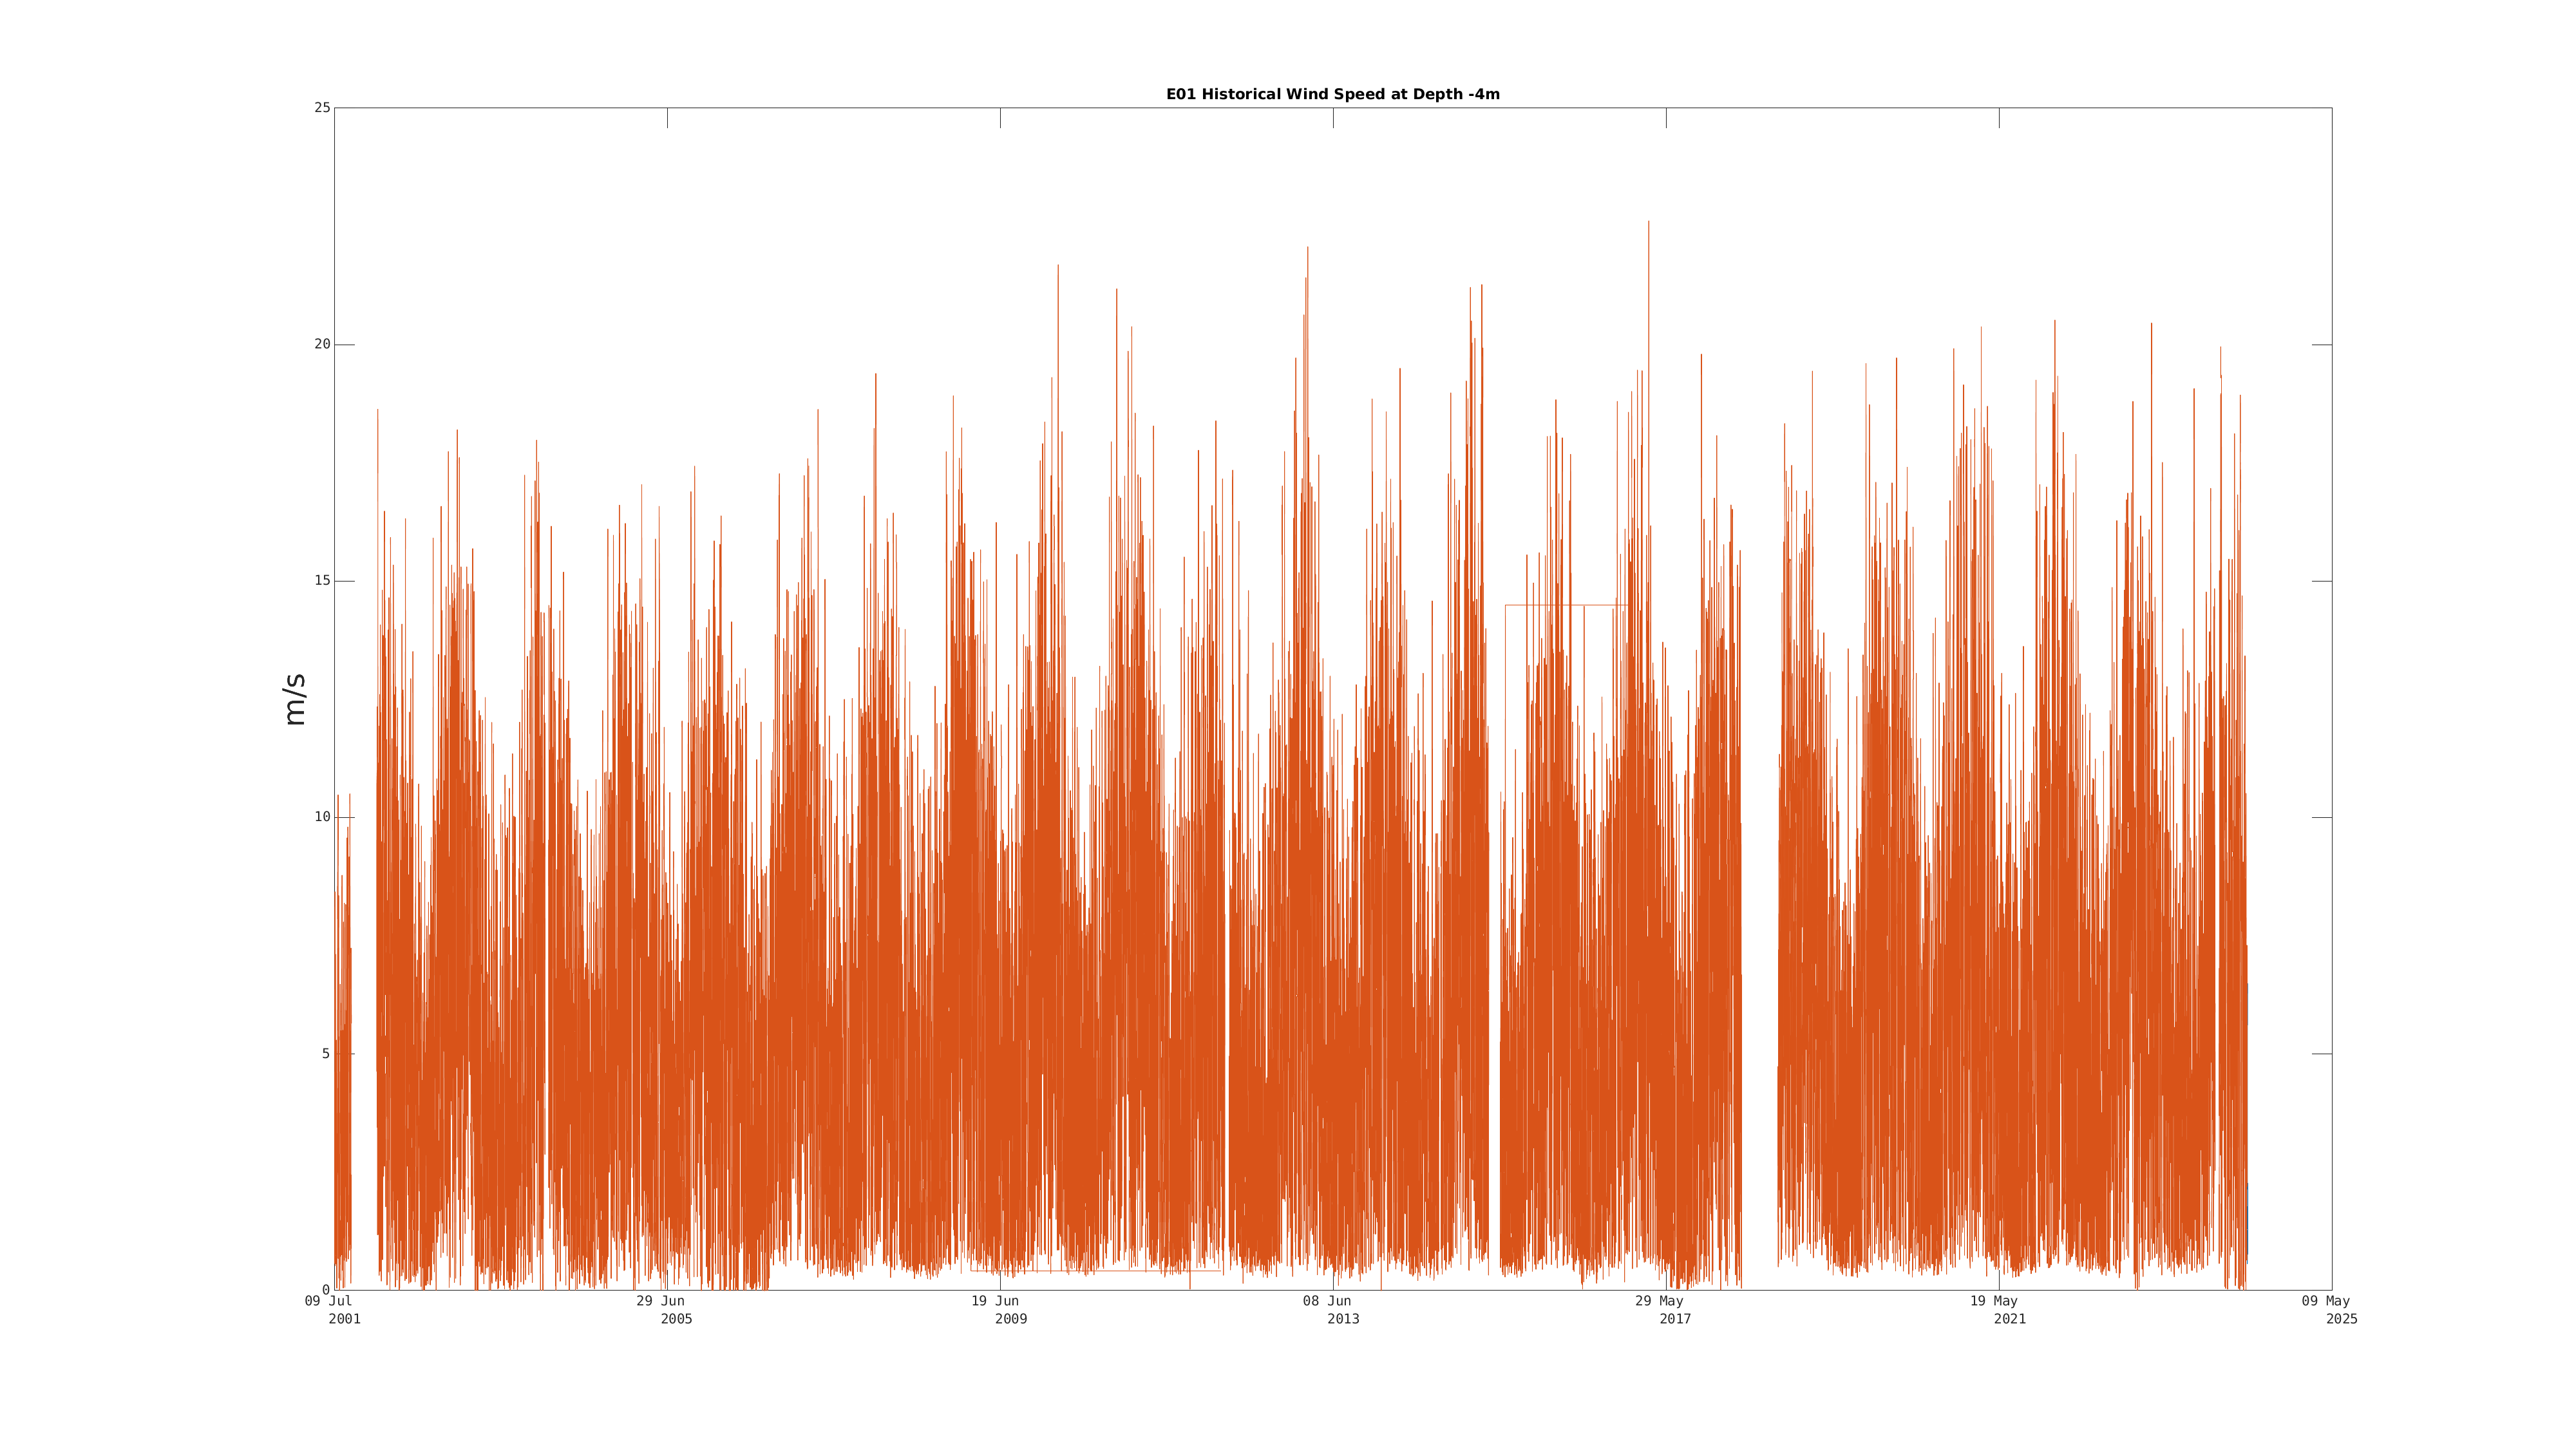
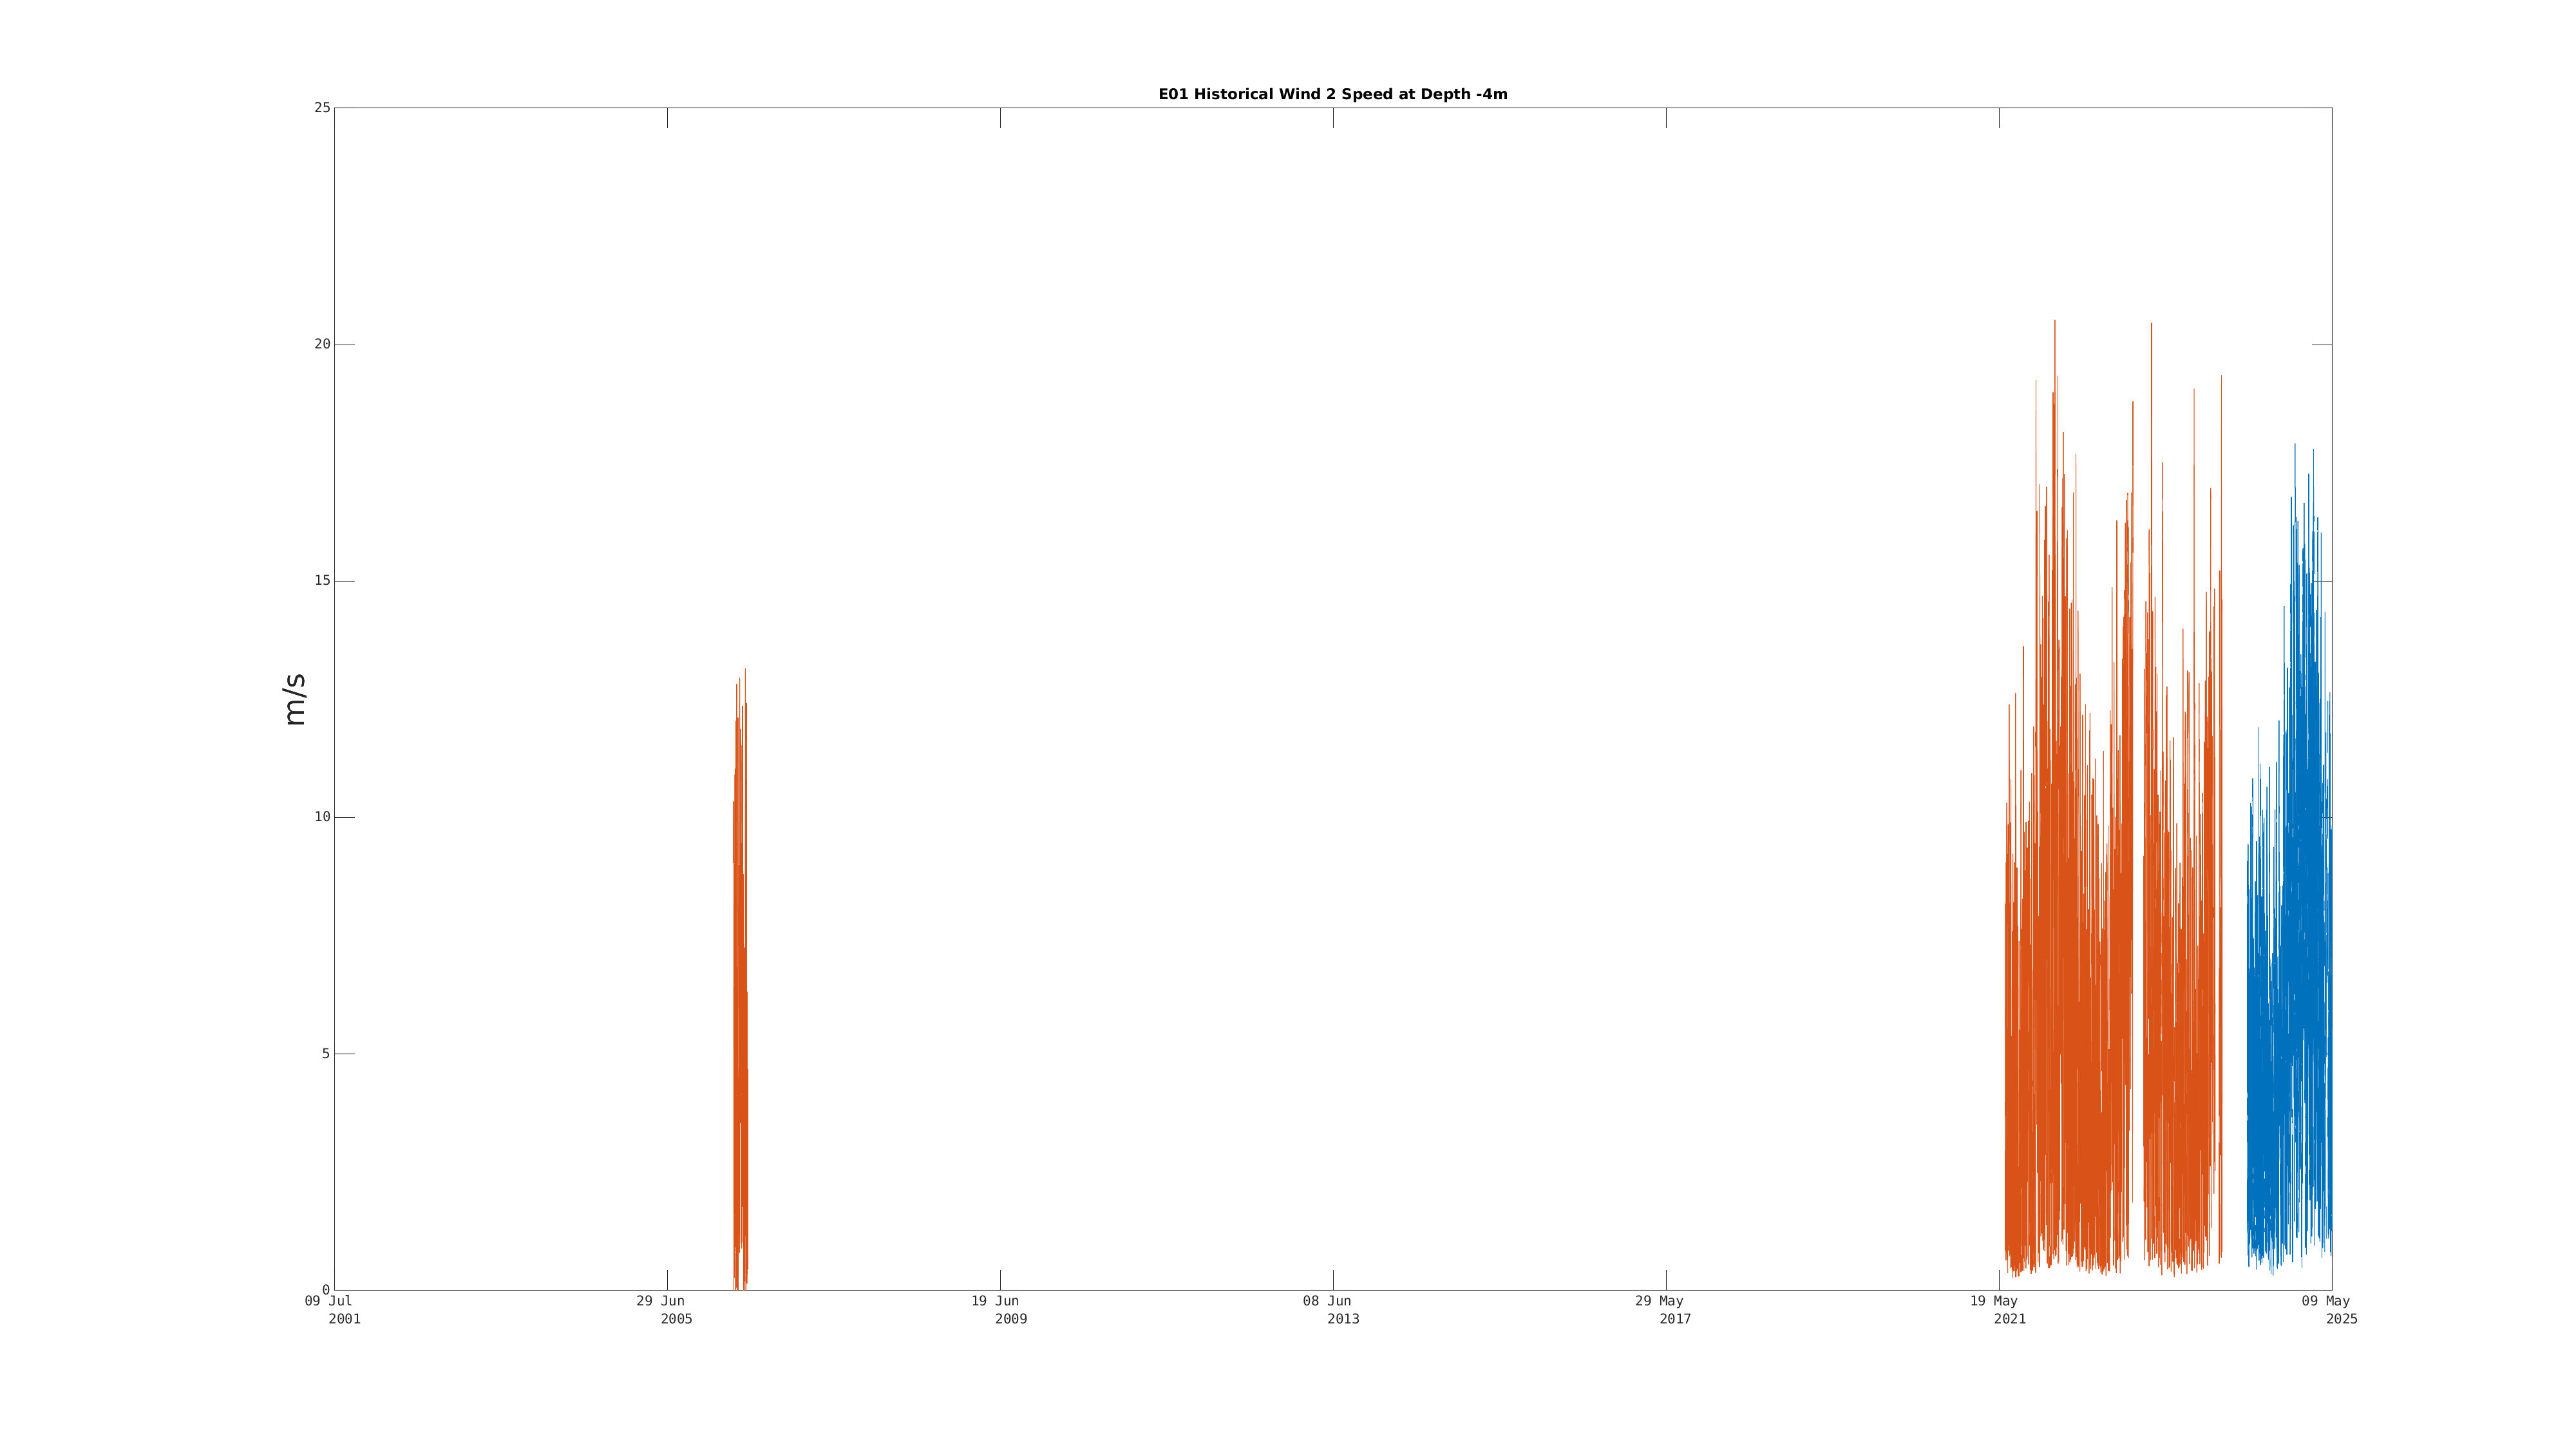
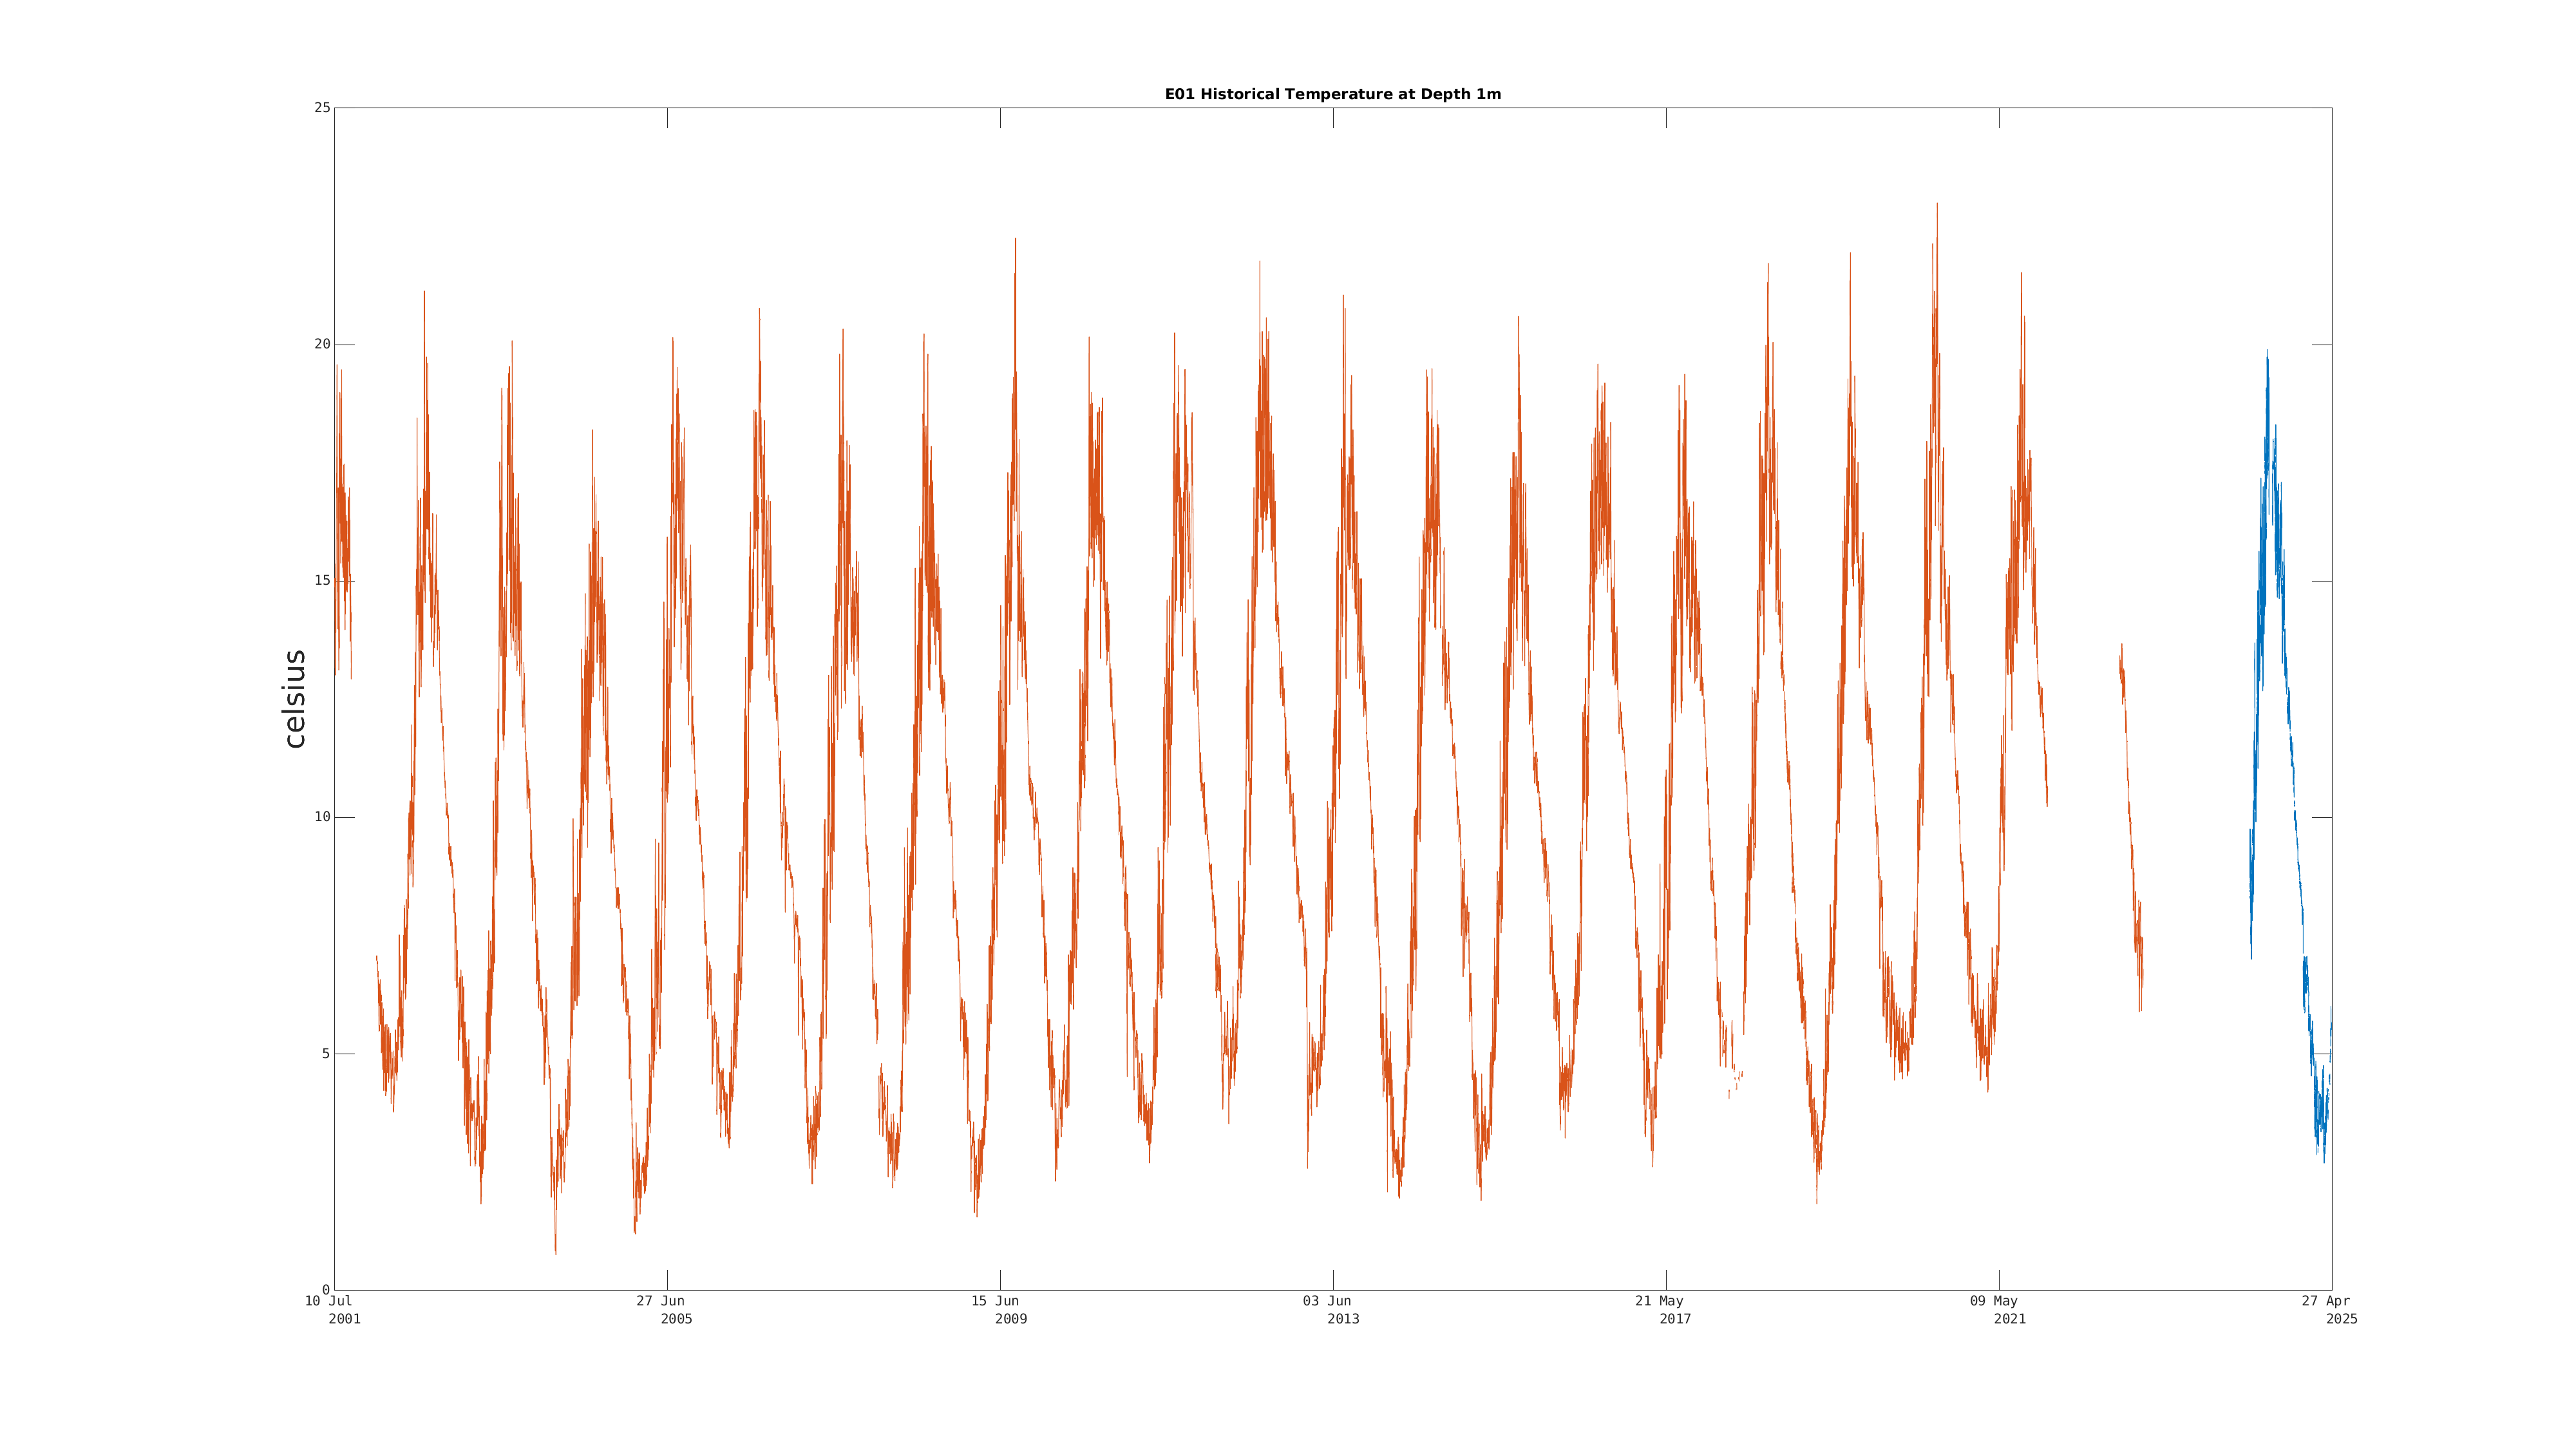
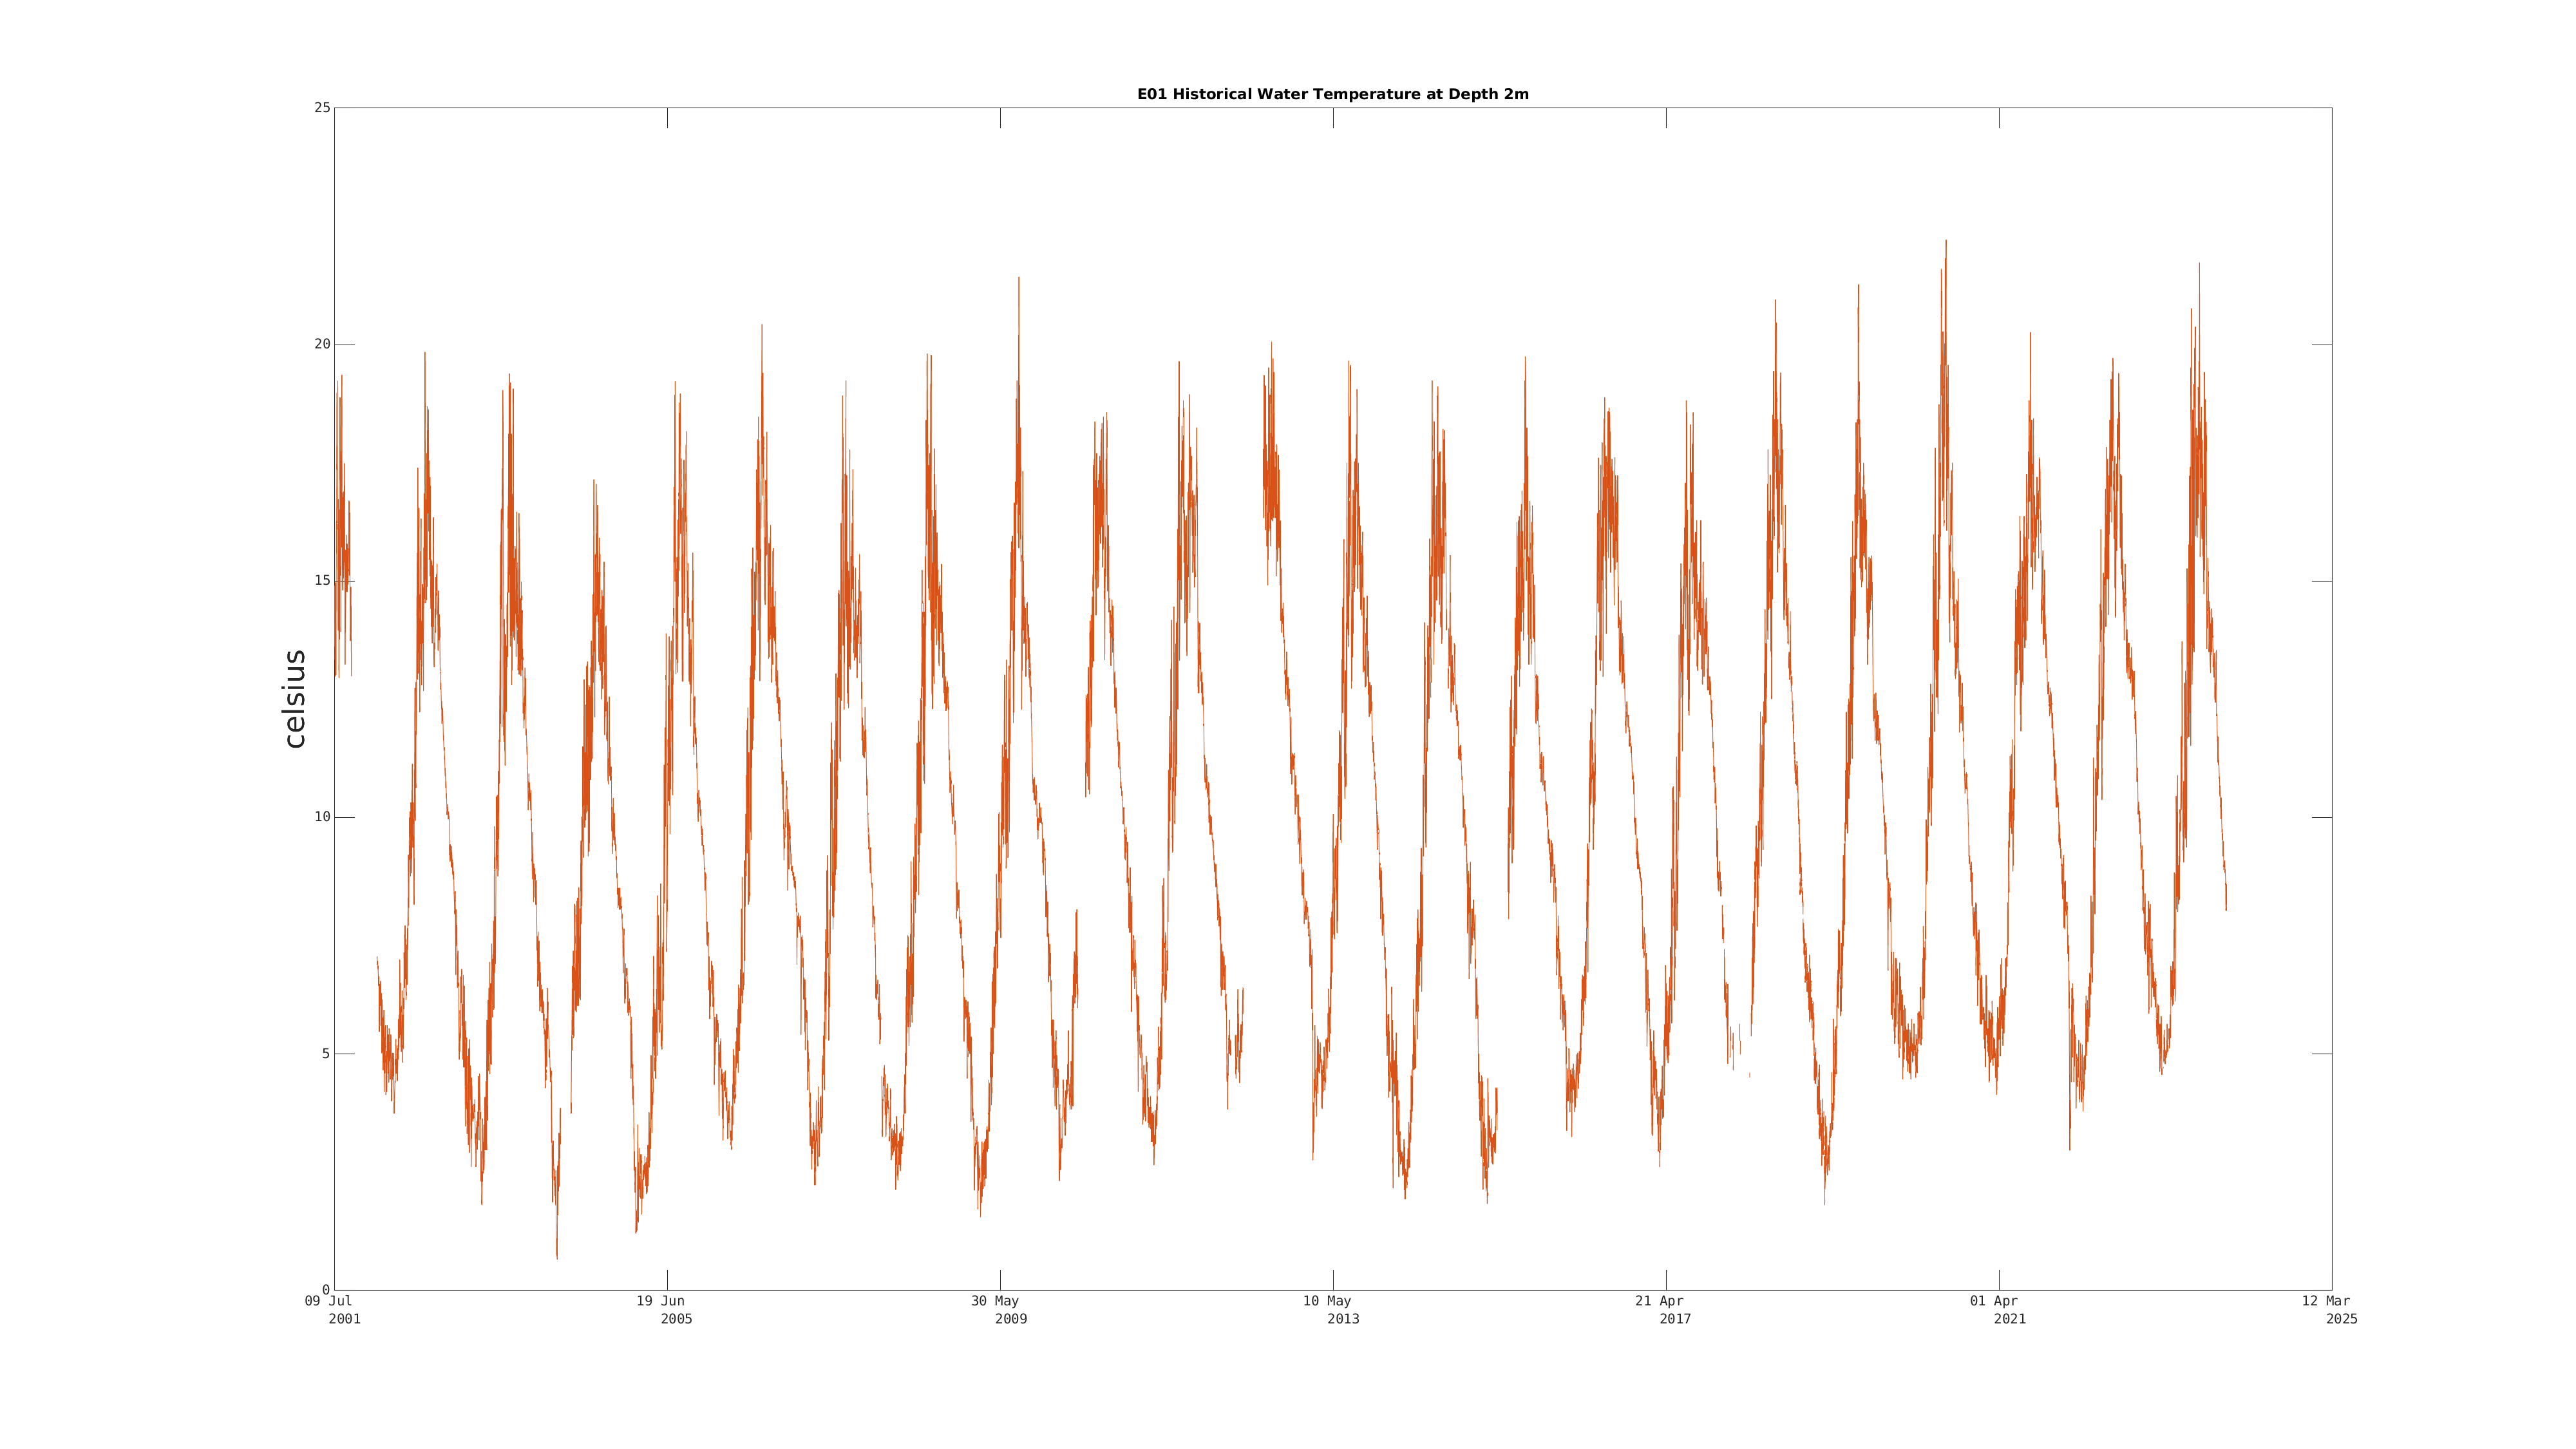
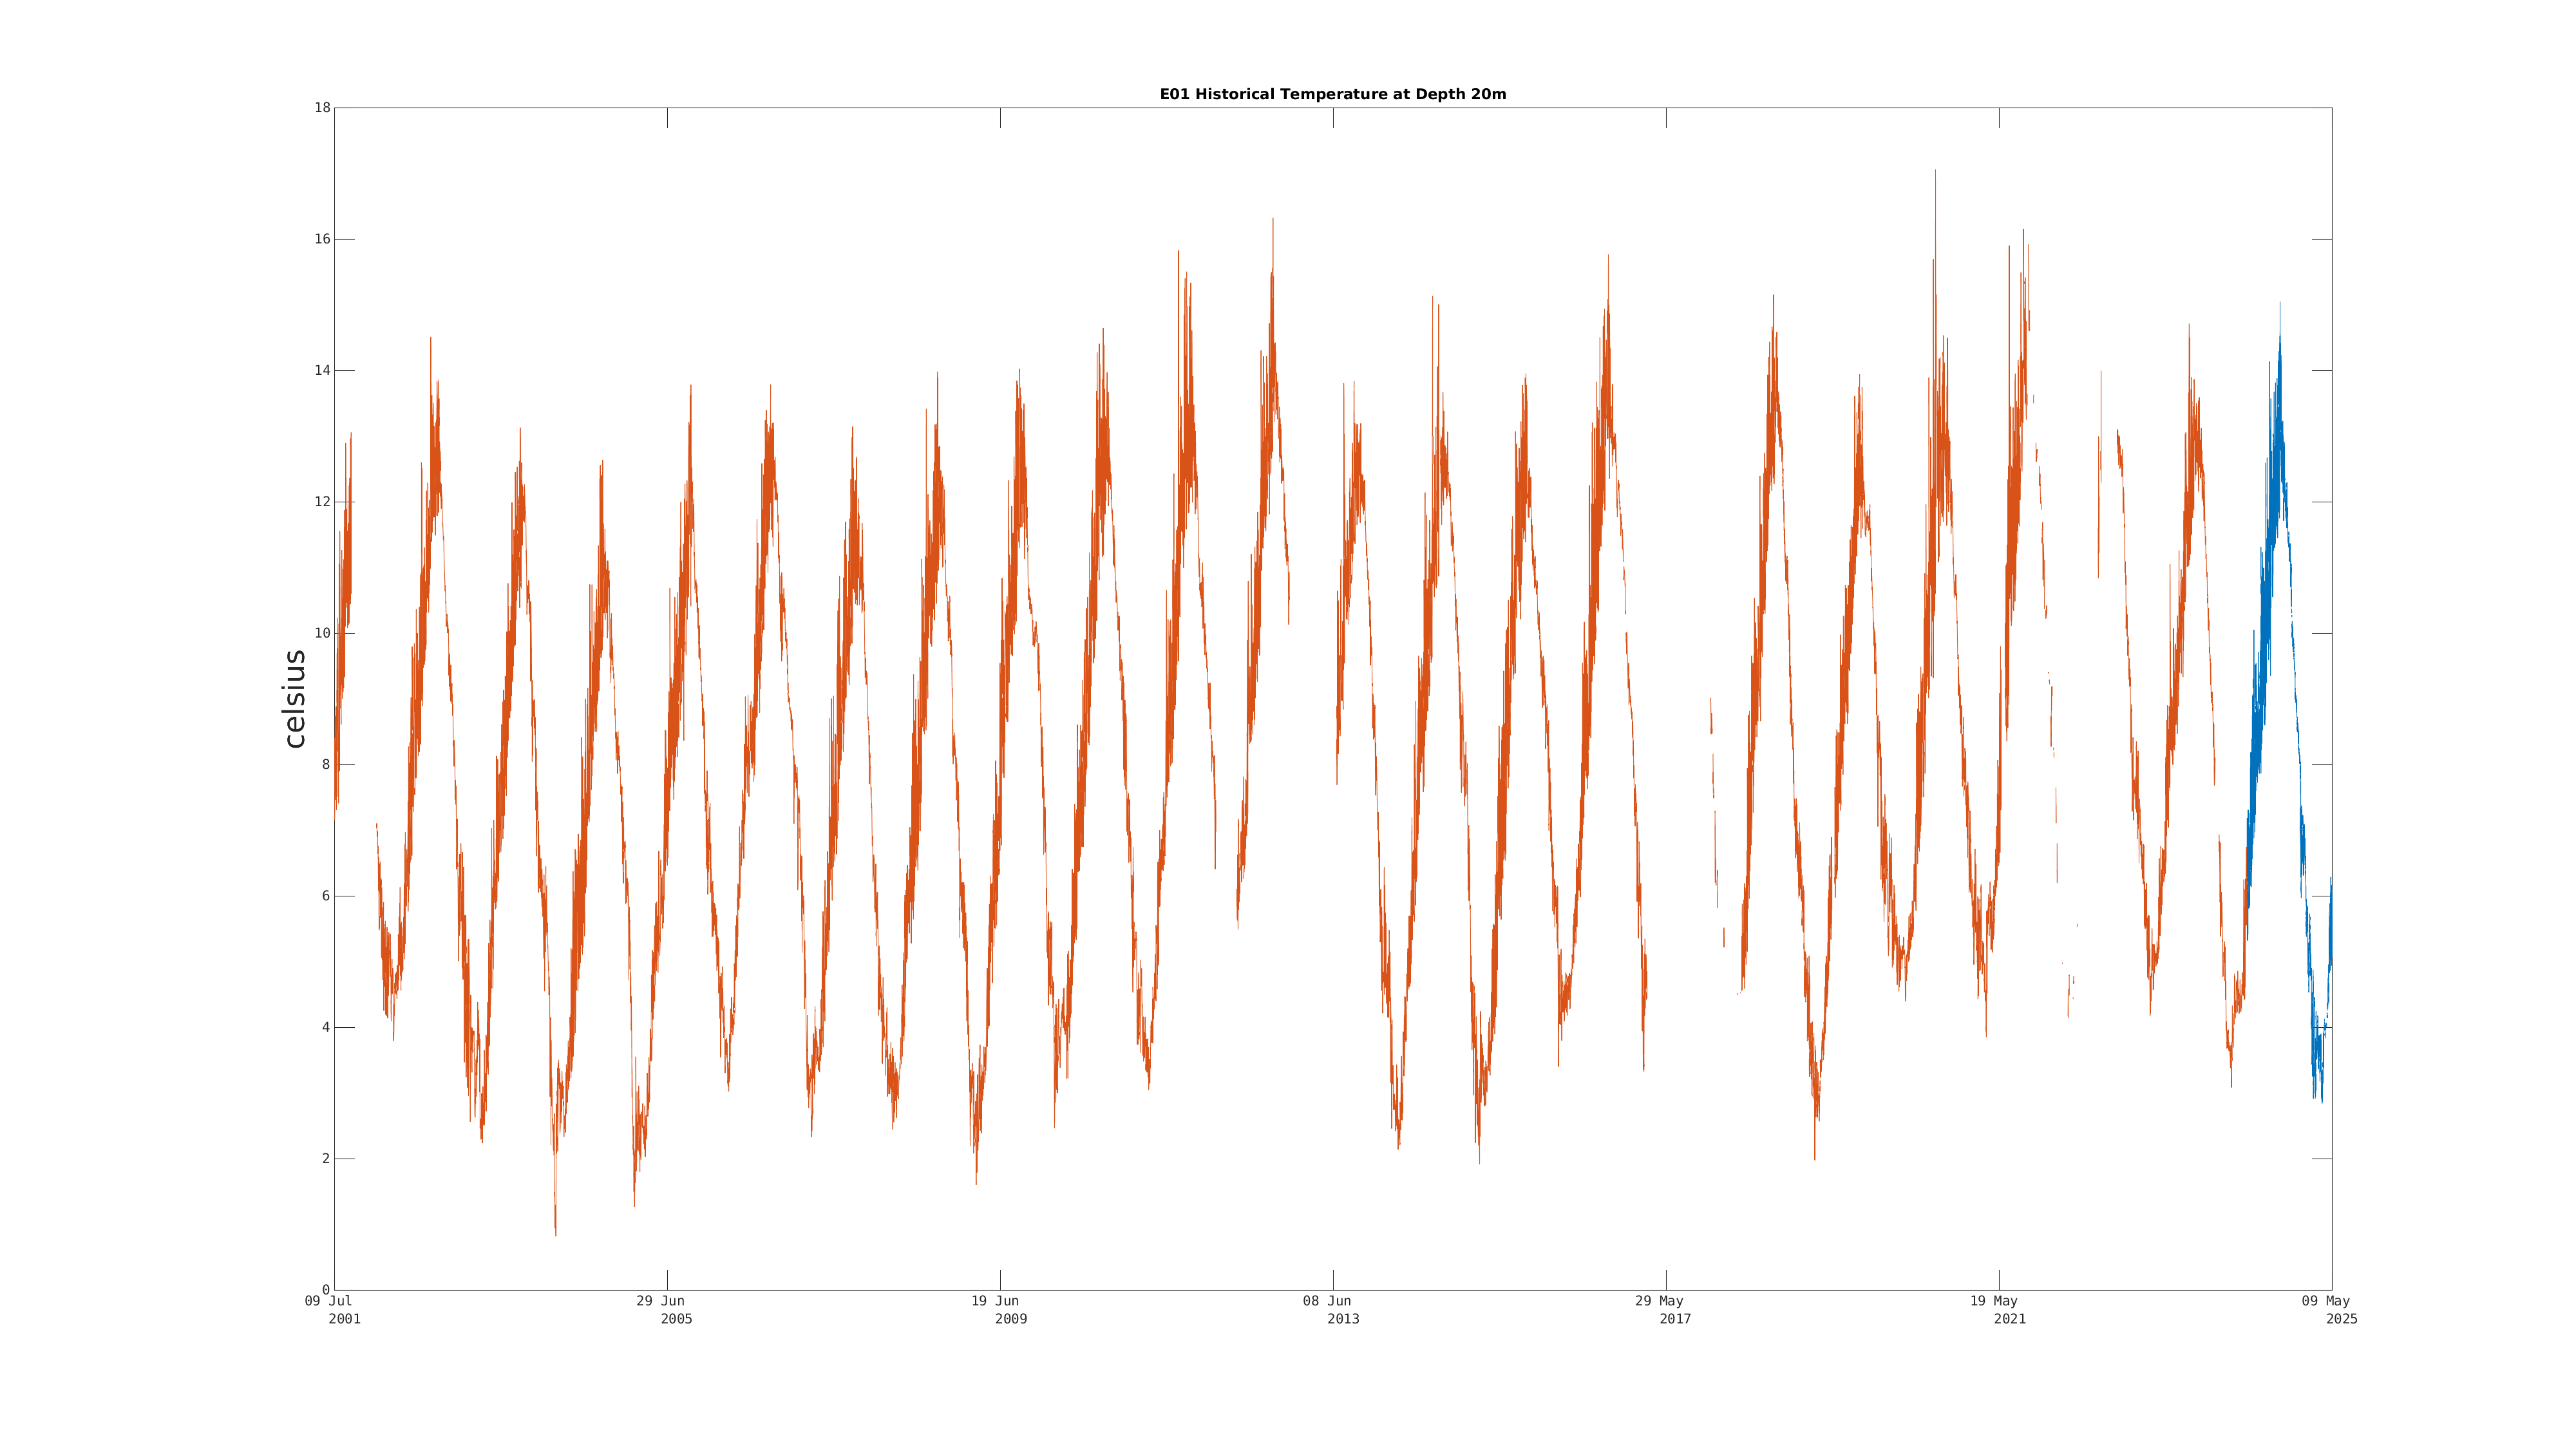
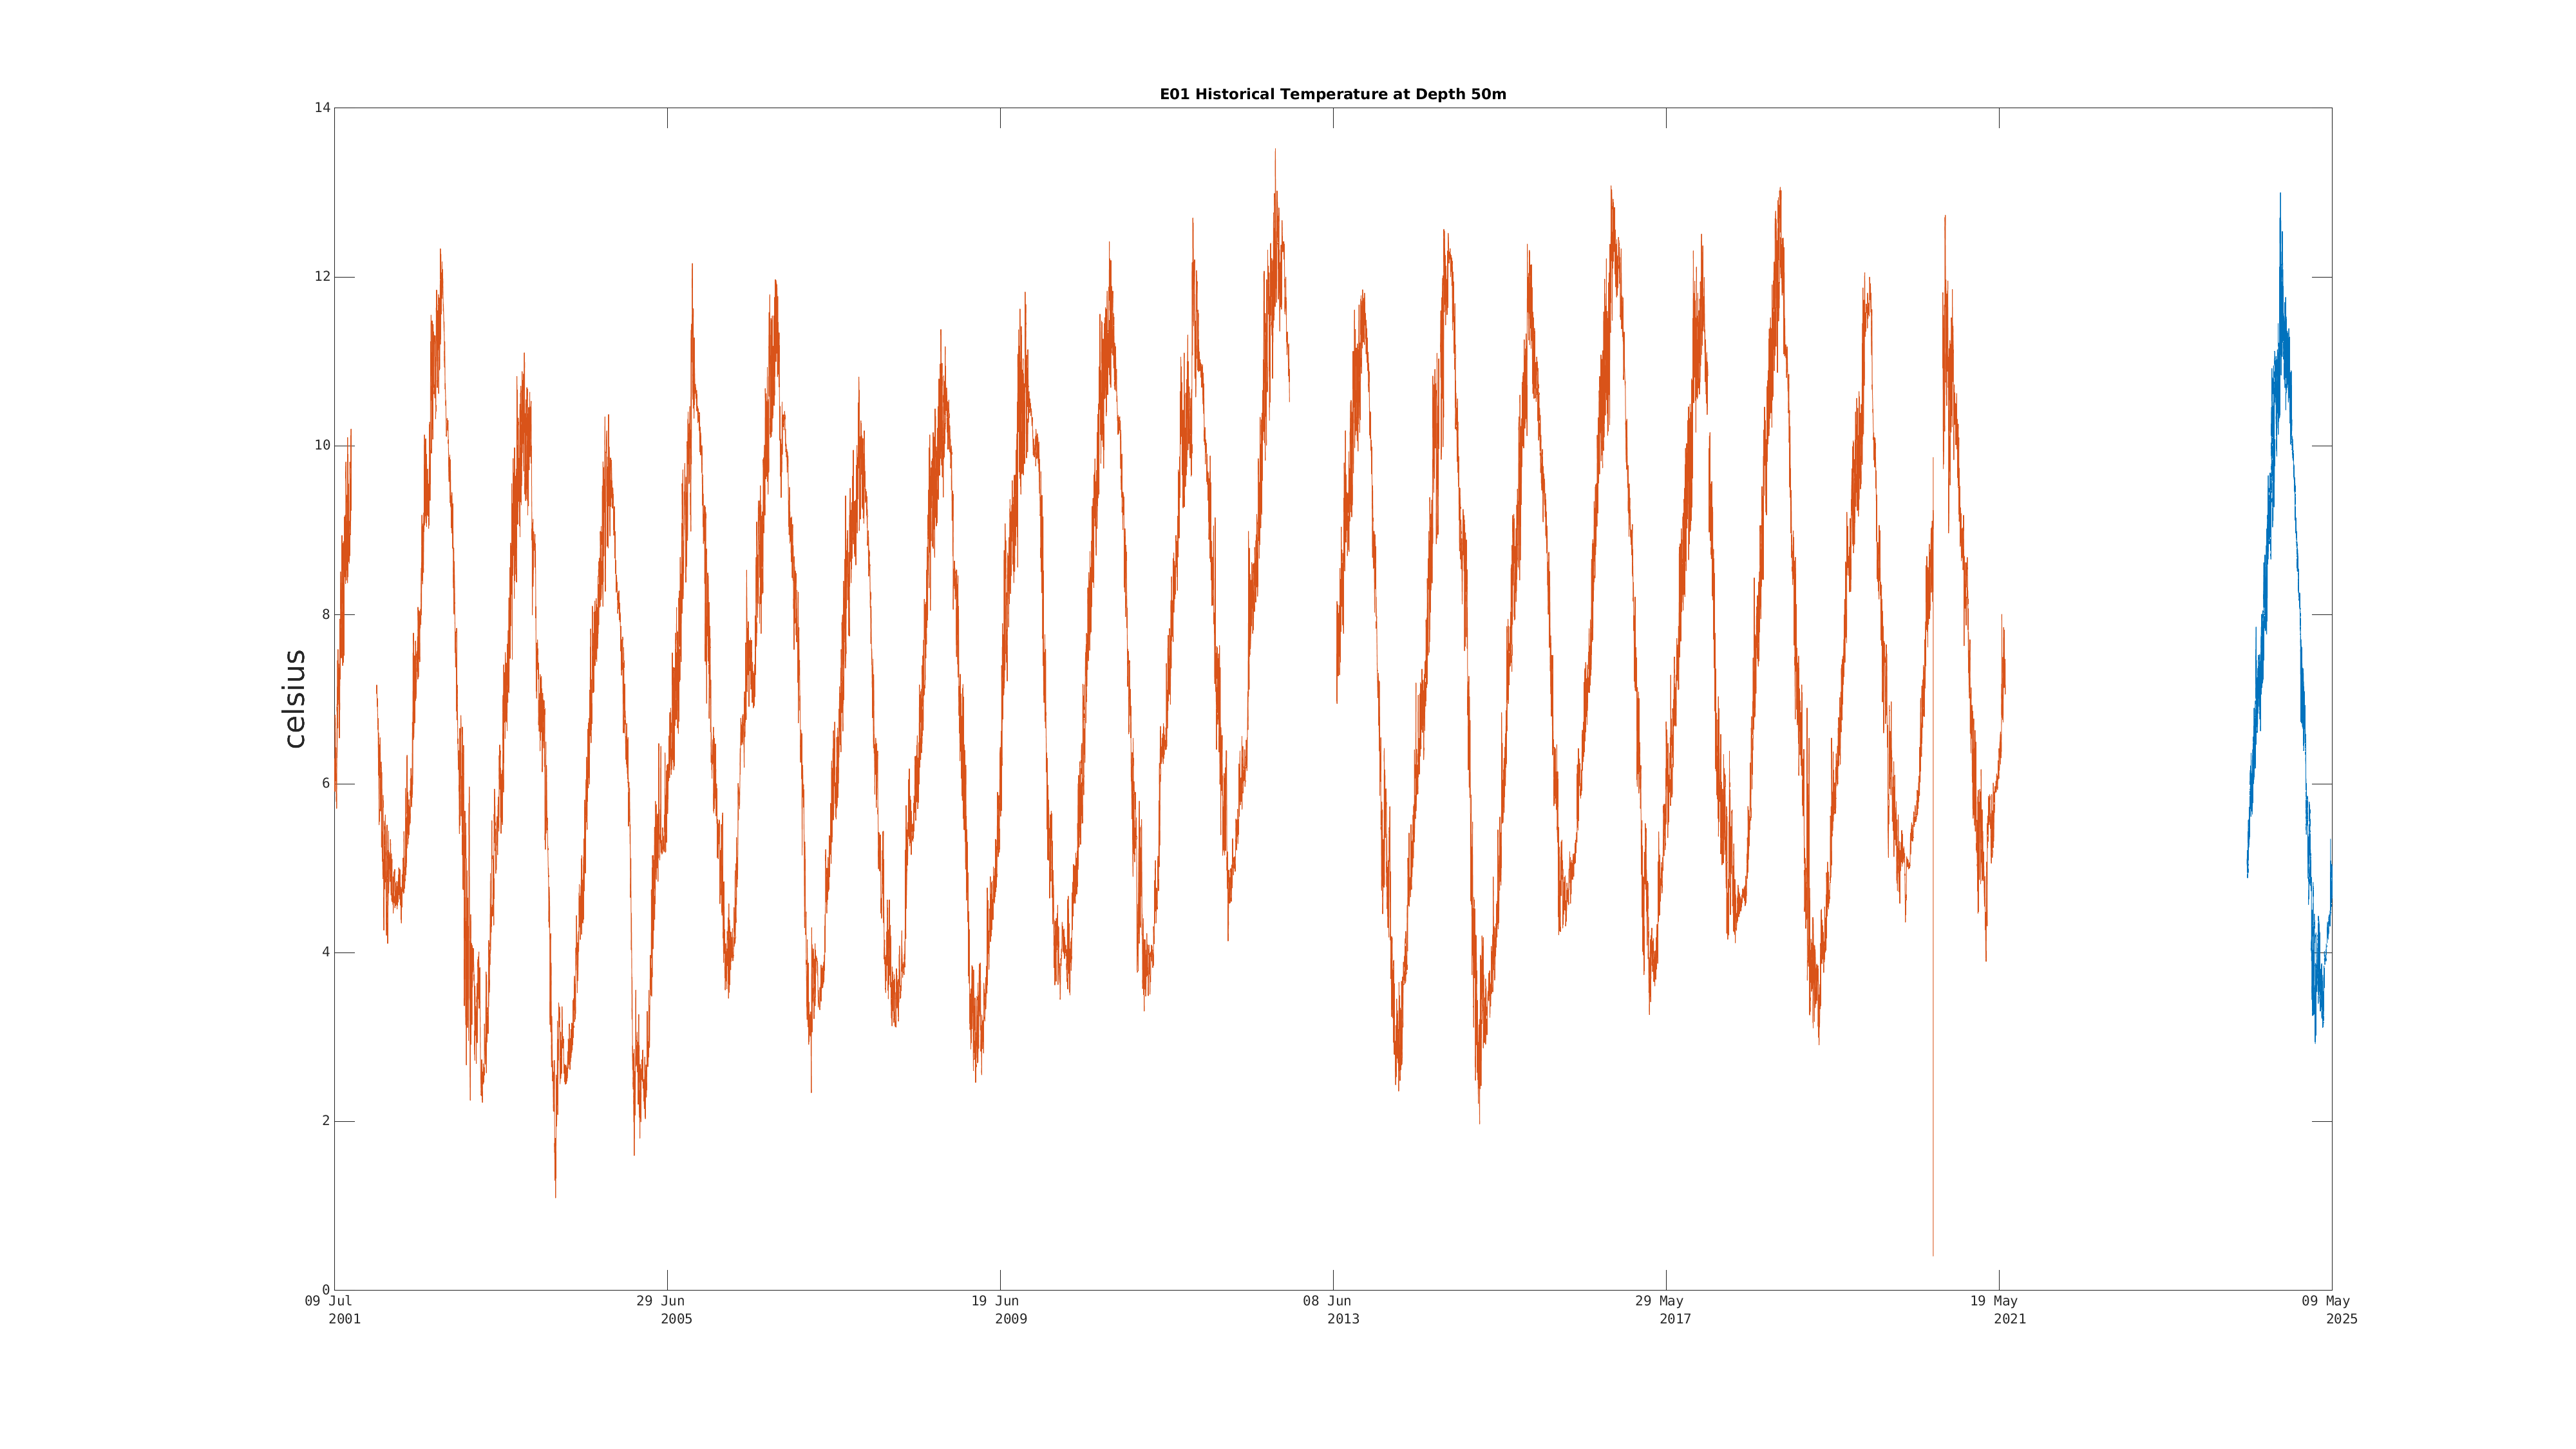
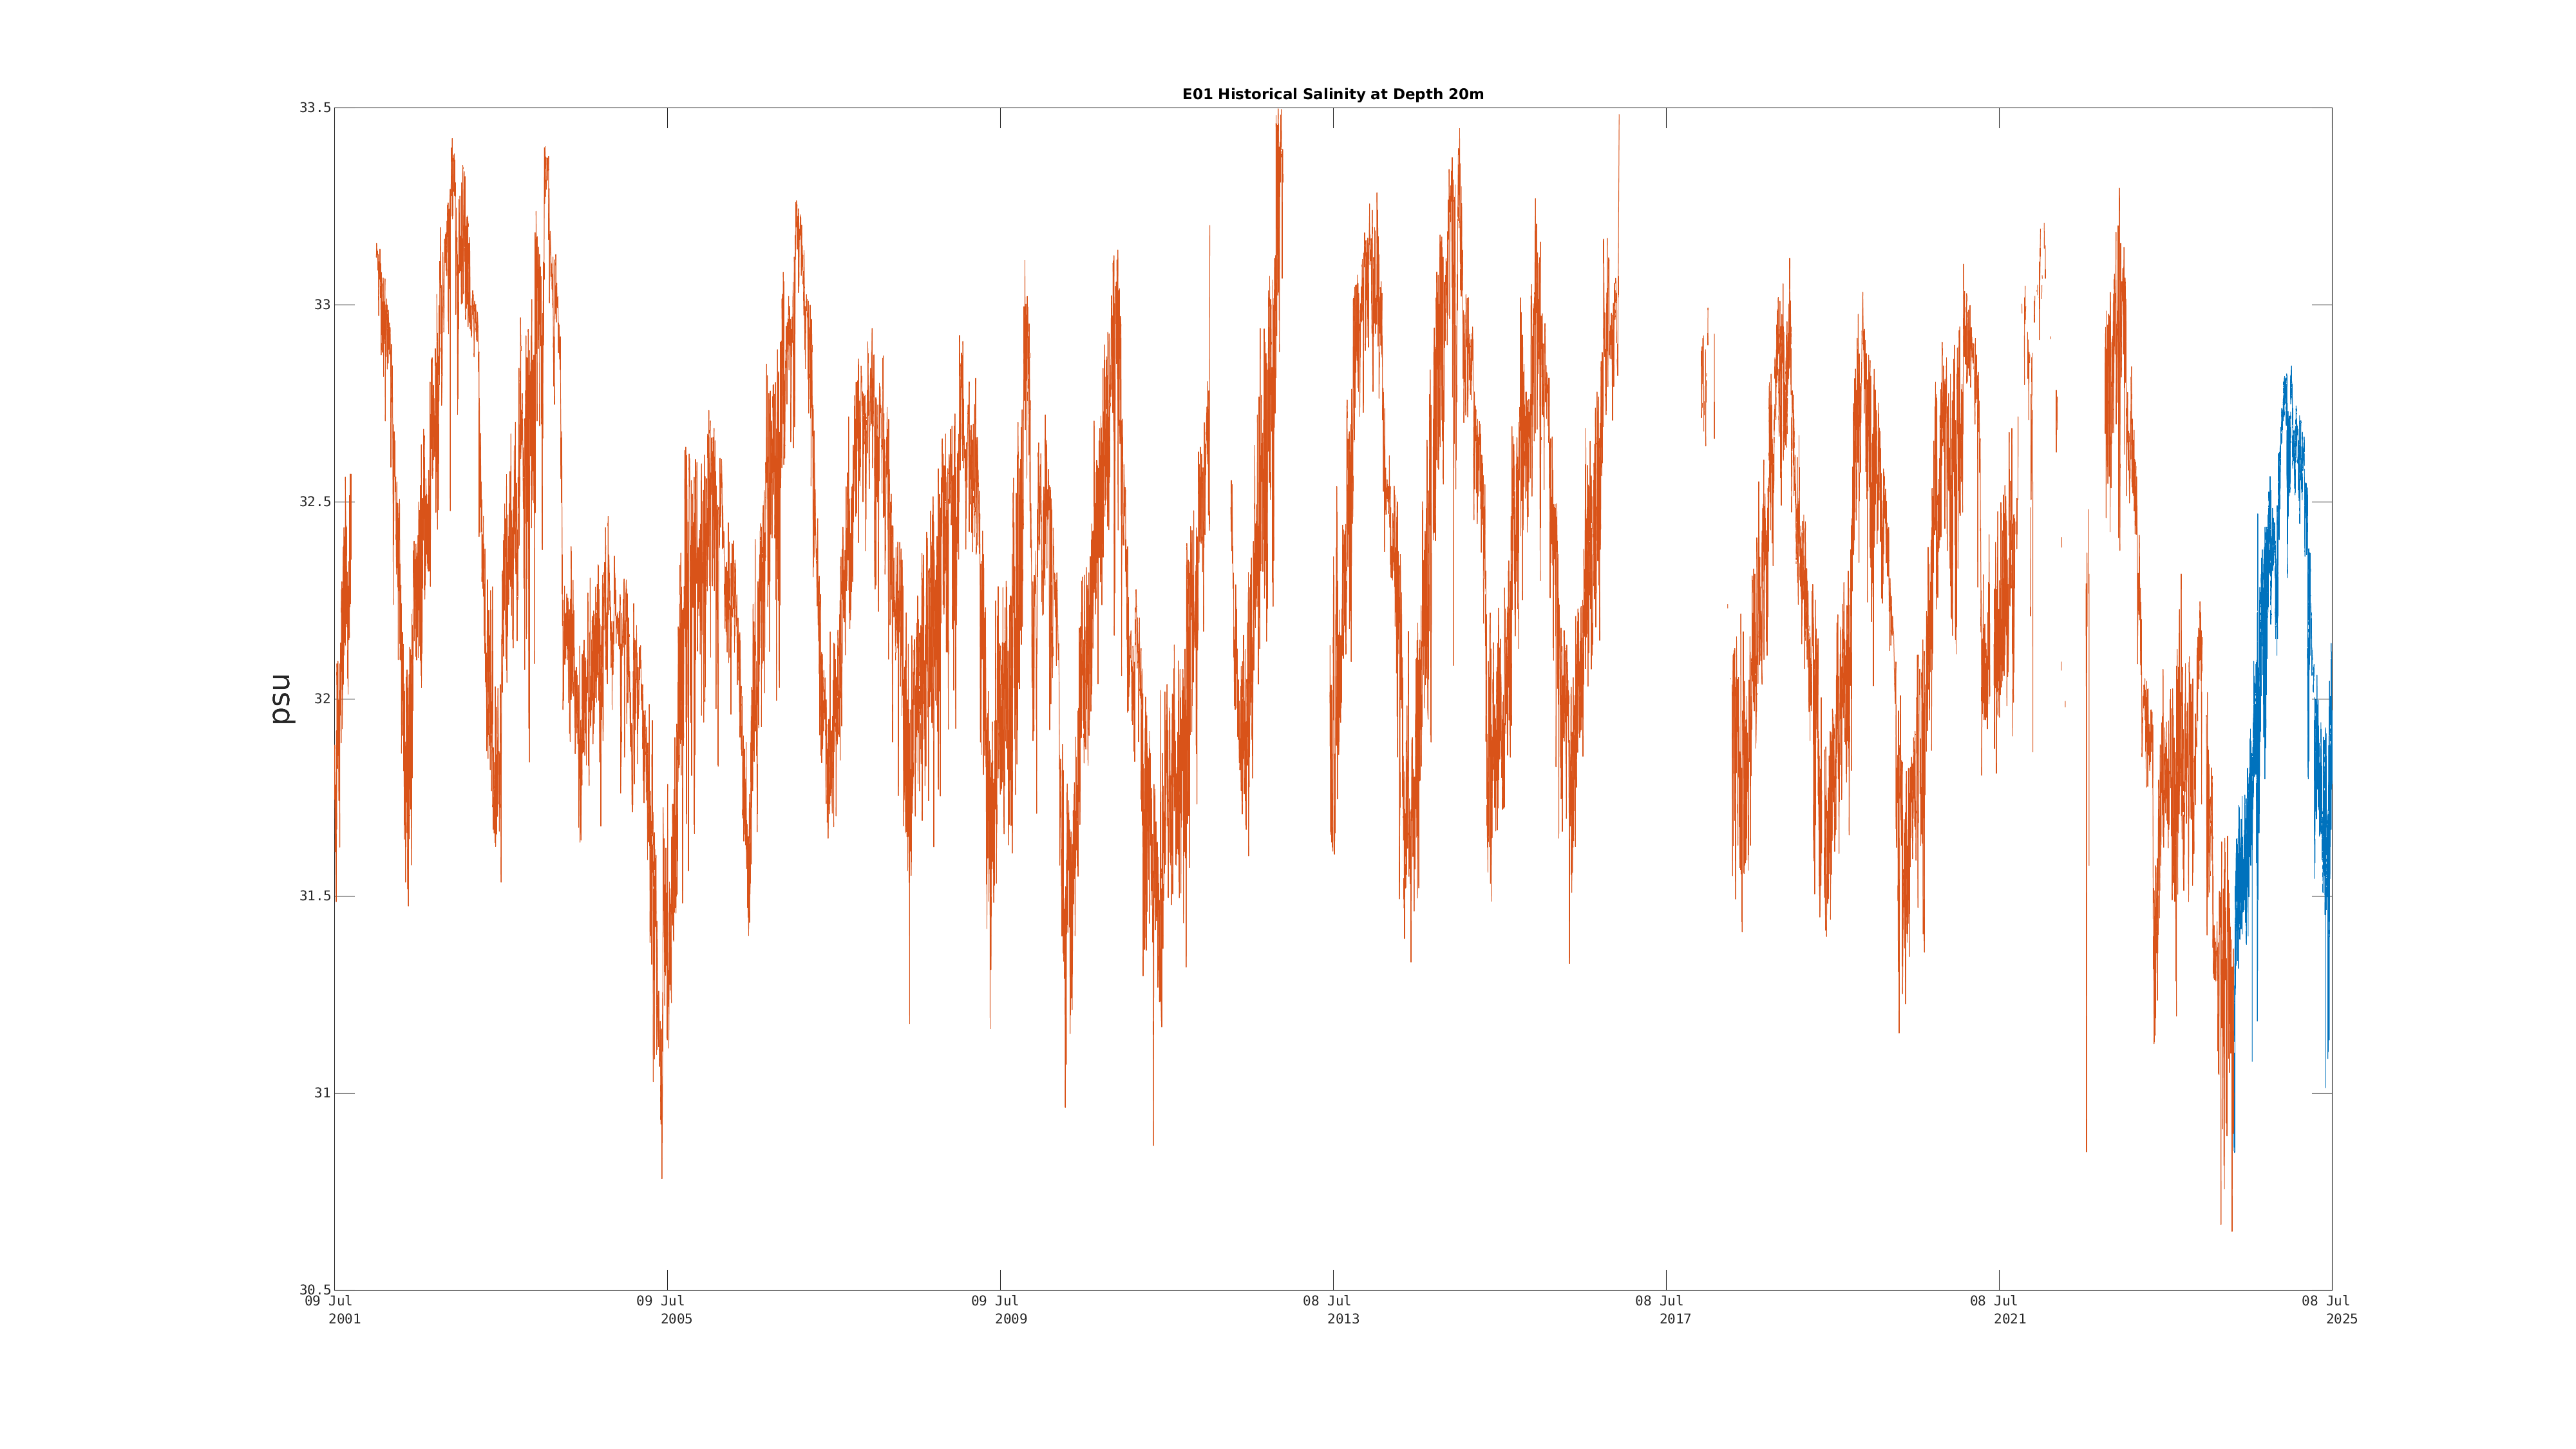
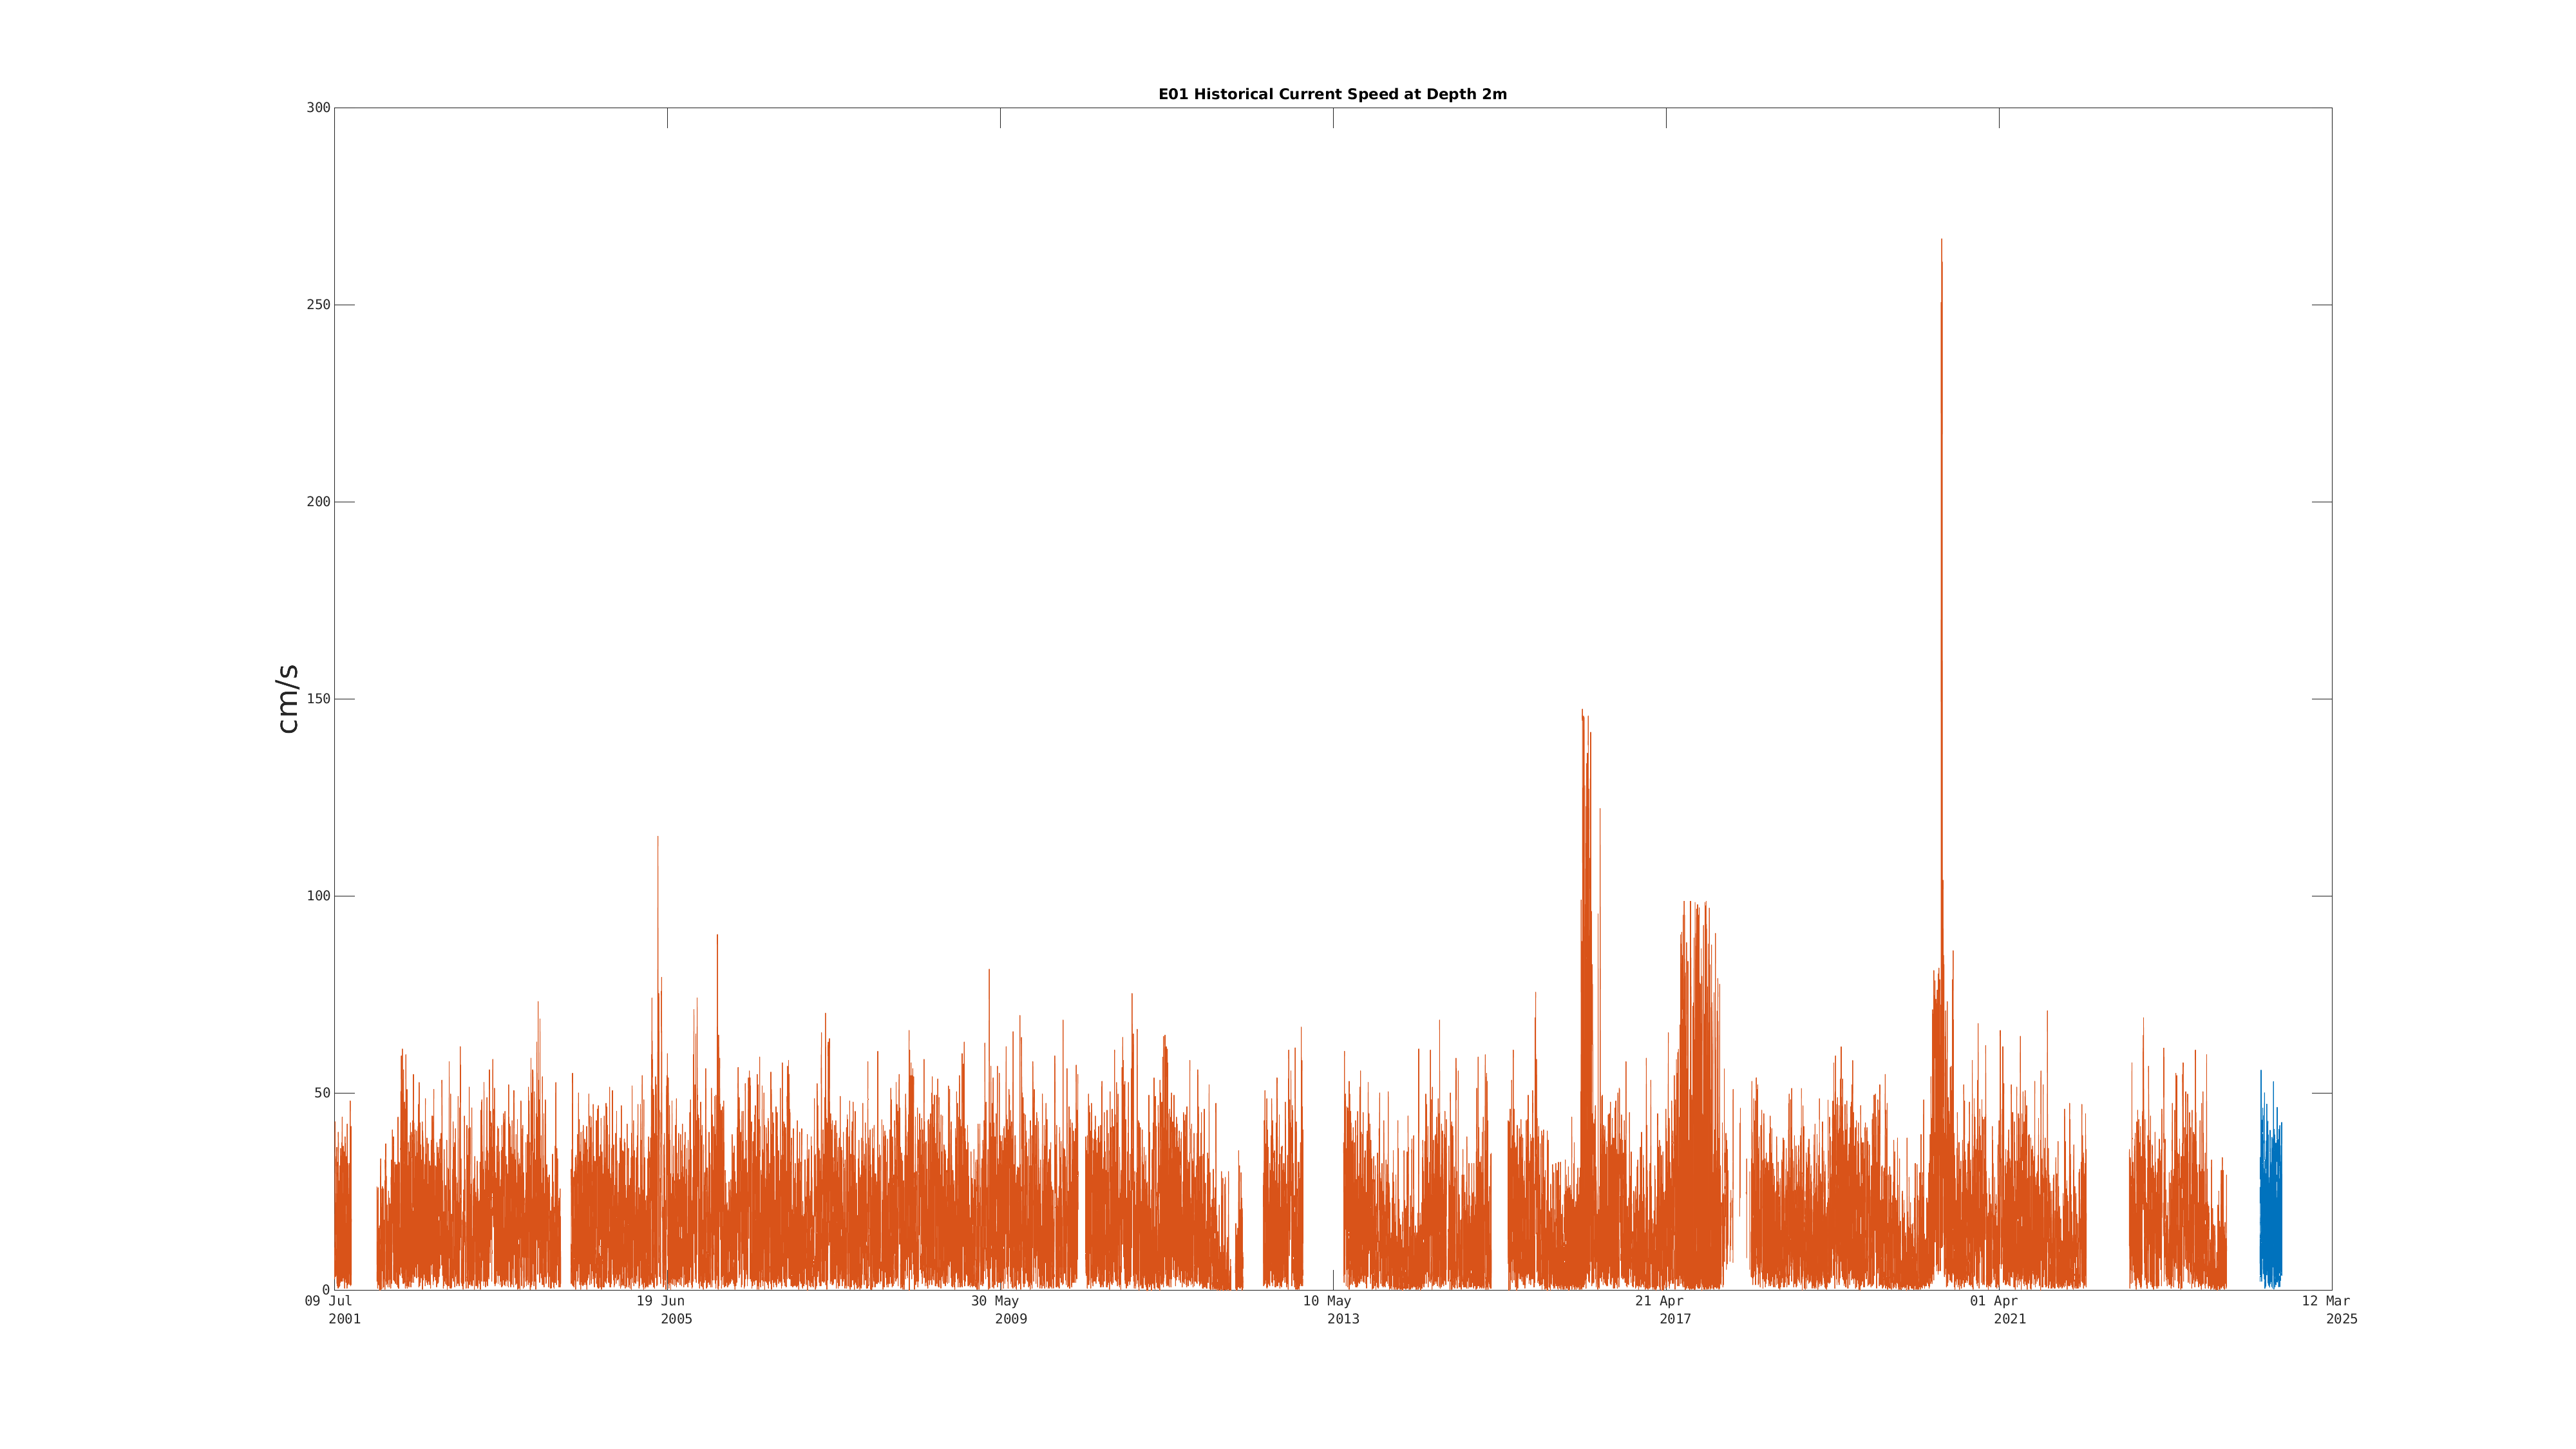
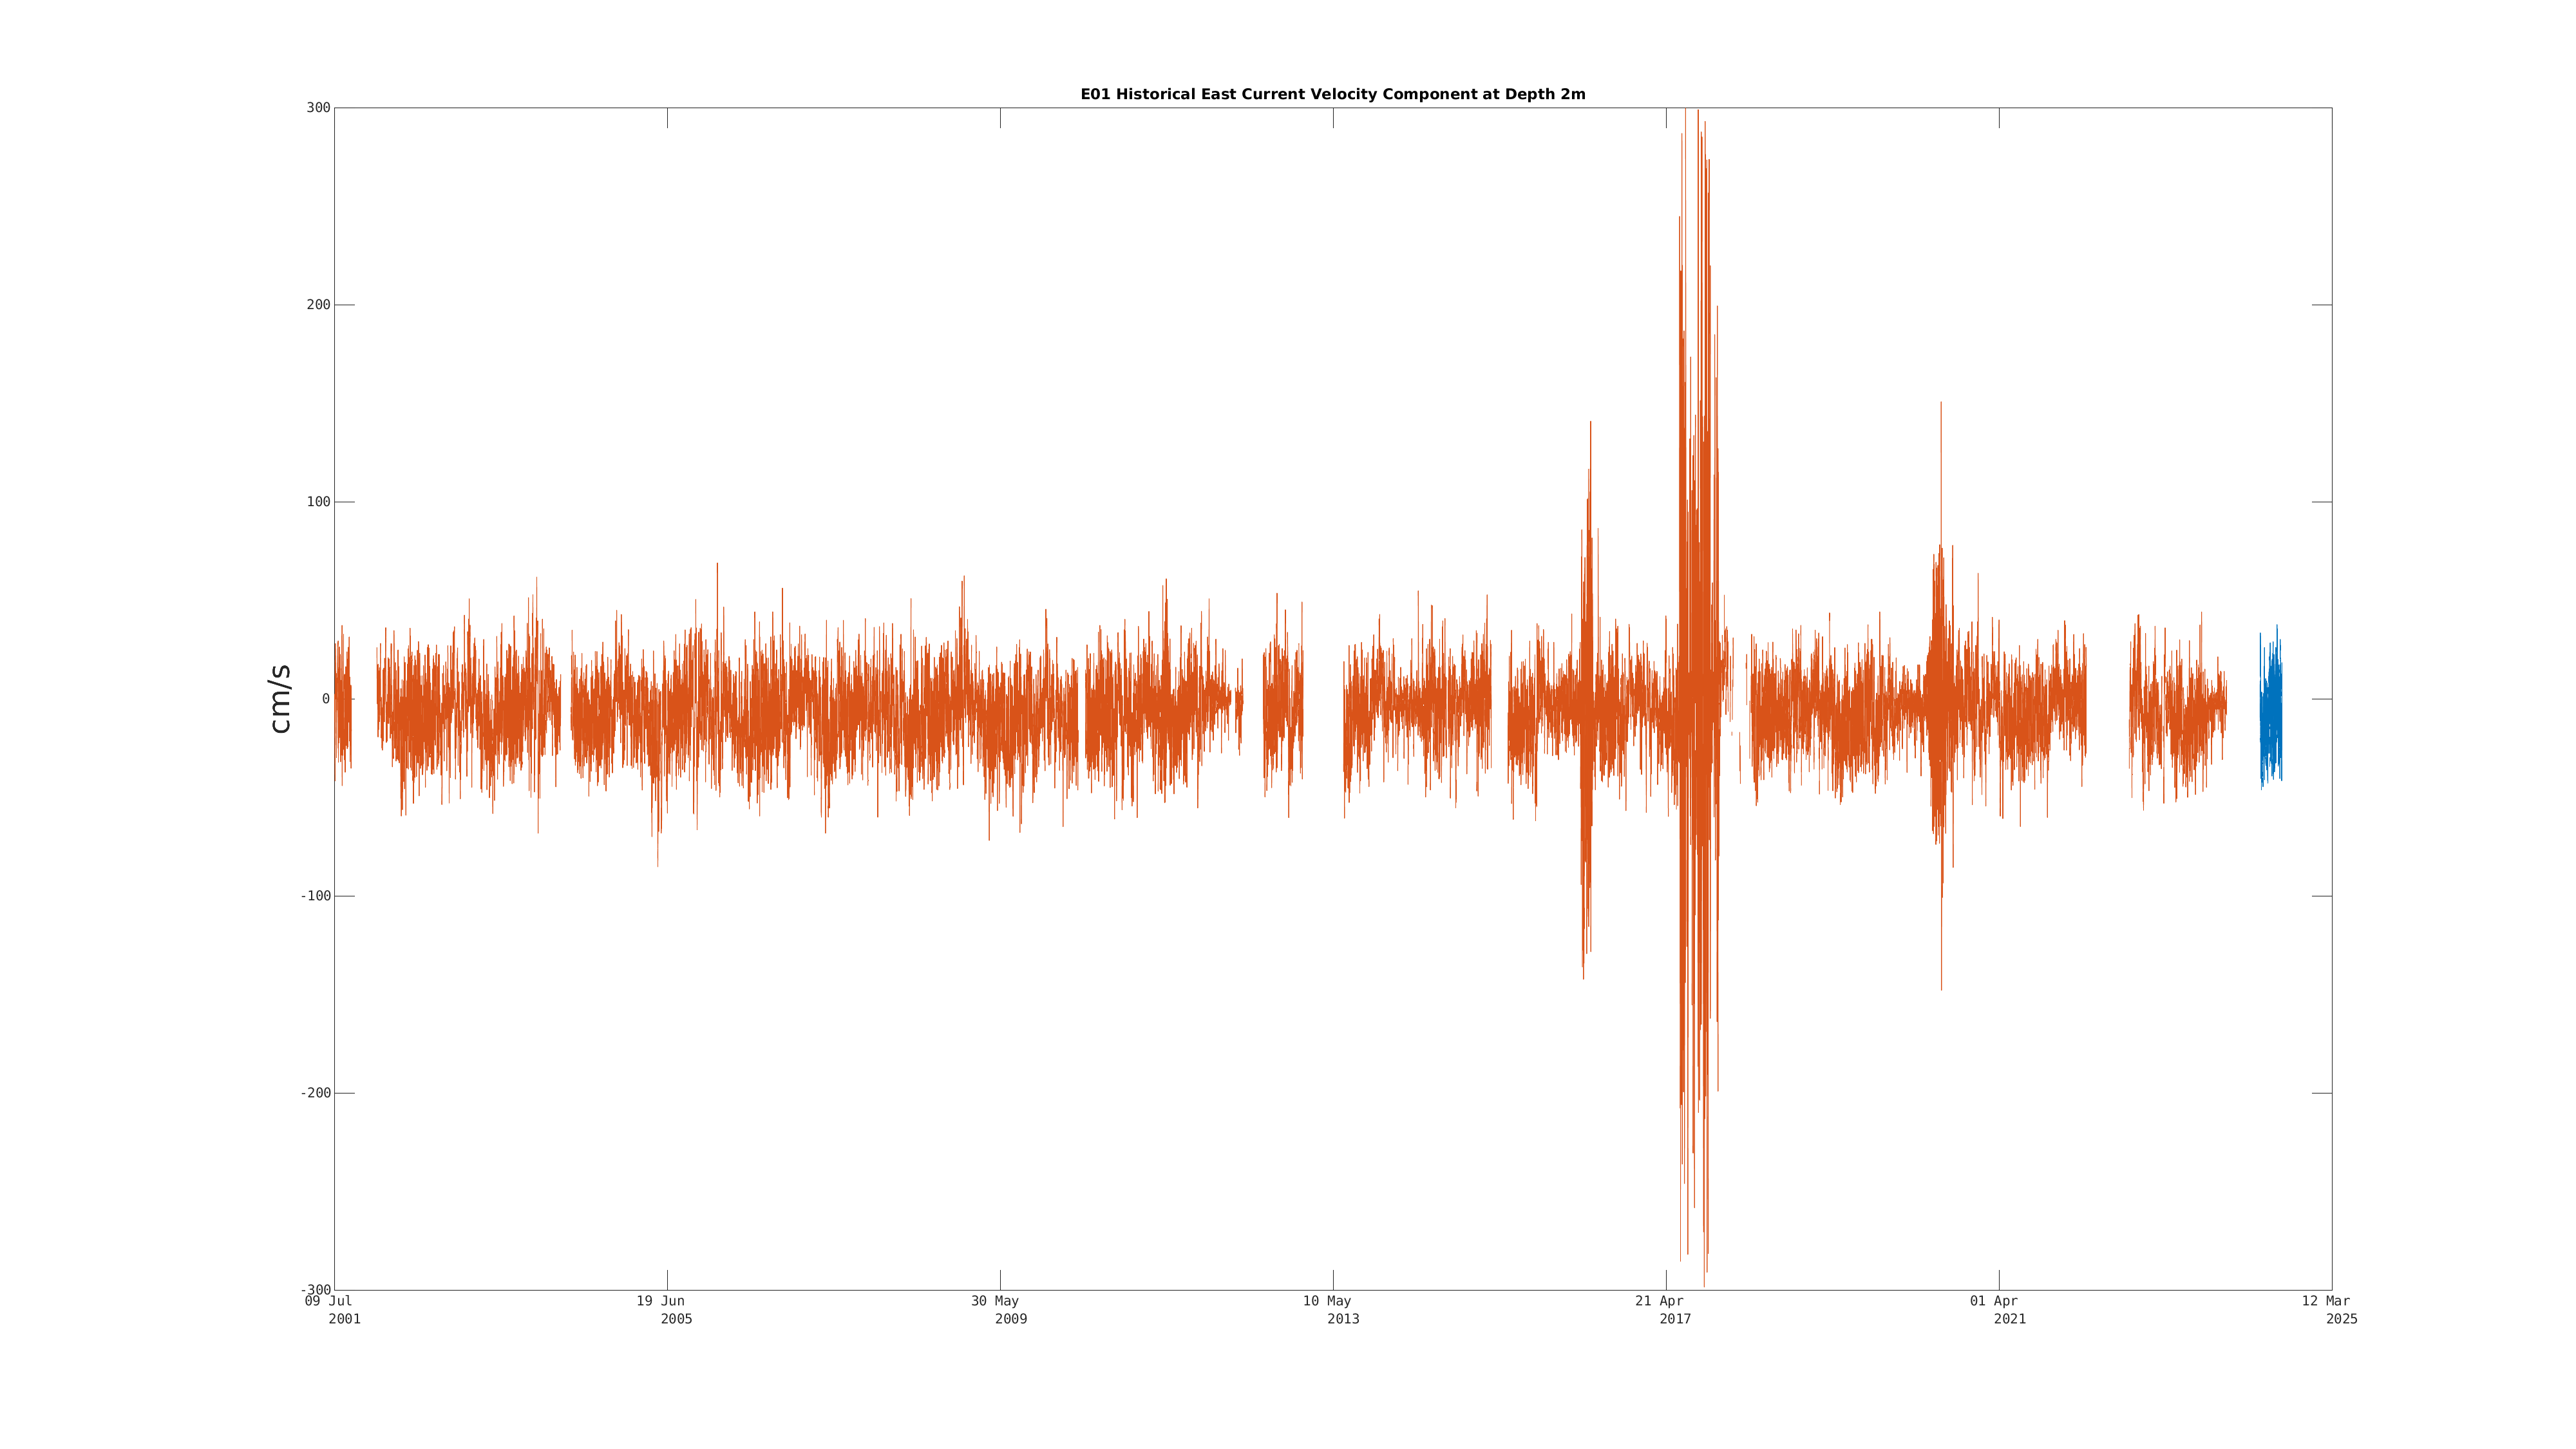
Full Historical Plot |
Make My Own |
|---|---|---|---|---|---|---|
| Significant Wave Height (0m) | Sensor Failure | Dec 21 9:00 PM |
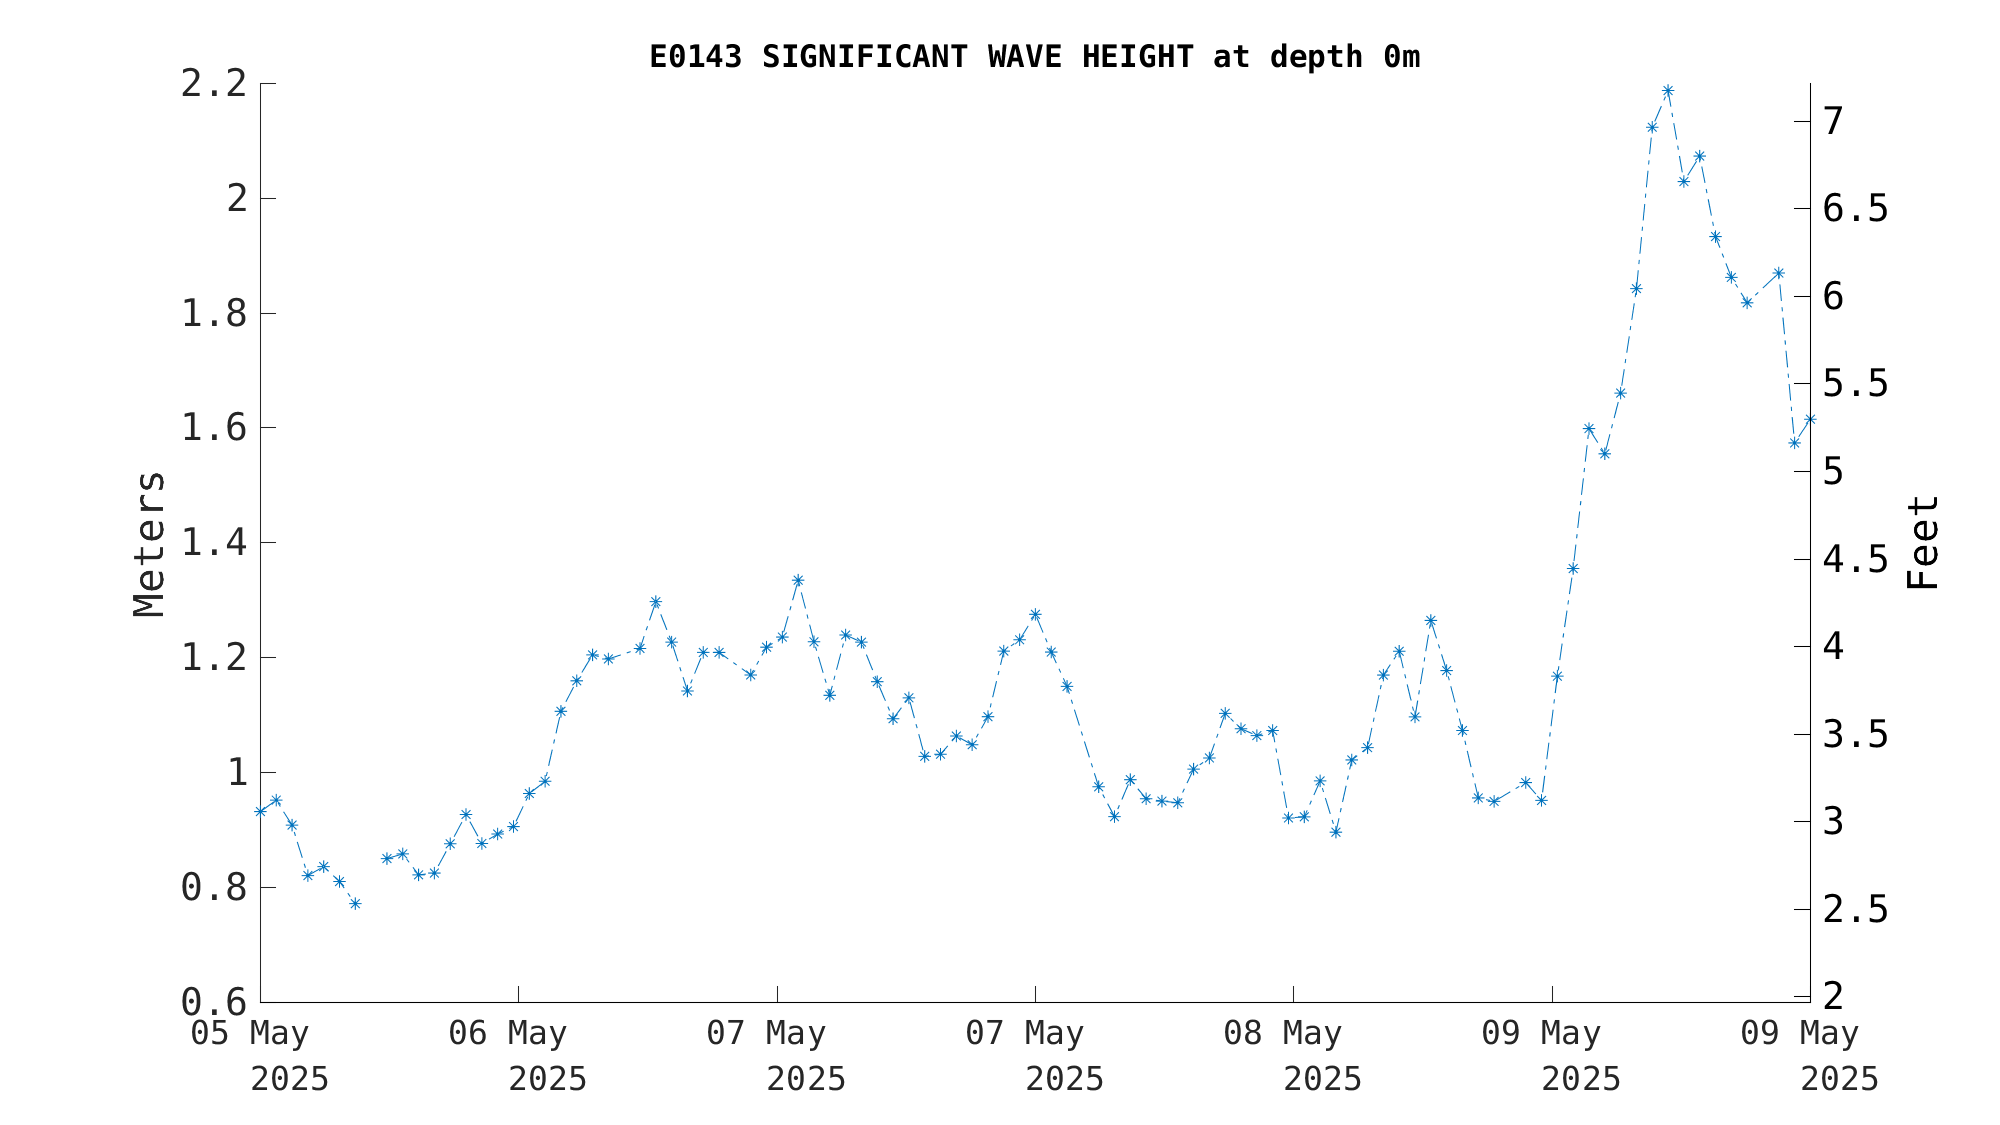
|
|
|

|
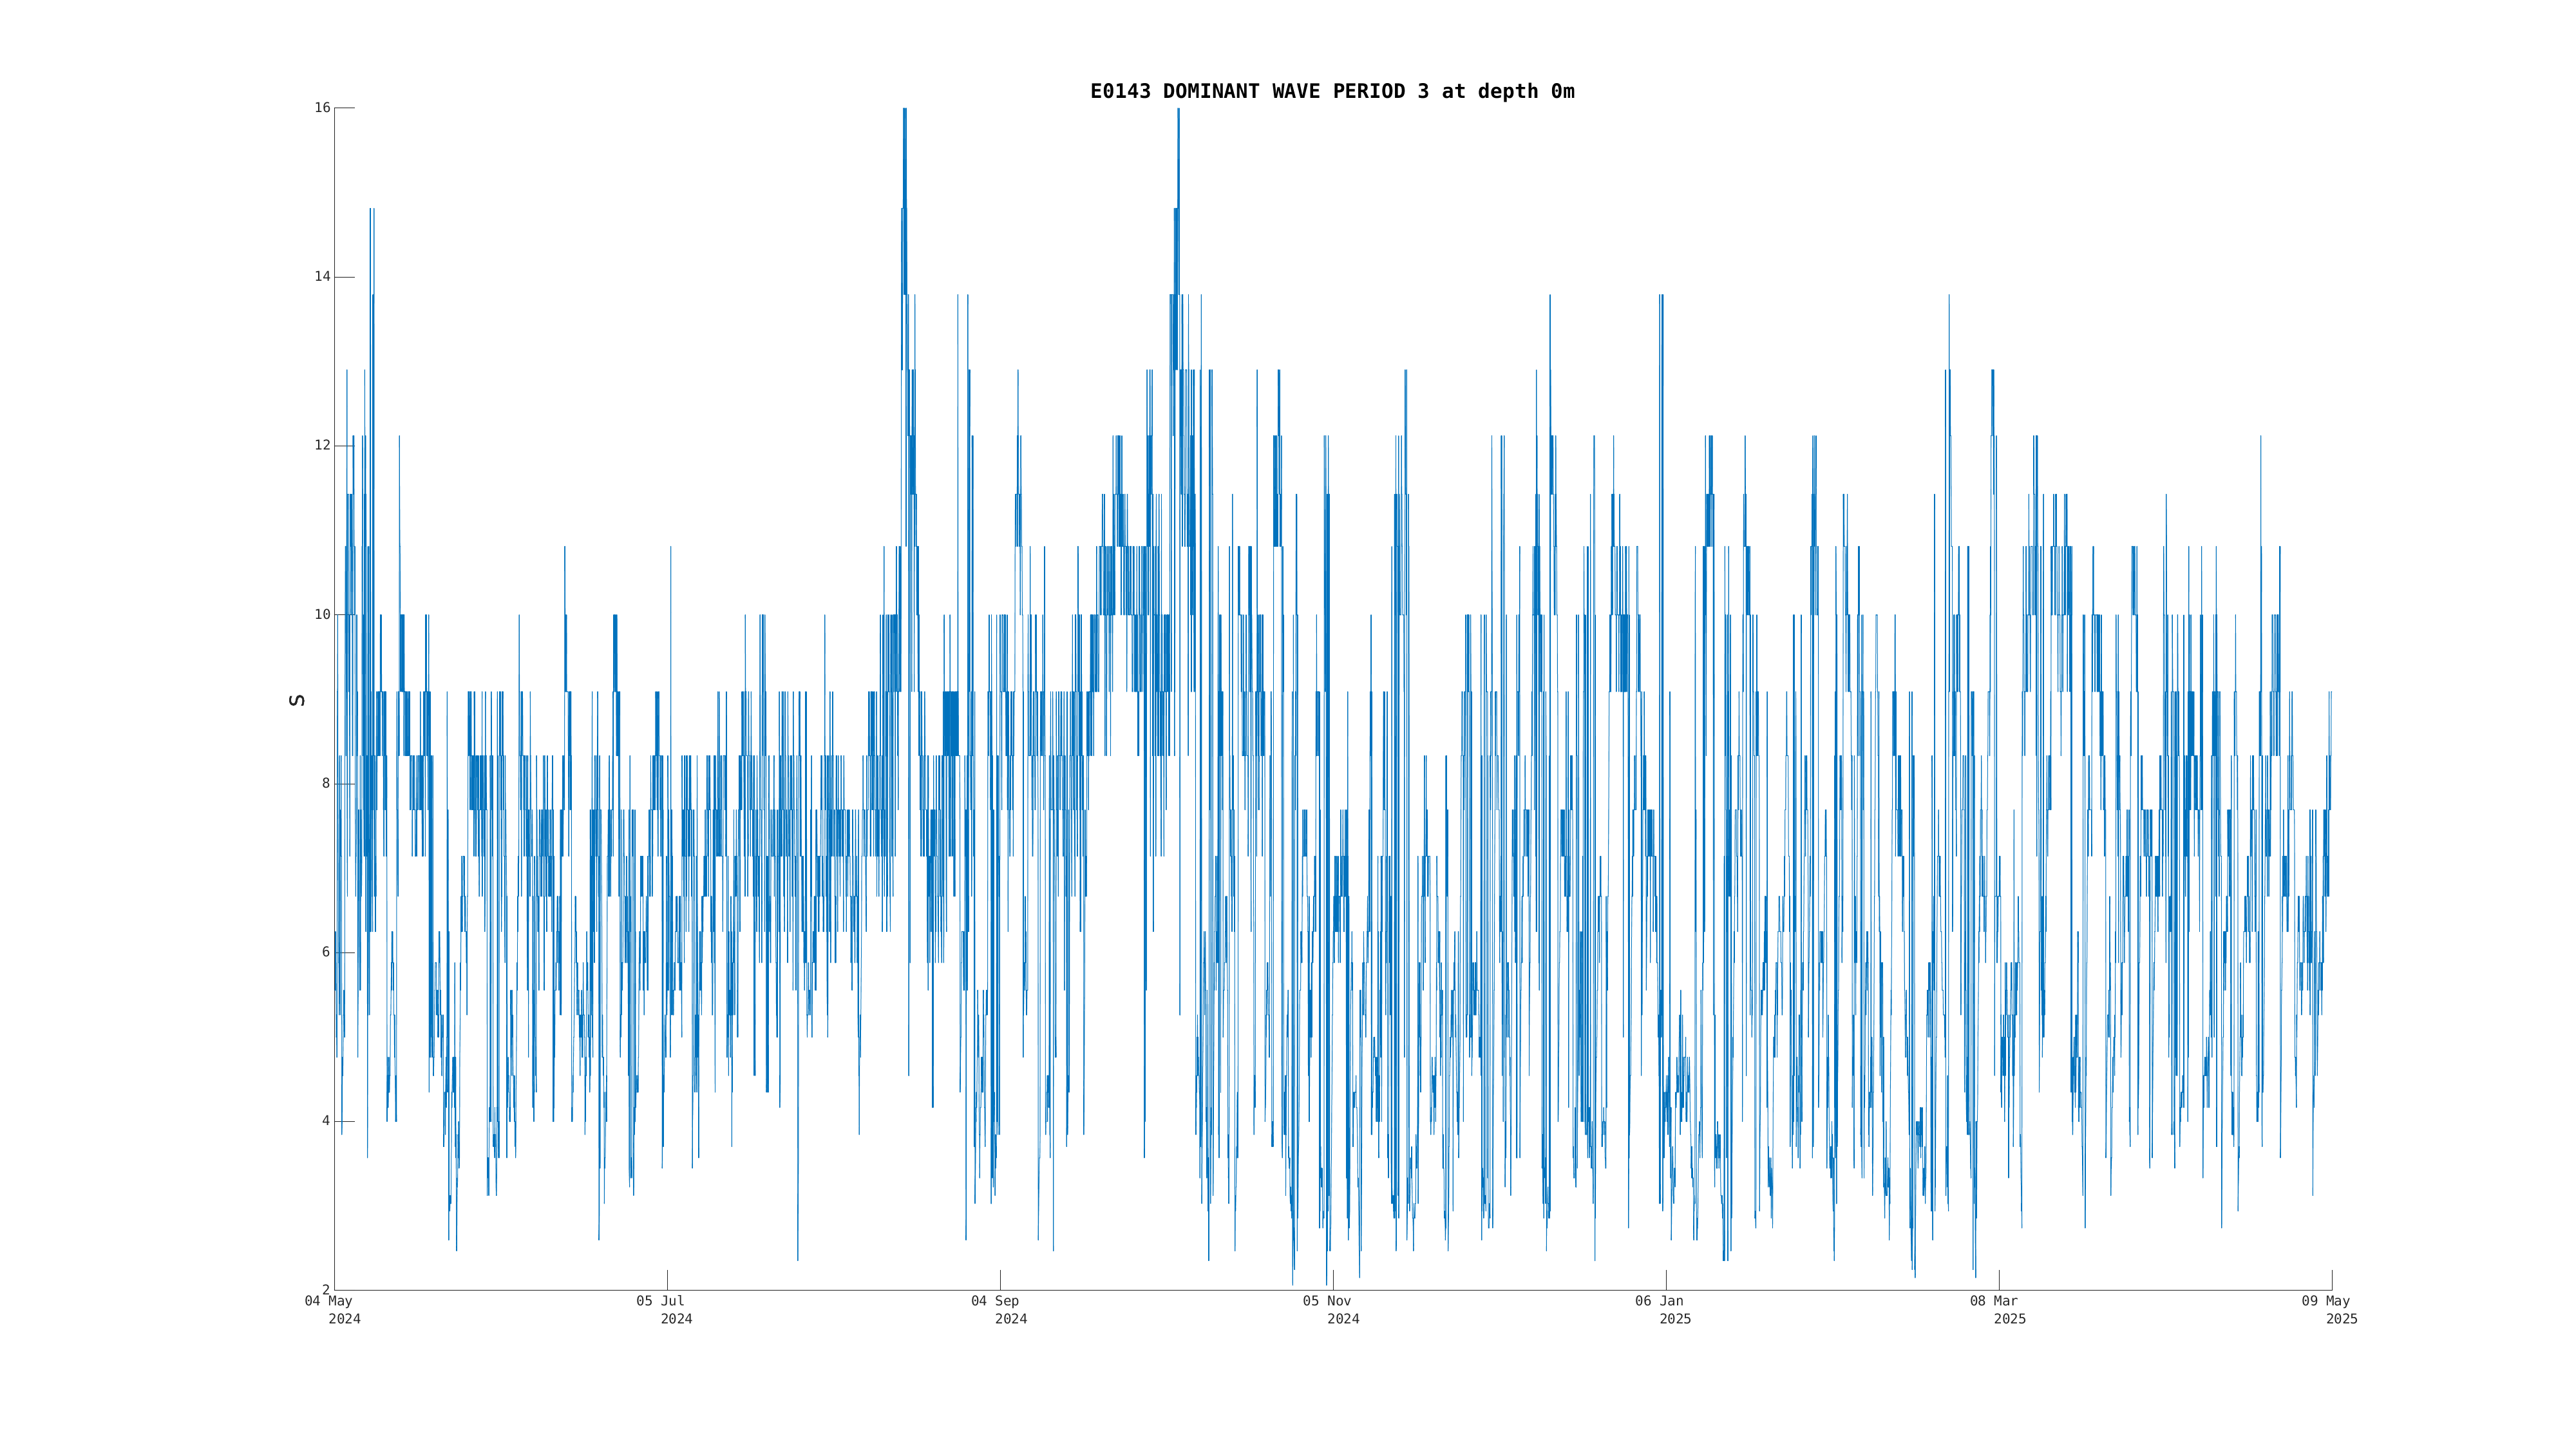
| Dominant Wave Period (0m) | Sensor Failure | Dec 21 9:00 PM |
|
|
|
|
| Significant Wave Height (test) (0m) | Sensor Failure | Dec 21 9:00 PM |
|
|
|
|
| Dominant Wave Period (test) (0m) | Sensor Failure | Dec 21 9:00 PM |
|
|
|
|
| Mean Wave Direction (test) (0m) | Sensor Failure | Dec 21 9:00 PM |
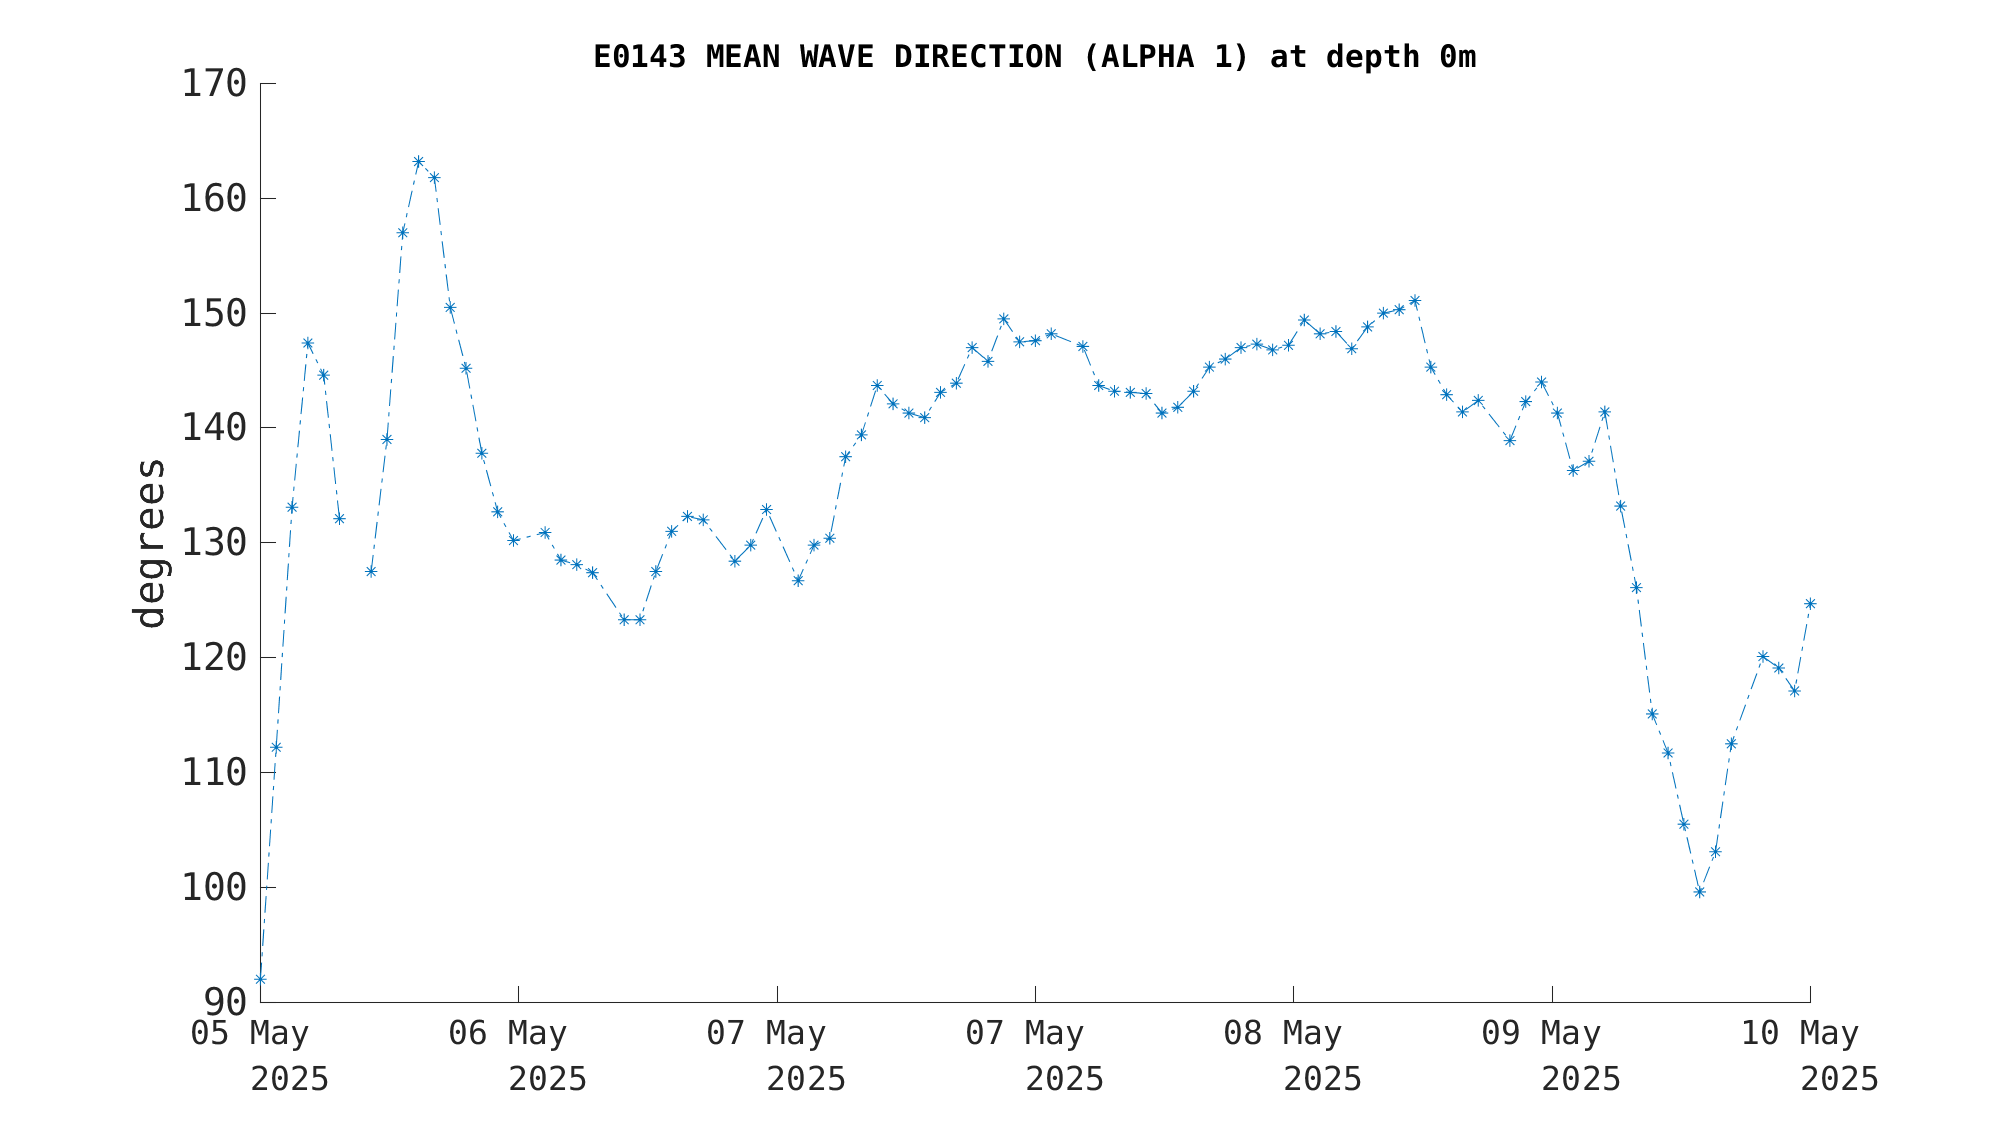
|
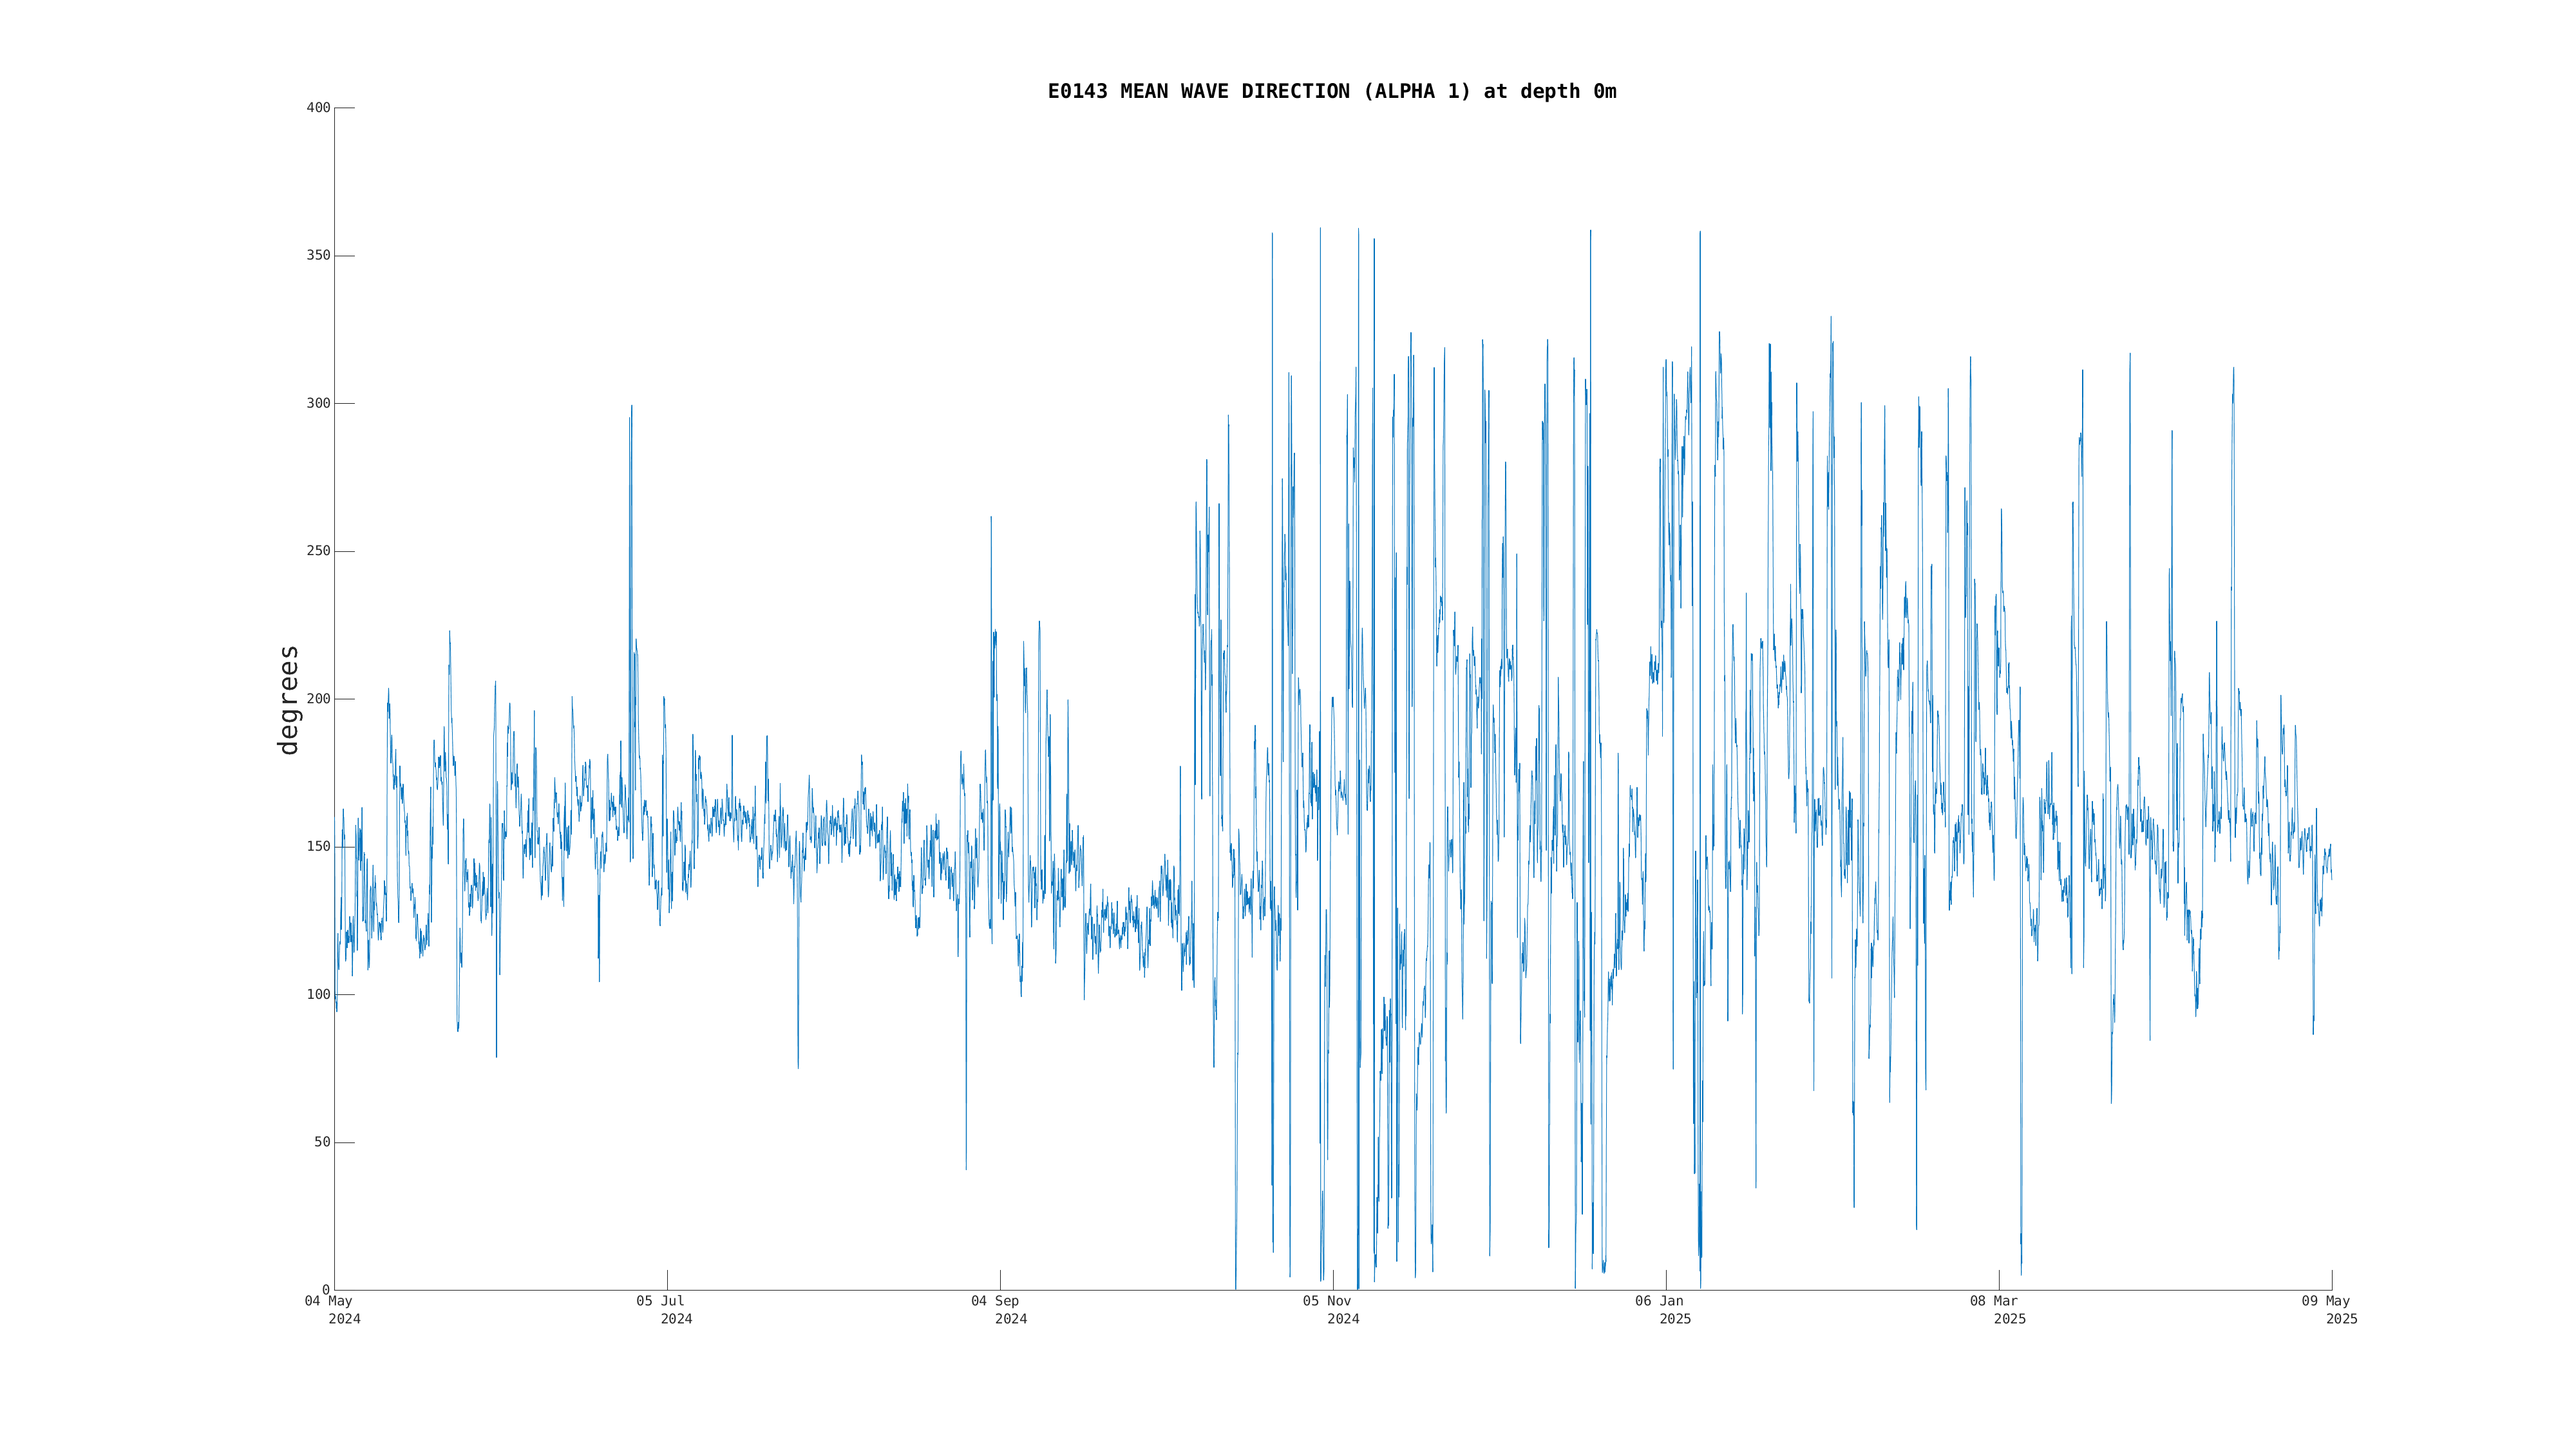
|
|
|
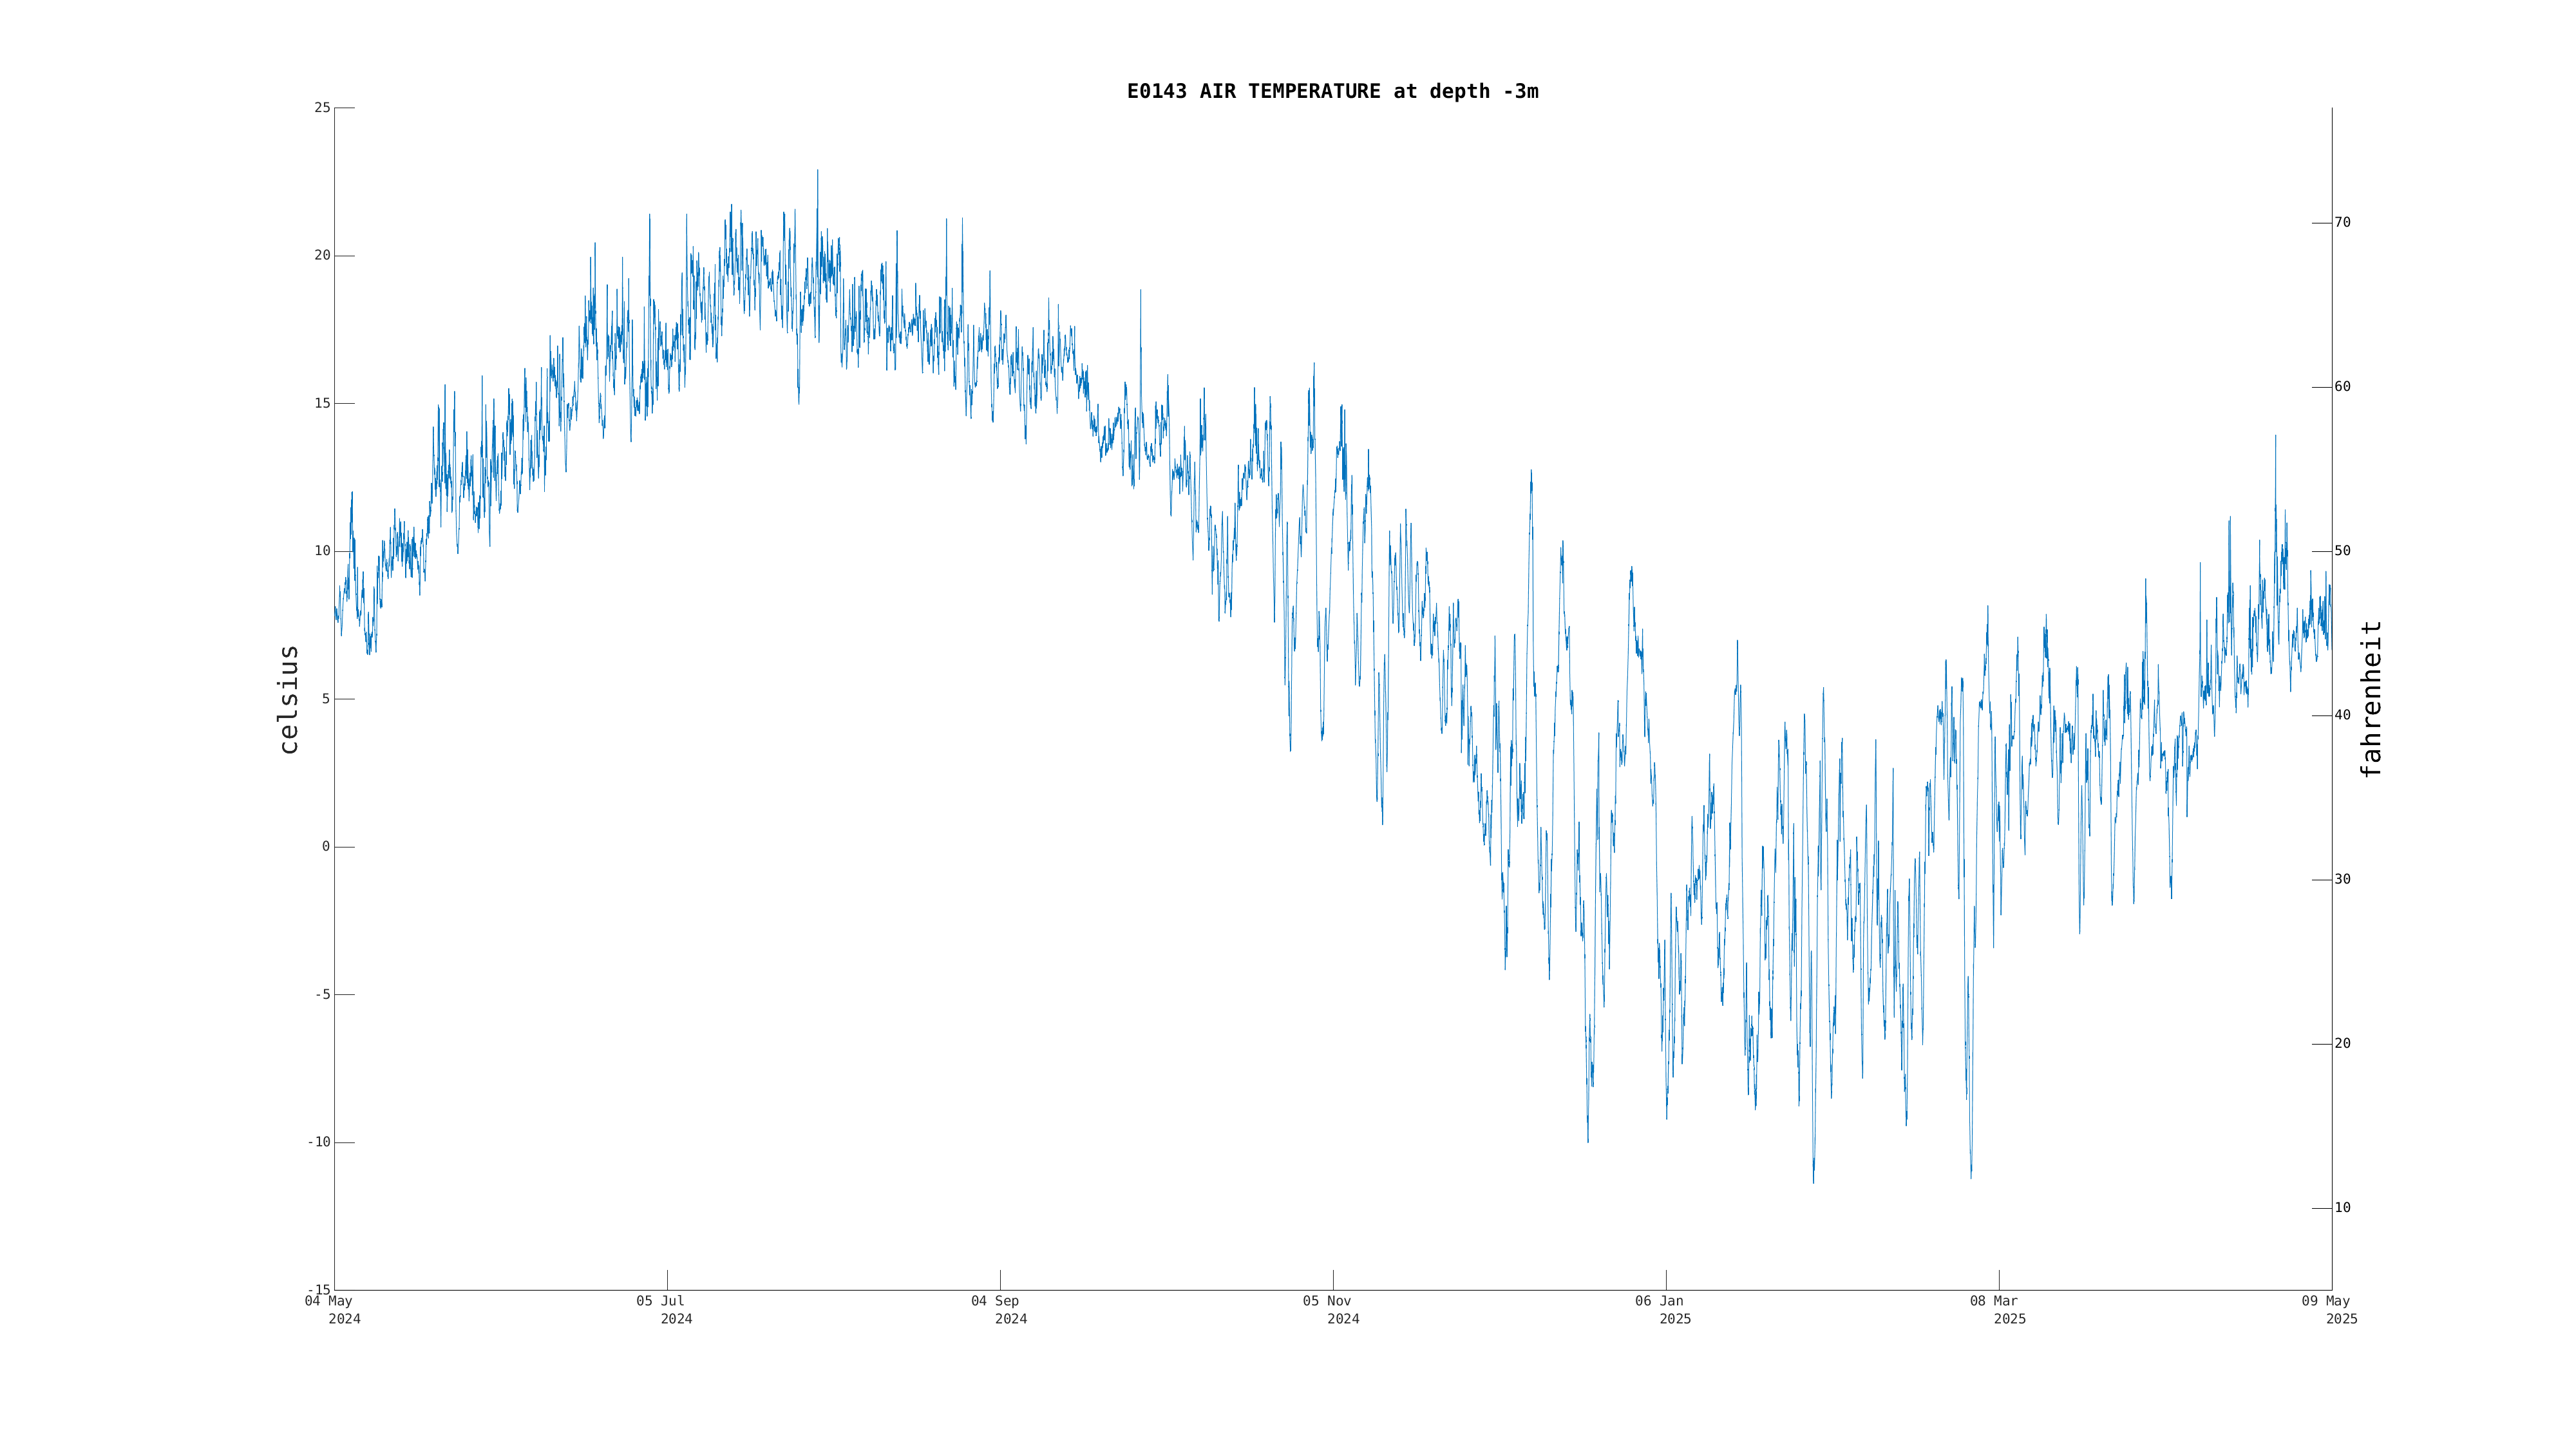
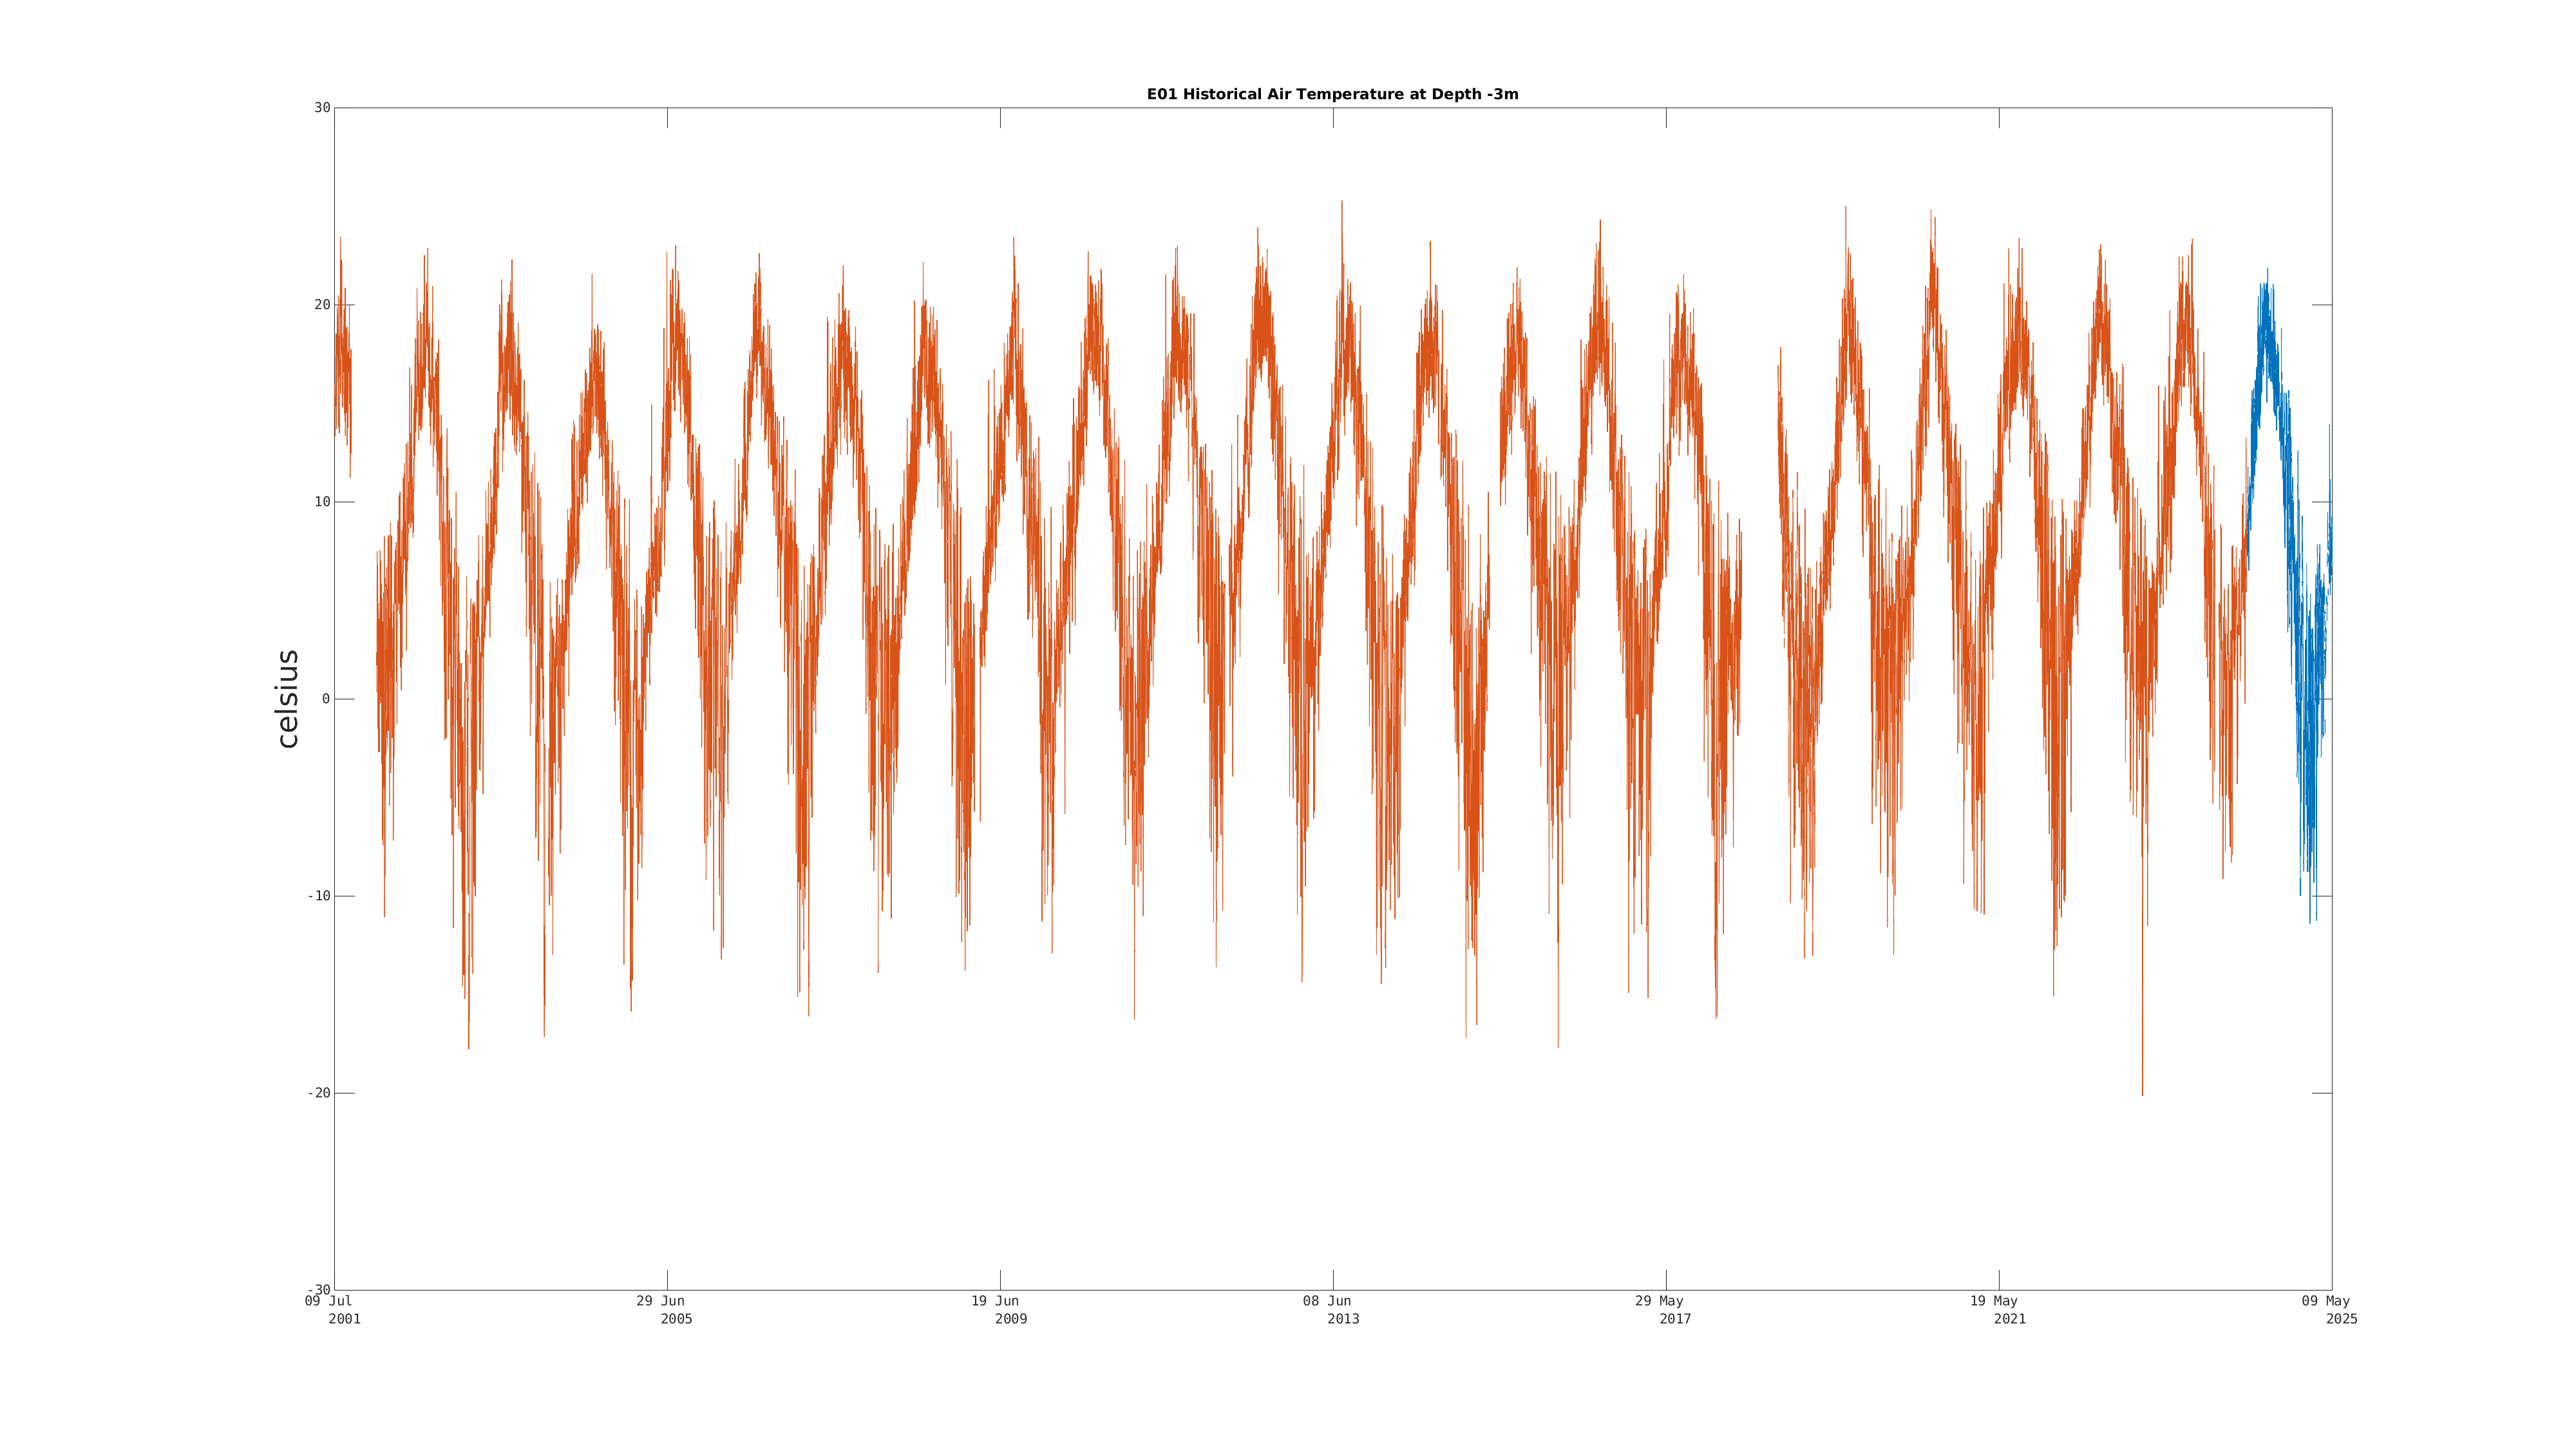
| Air Temperature (-3m) | -3.0 C (26.6 F) | Dec 21 9:00 PM |
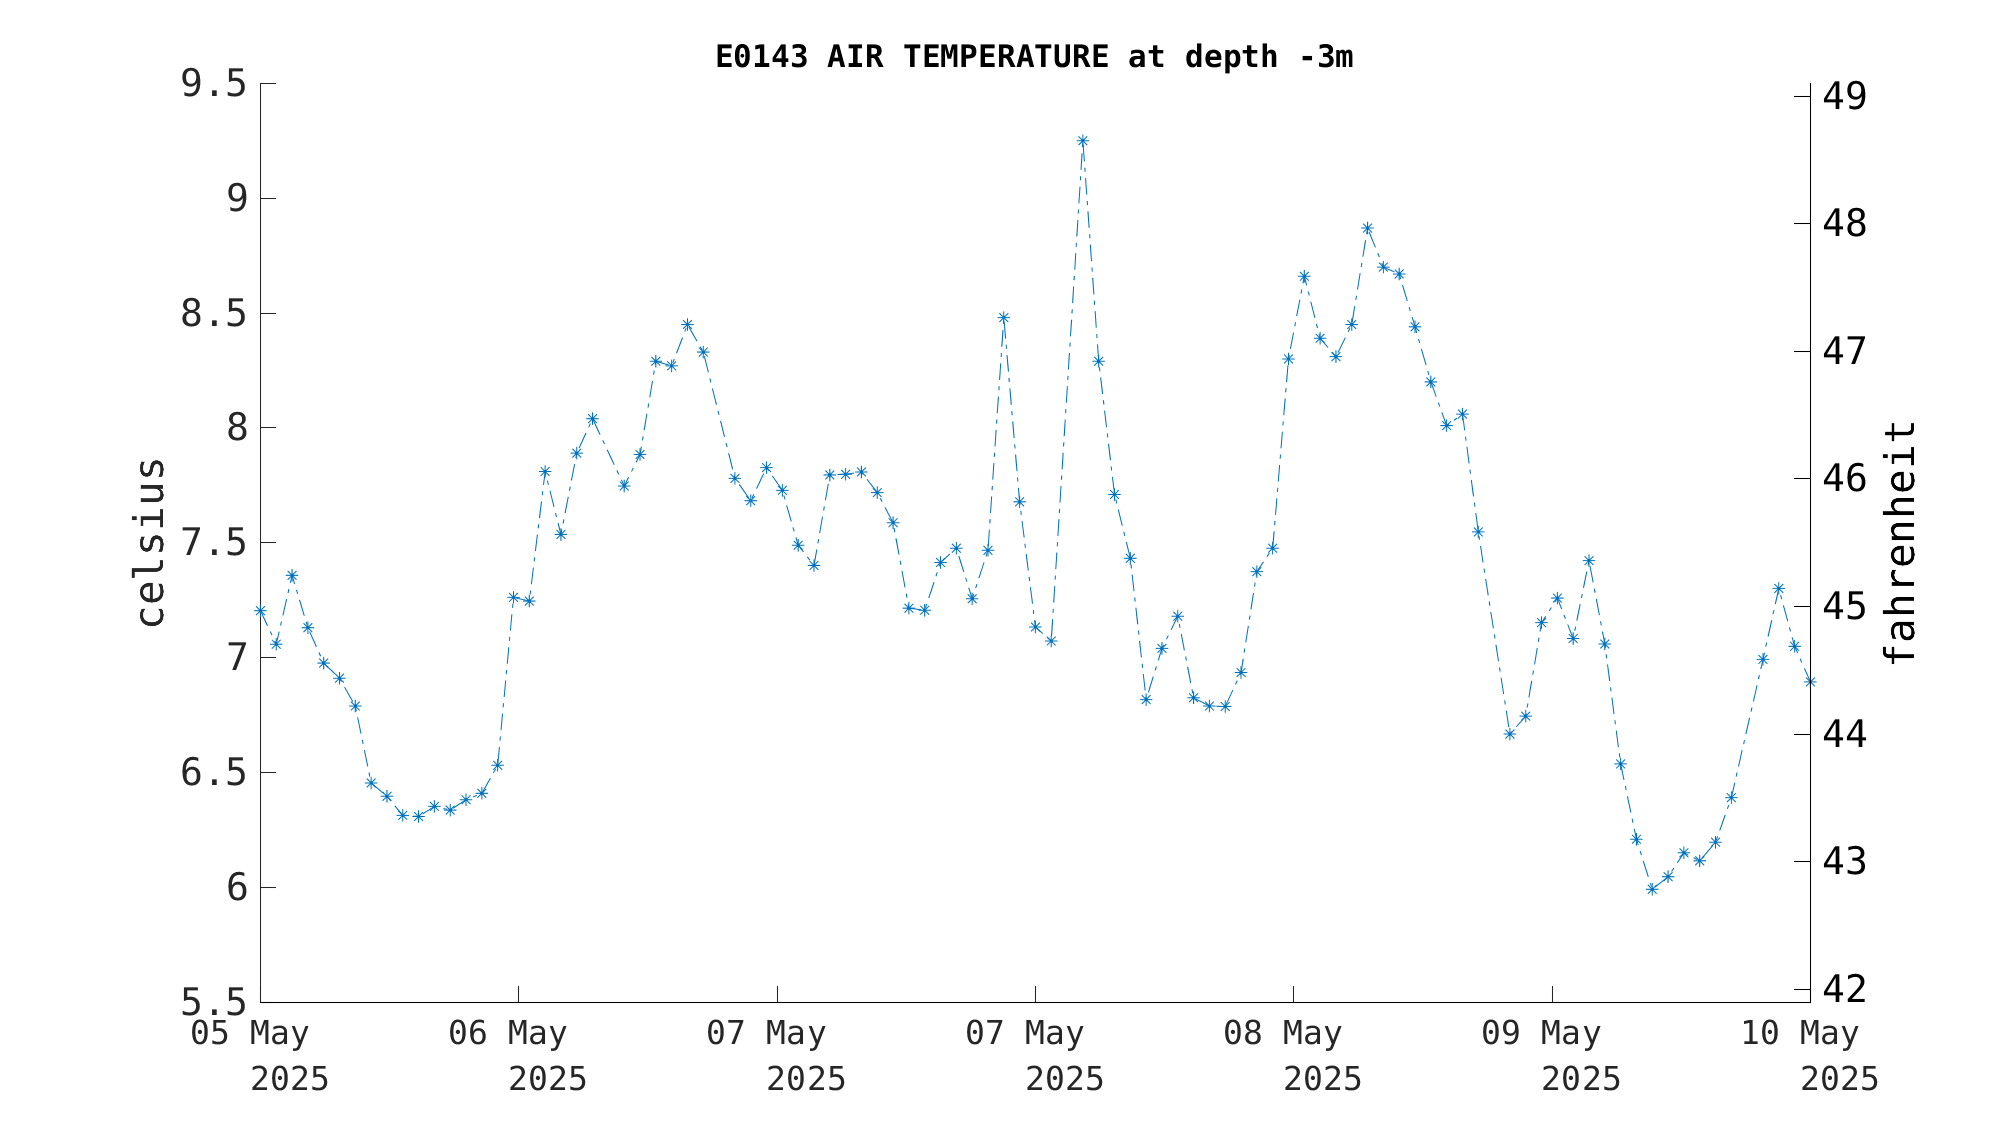
|
|
|
|
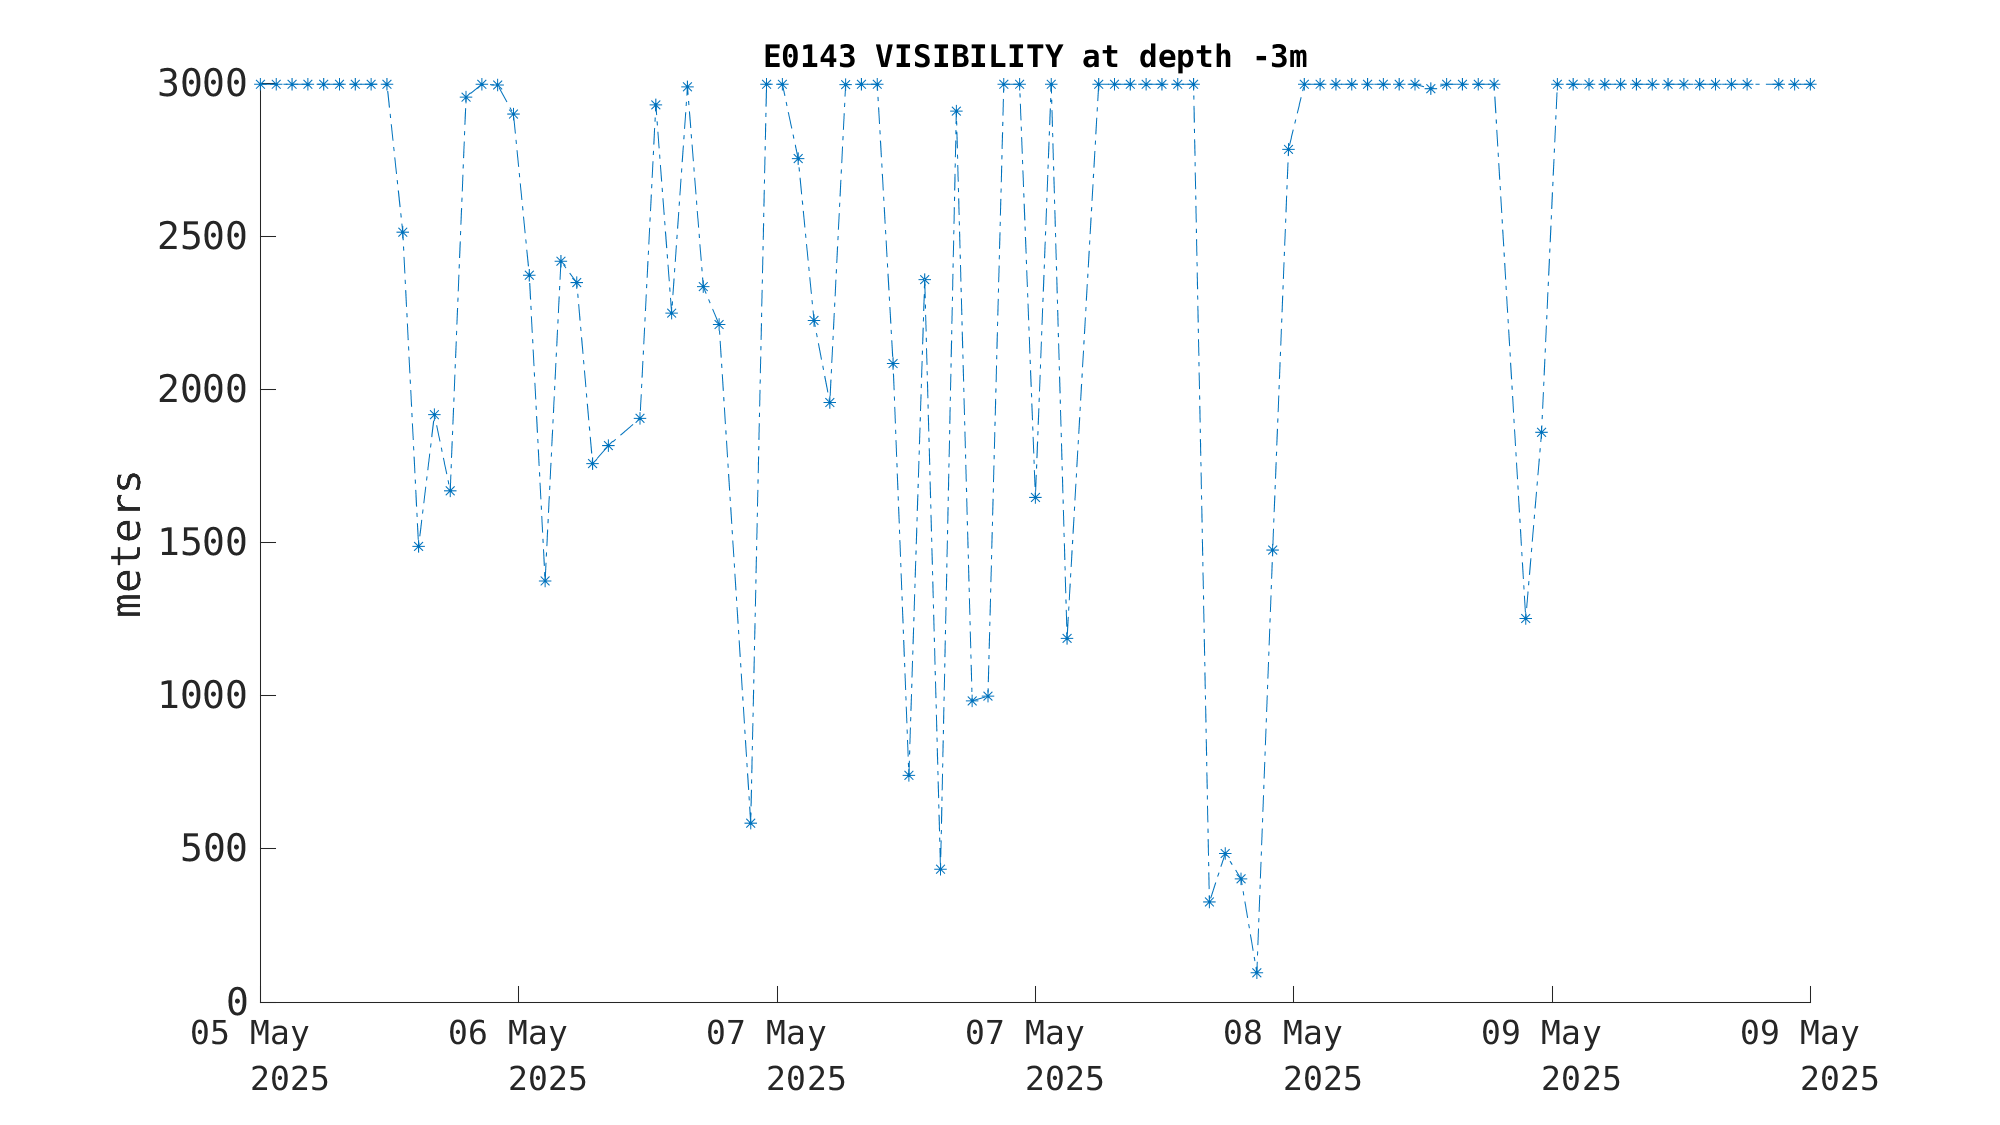
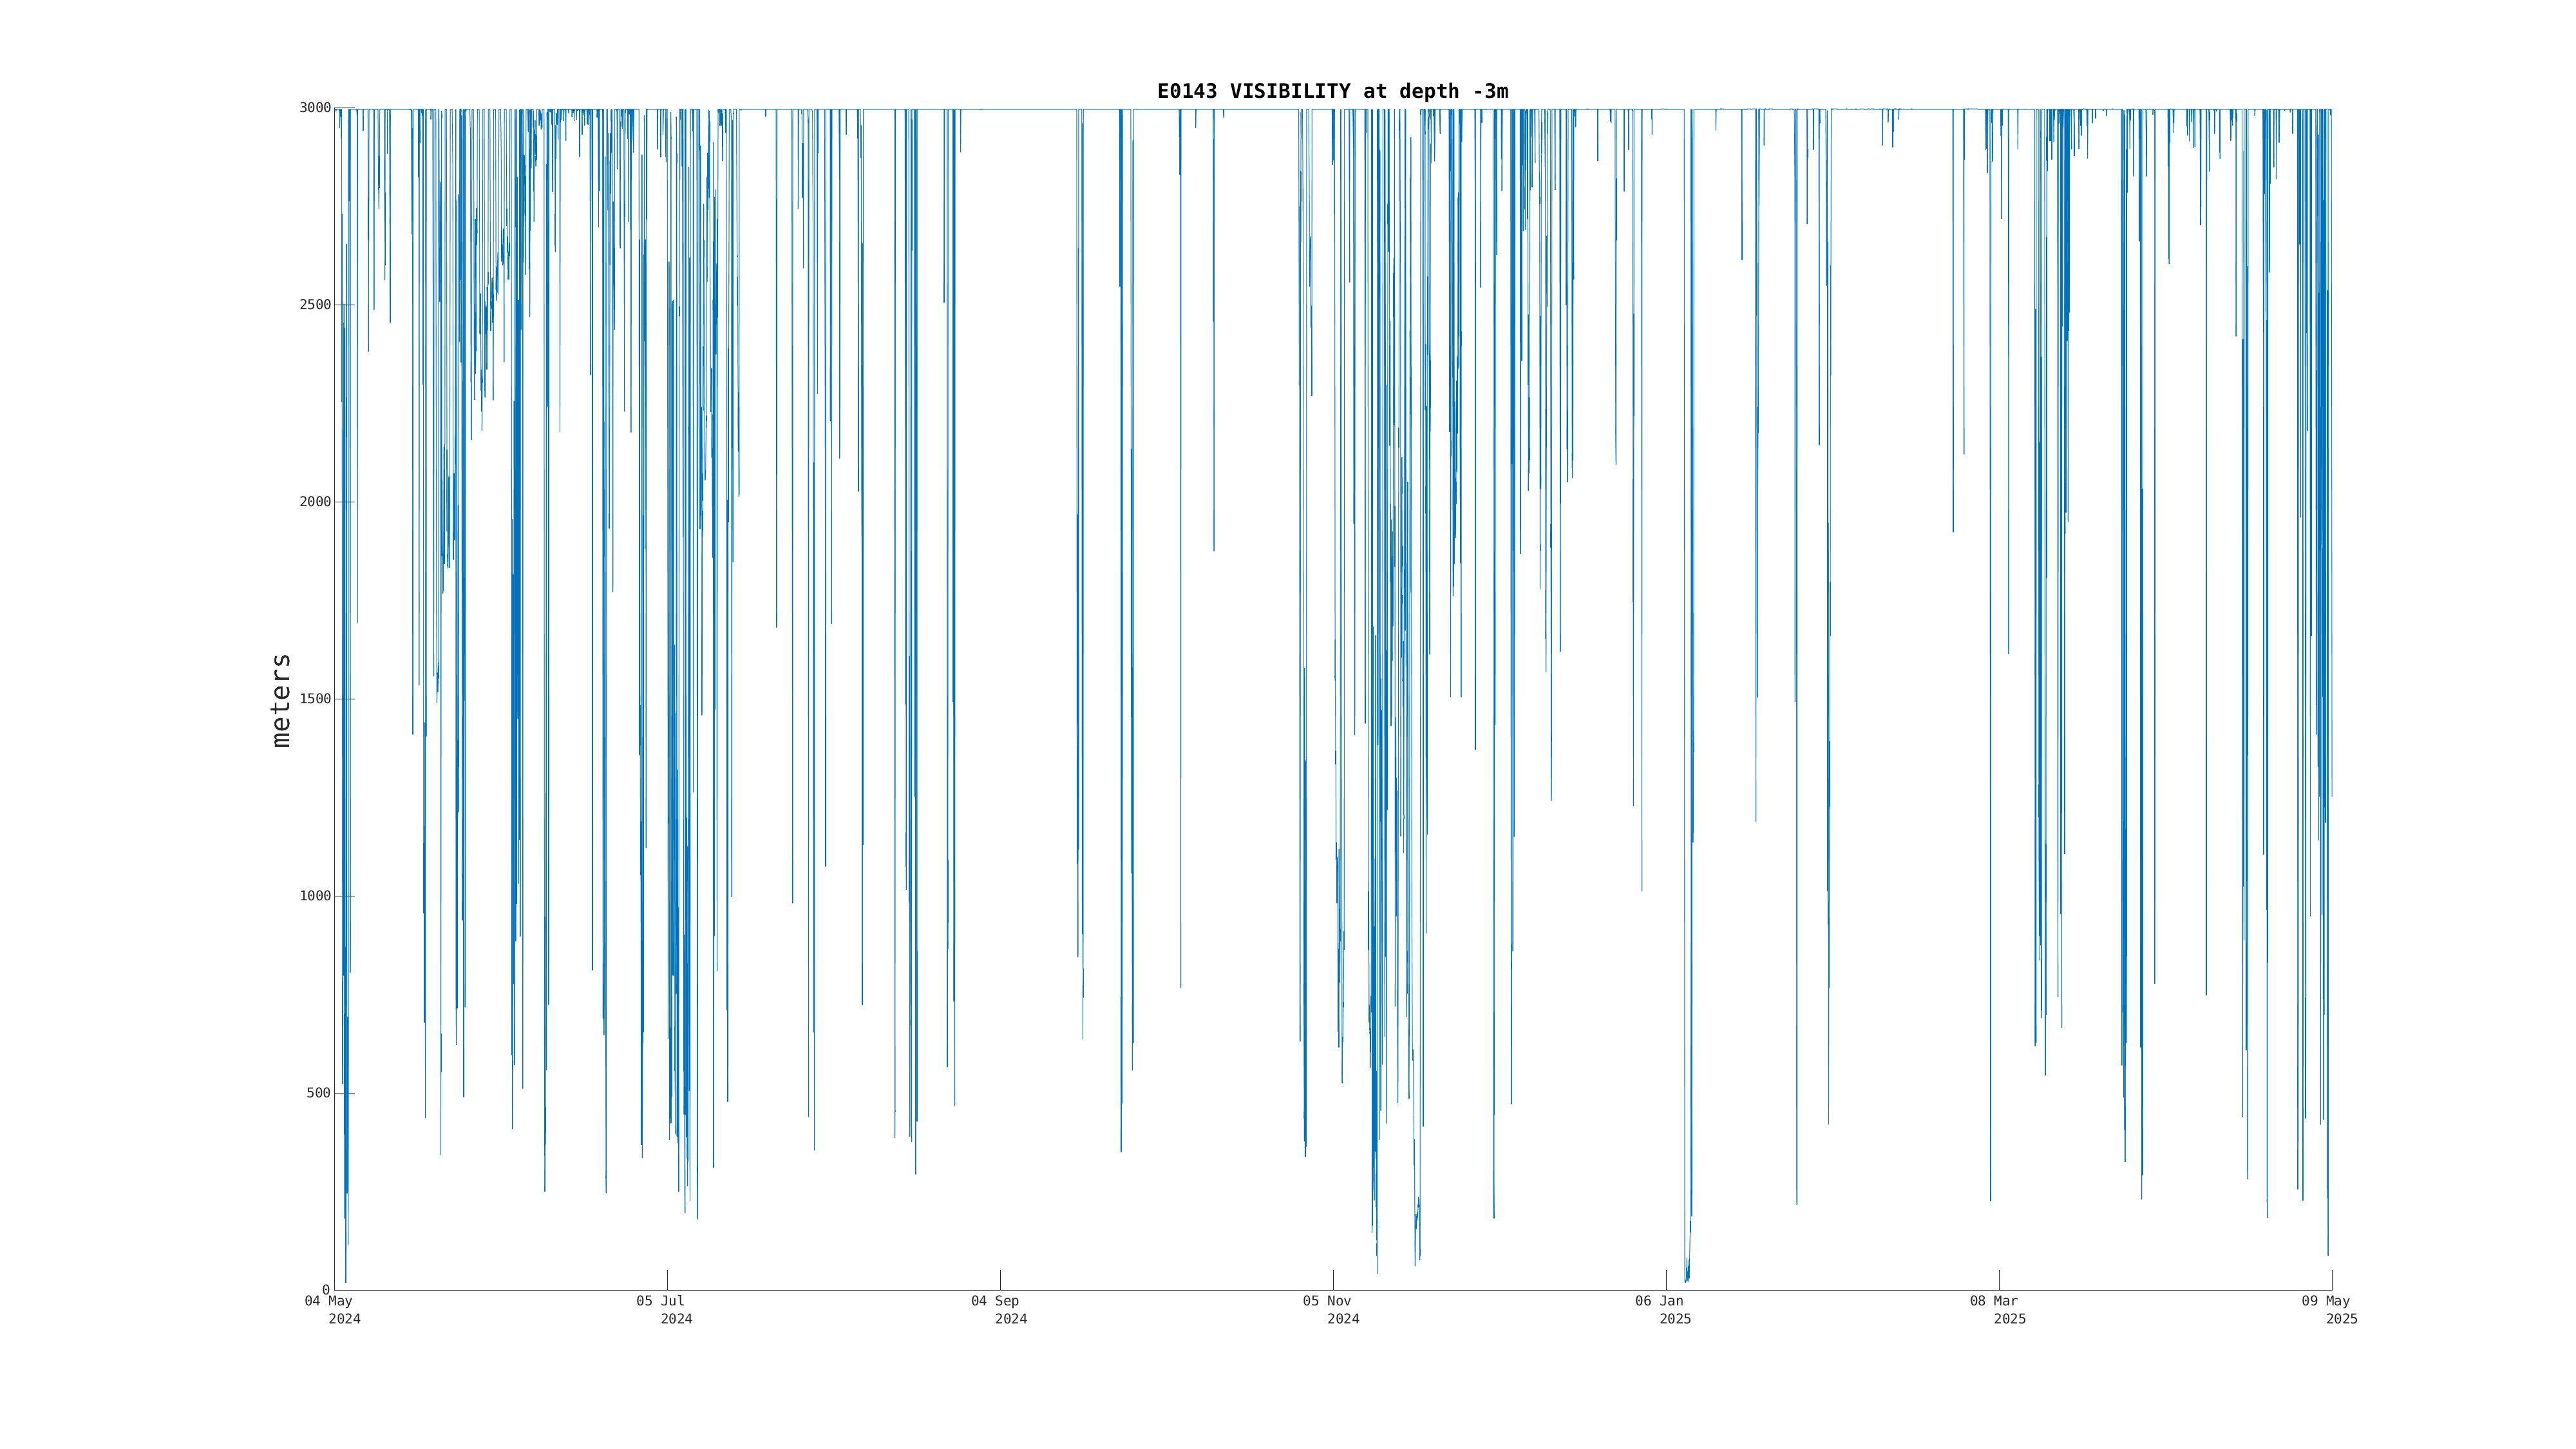
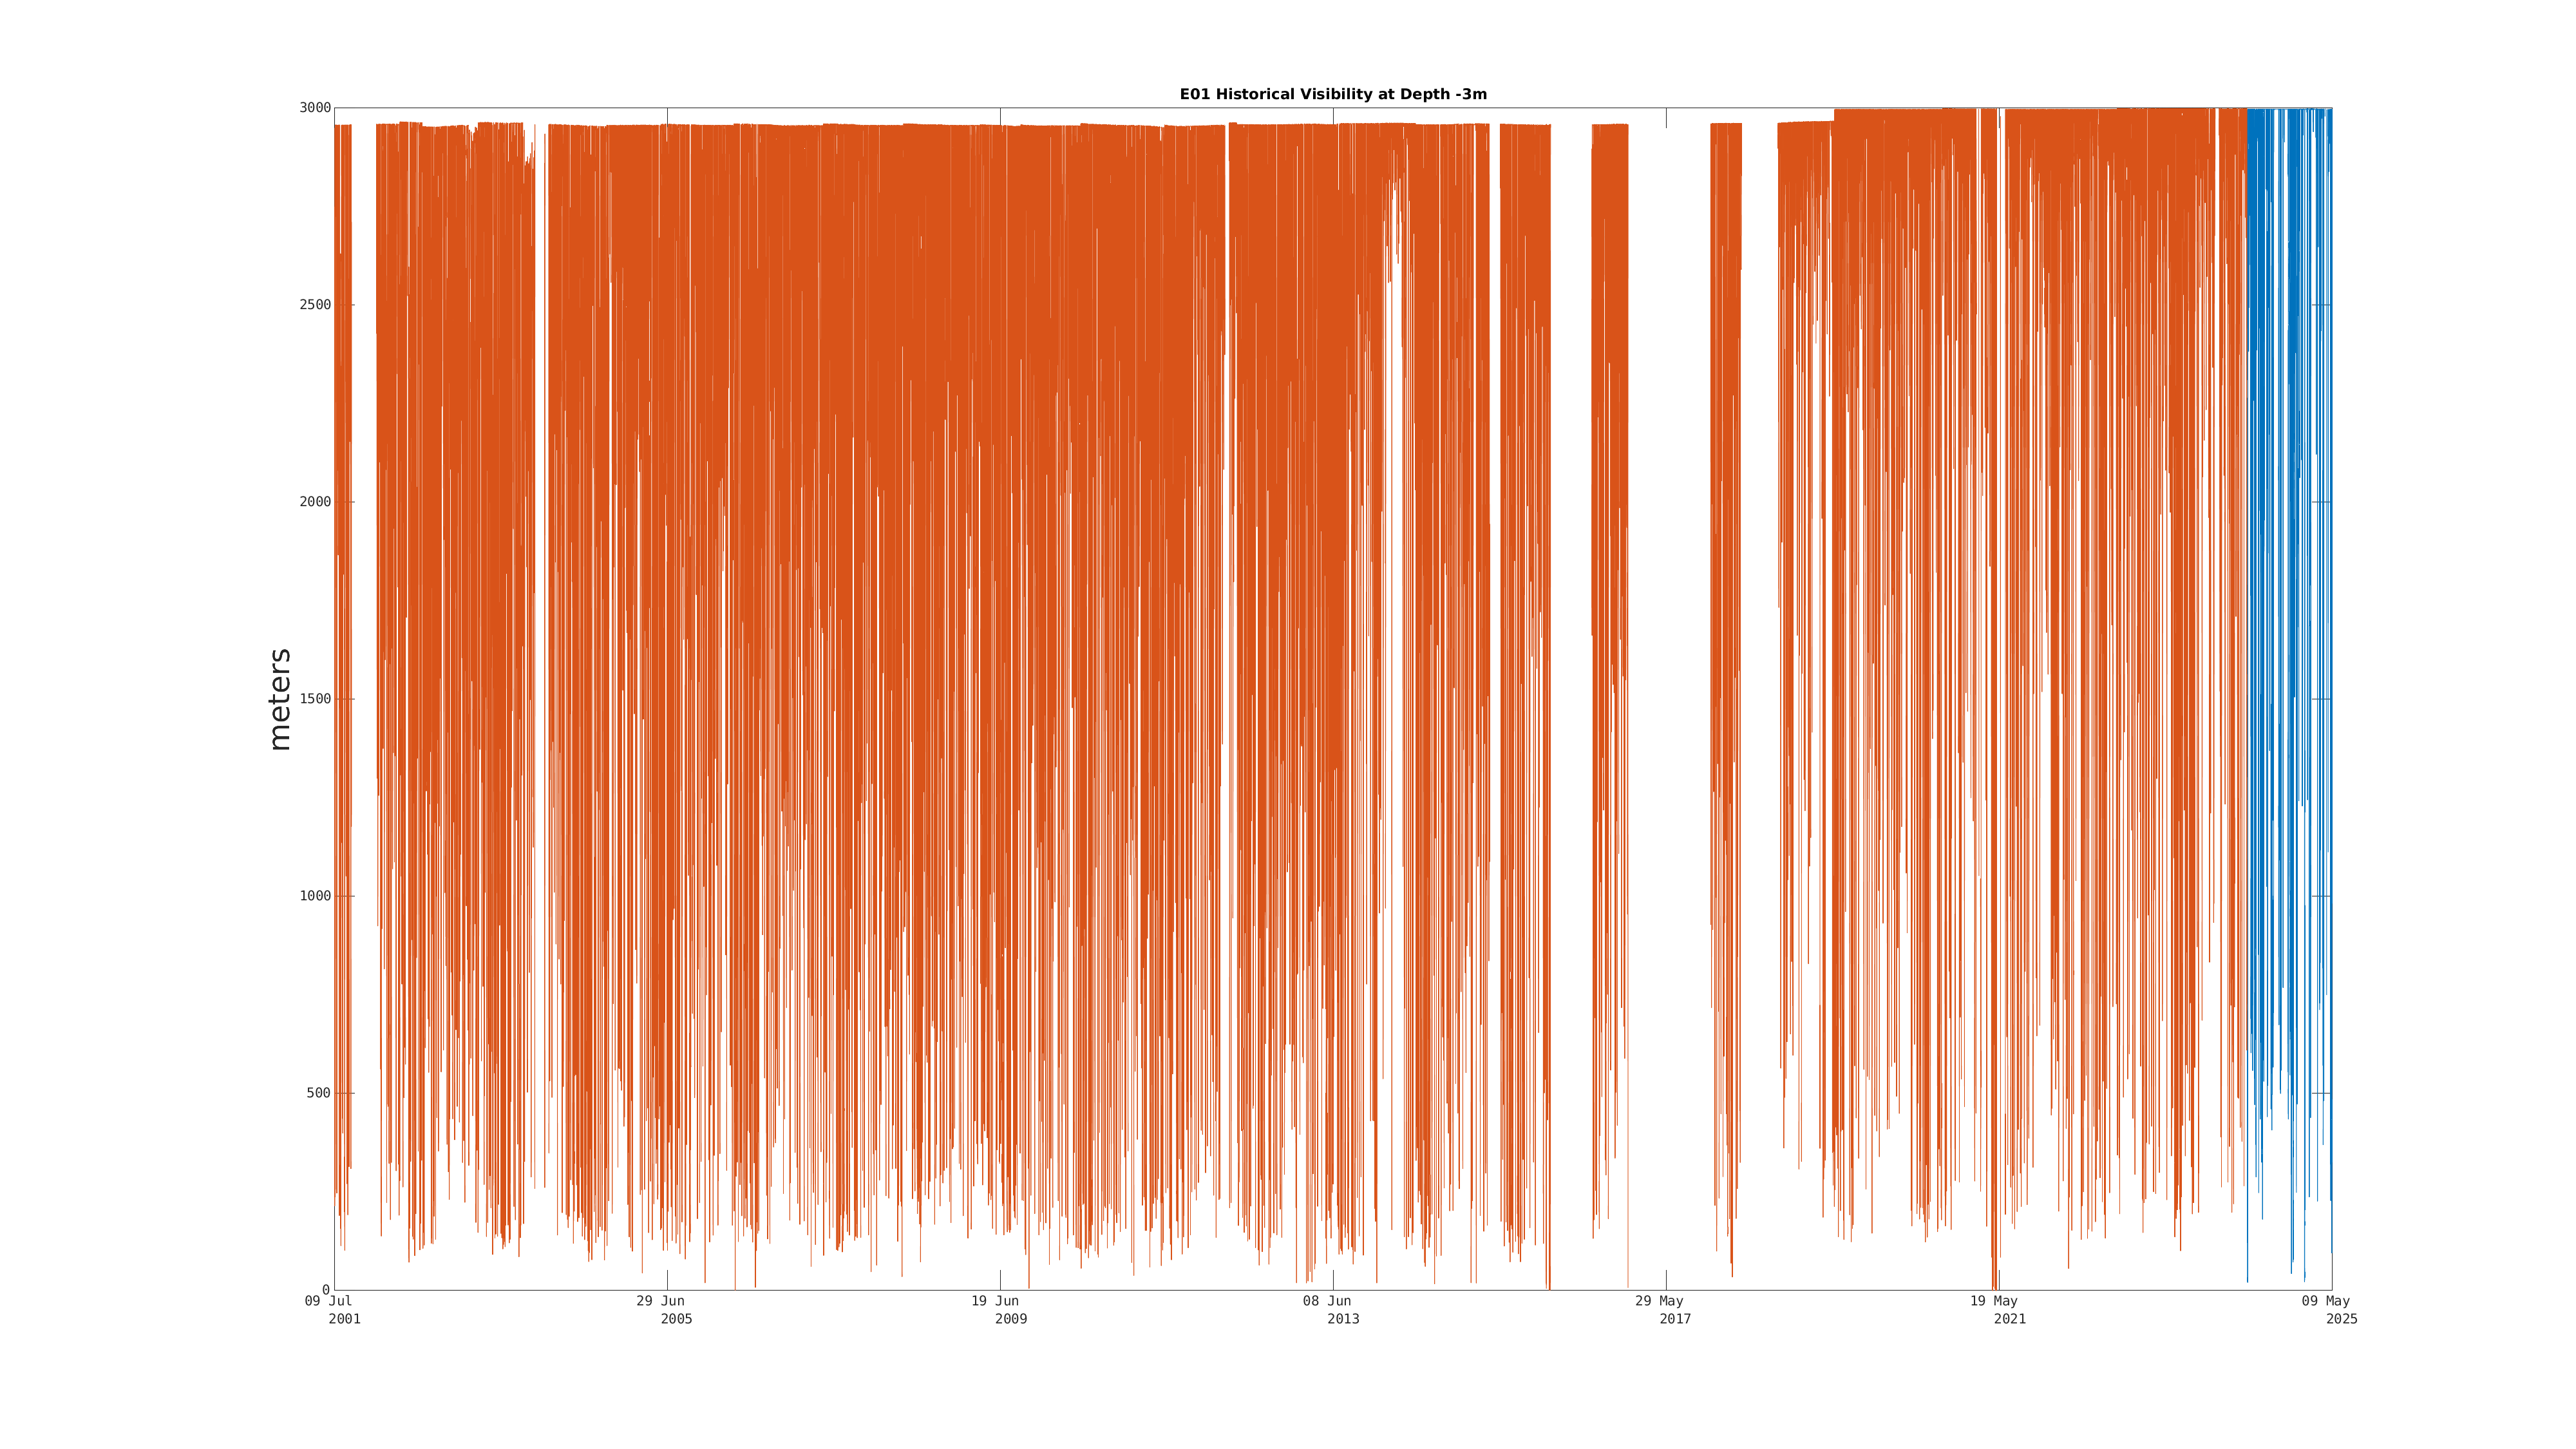
| Visibility (-3m) | 2998.2 meters | Dec 21 9:00 PM |
|
|
|
|
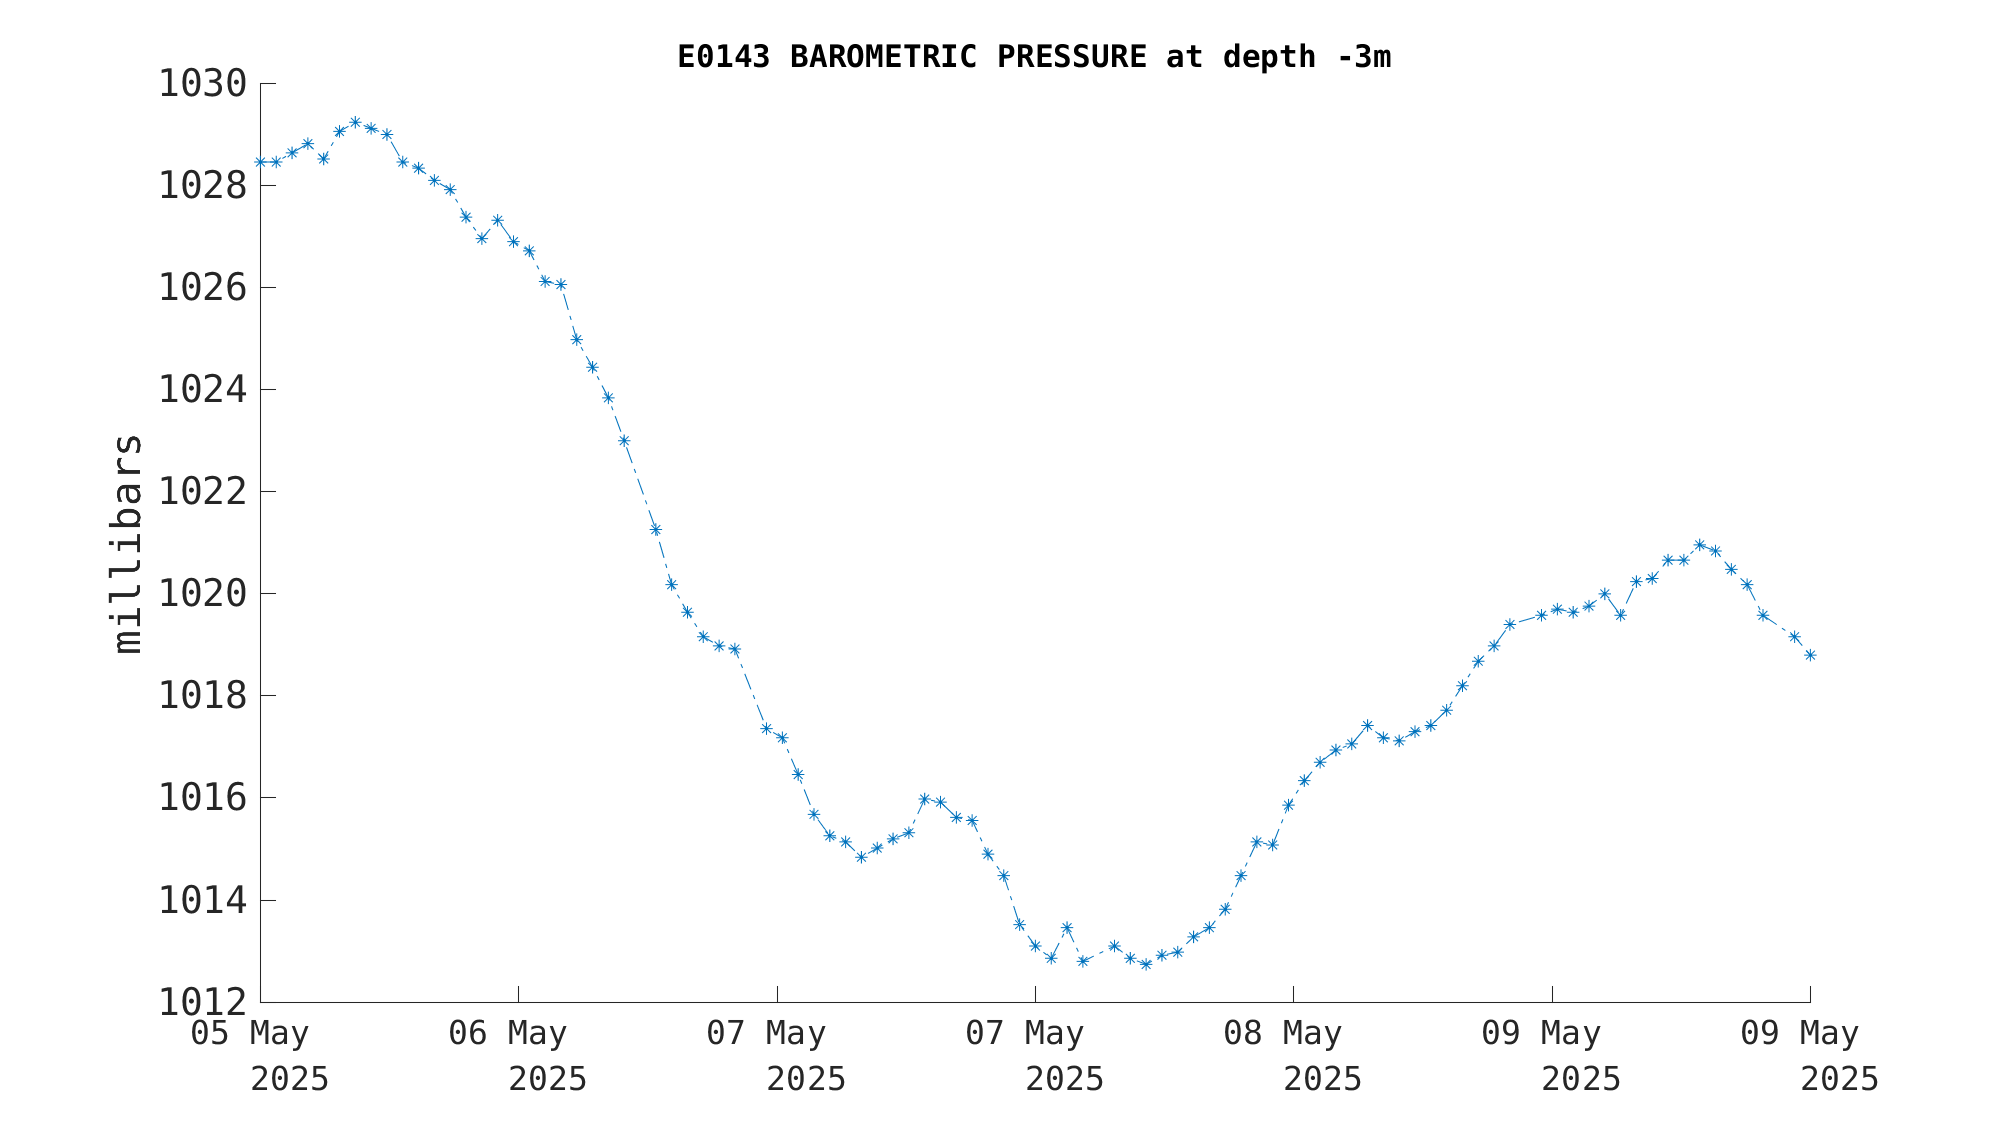
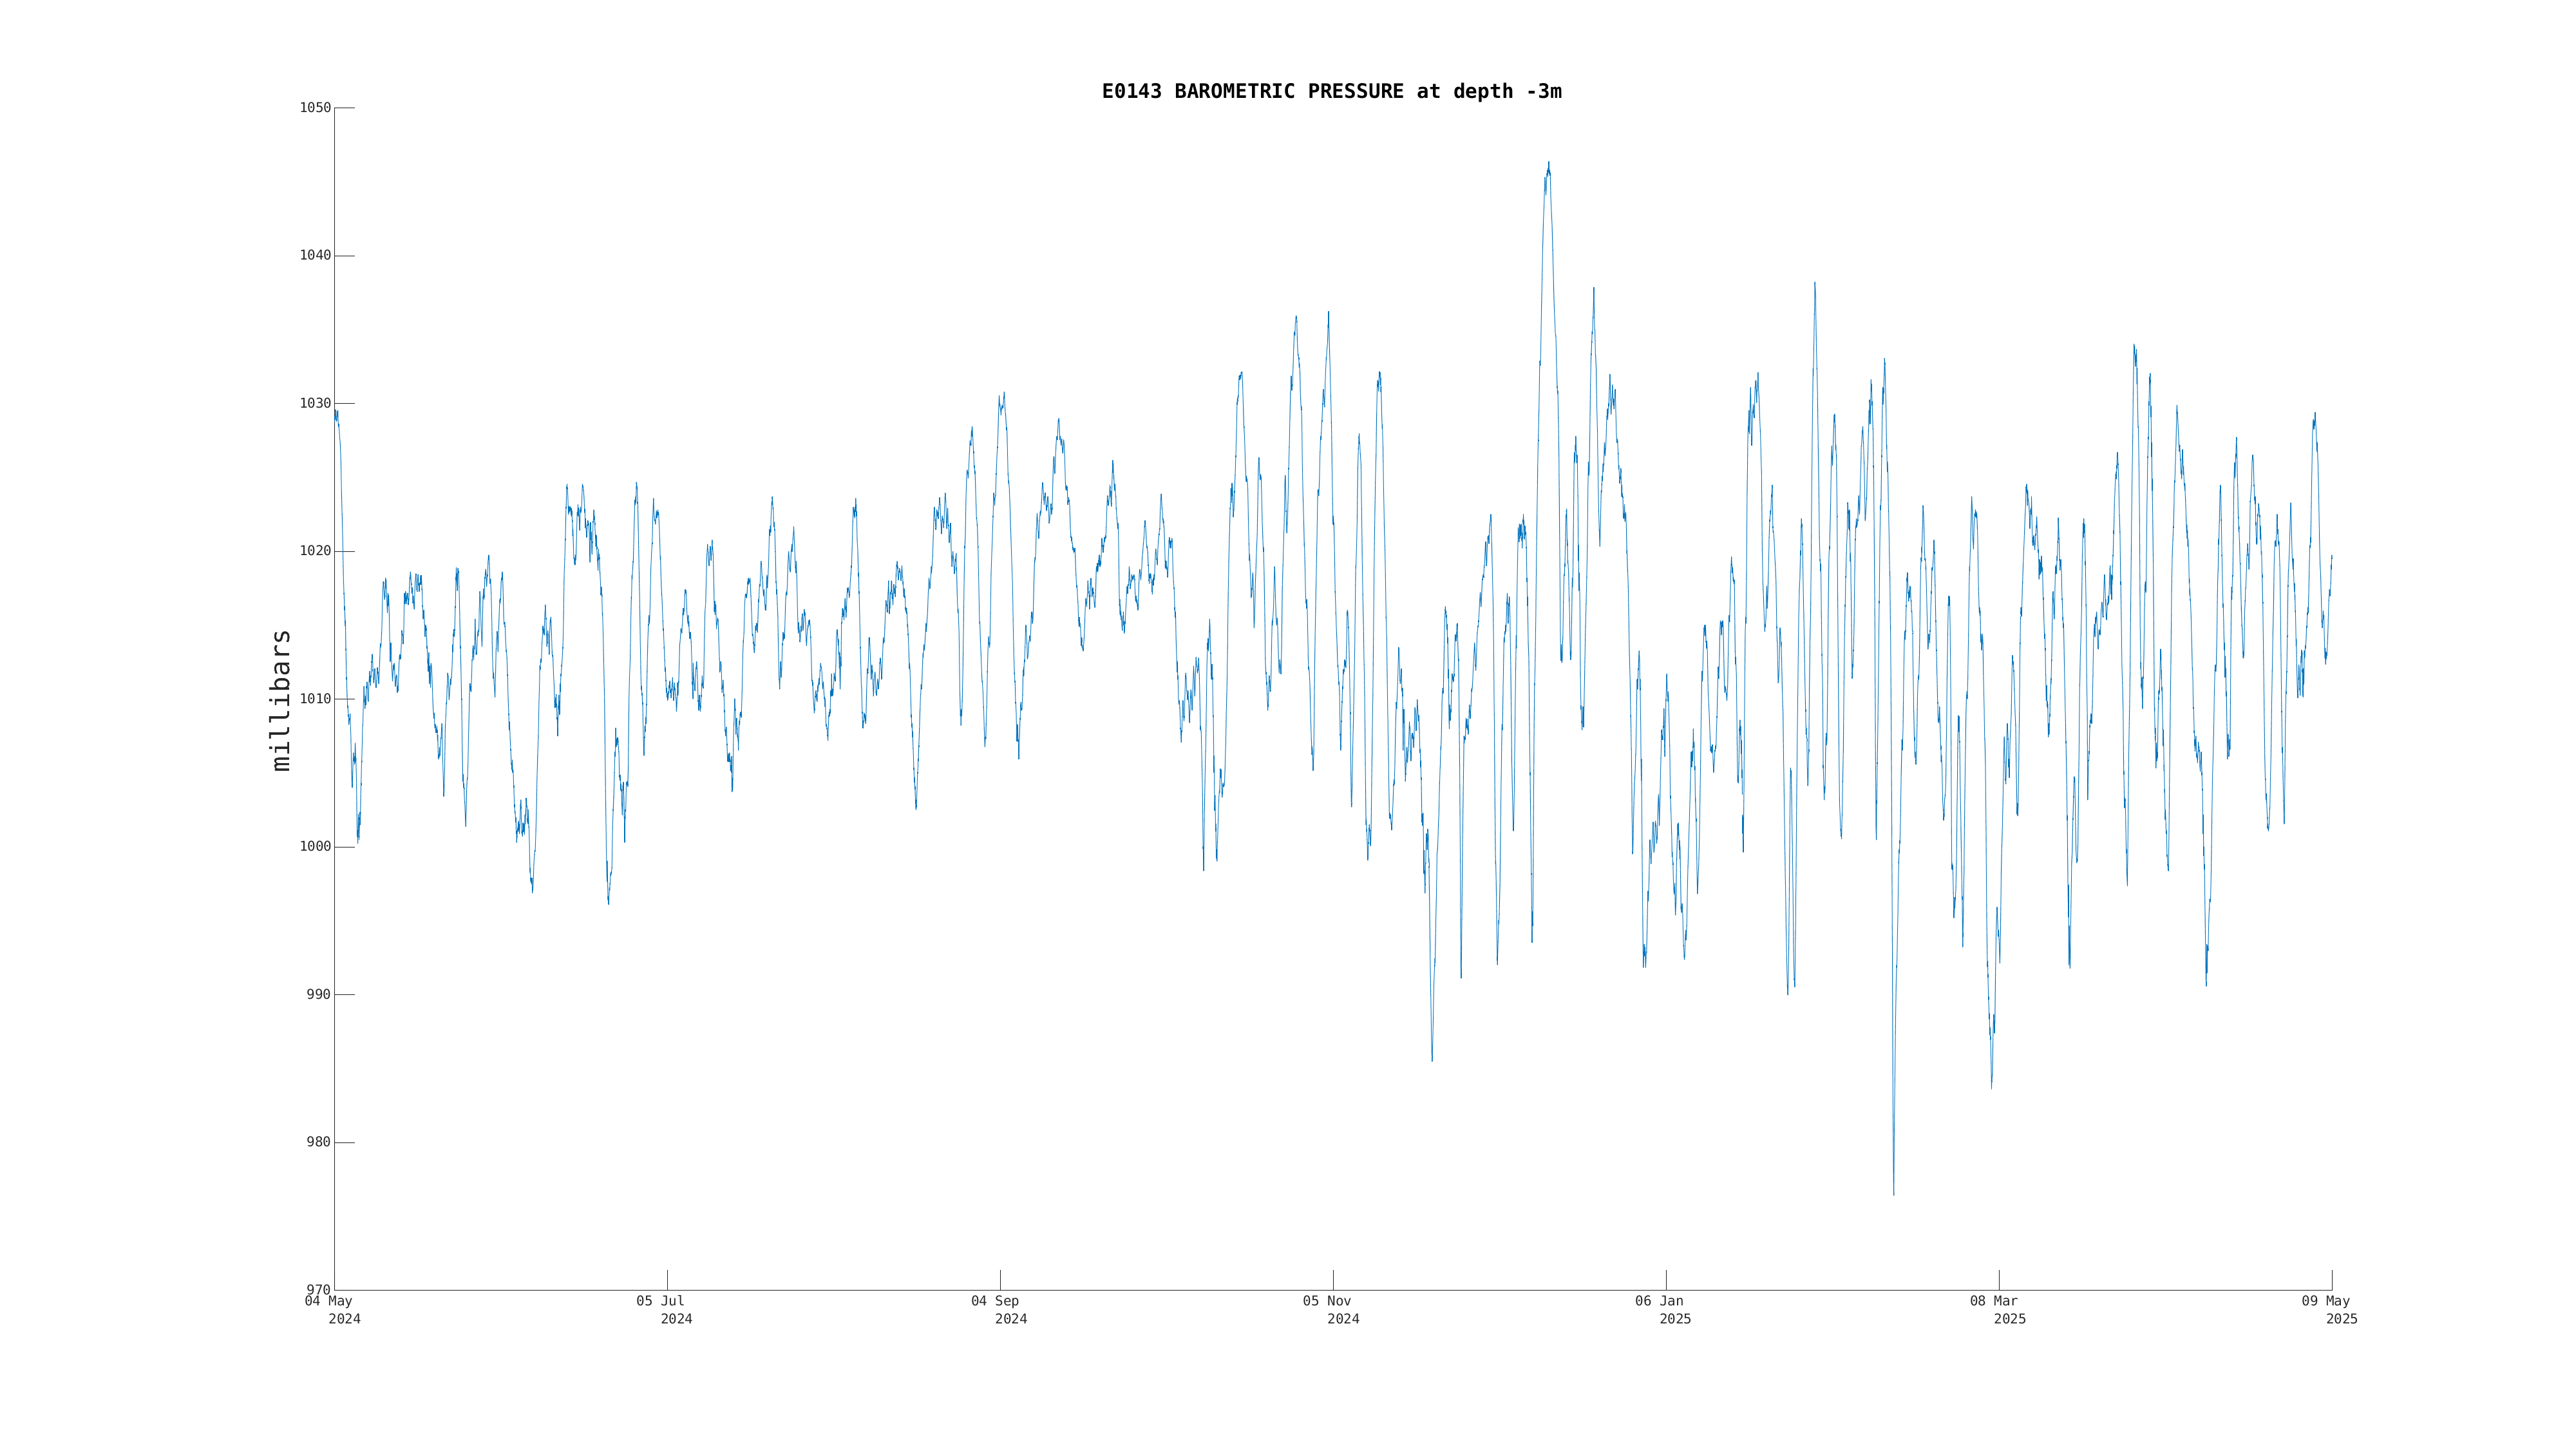
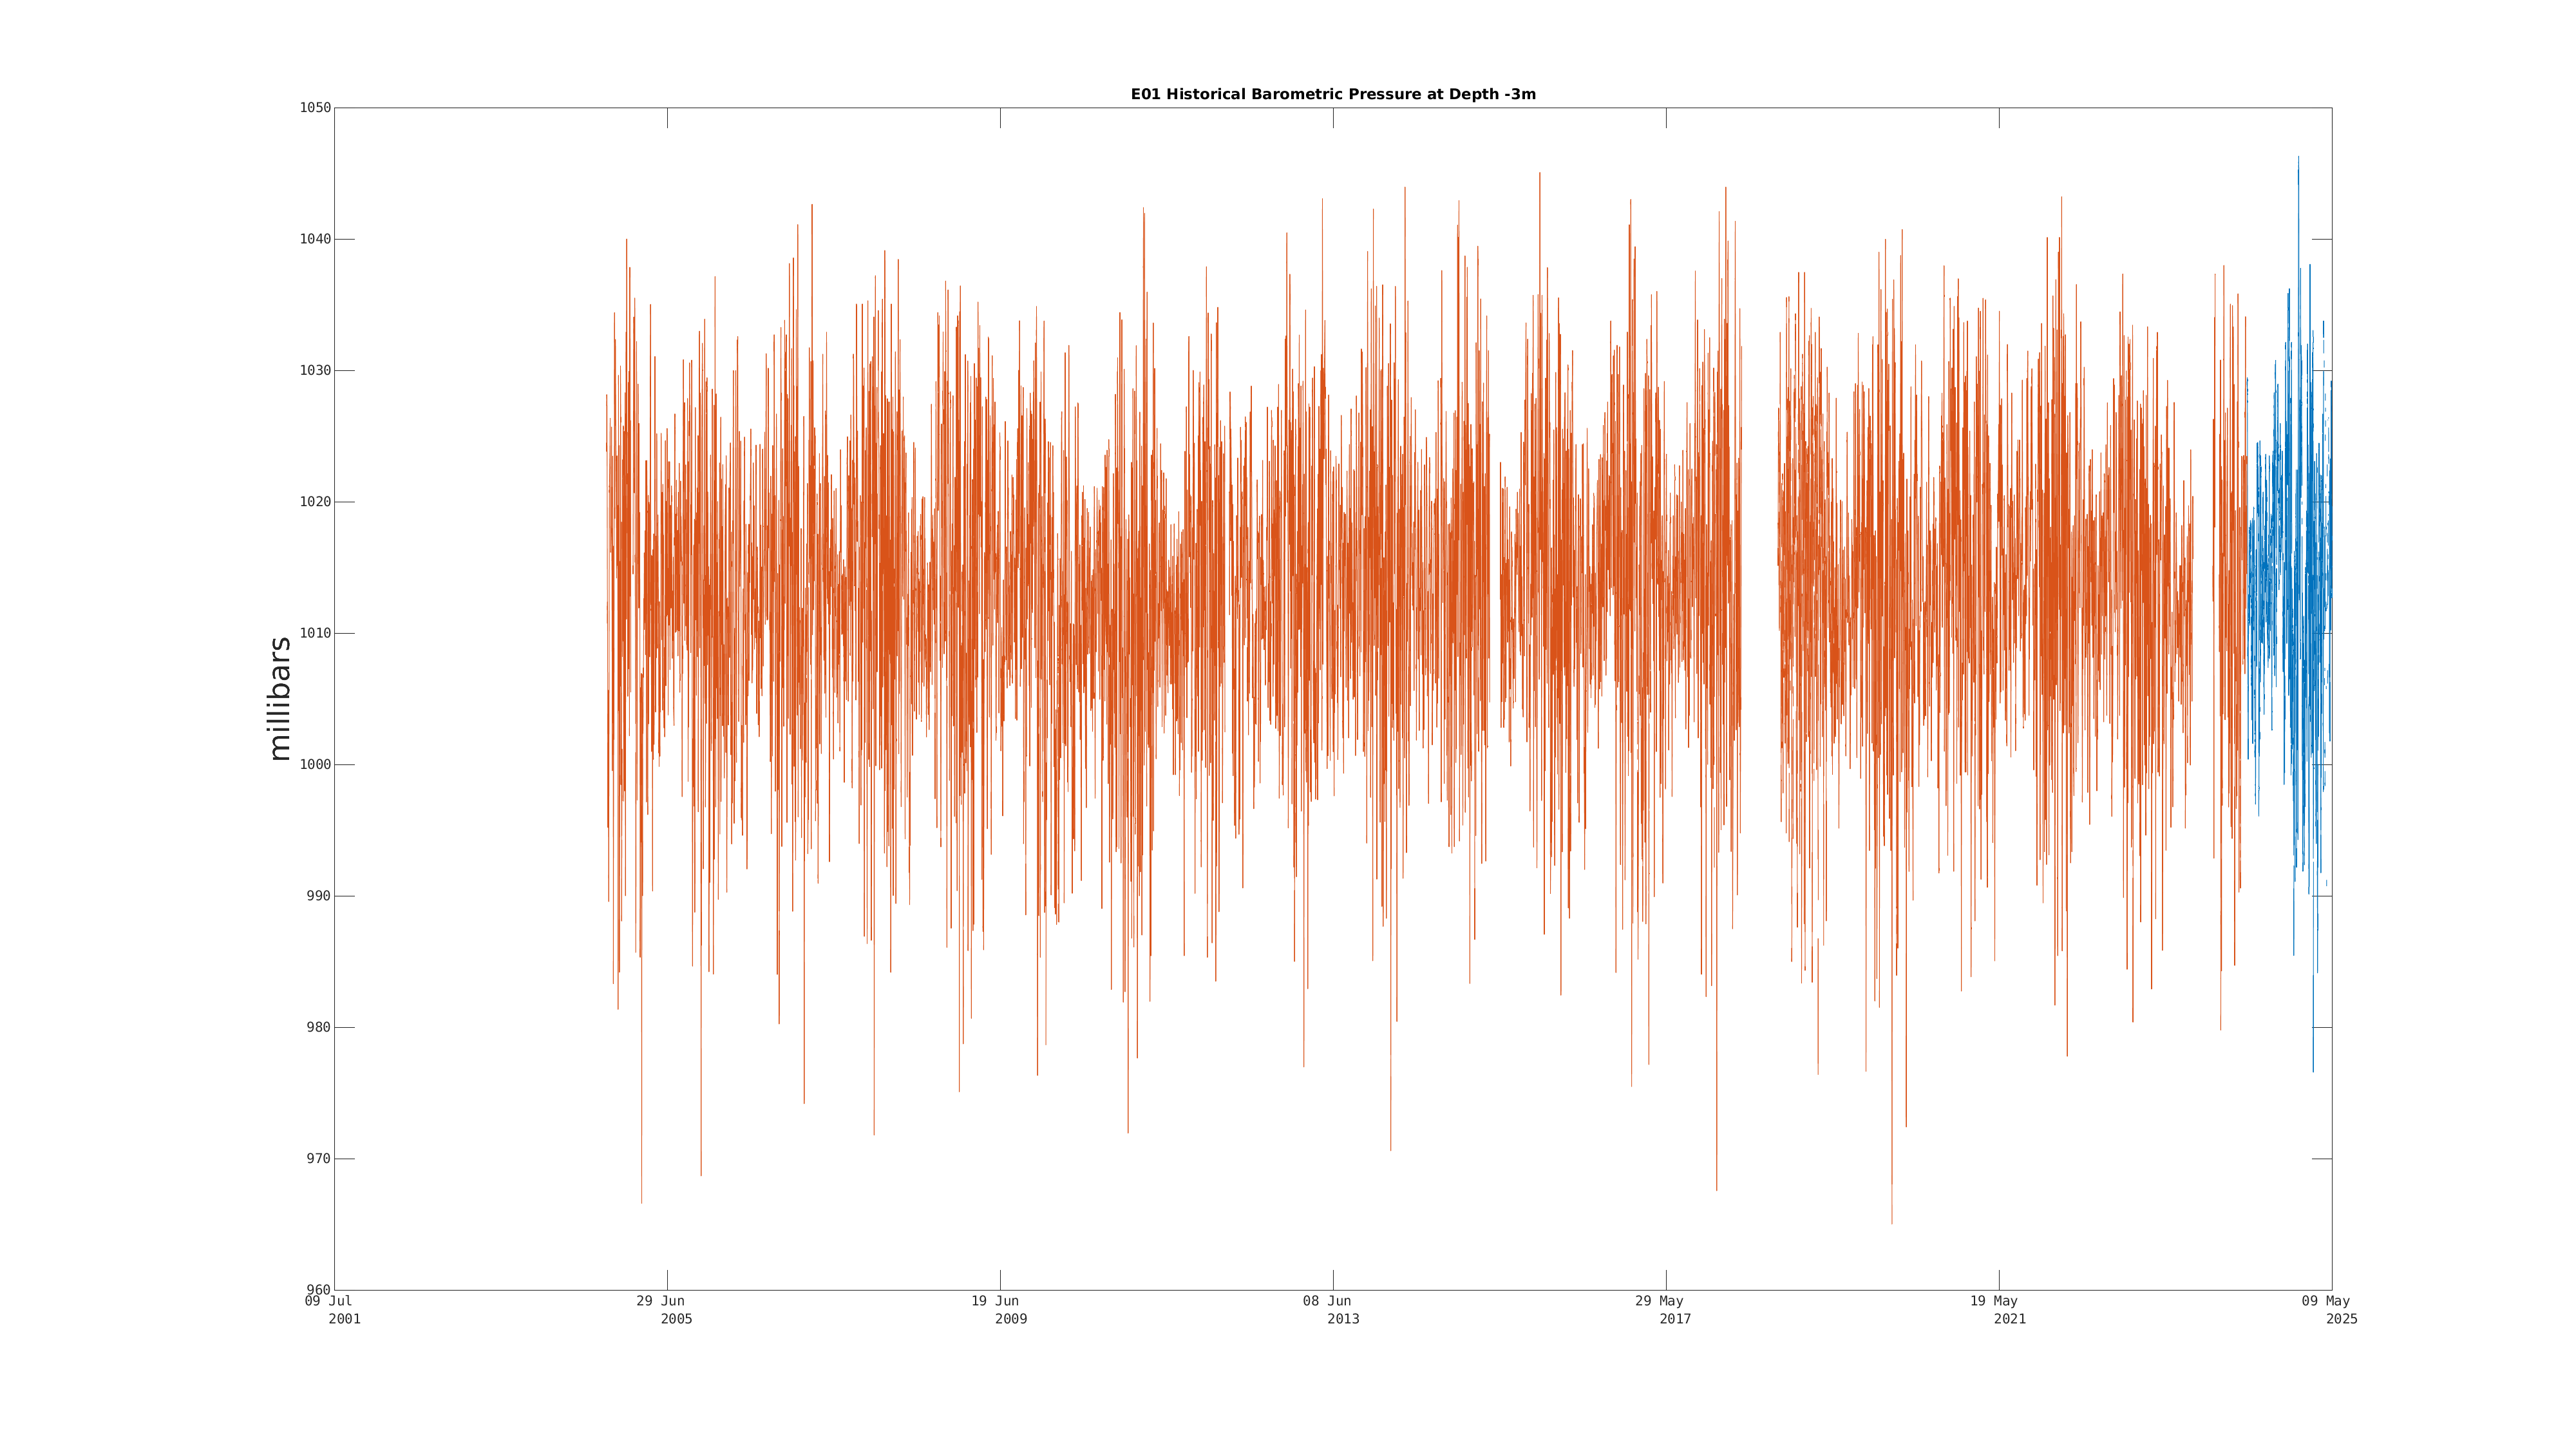
| Barometric Pressure (-3m) | 1011.5 millibars | Dec 21 9:00 PM |
|
|
|
|
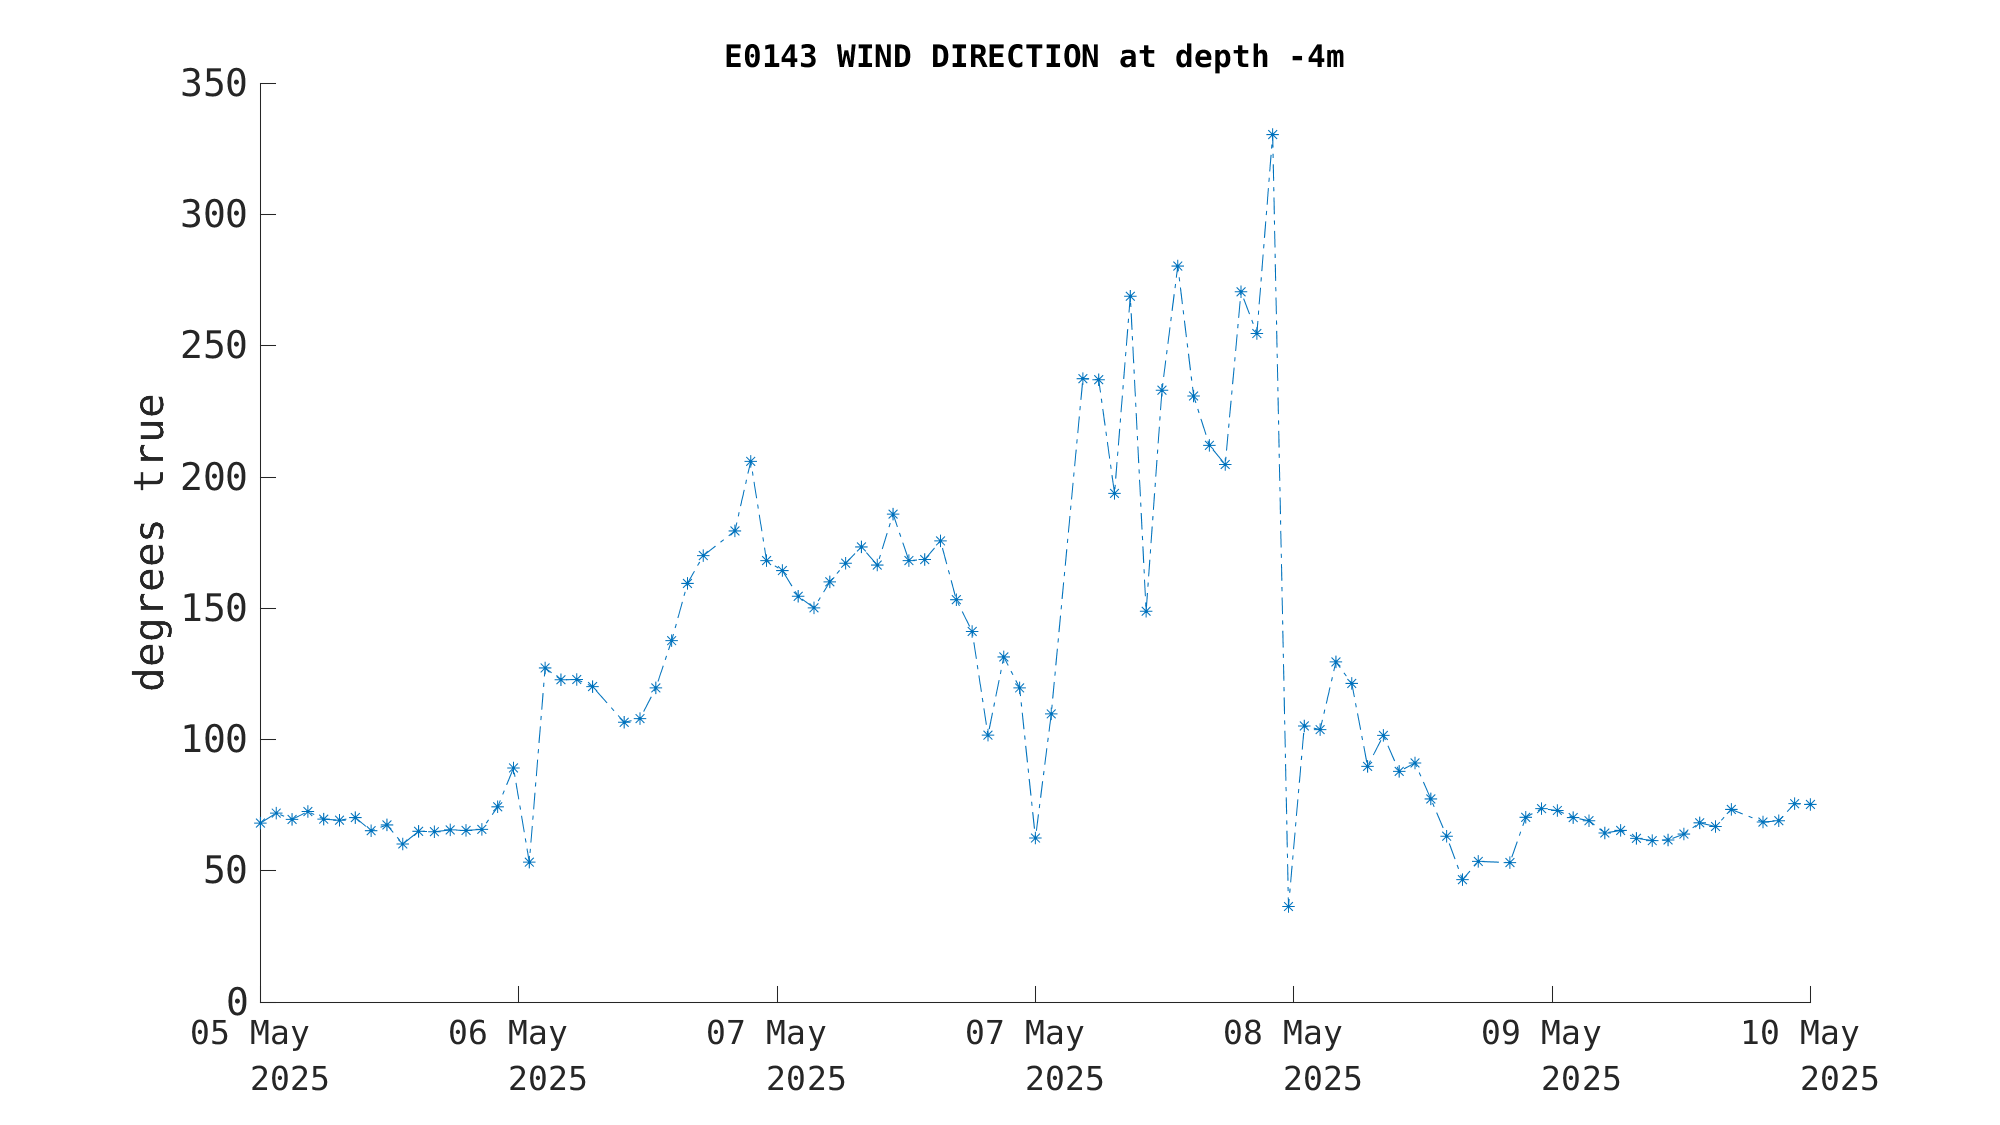
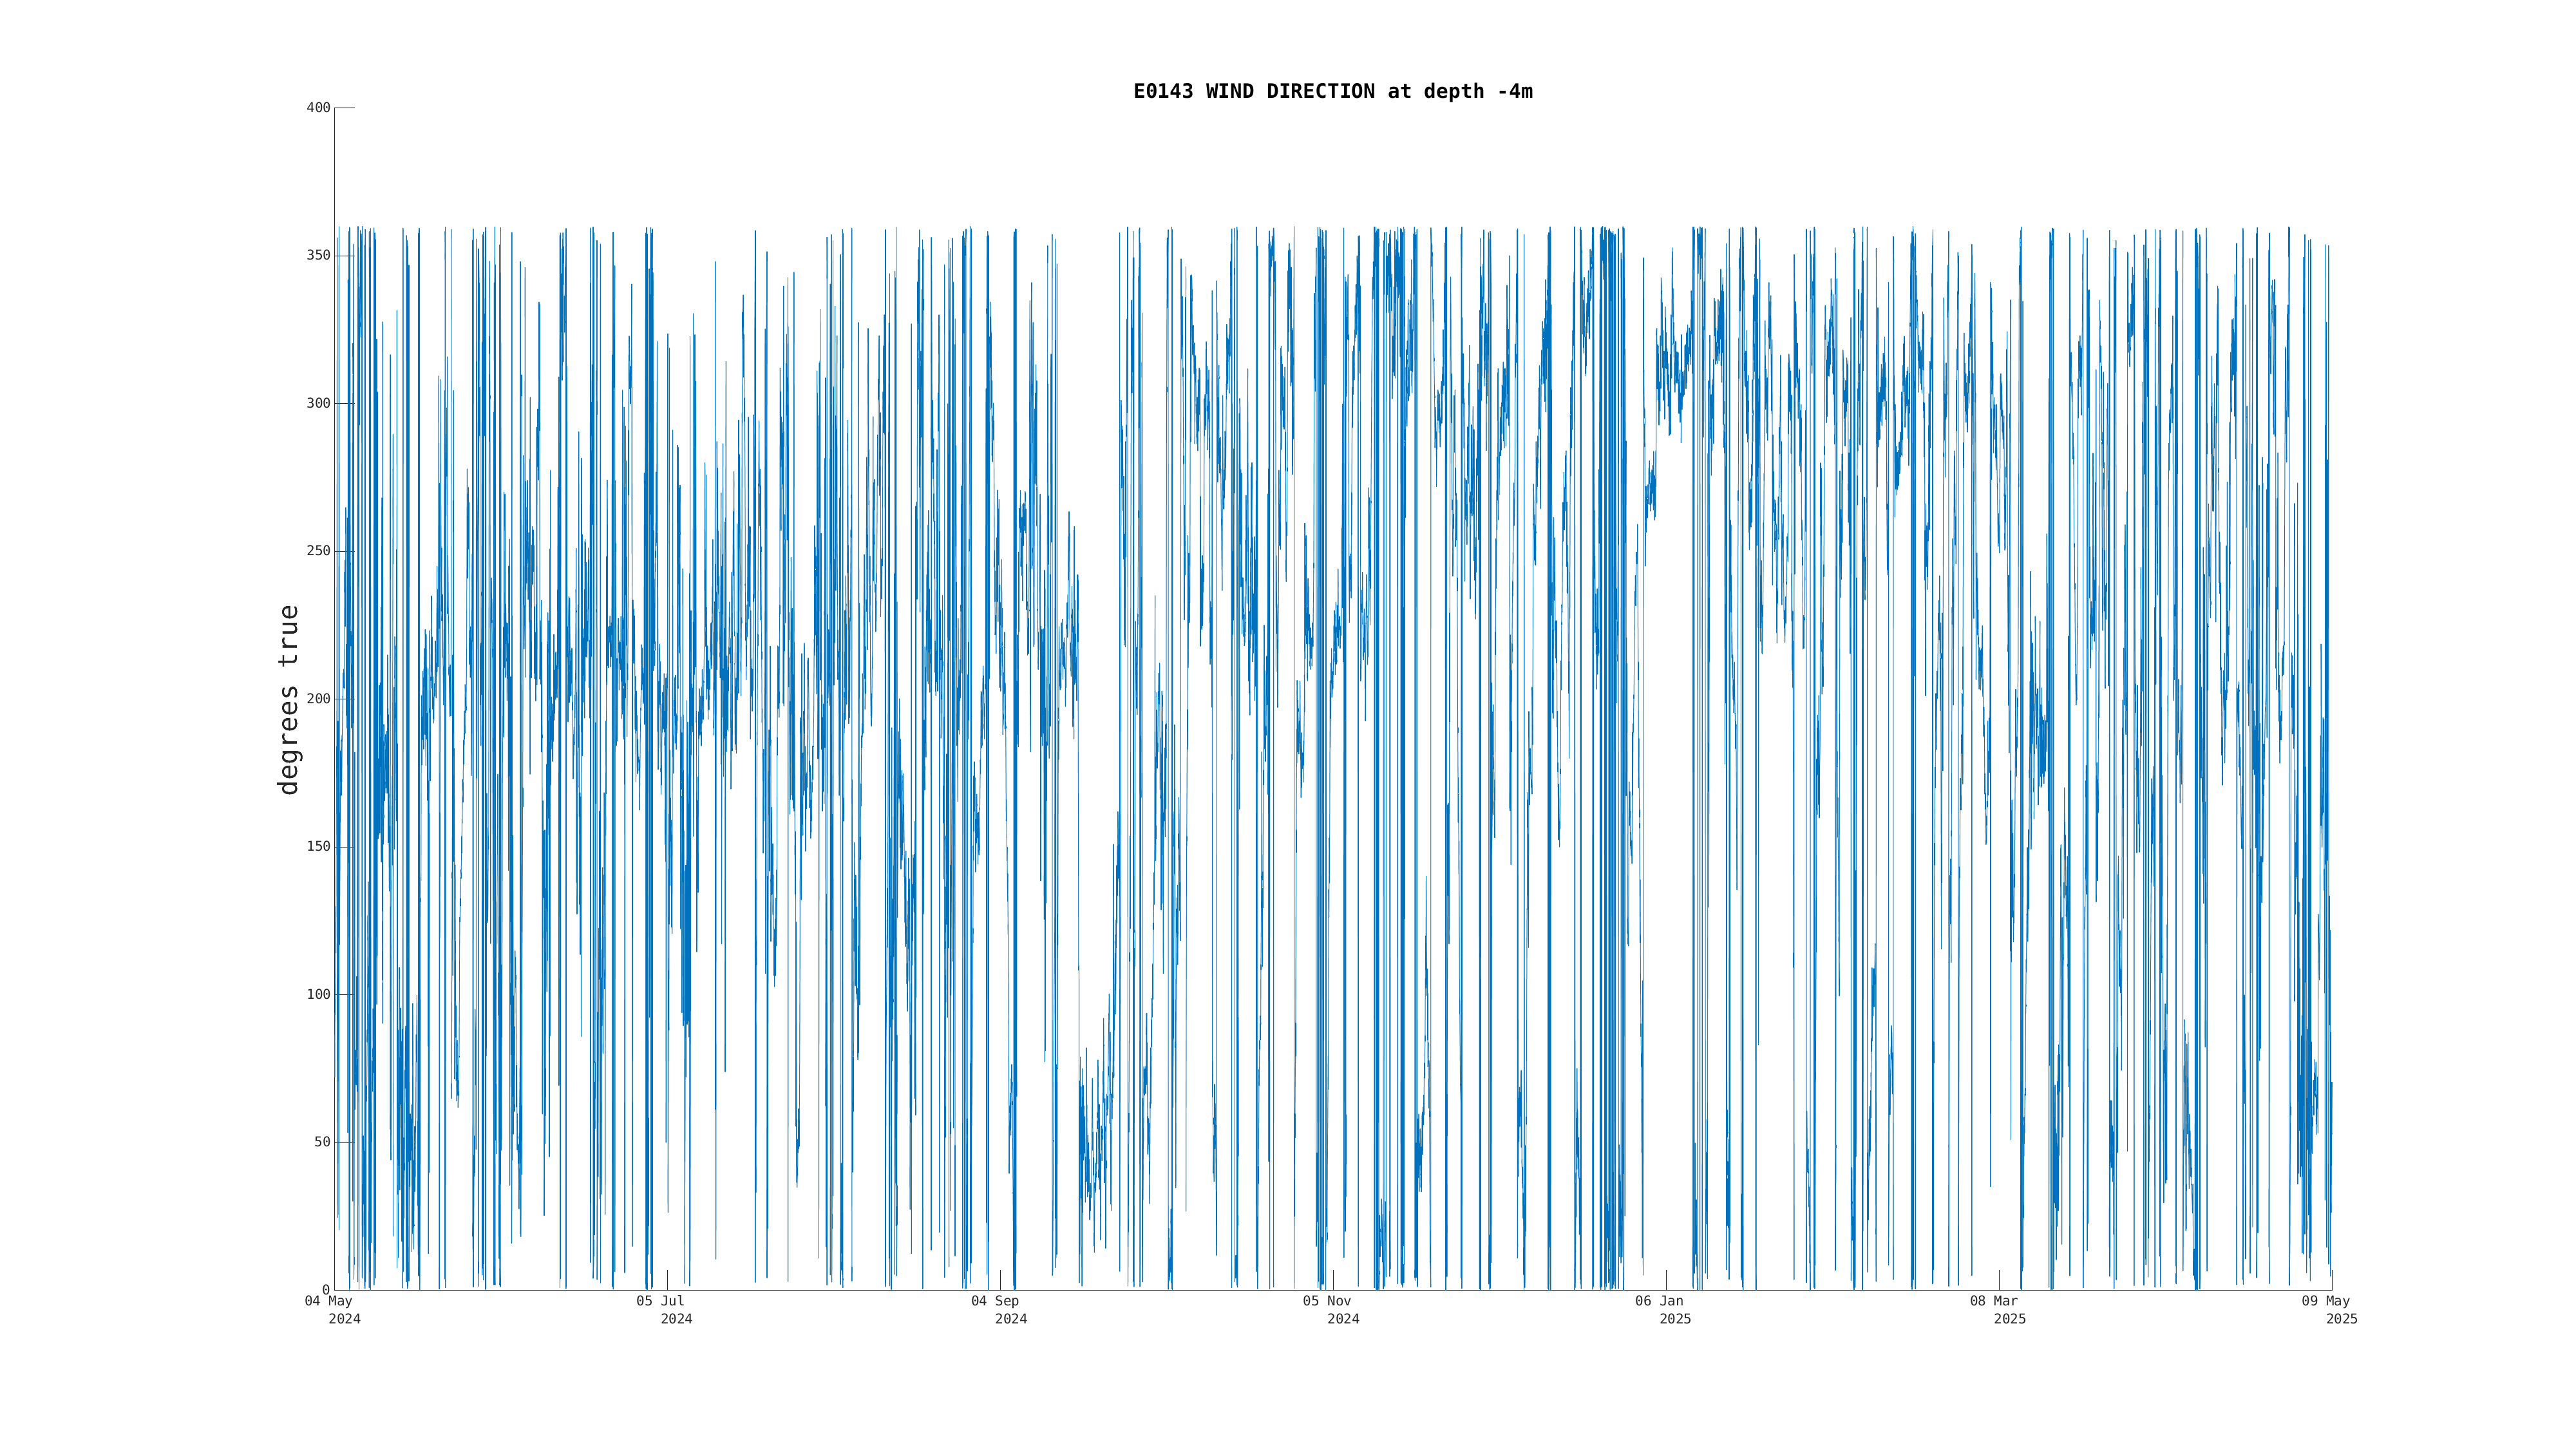
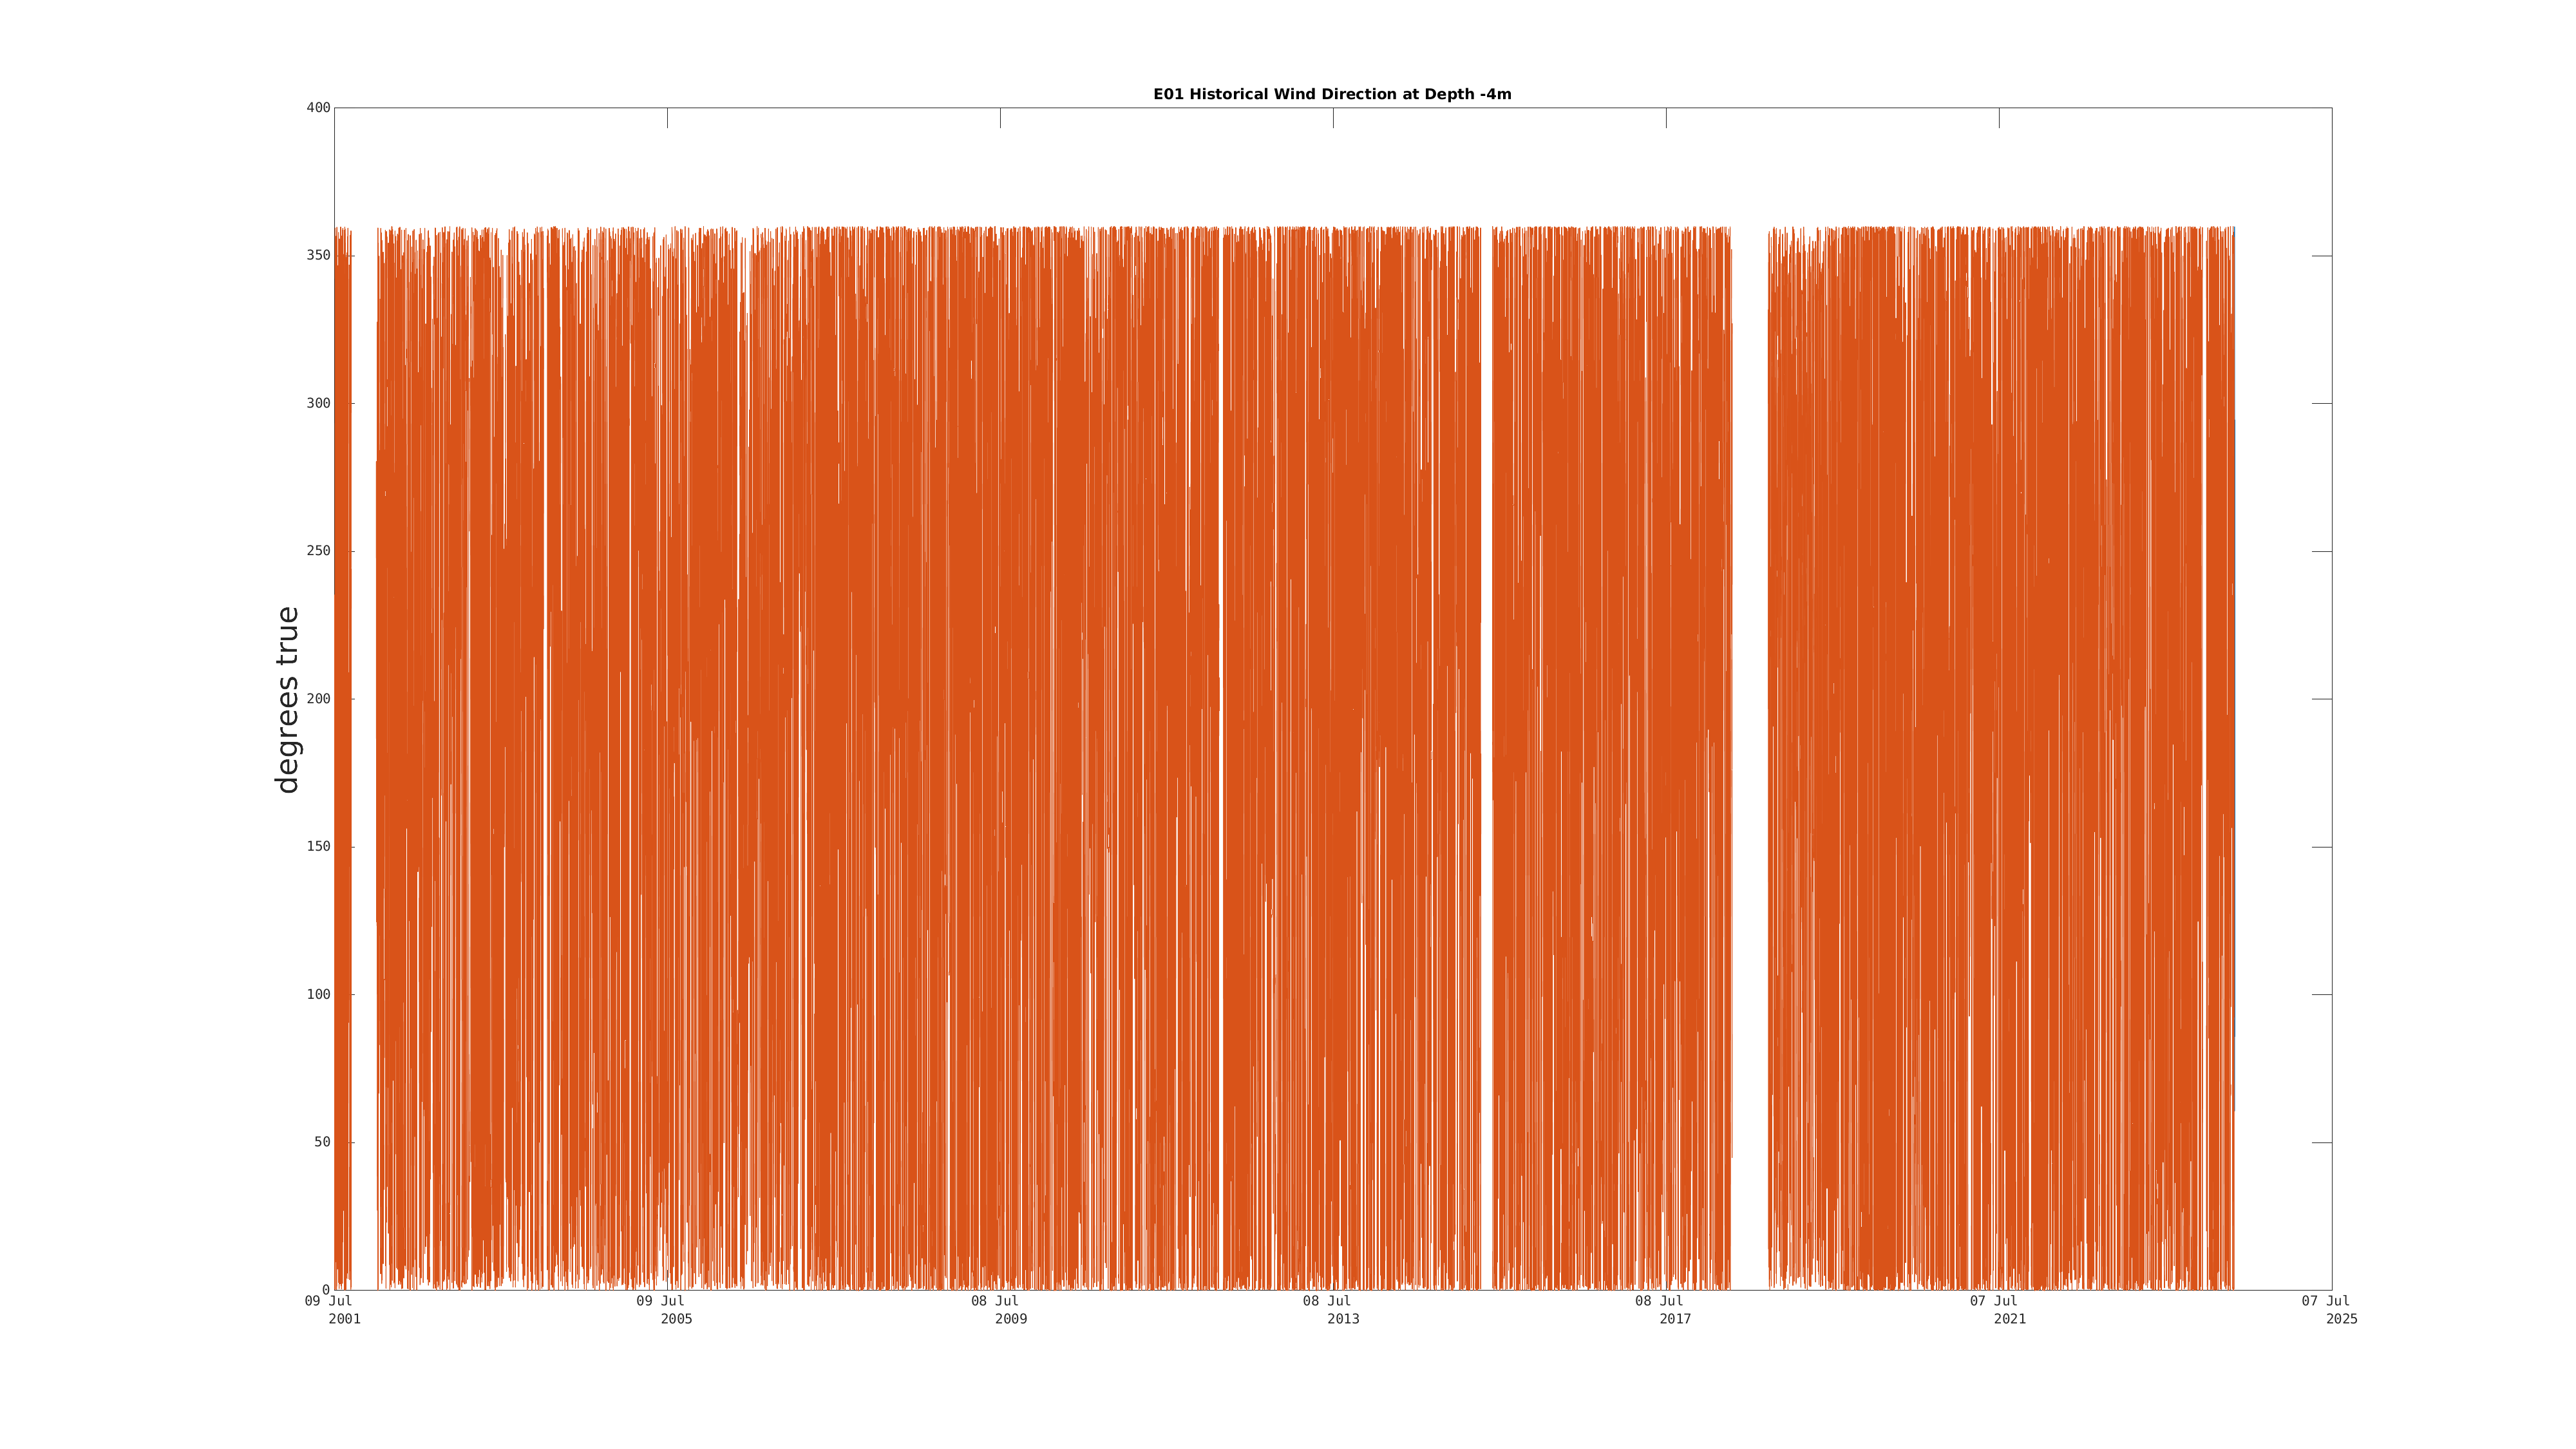
| Wind Direction (-4m) | SSW | Dec 21 9:00 PM |
|
|
|
|
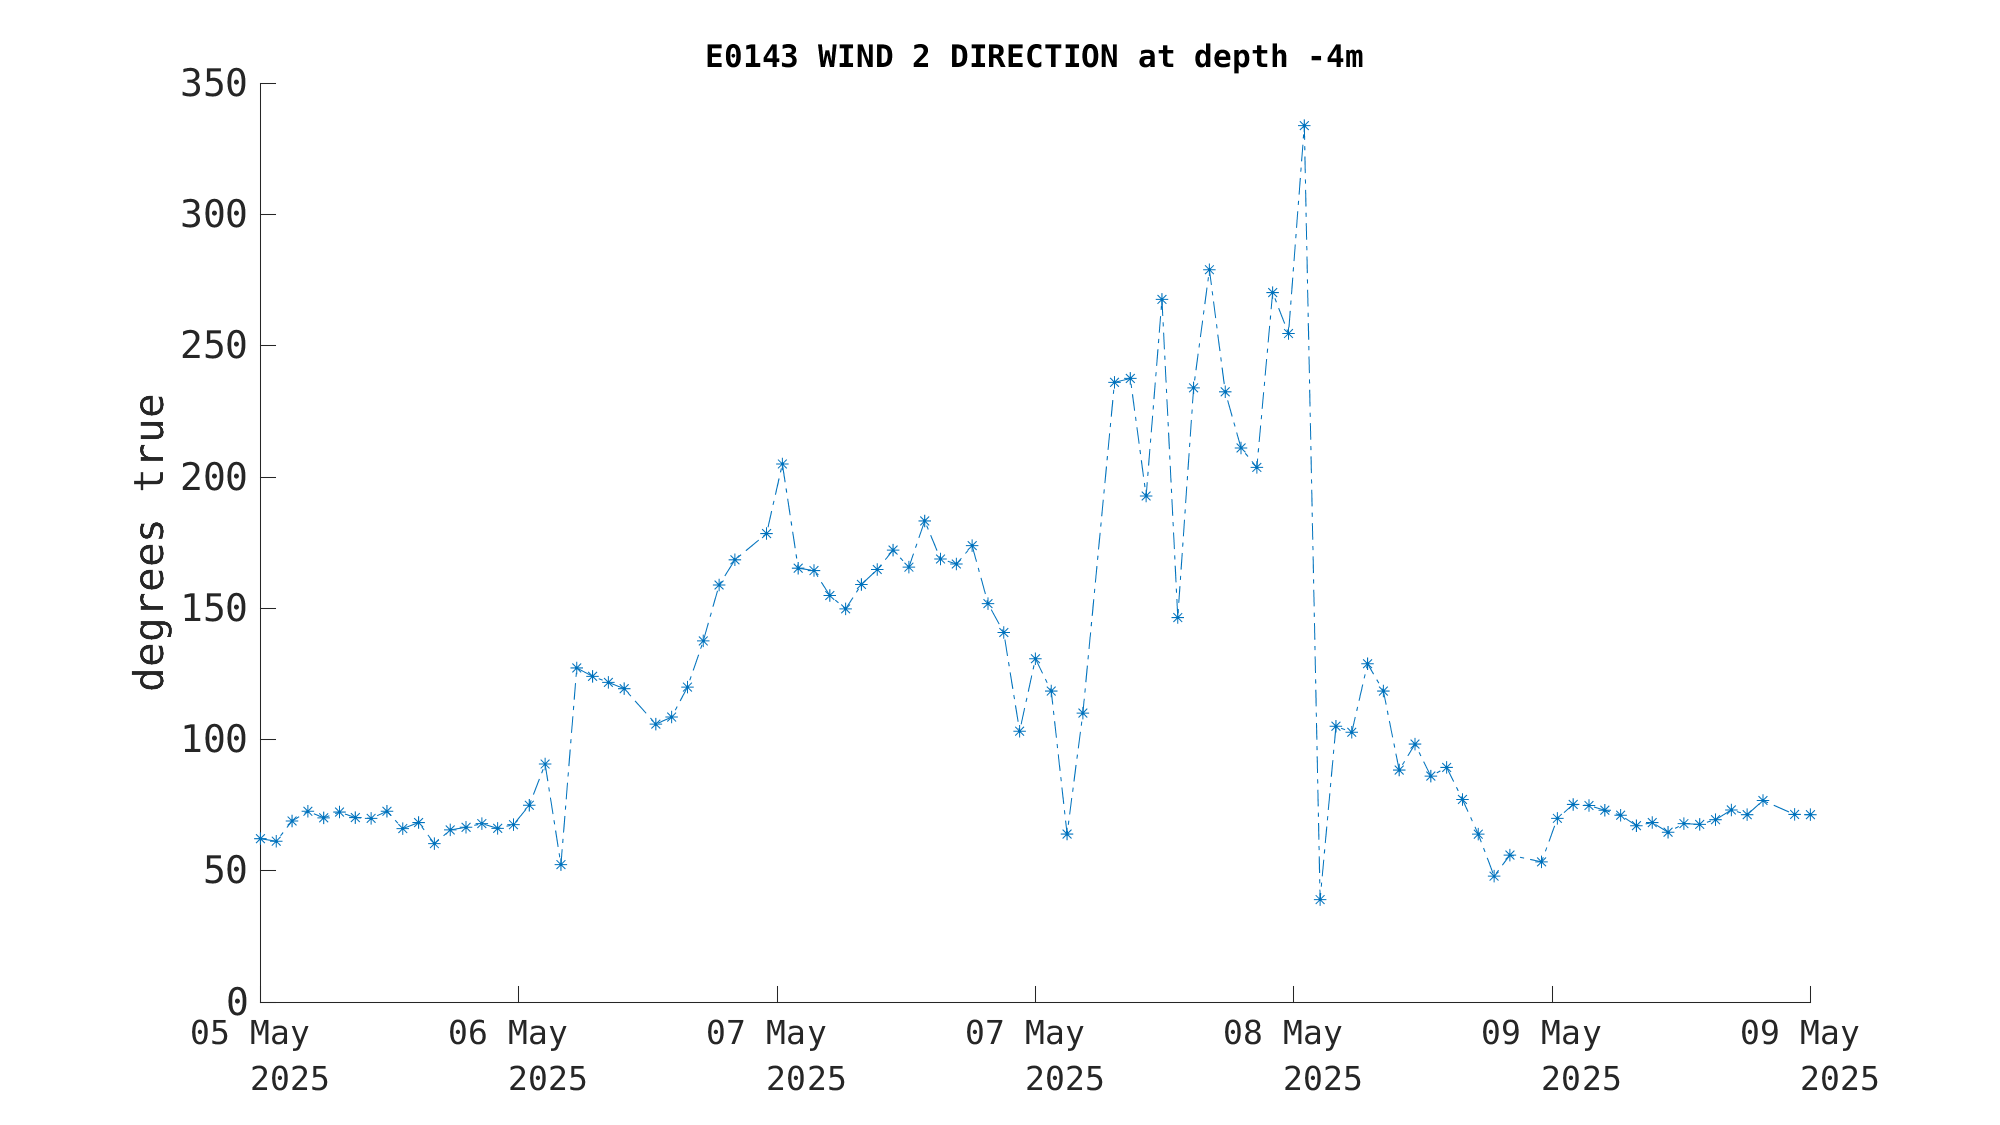
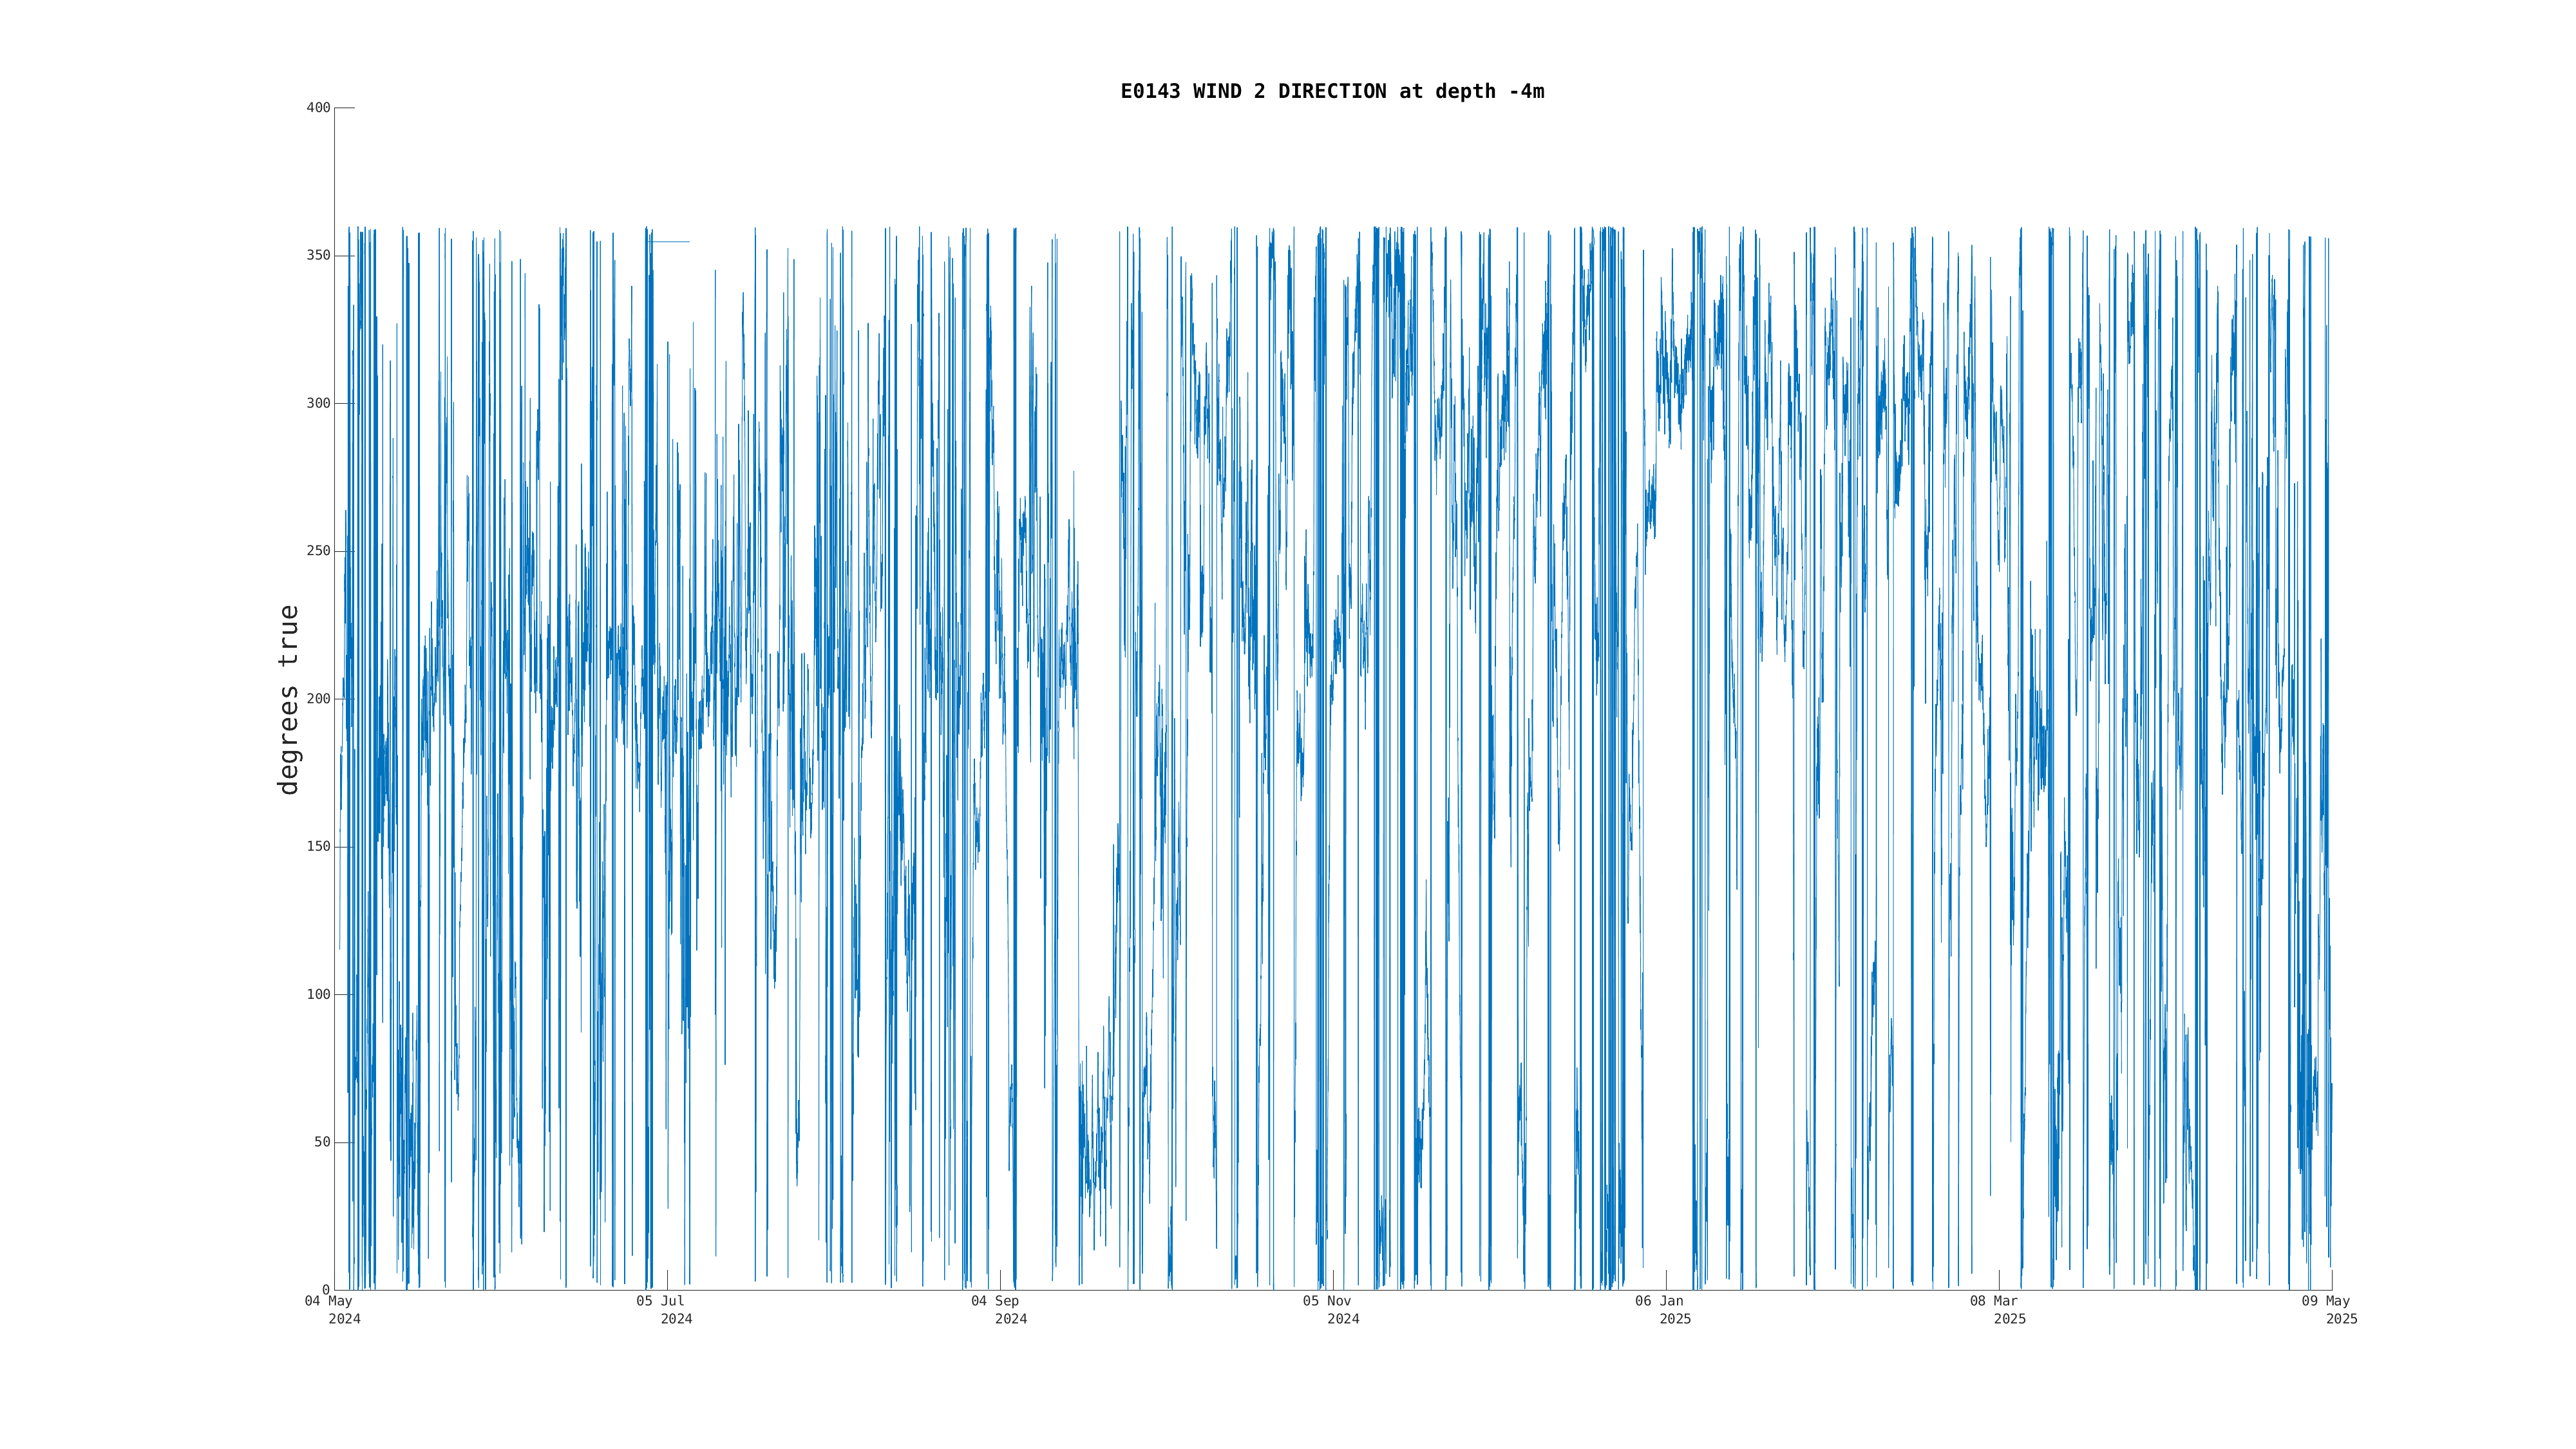
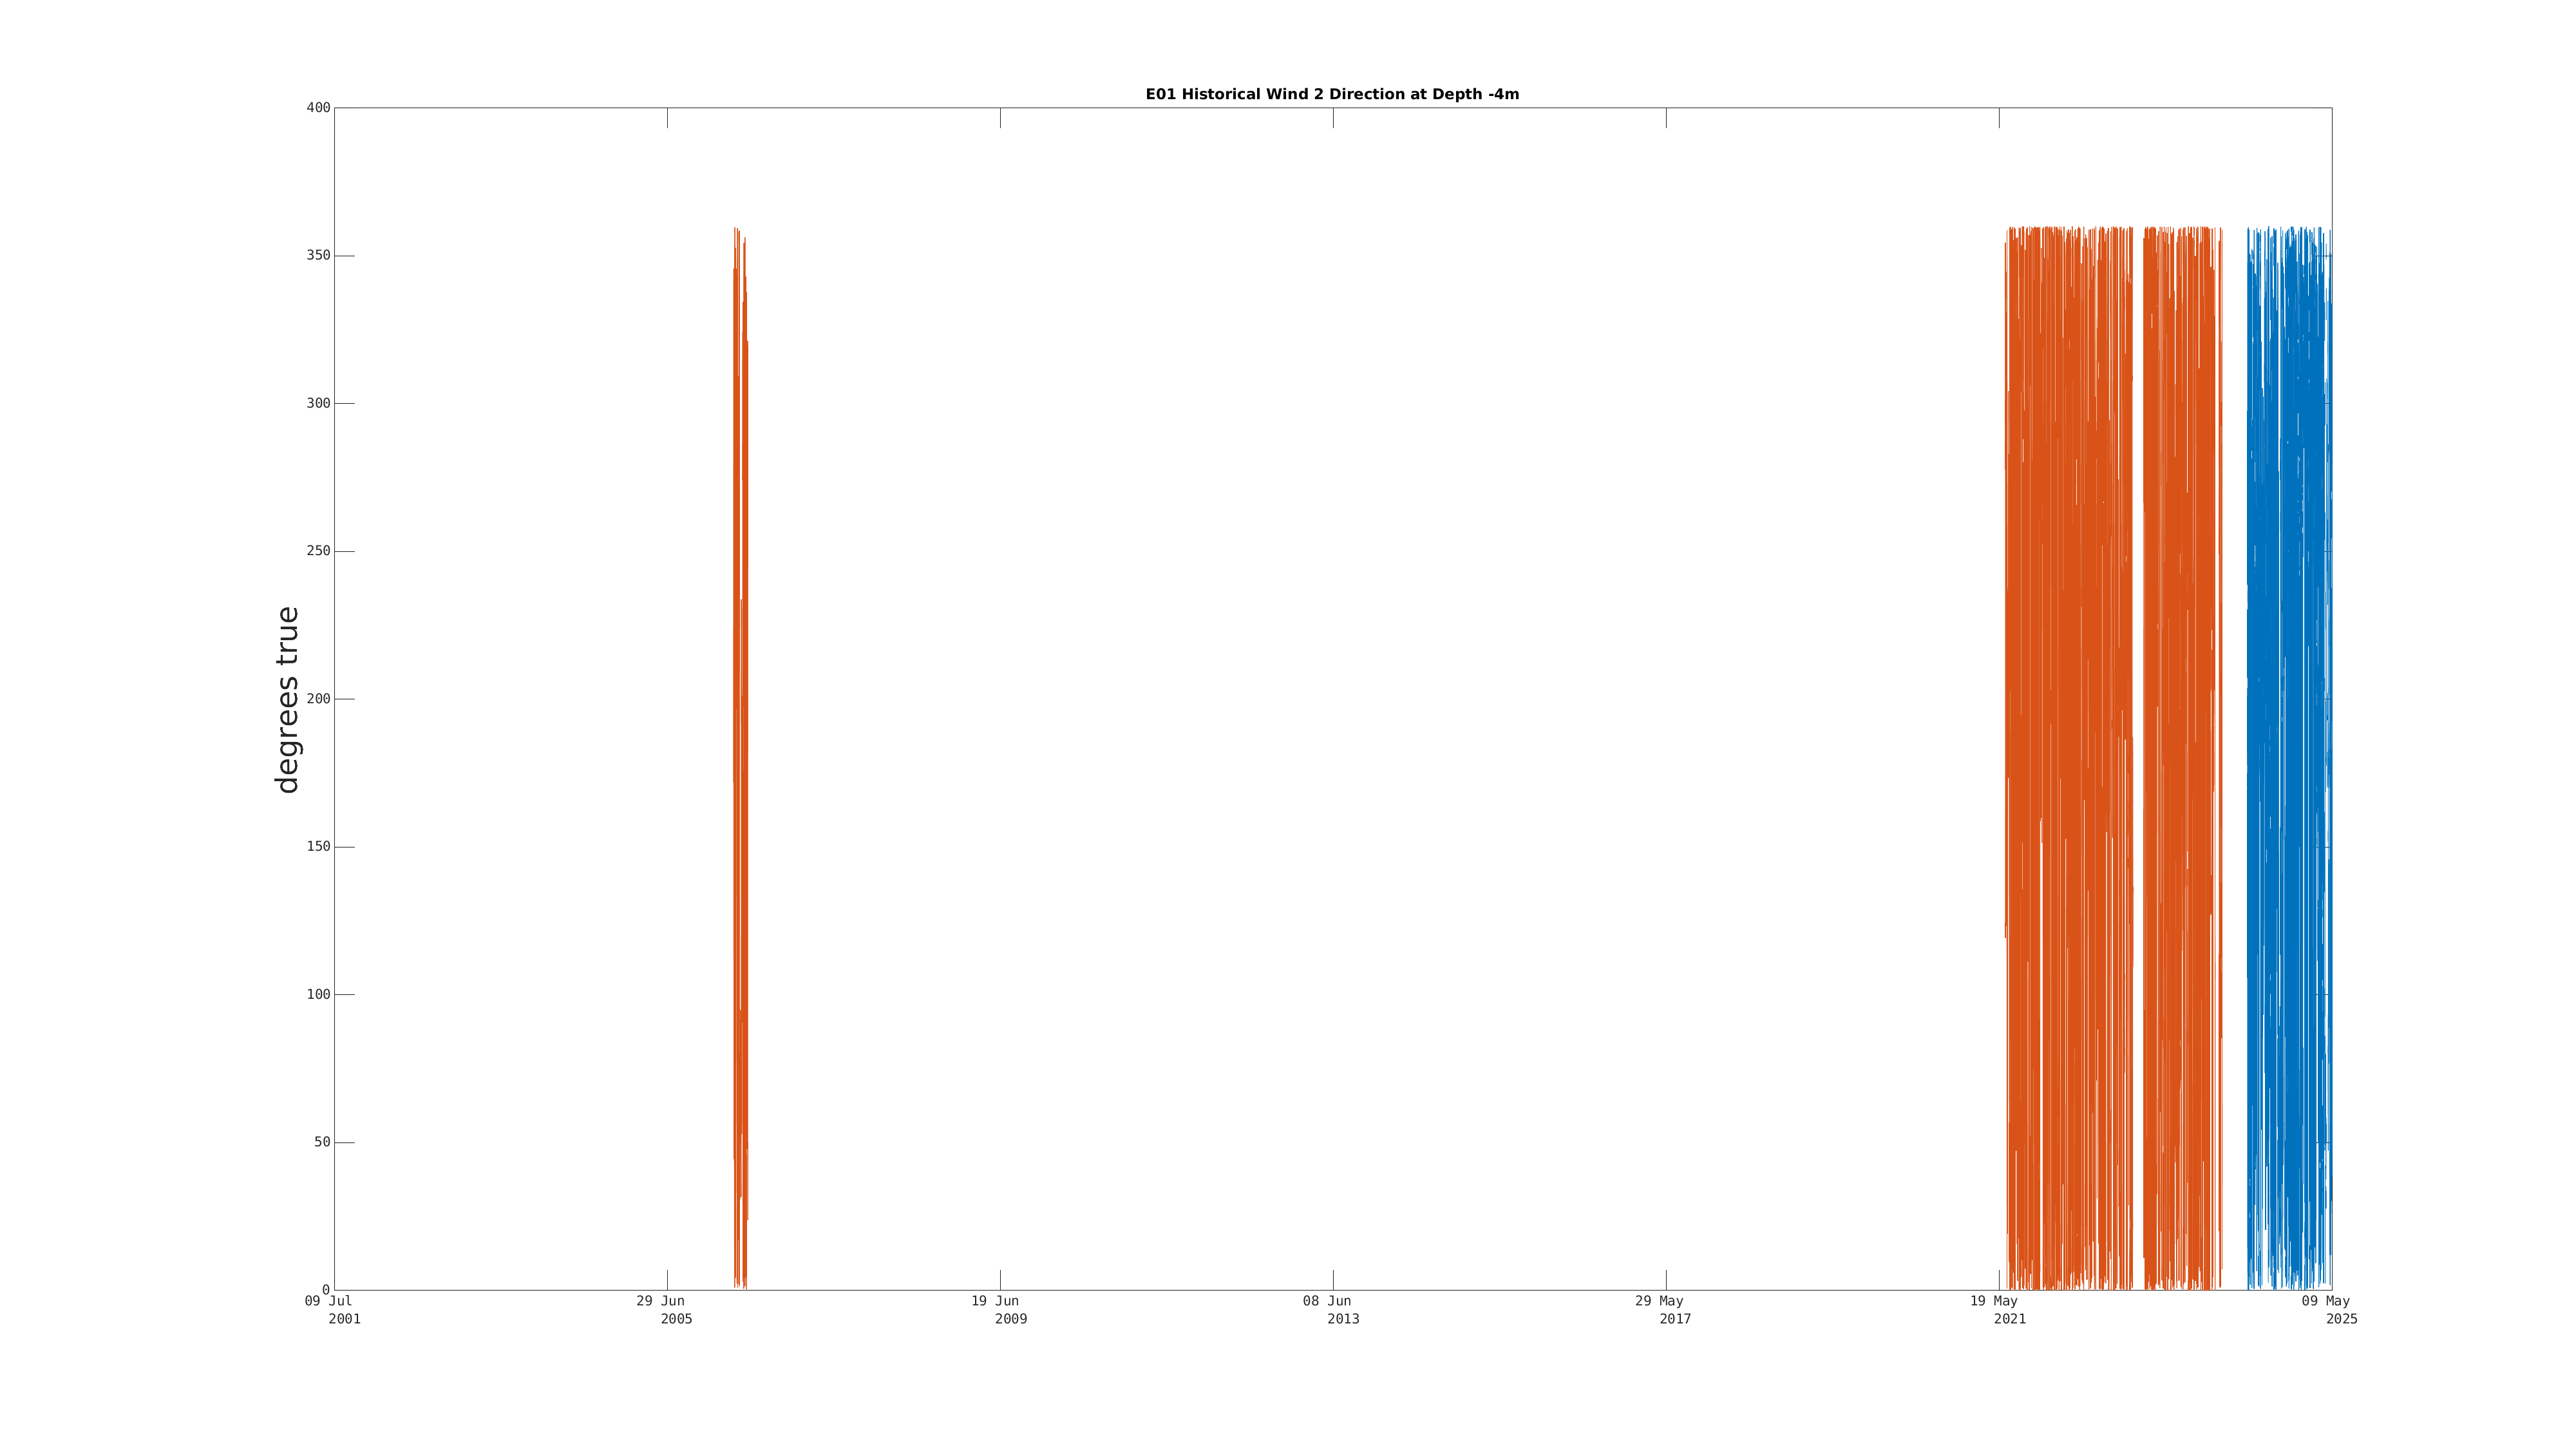
| Wind 2 Direction [Primary] (-4m) | West | Dec 21 9:00 PM |
|
|
|
|
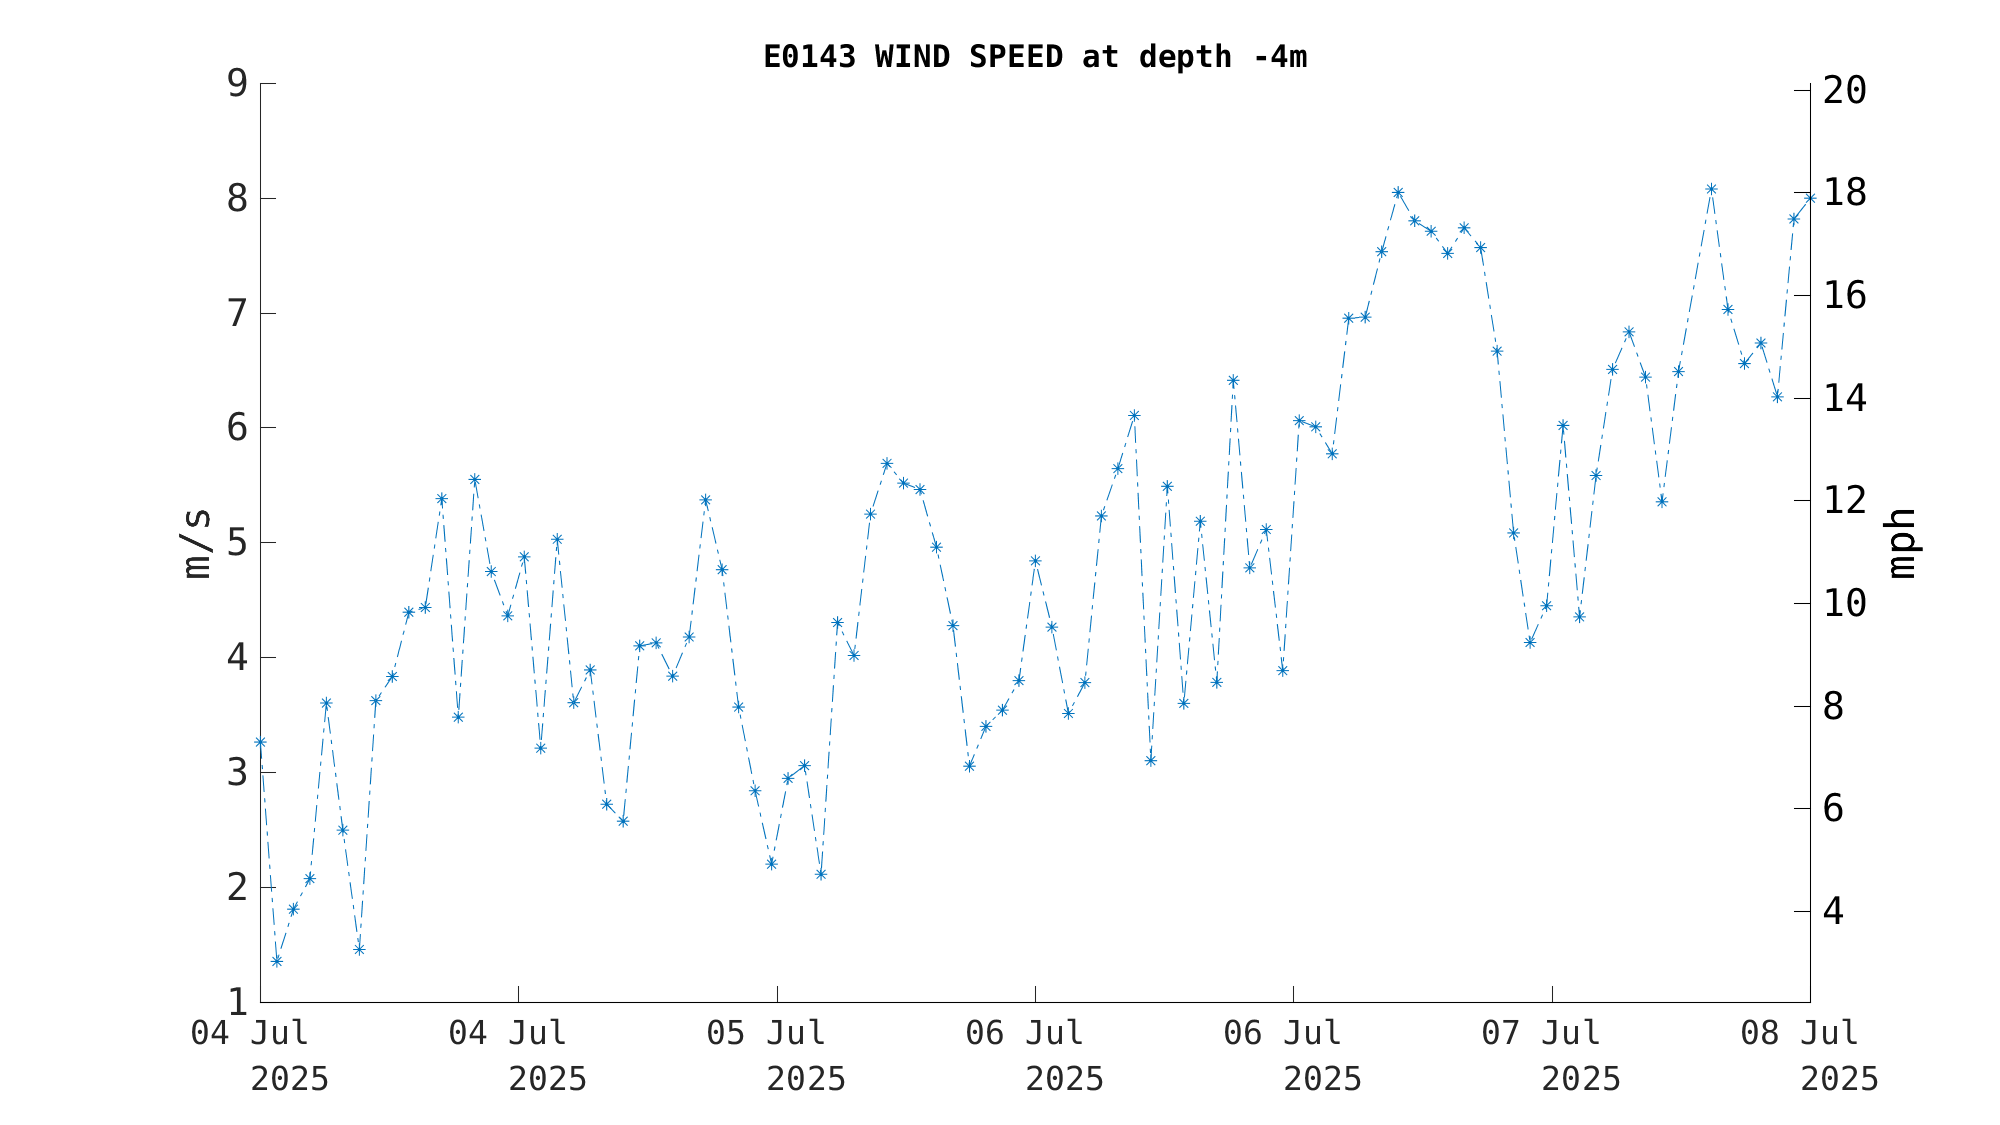
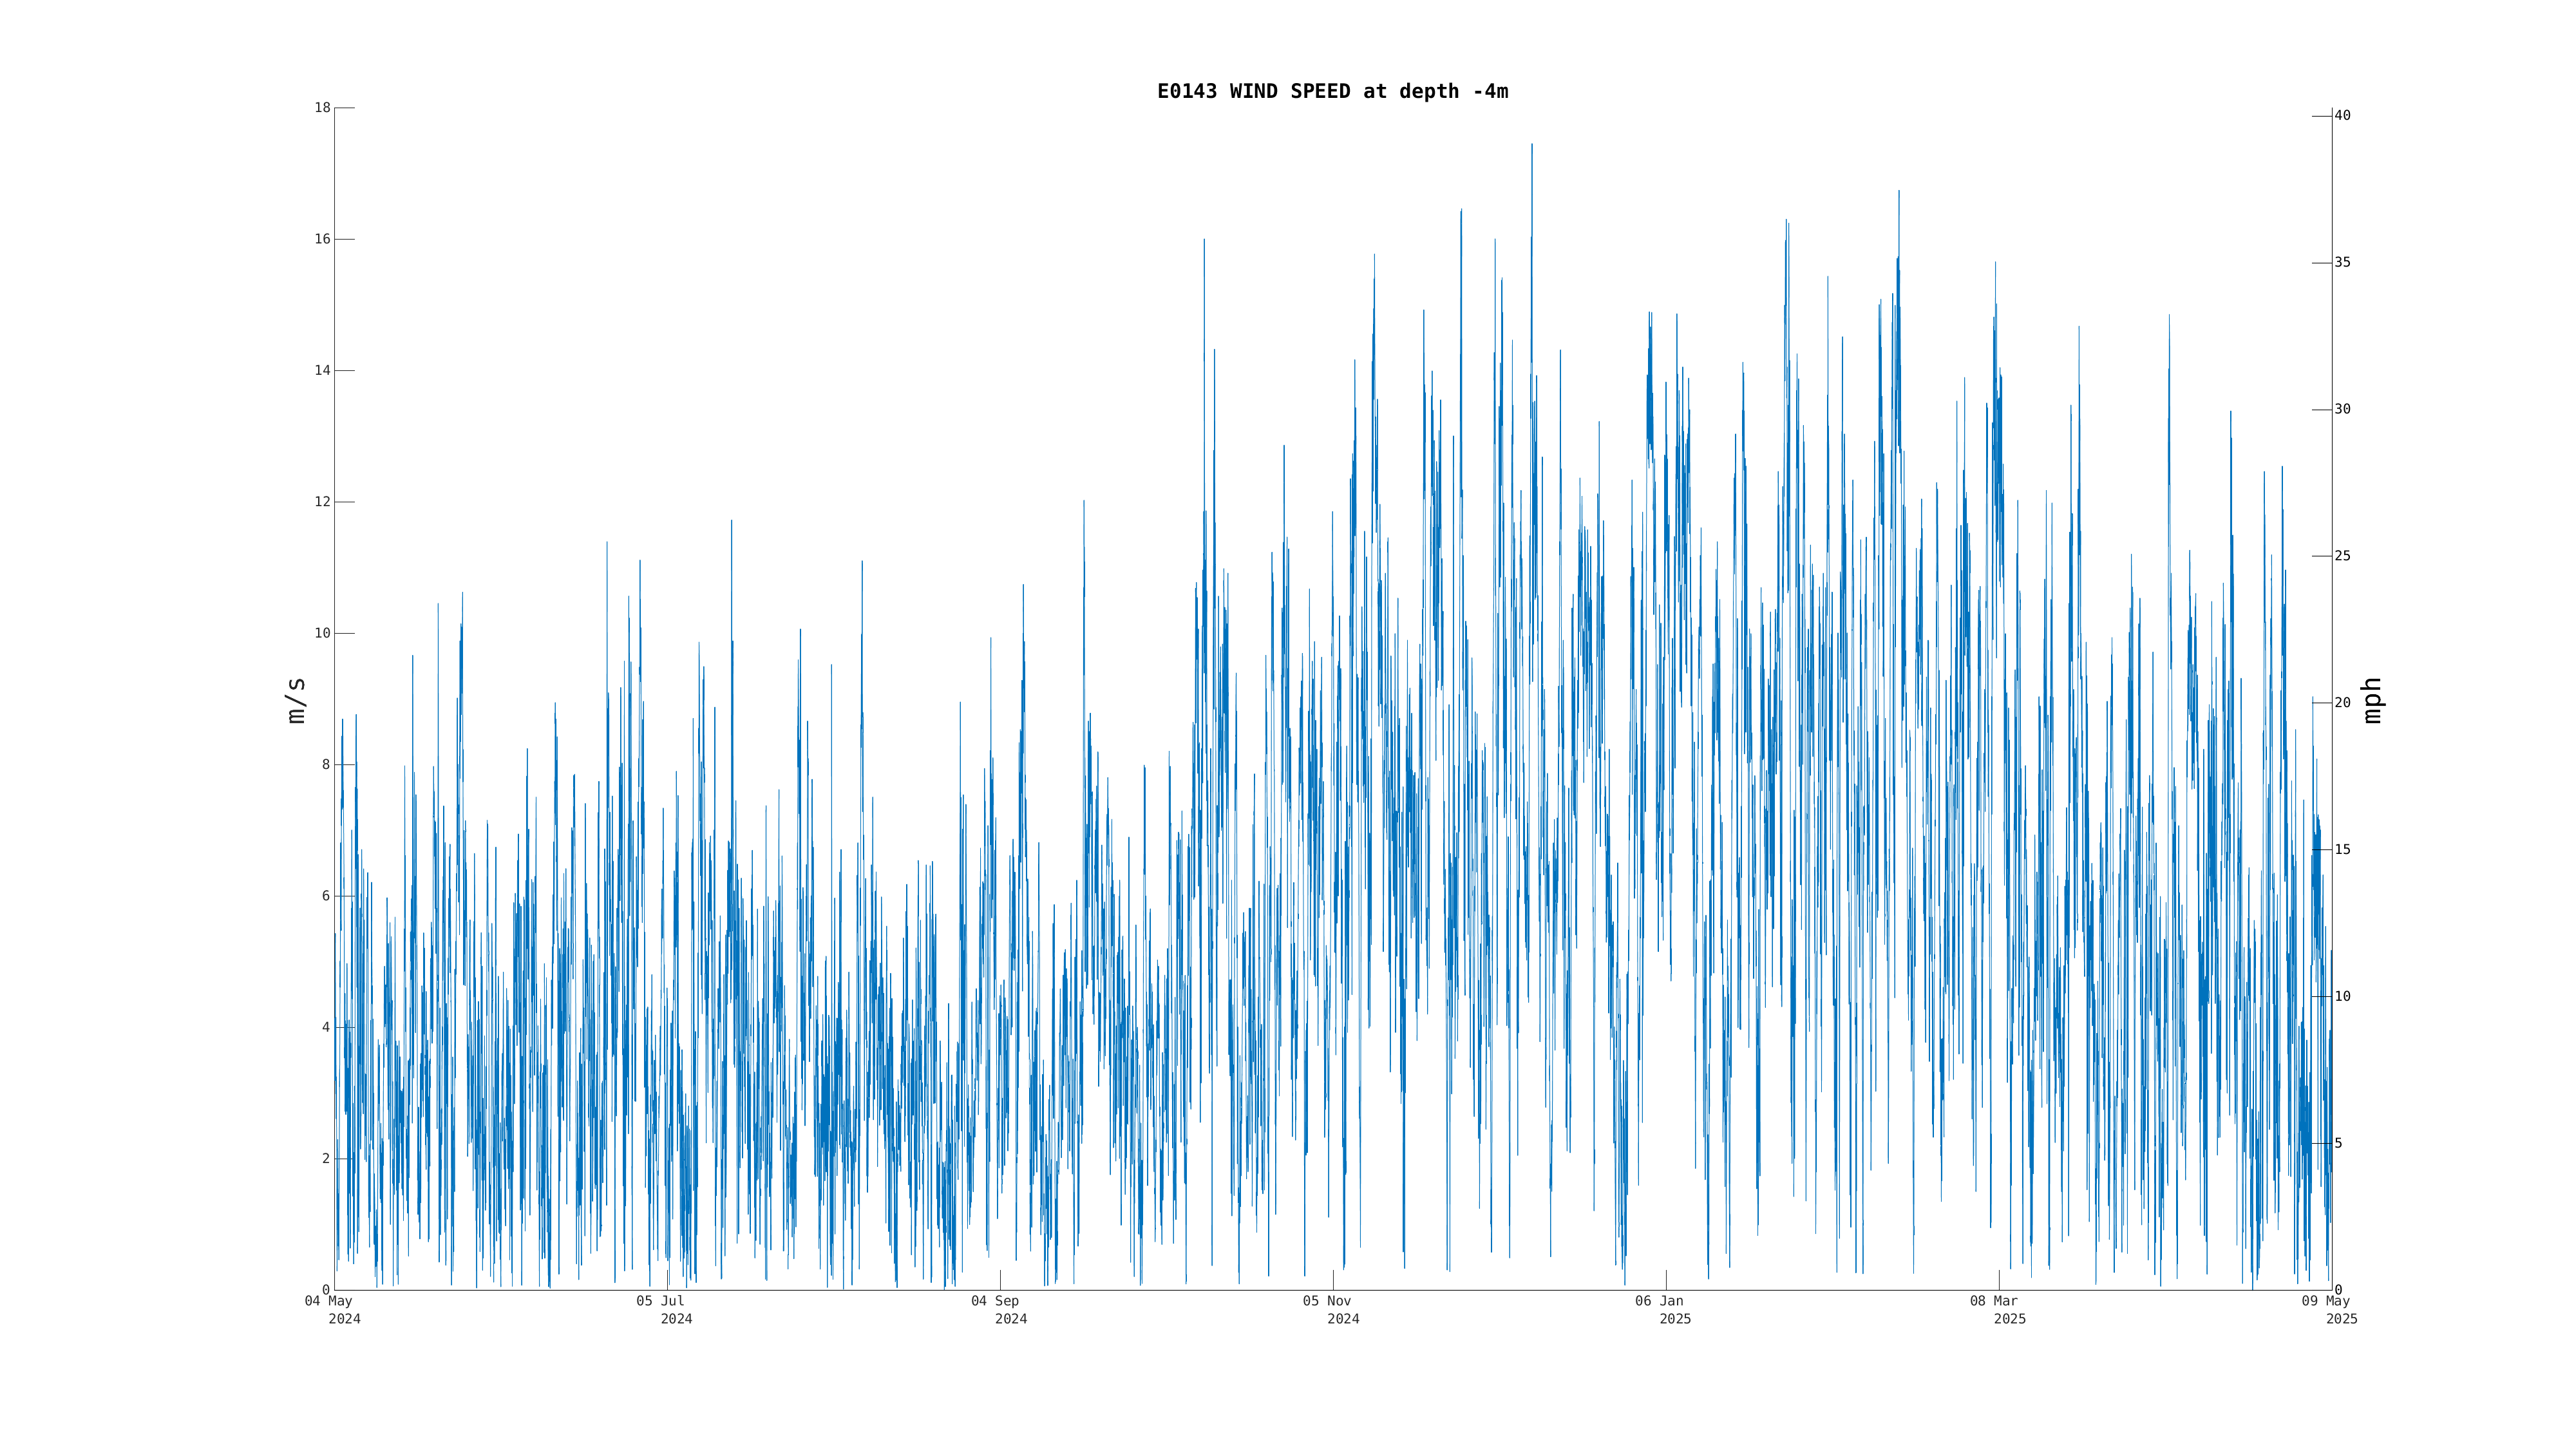
| Wind Speed (-4m) | 0.4 m/s (1 mph, 1 kts) | Dec 21 9:00 PM |
|
|
|
|
| Wind 2 Speed [Primary] (-4m) | 1.0 m/s (2 mph, 2 kts) | Dec 21 9:00 PM |
|
|
|
|
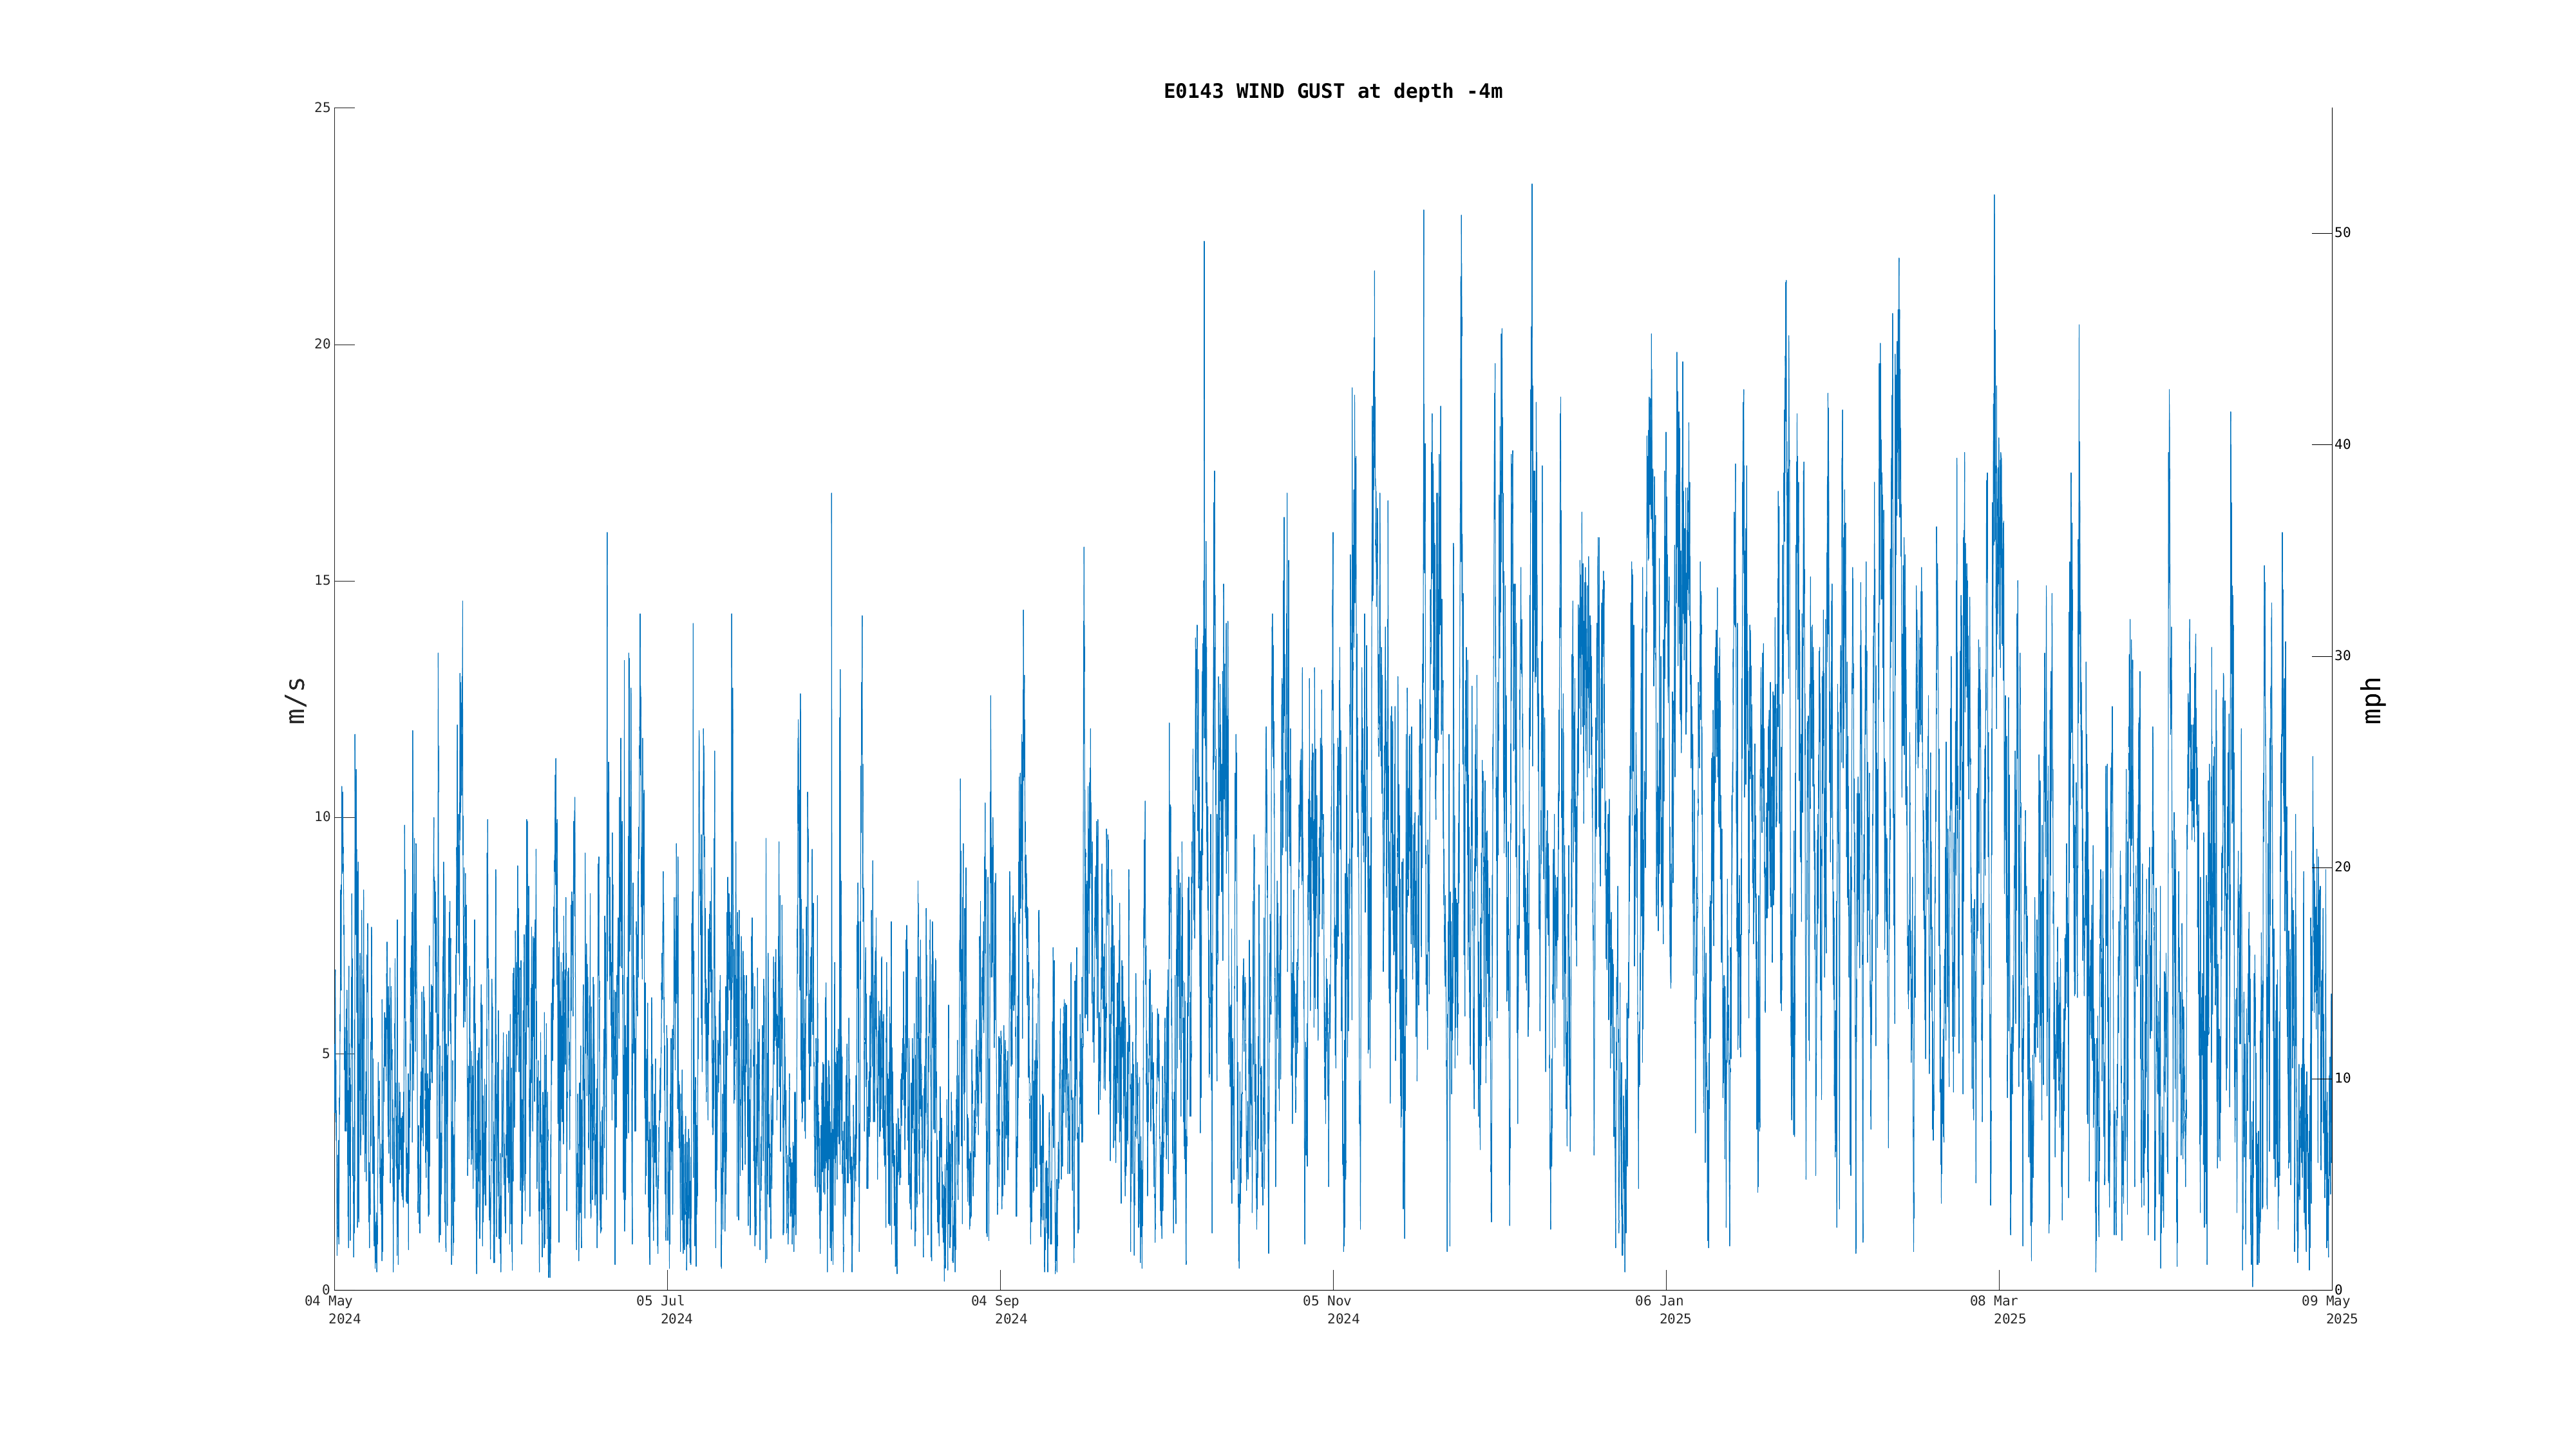
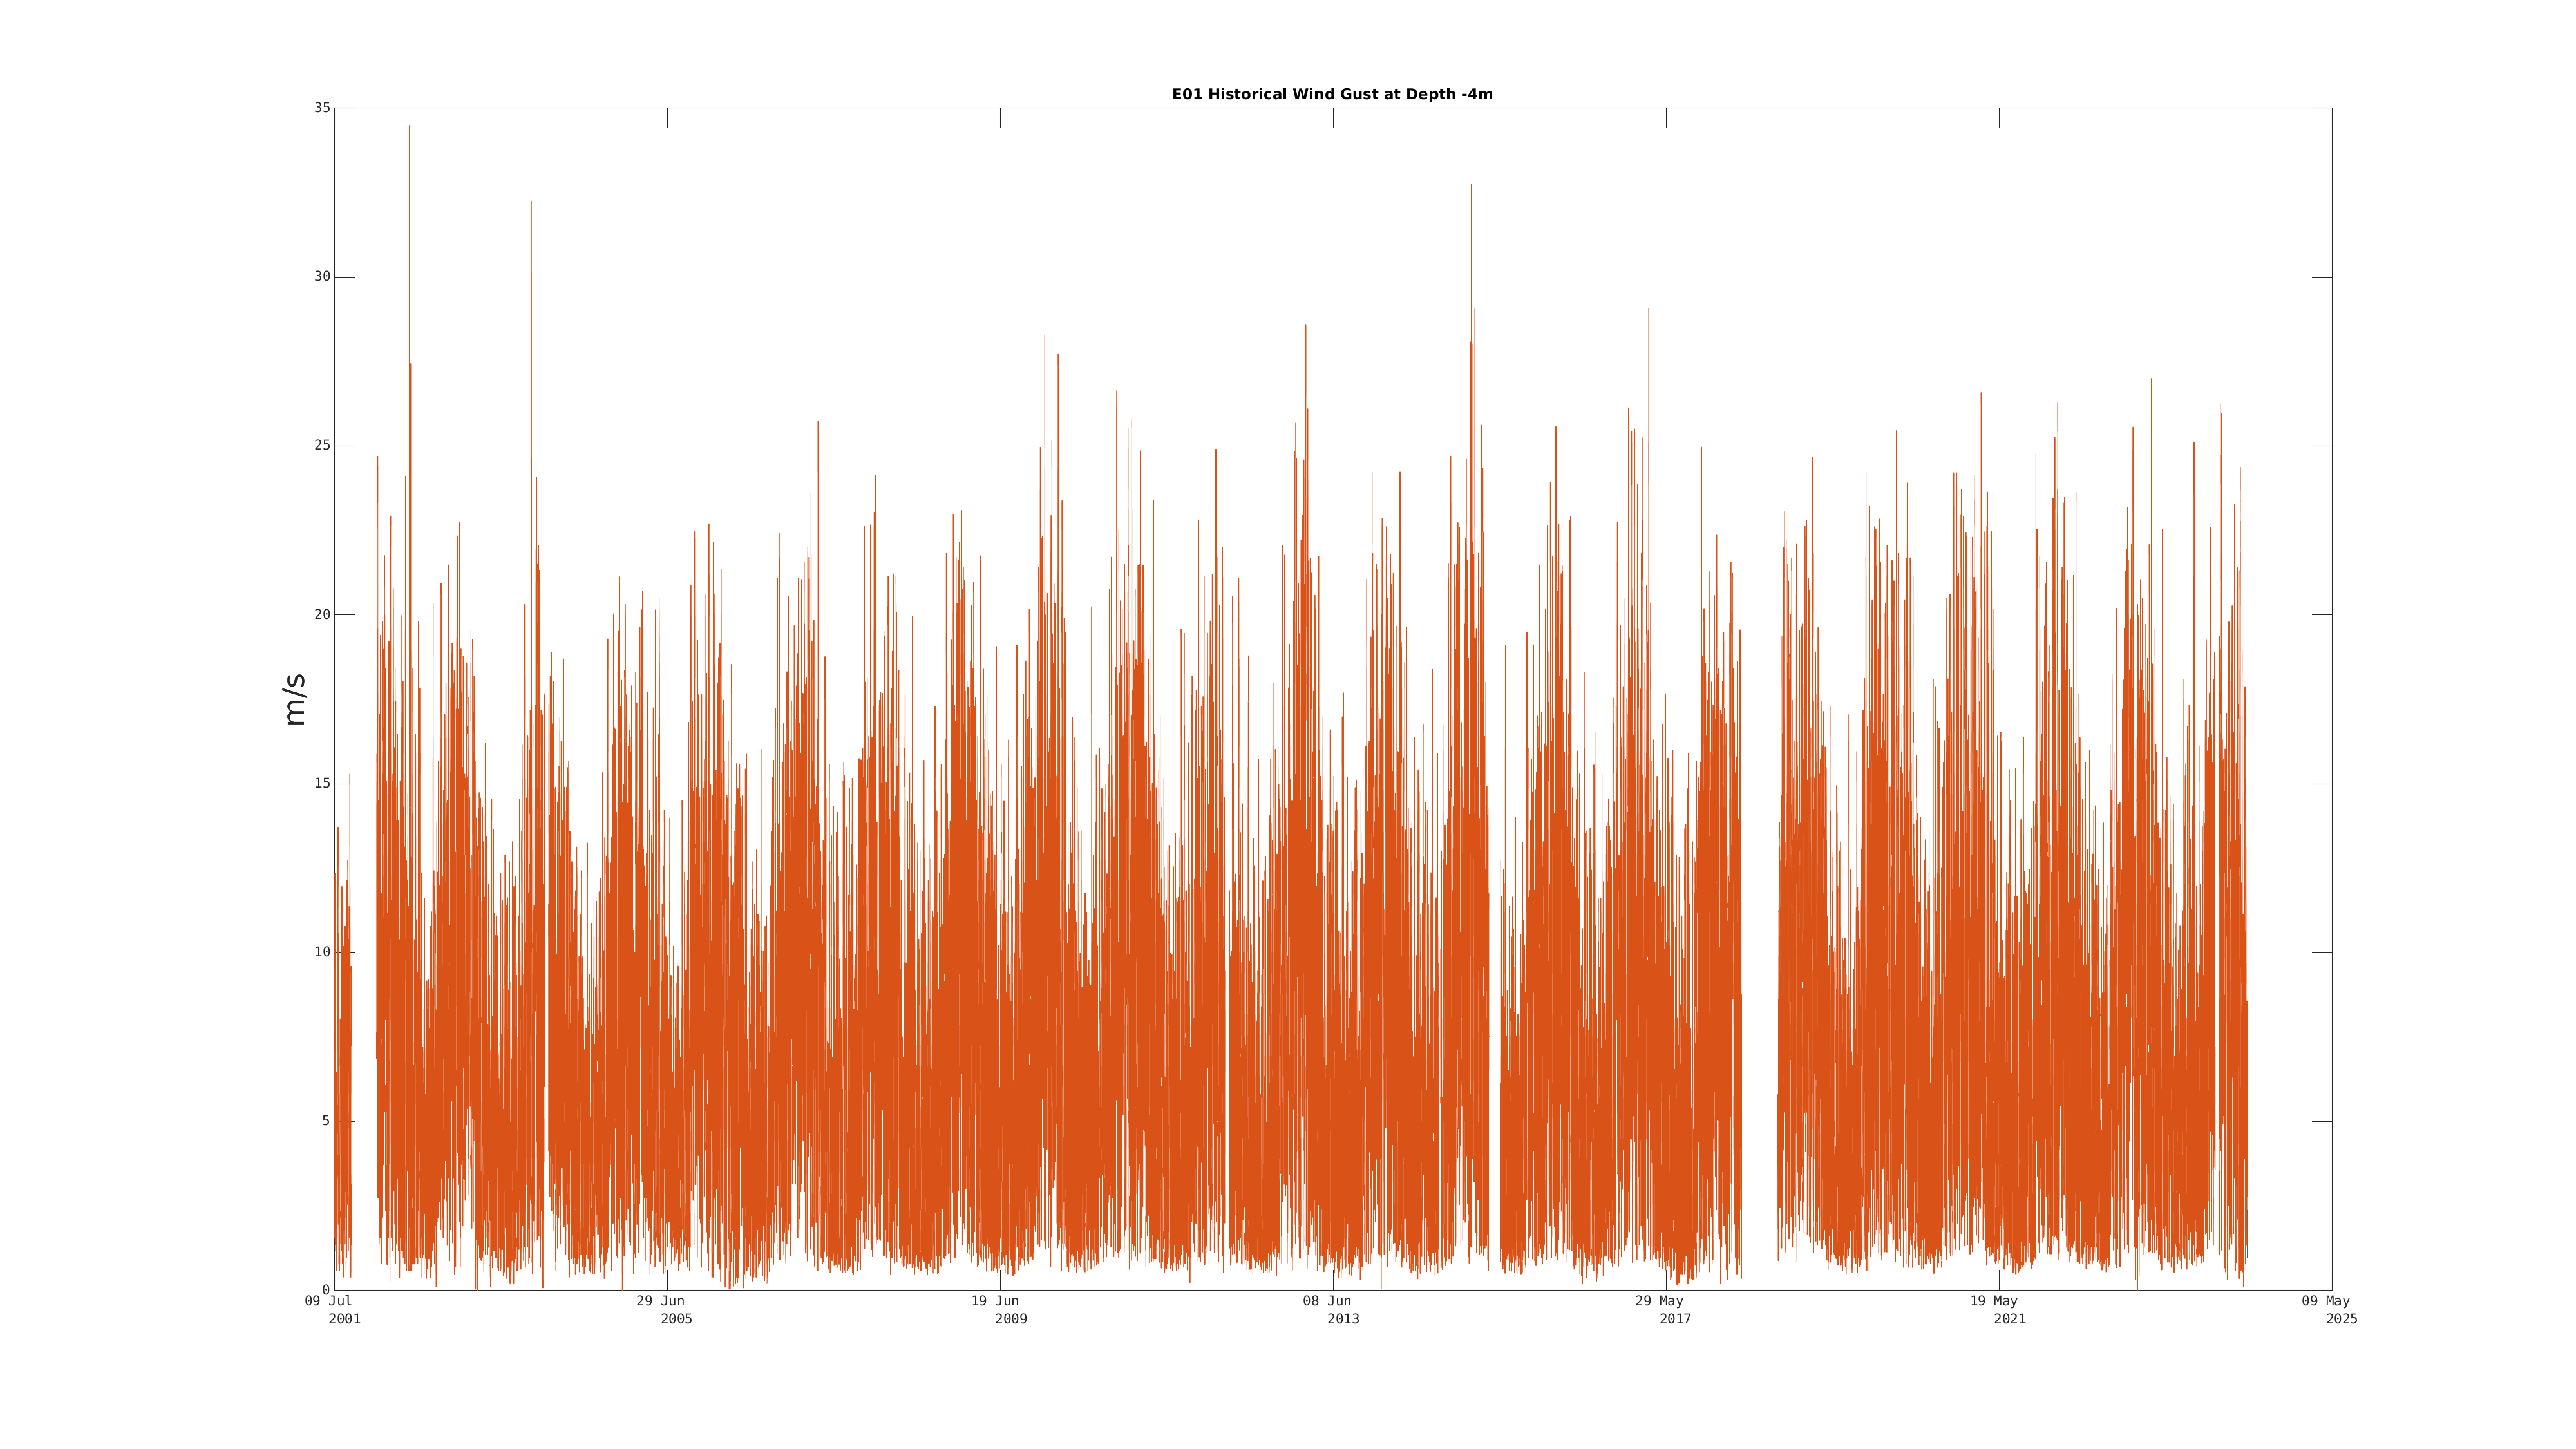
| Wind Gust (-4m) | 2.8 m/s (6 mph, 5 kts) | Dec 21 9:00 PM |
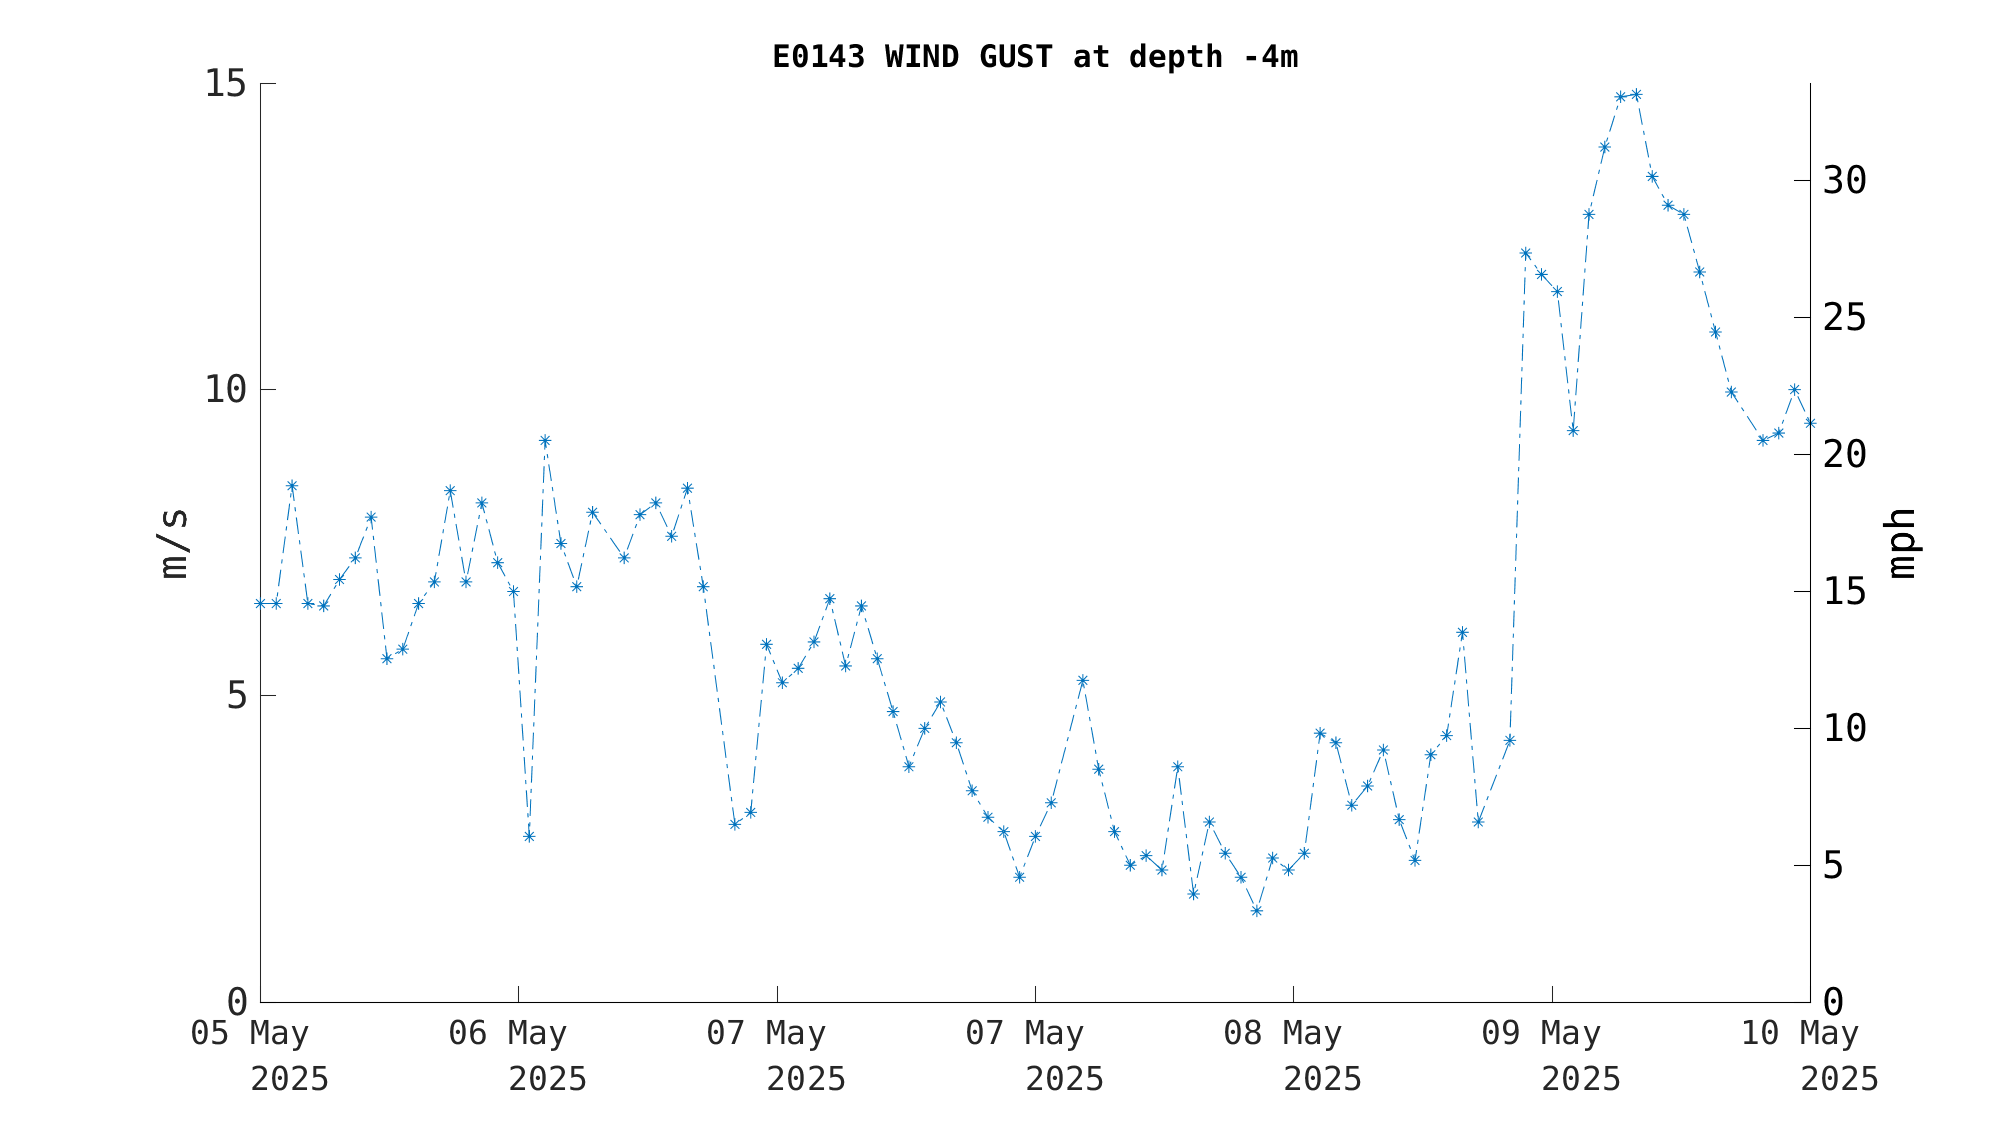
|
|
|
|
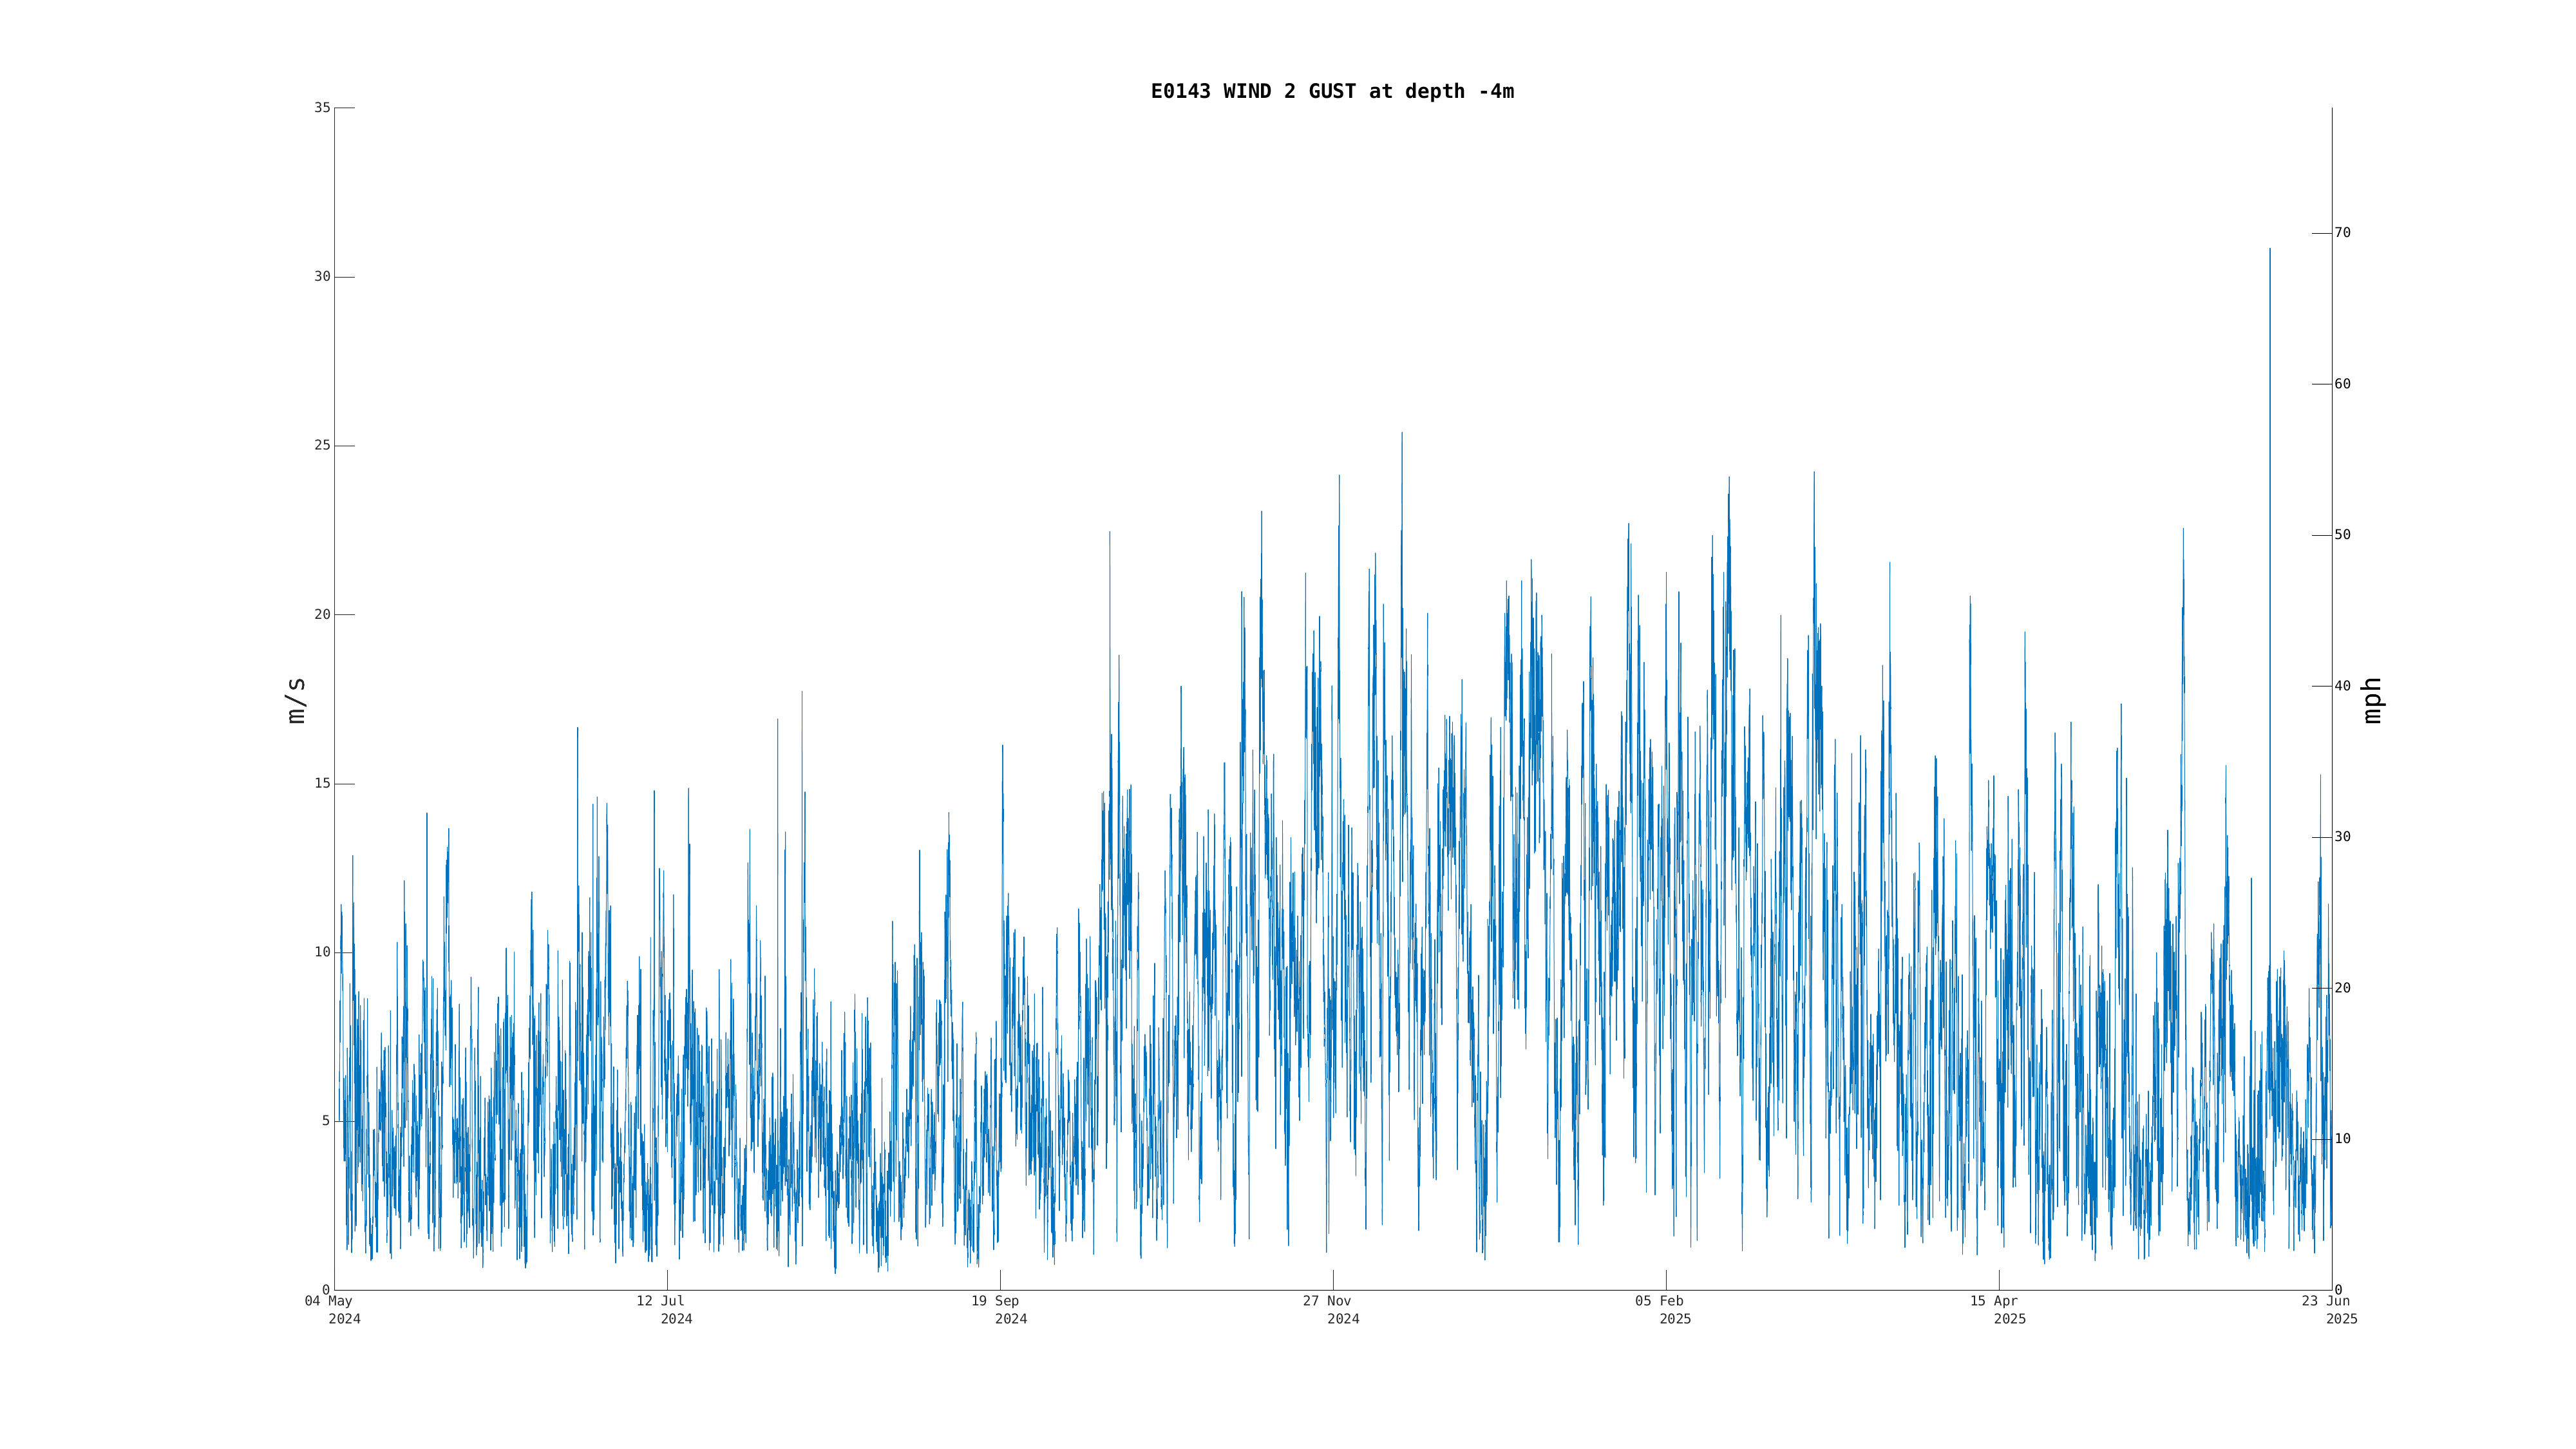
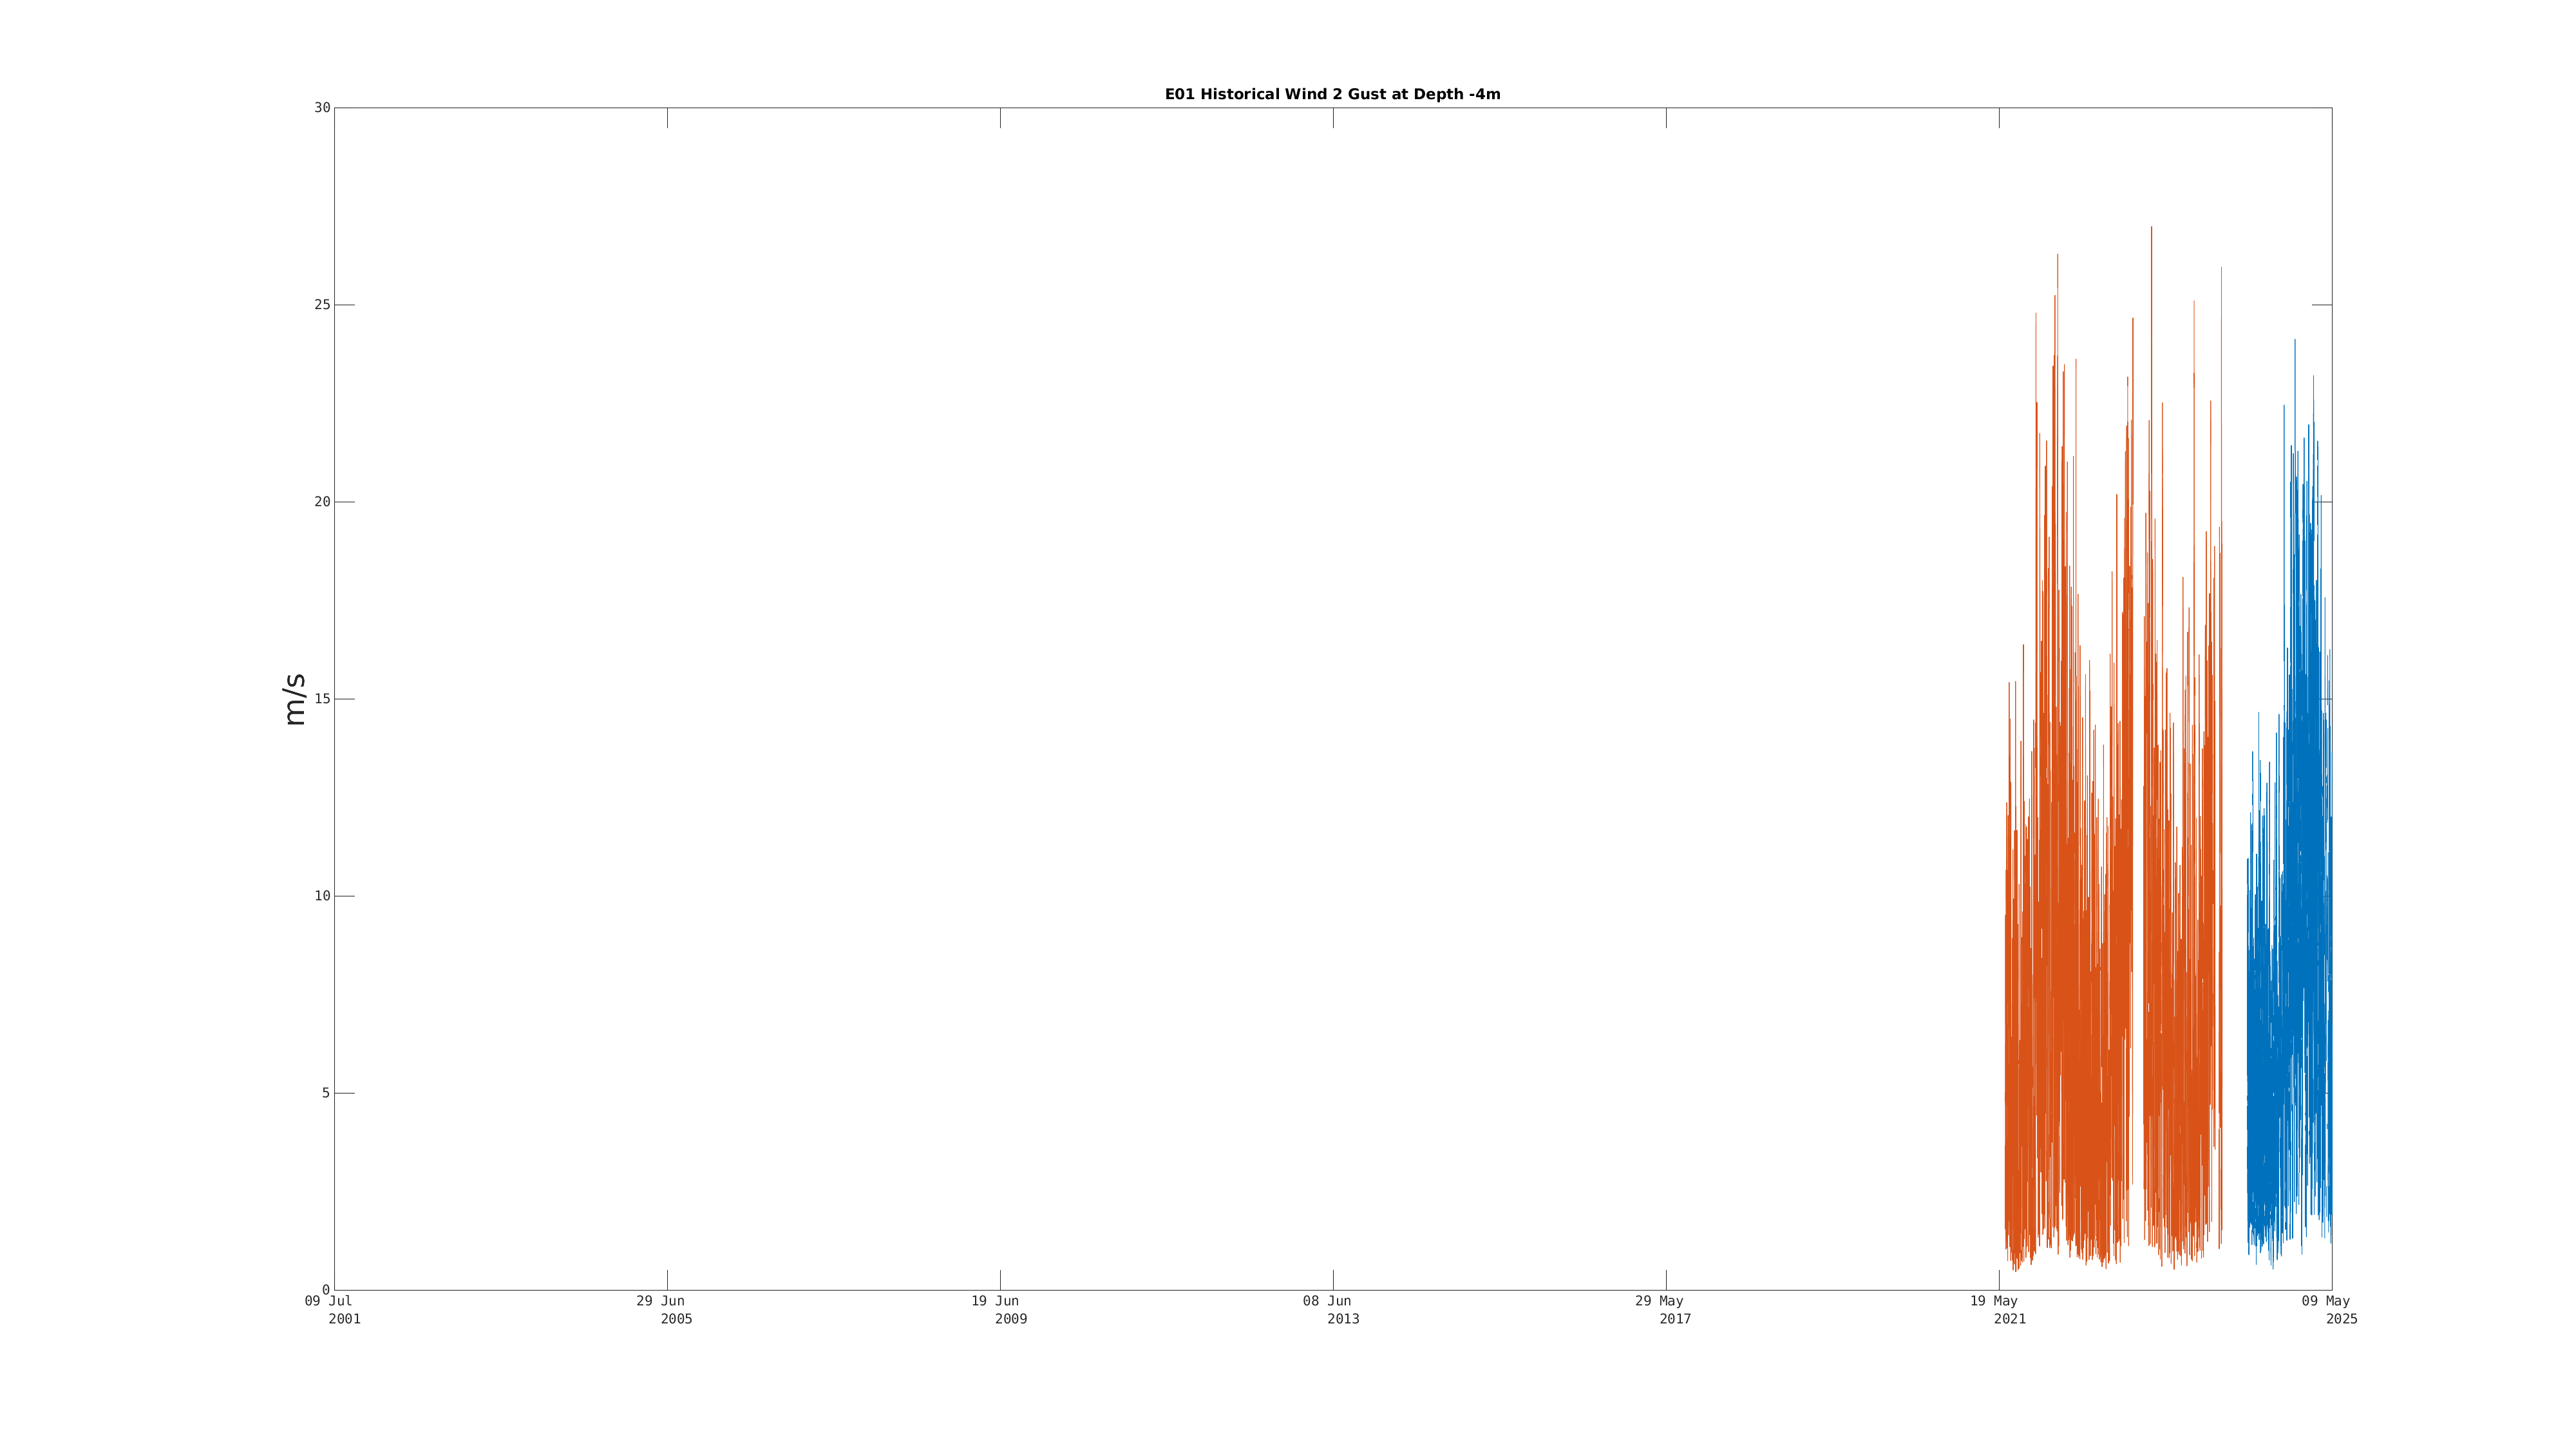
| Wind 2 Gust [Primary] (-4m) | 5.0 m/s (11 mph, 10 kts) | Dec 21 9:00 PM |
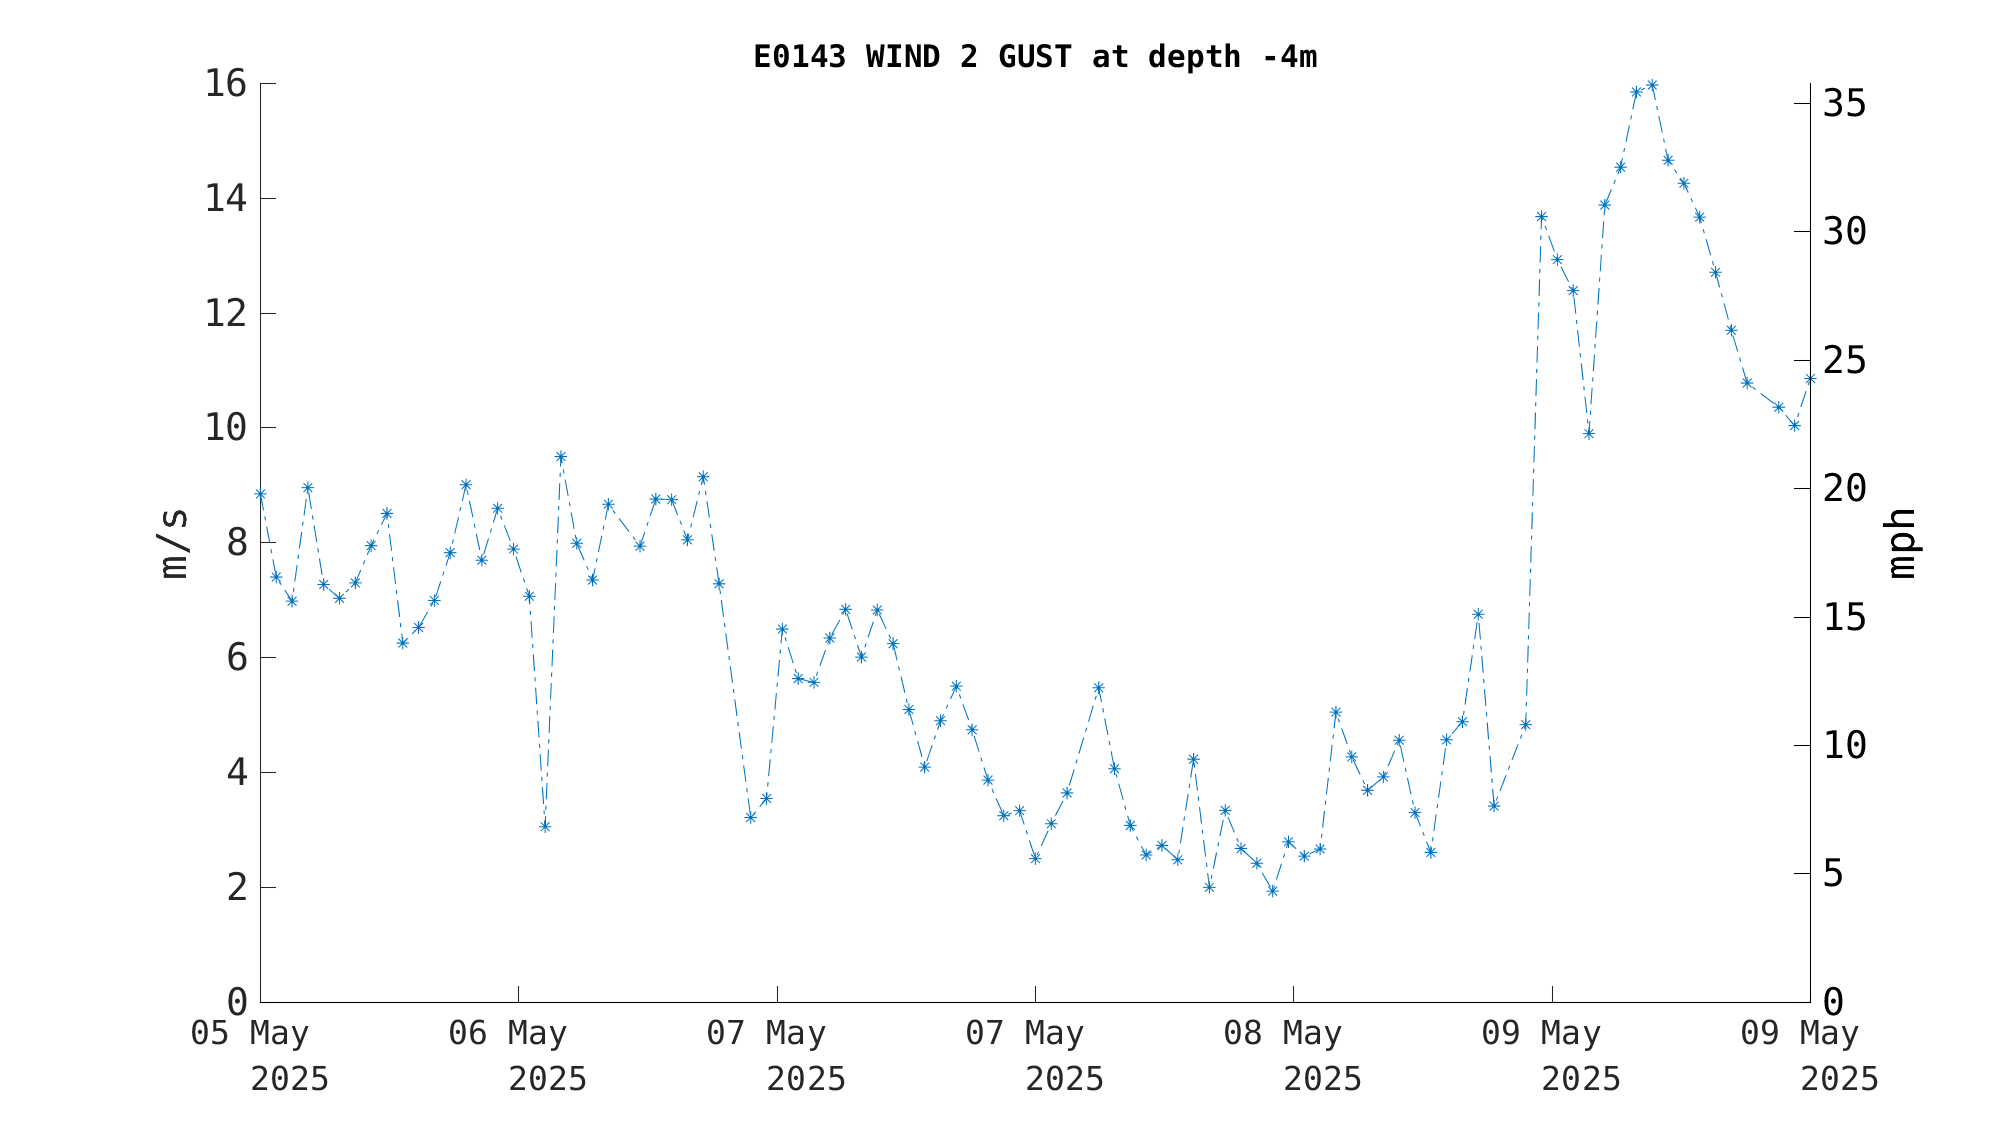
|
|
|
|
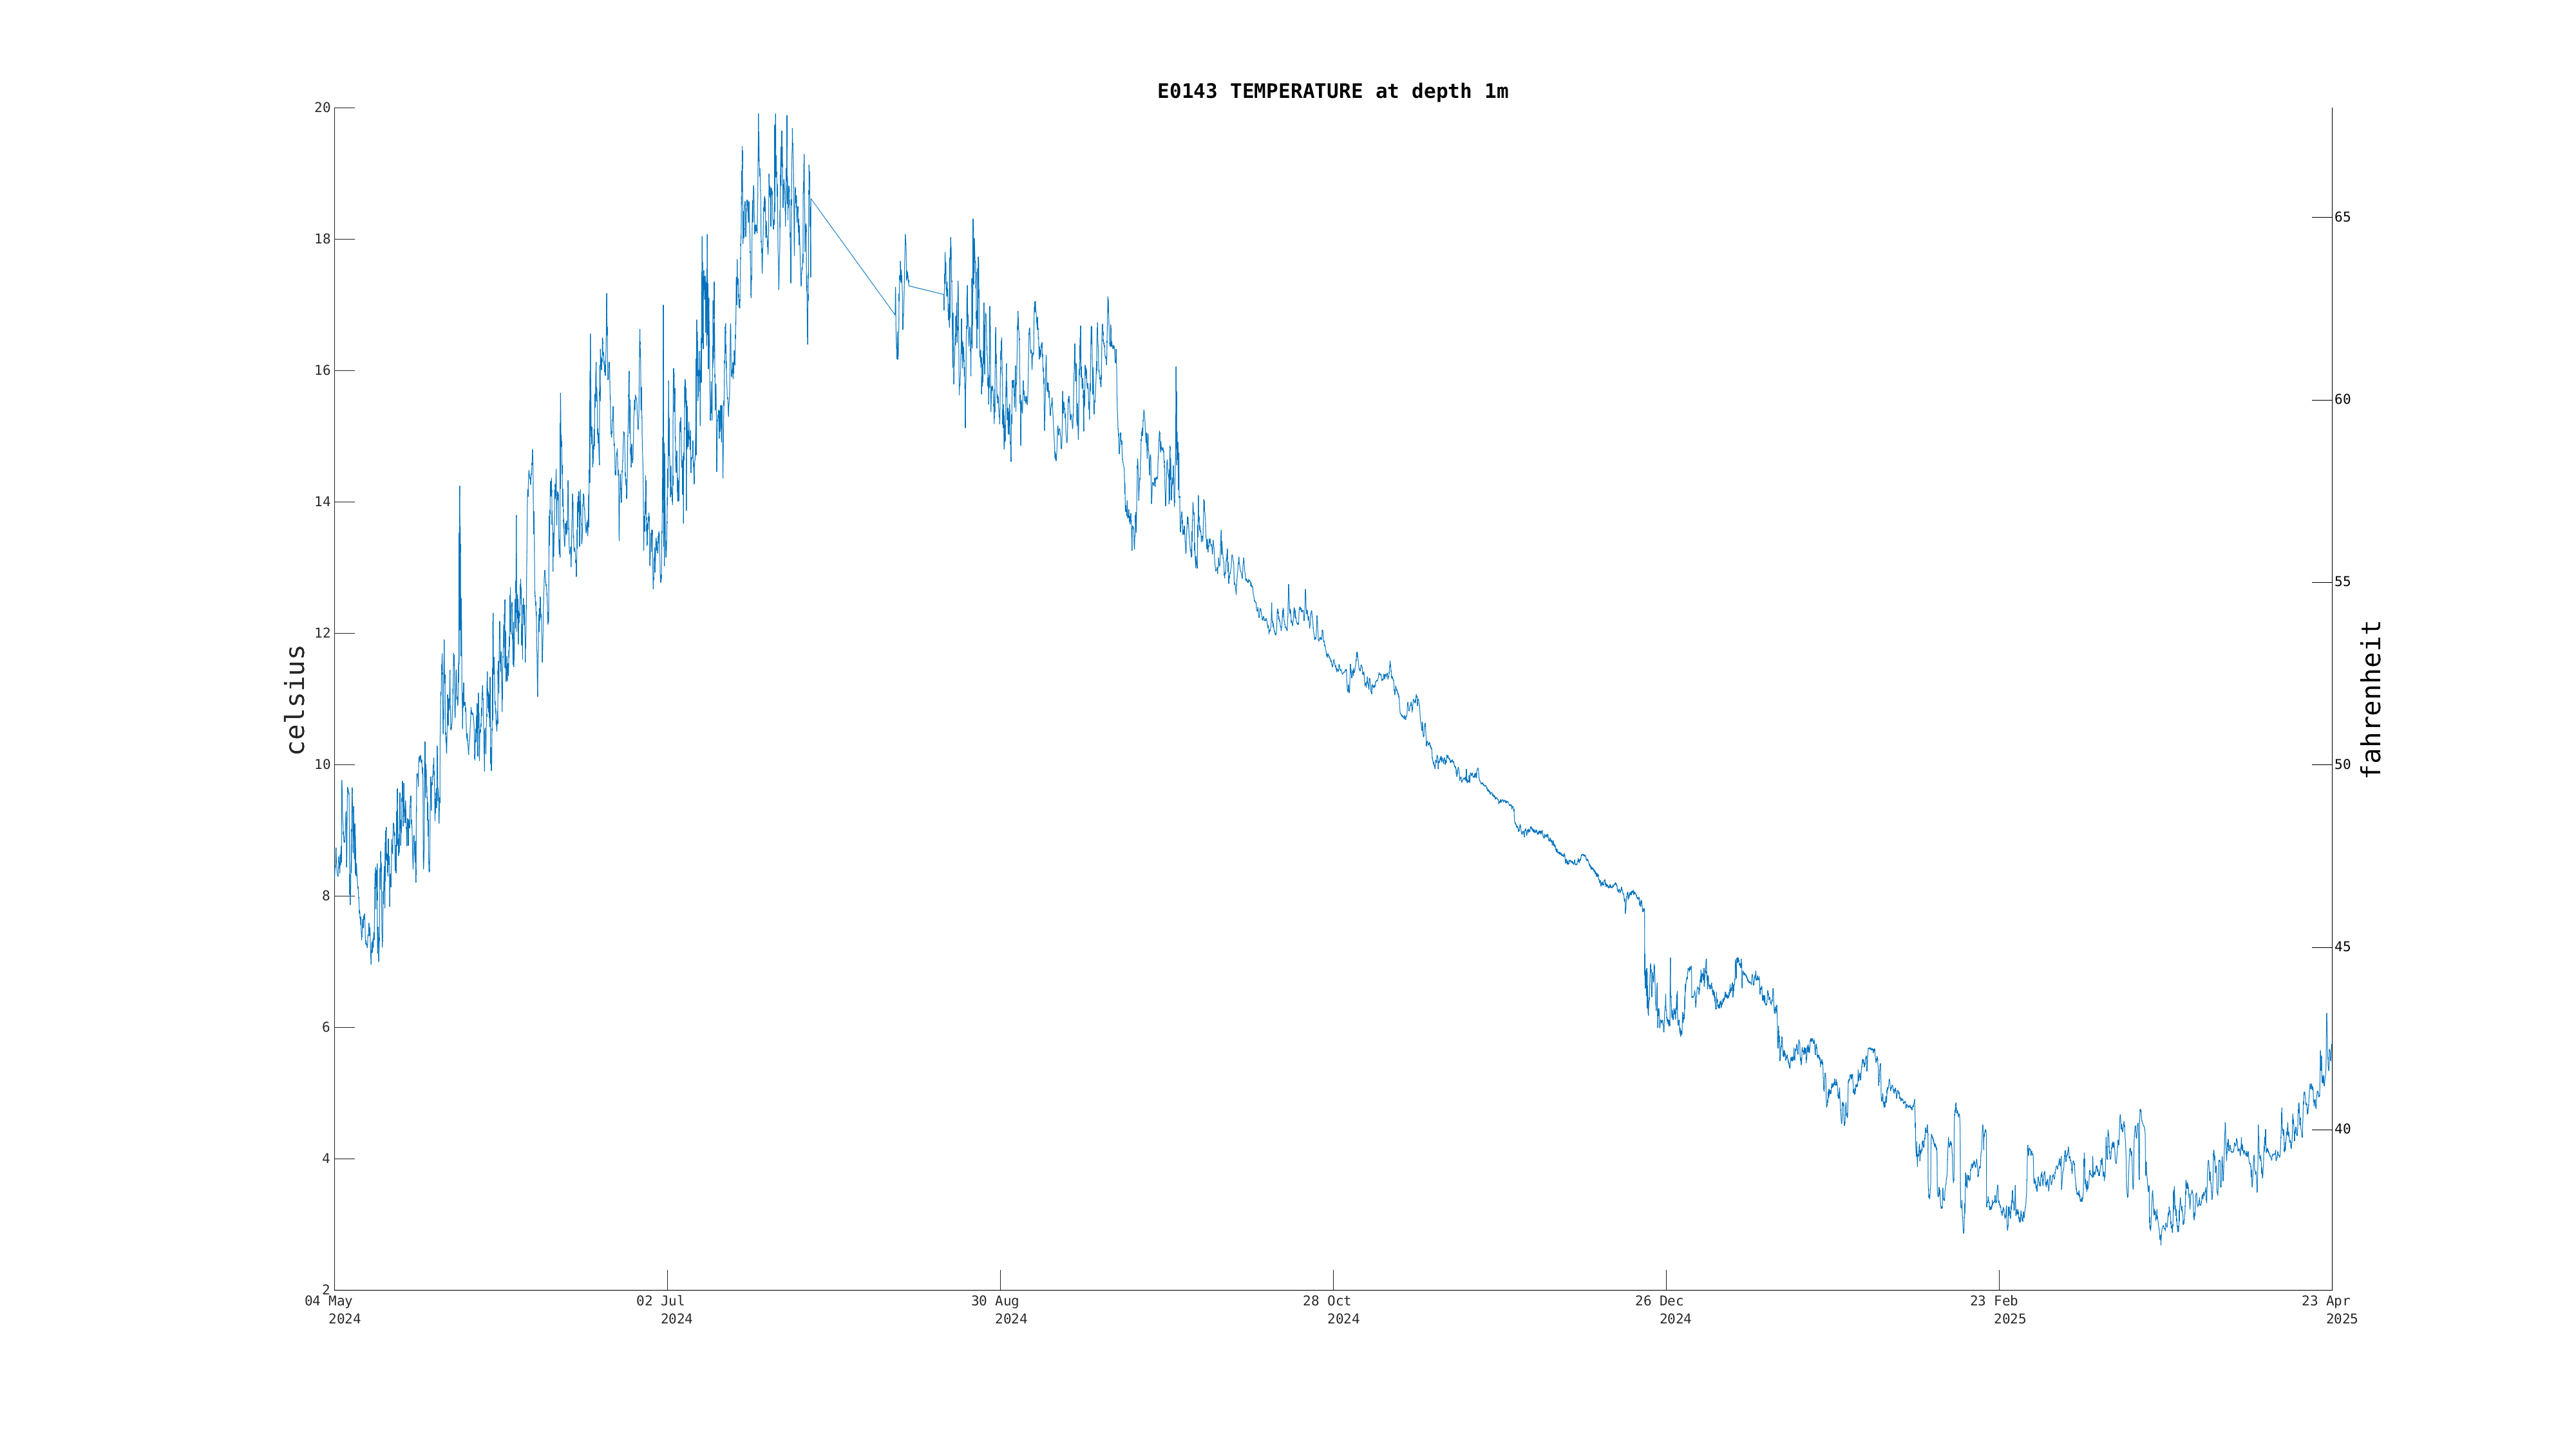
| Water Temperature (1m) | Sensor Failure | Oct 09 6:00 AM |
|
|
|
|
| Water Temperature (2m) | Sensor Failure | Oct 08 12:00 PM |
|
|
|
|
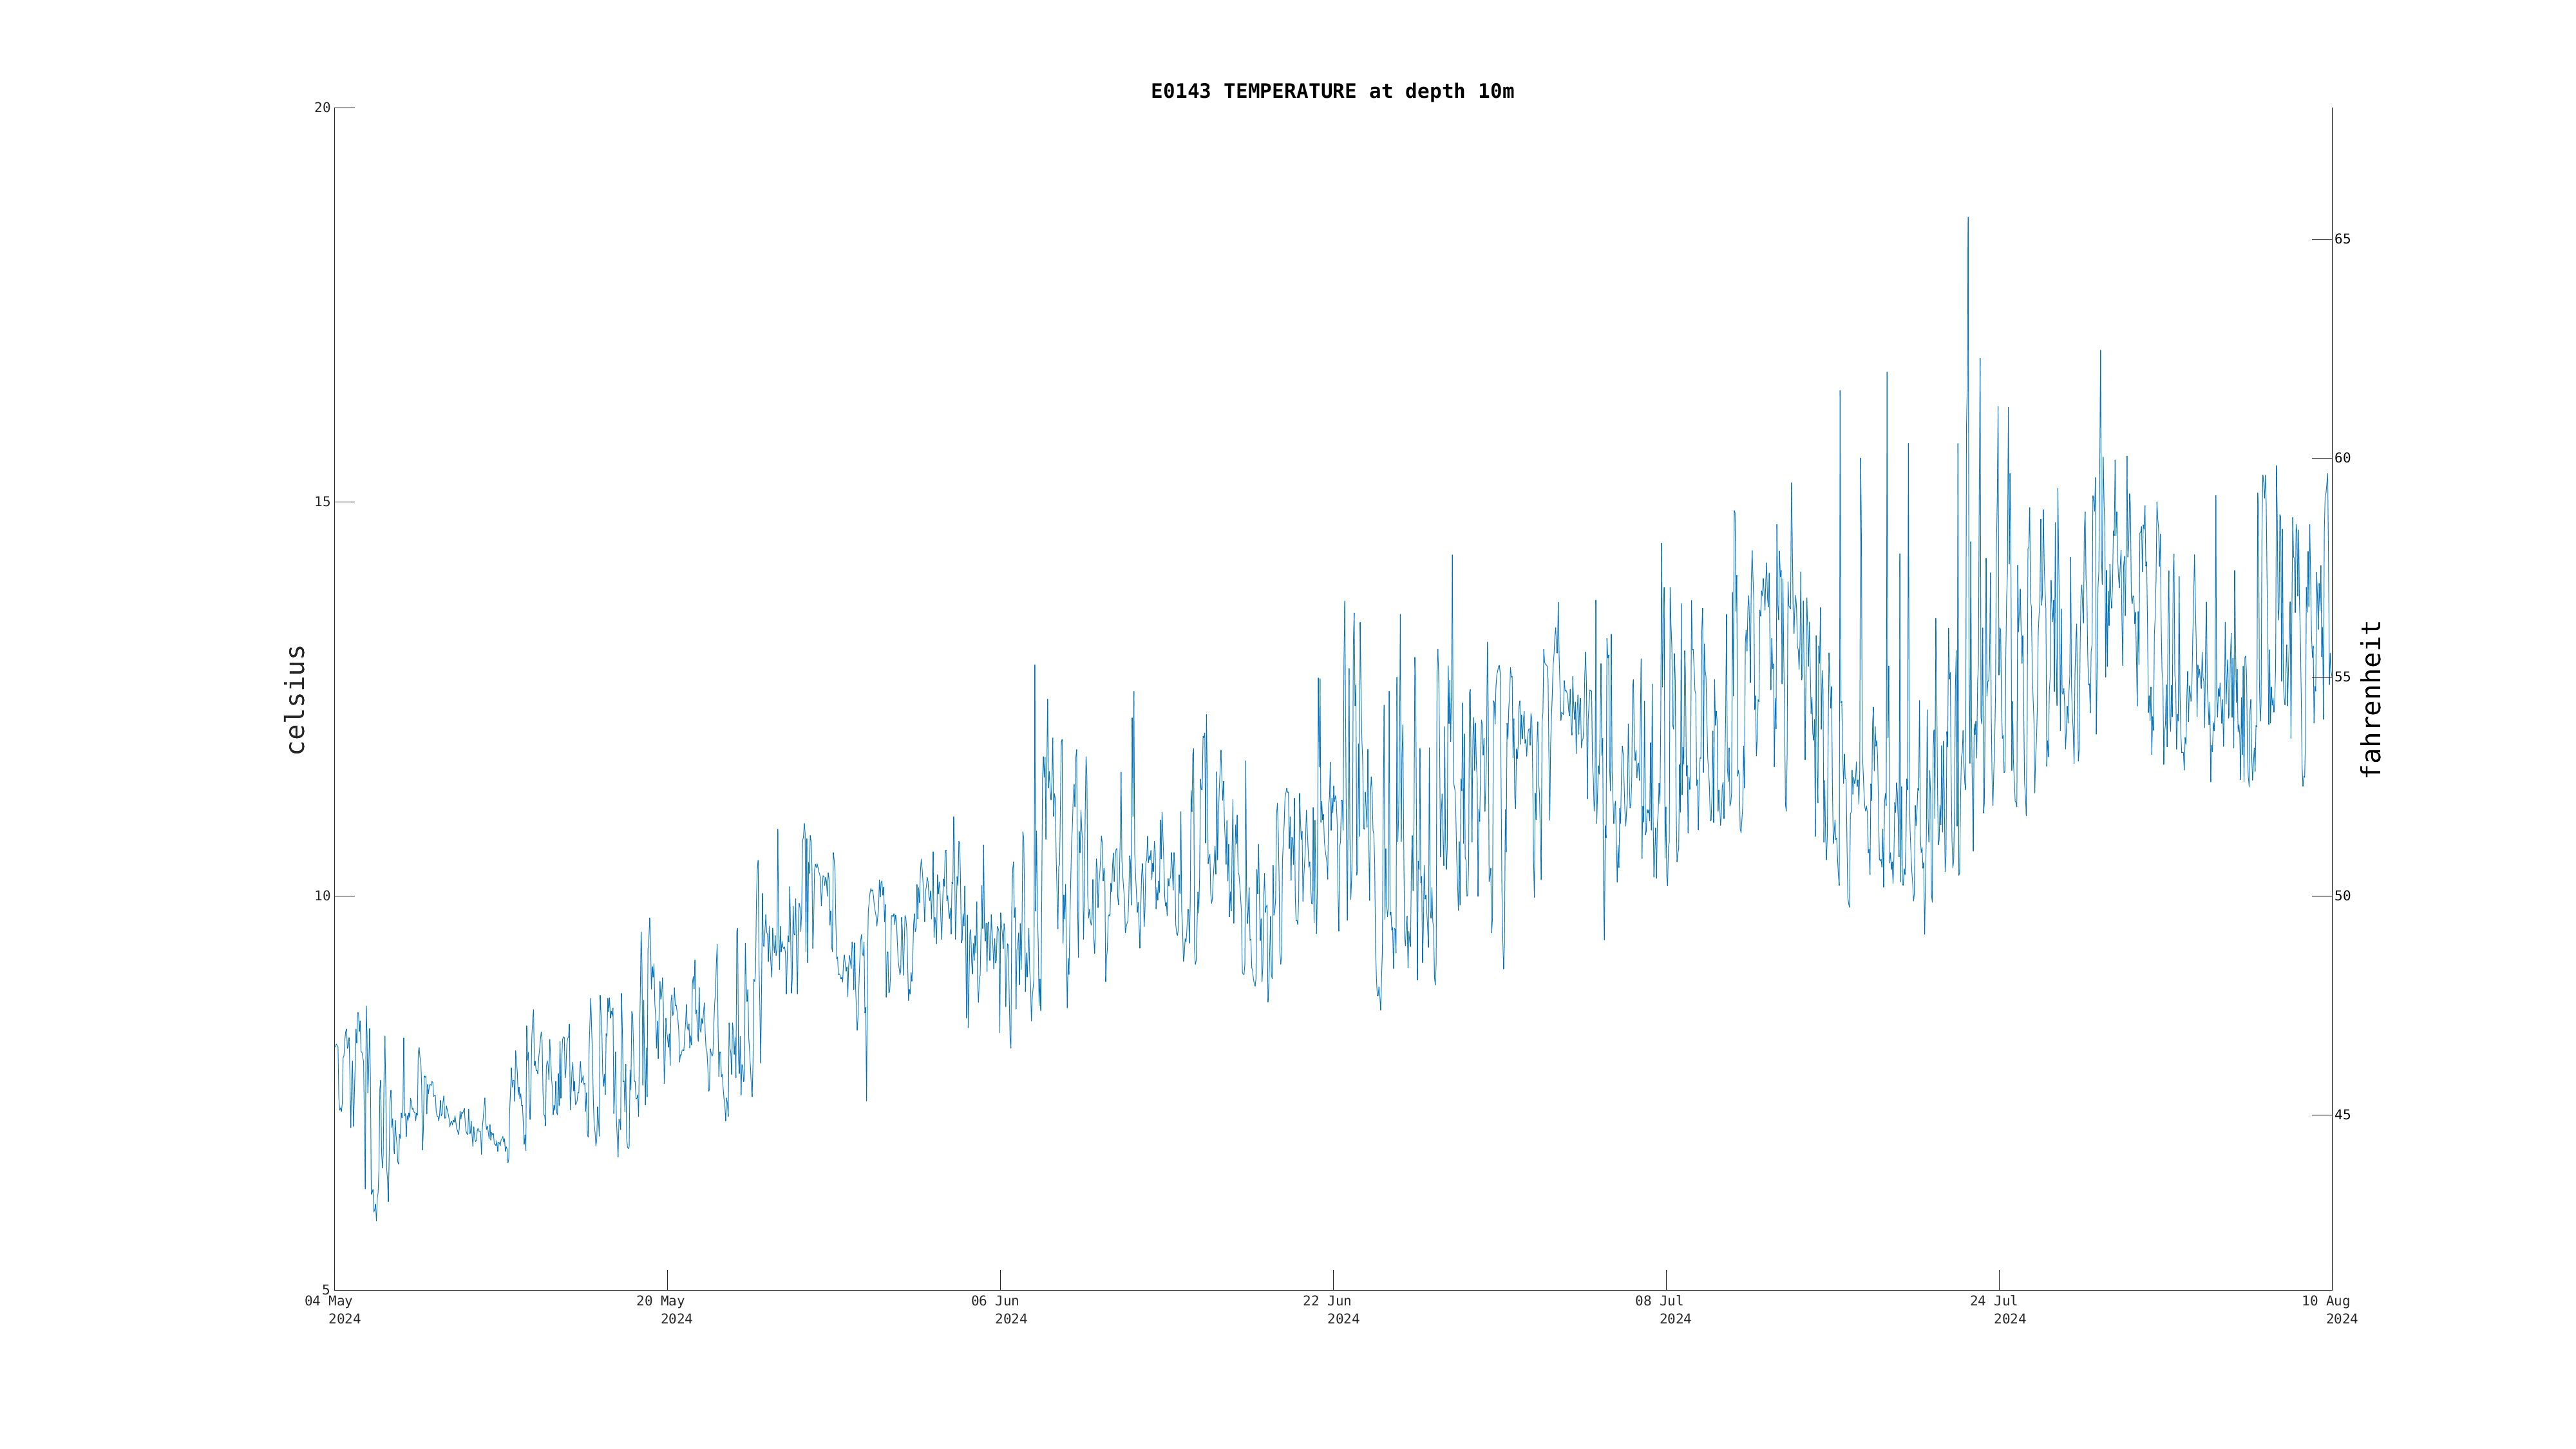
| Water Temperature (10m) | Sensor Failure | Sep 29 7:00 AM |
|
|
|
|
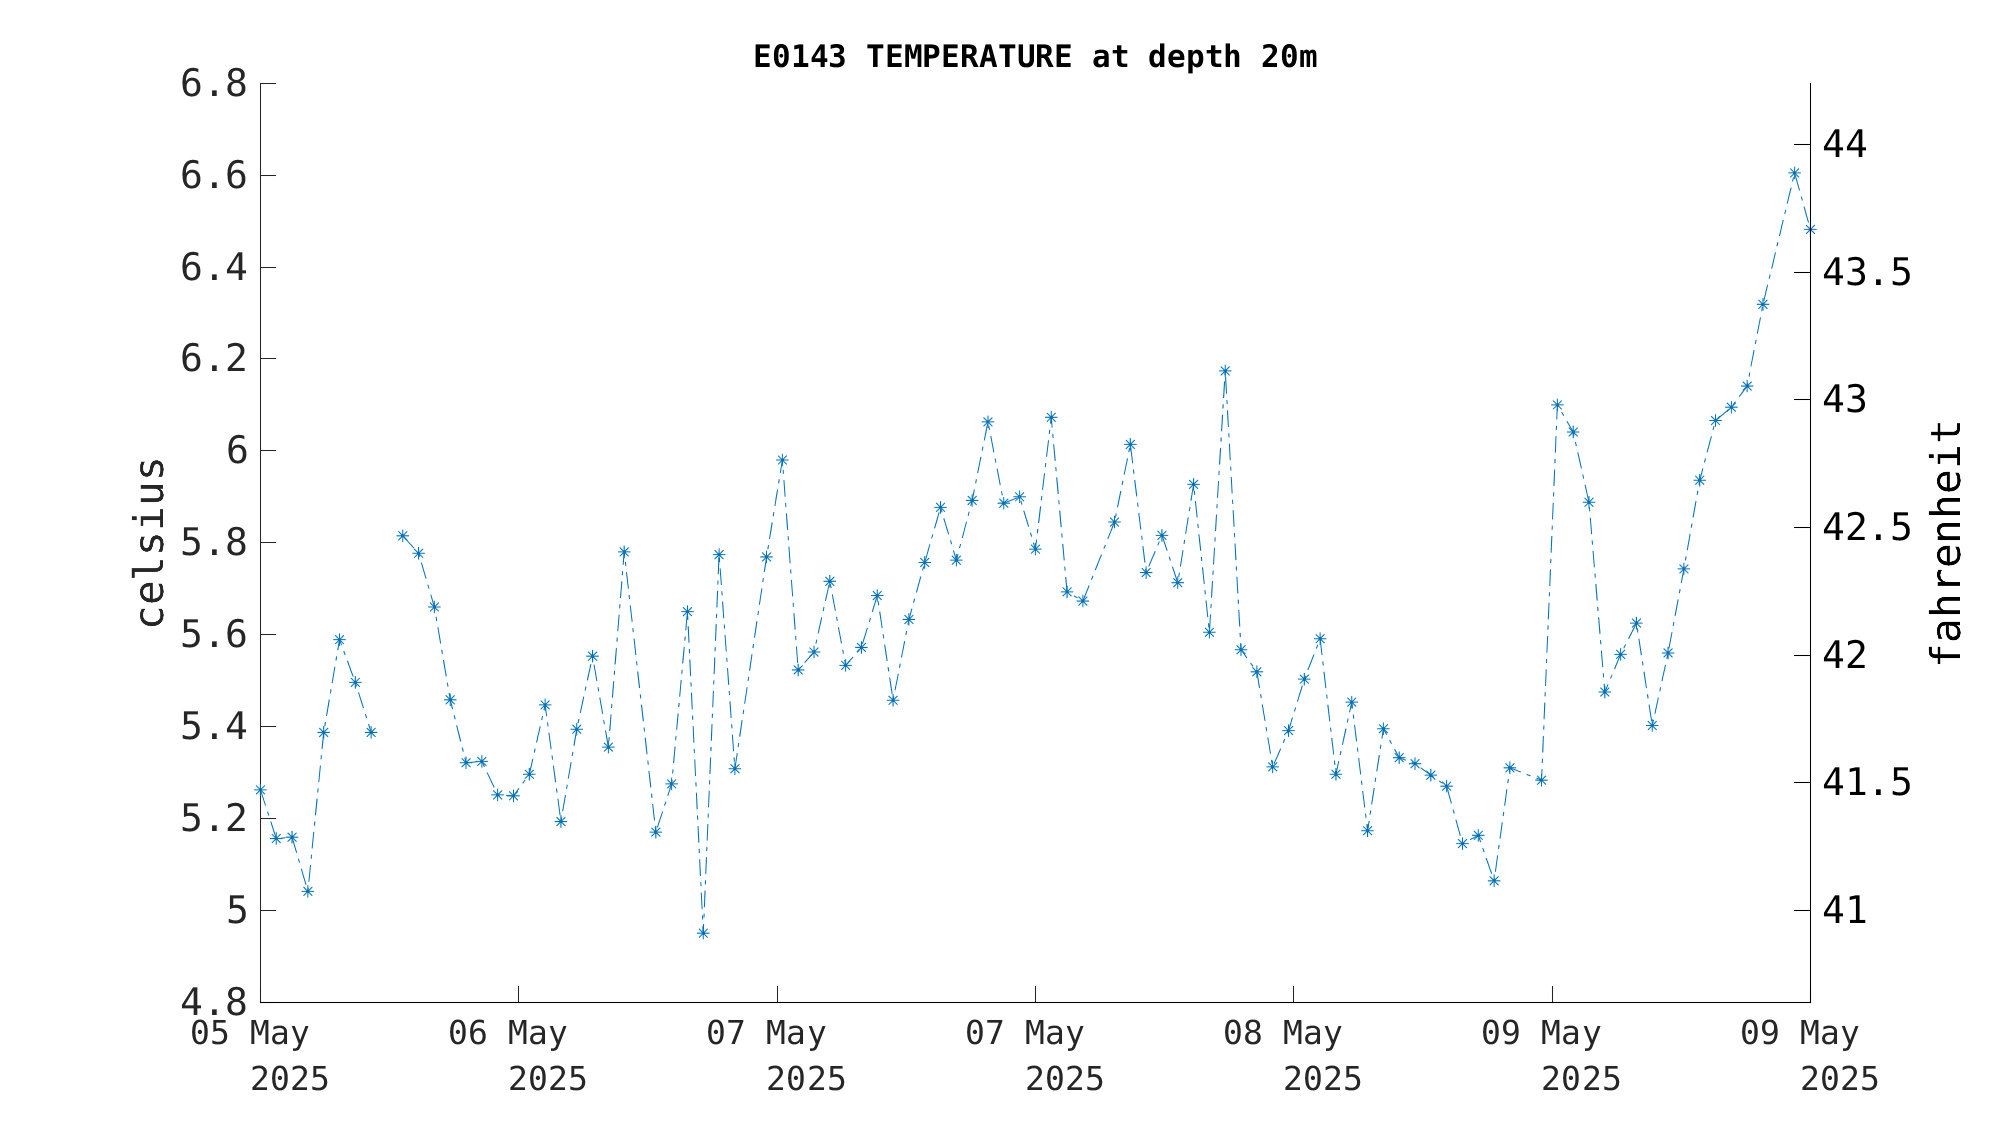
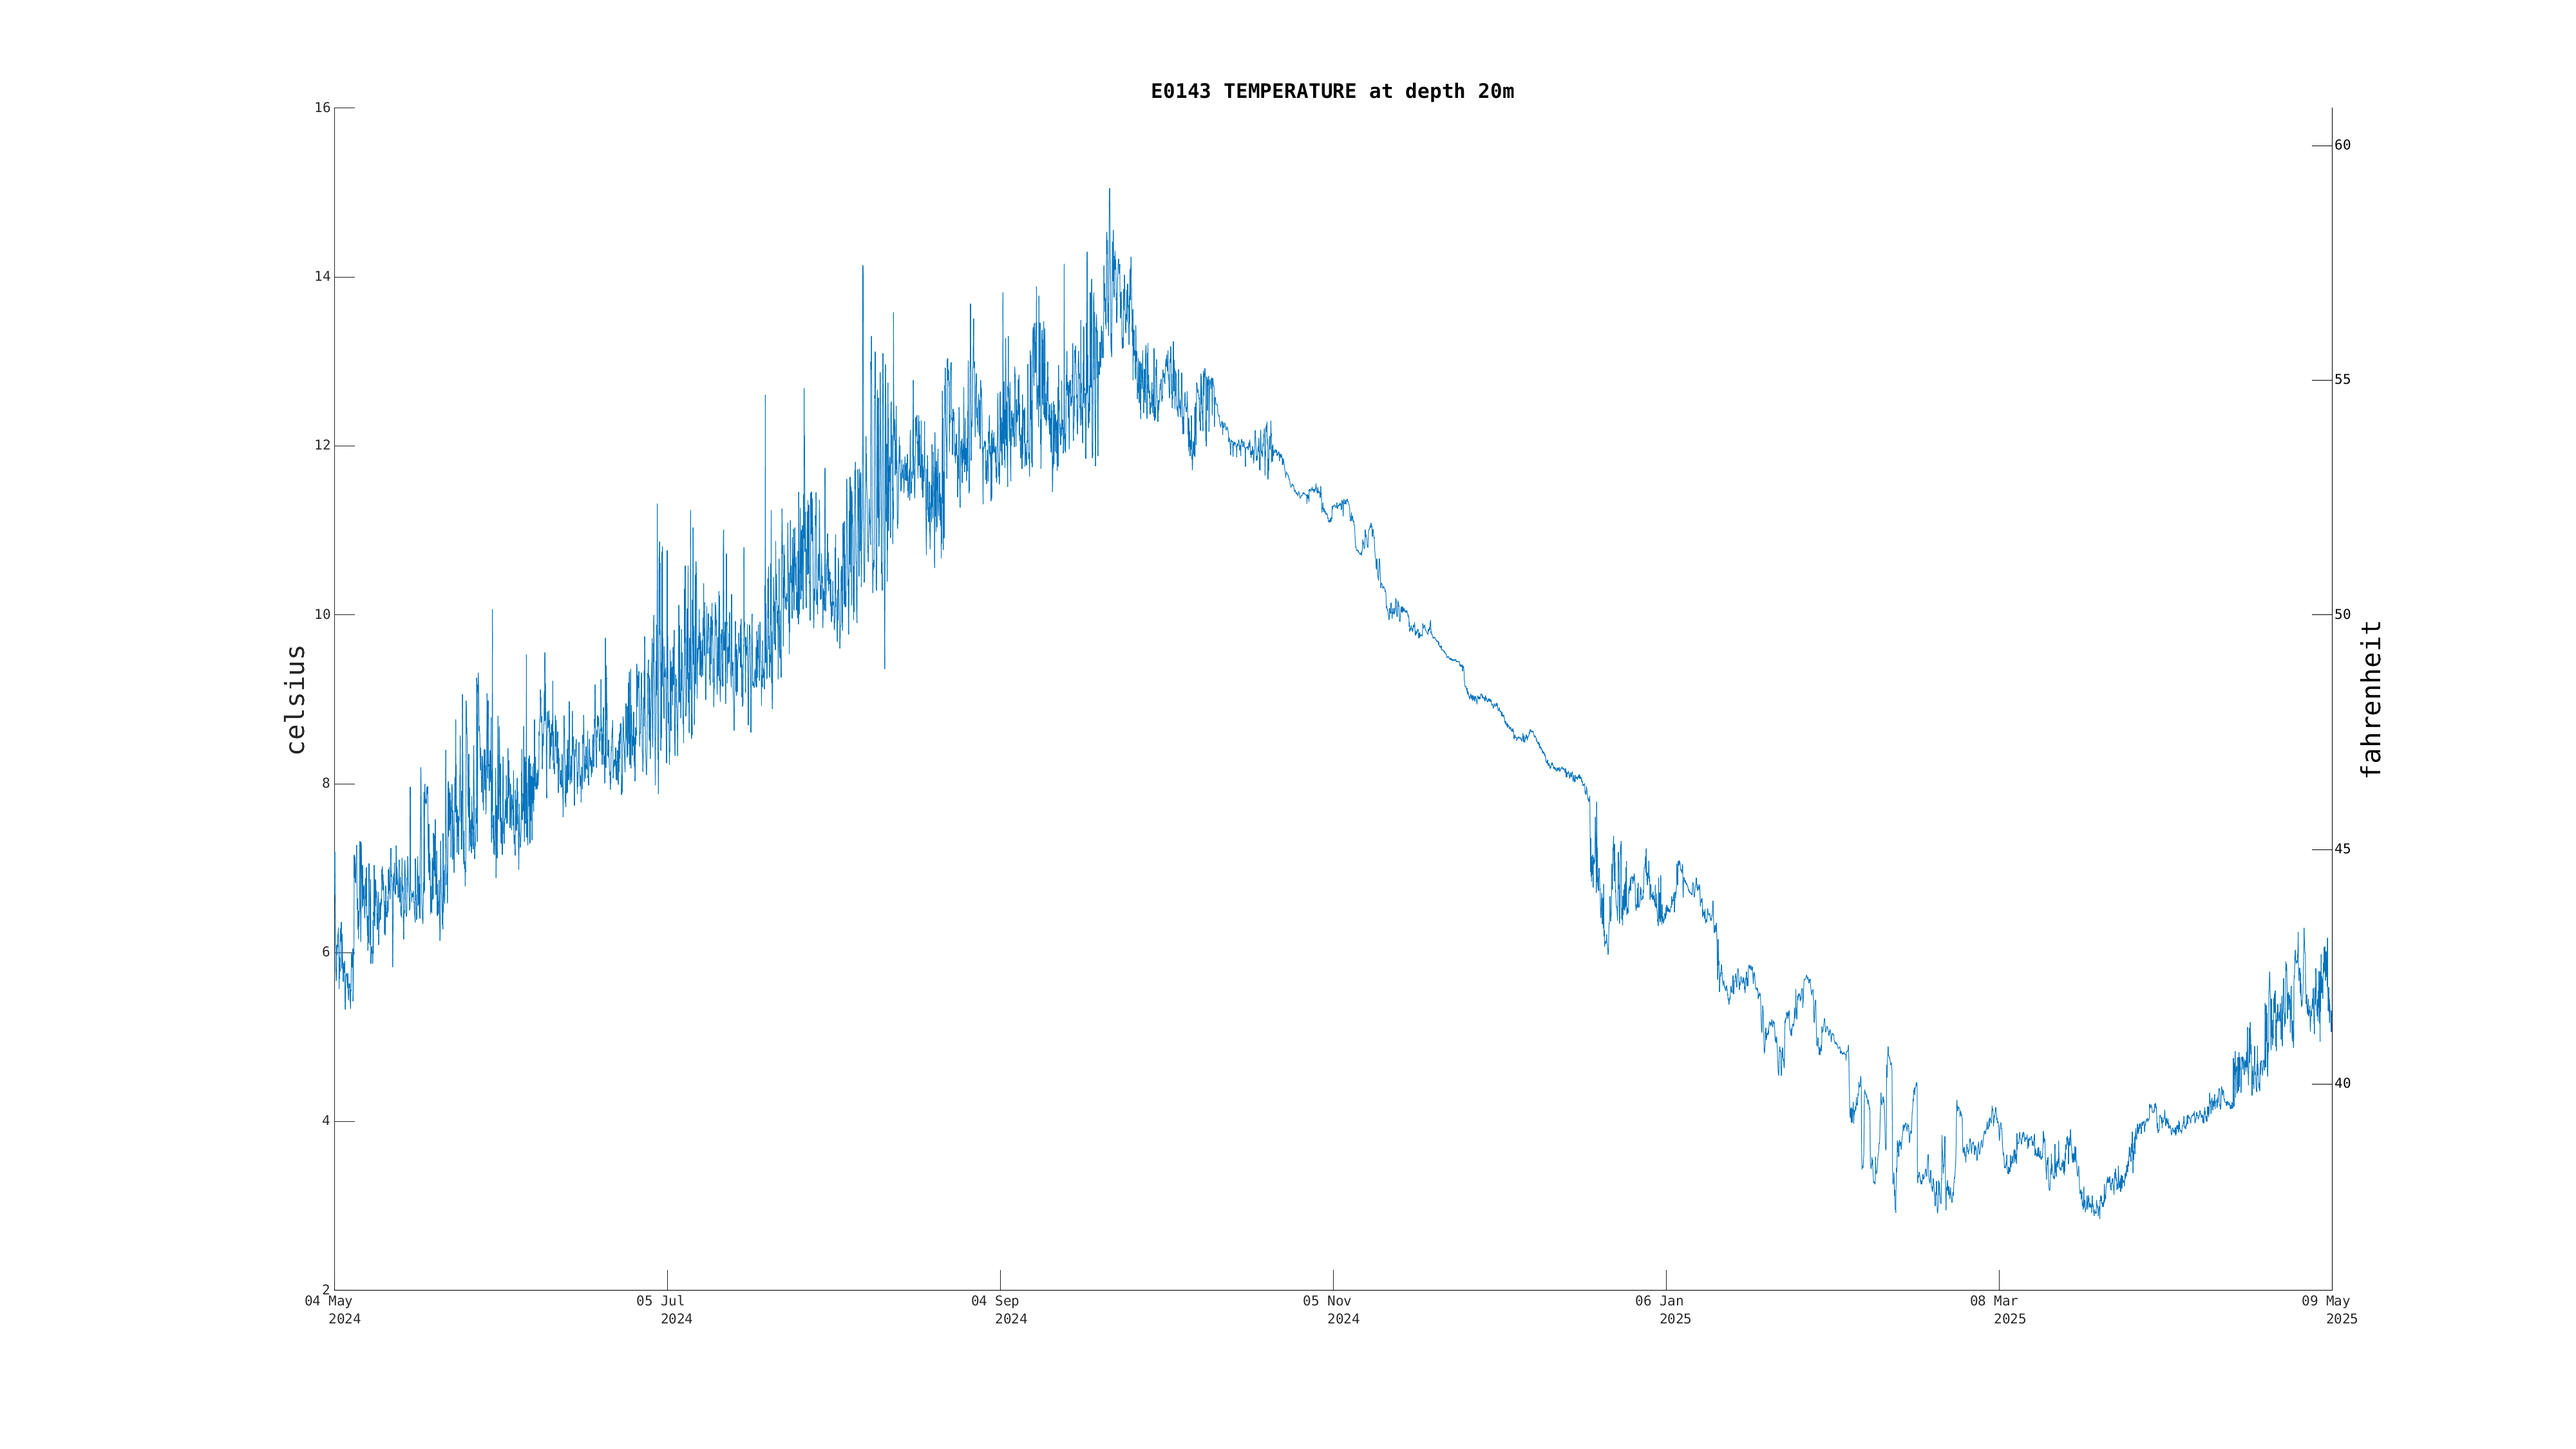
| Water Temperature (20m) | Sensor Failure | Dec 21 9:00 PM |
|
|
|
|
| Water Temperature (50m) | Sensor Failure | Dec 21 9:00 PM |
|
|
|
|
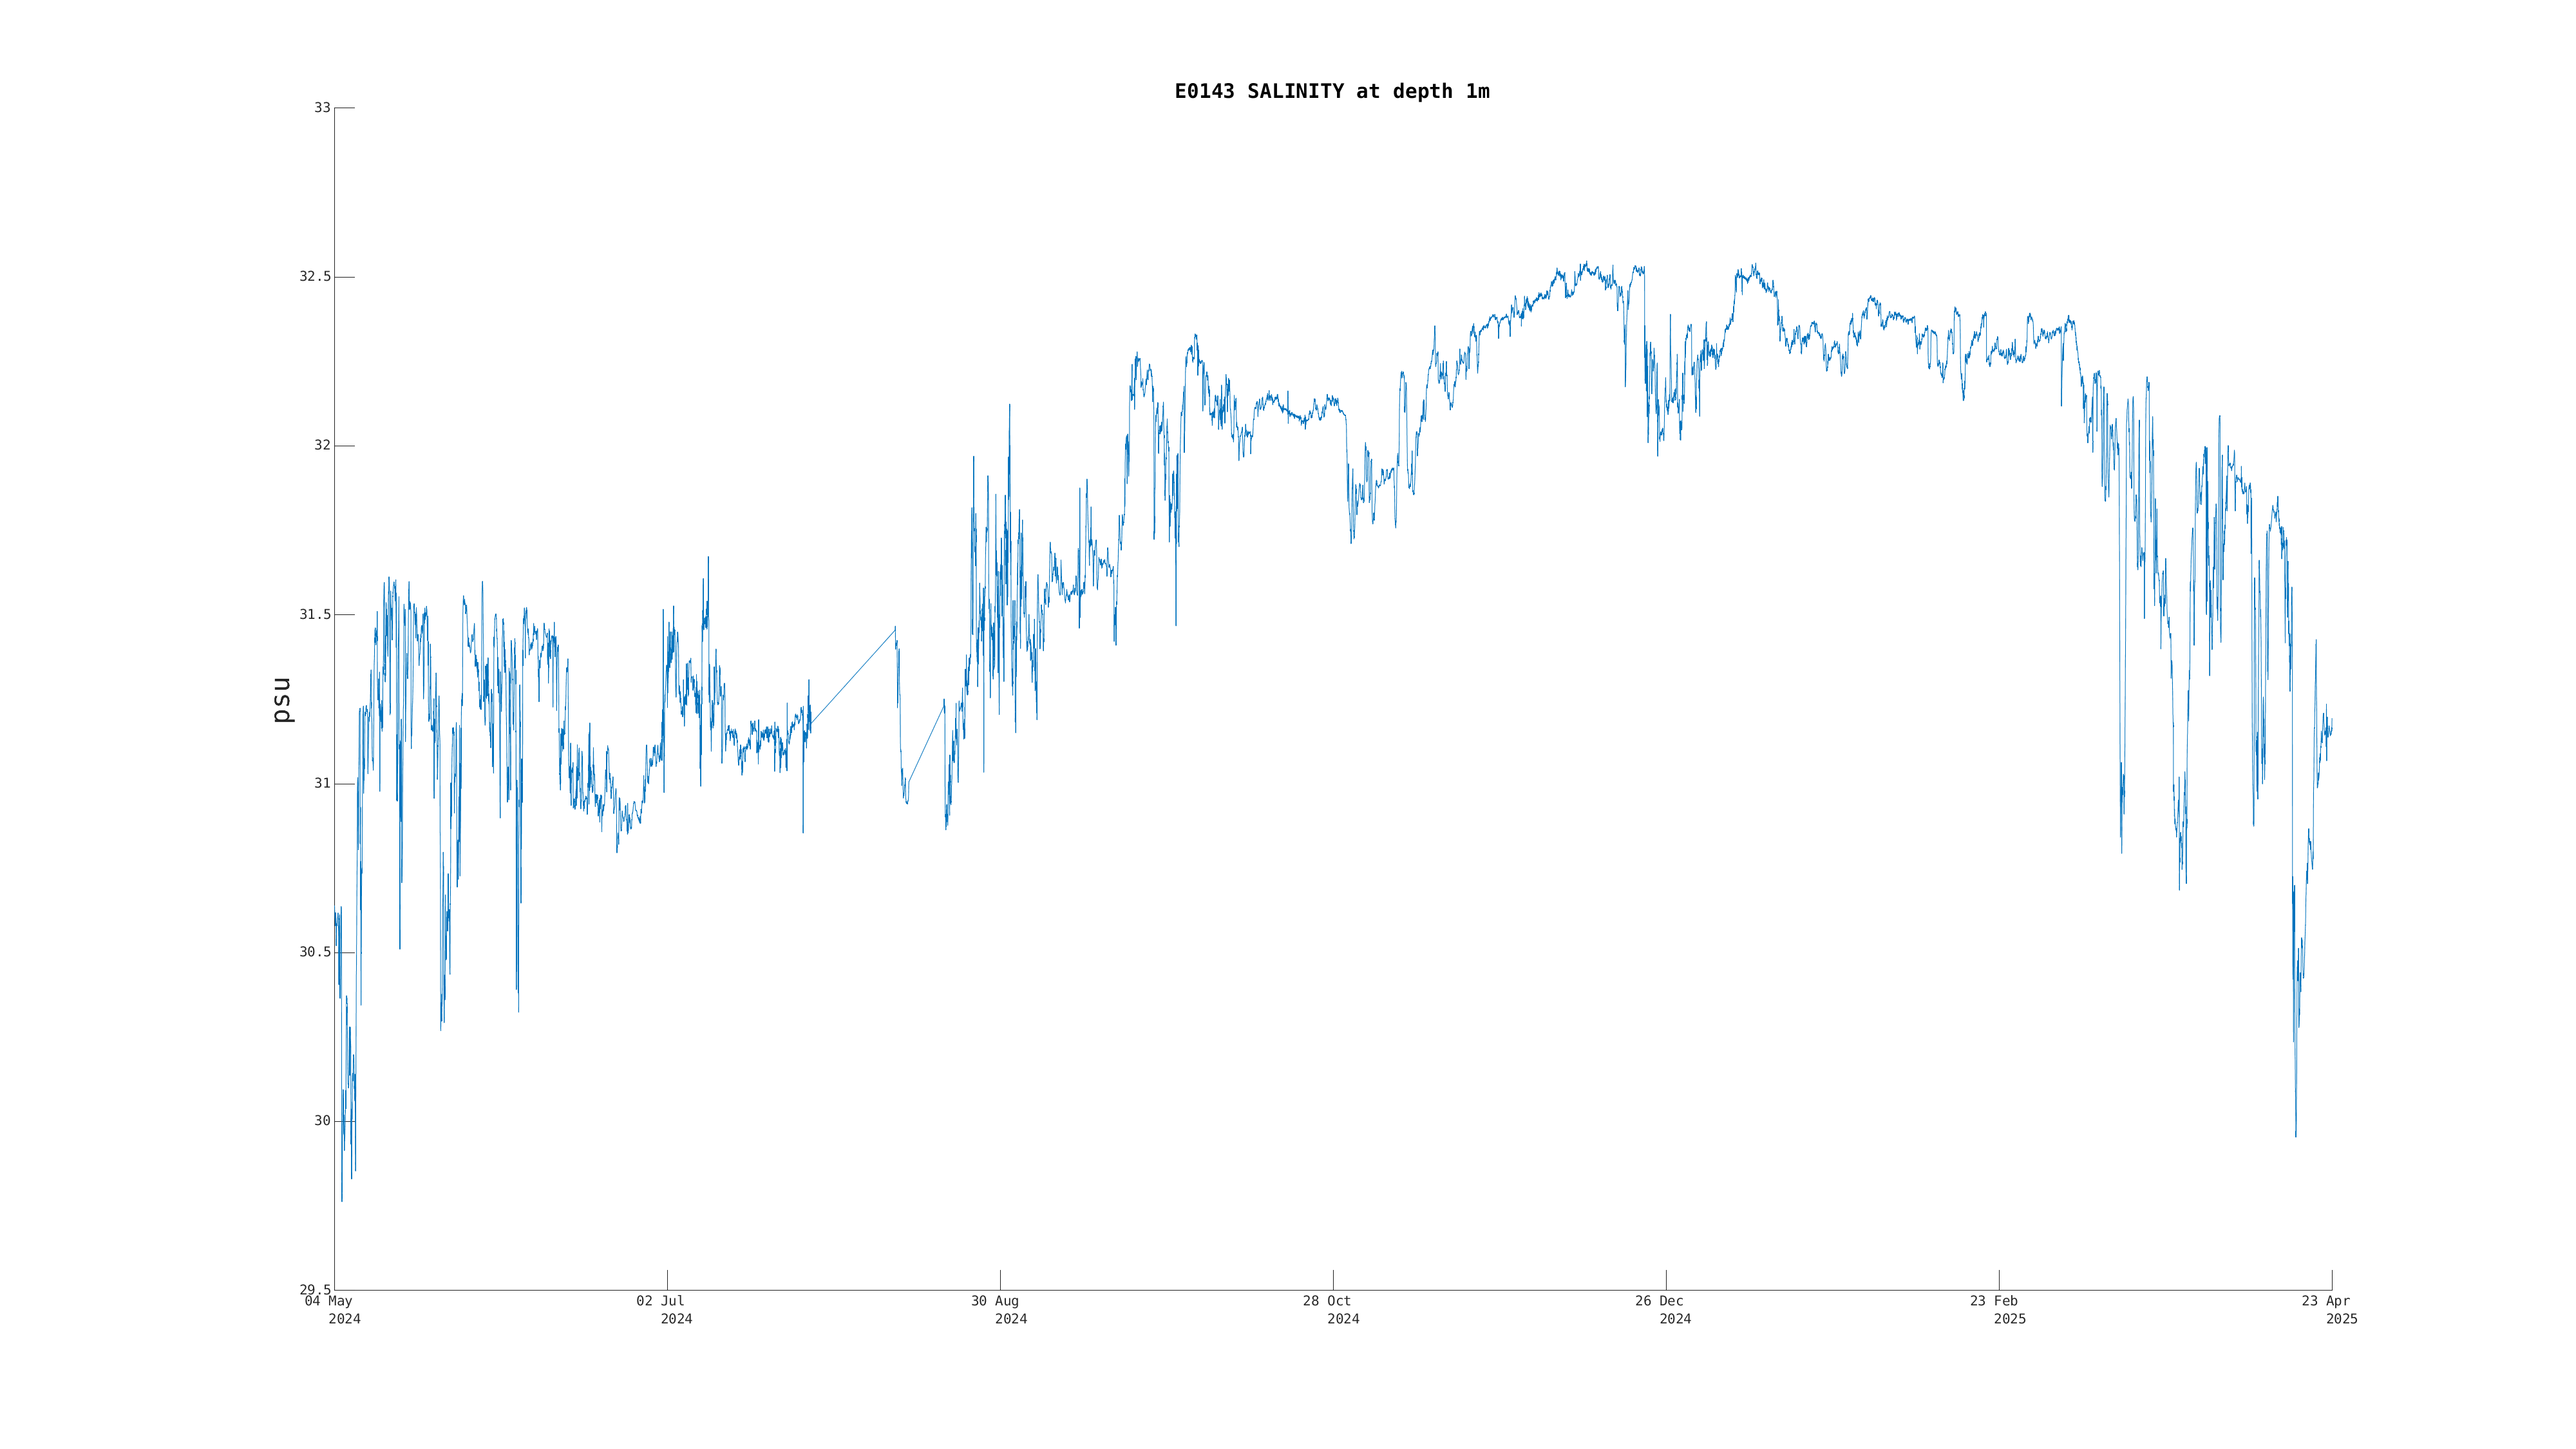
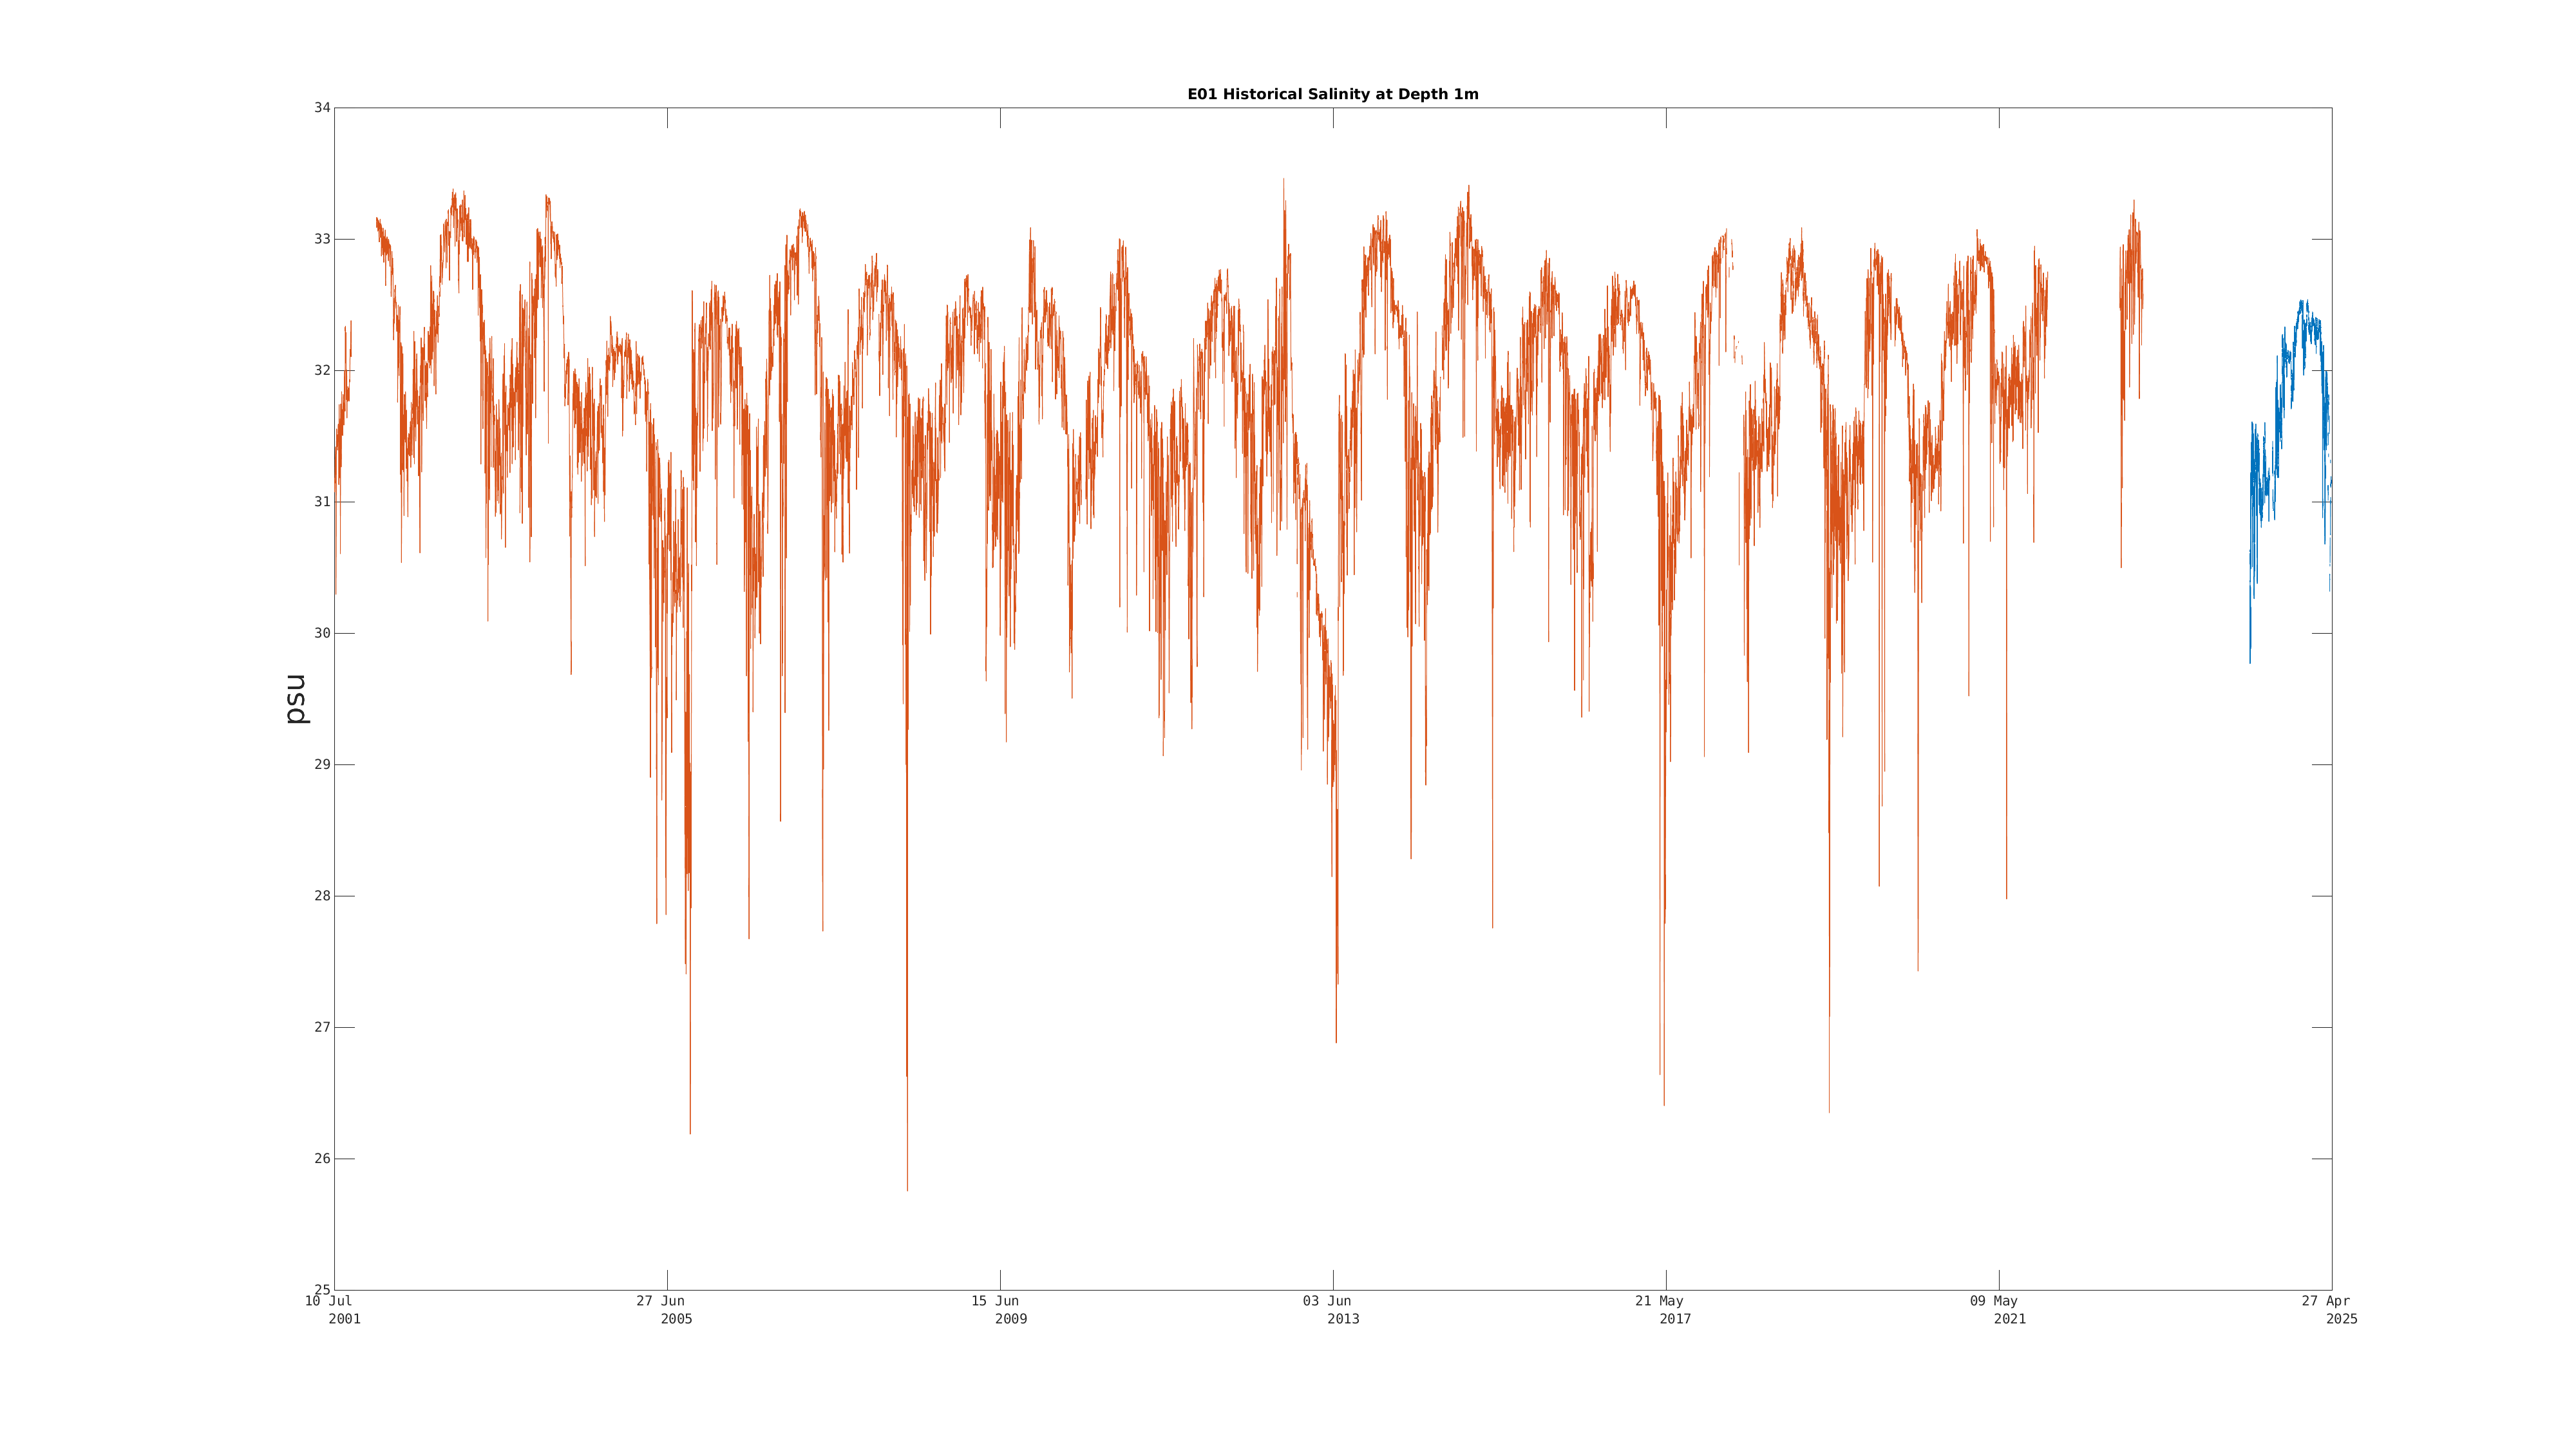
| Salinity (1m) | Sensor Failure | Oct 09 6:00 AM |
|
|
|
|
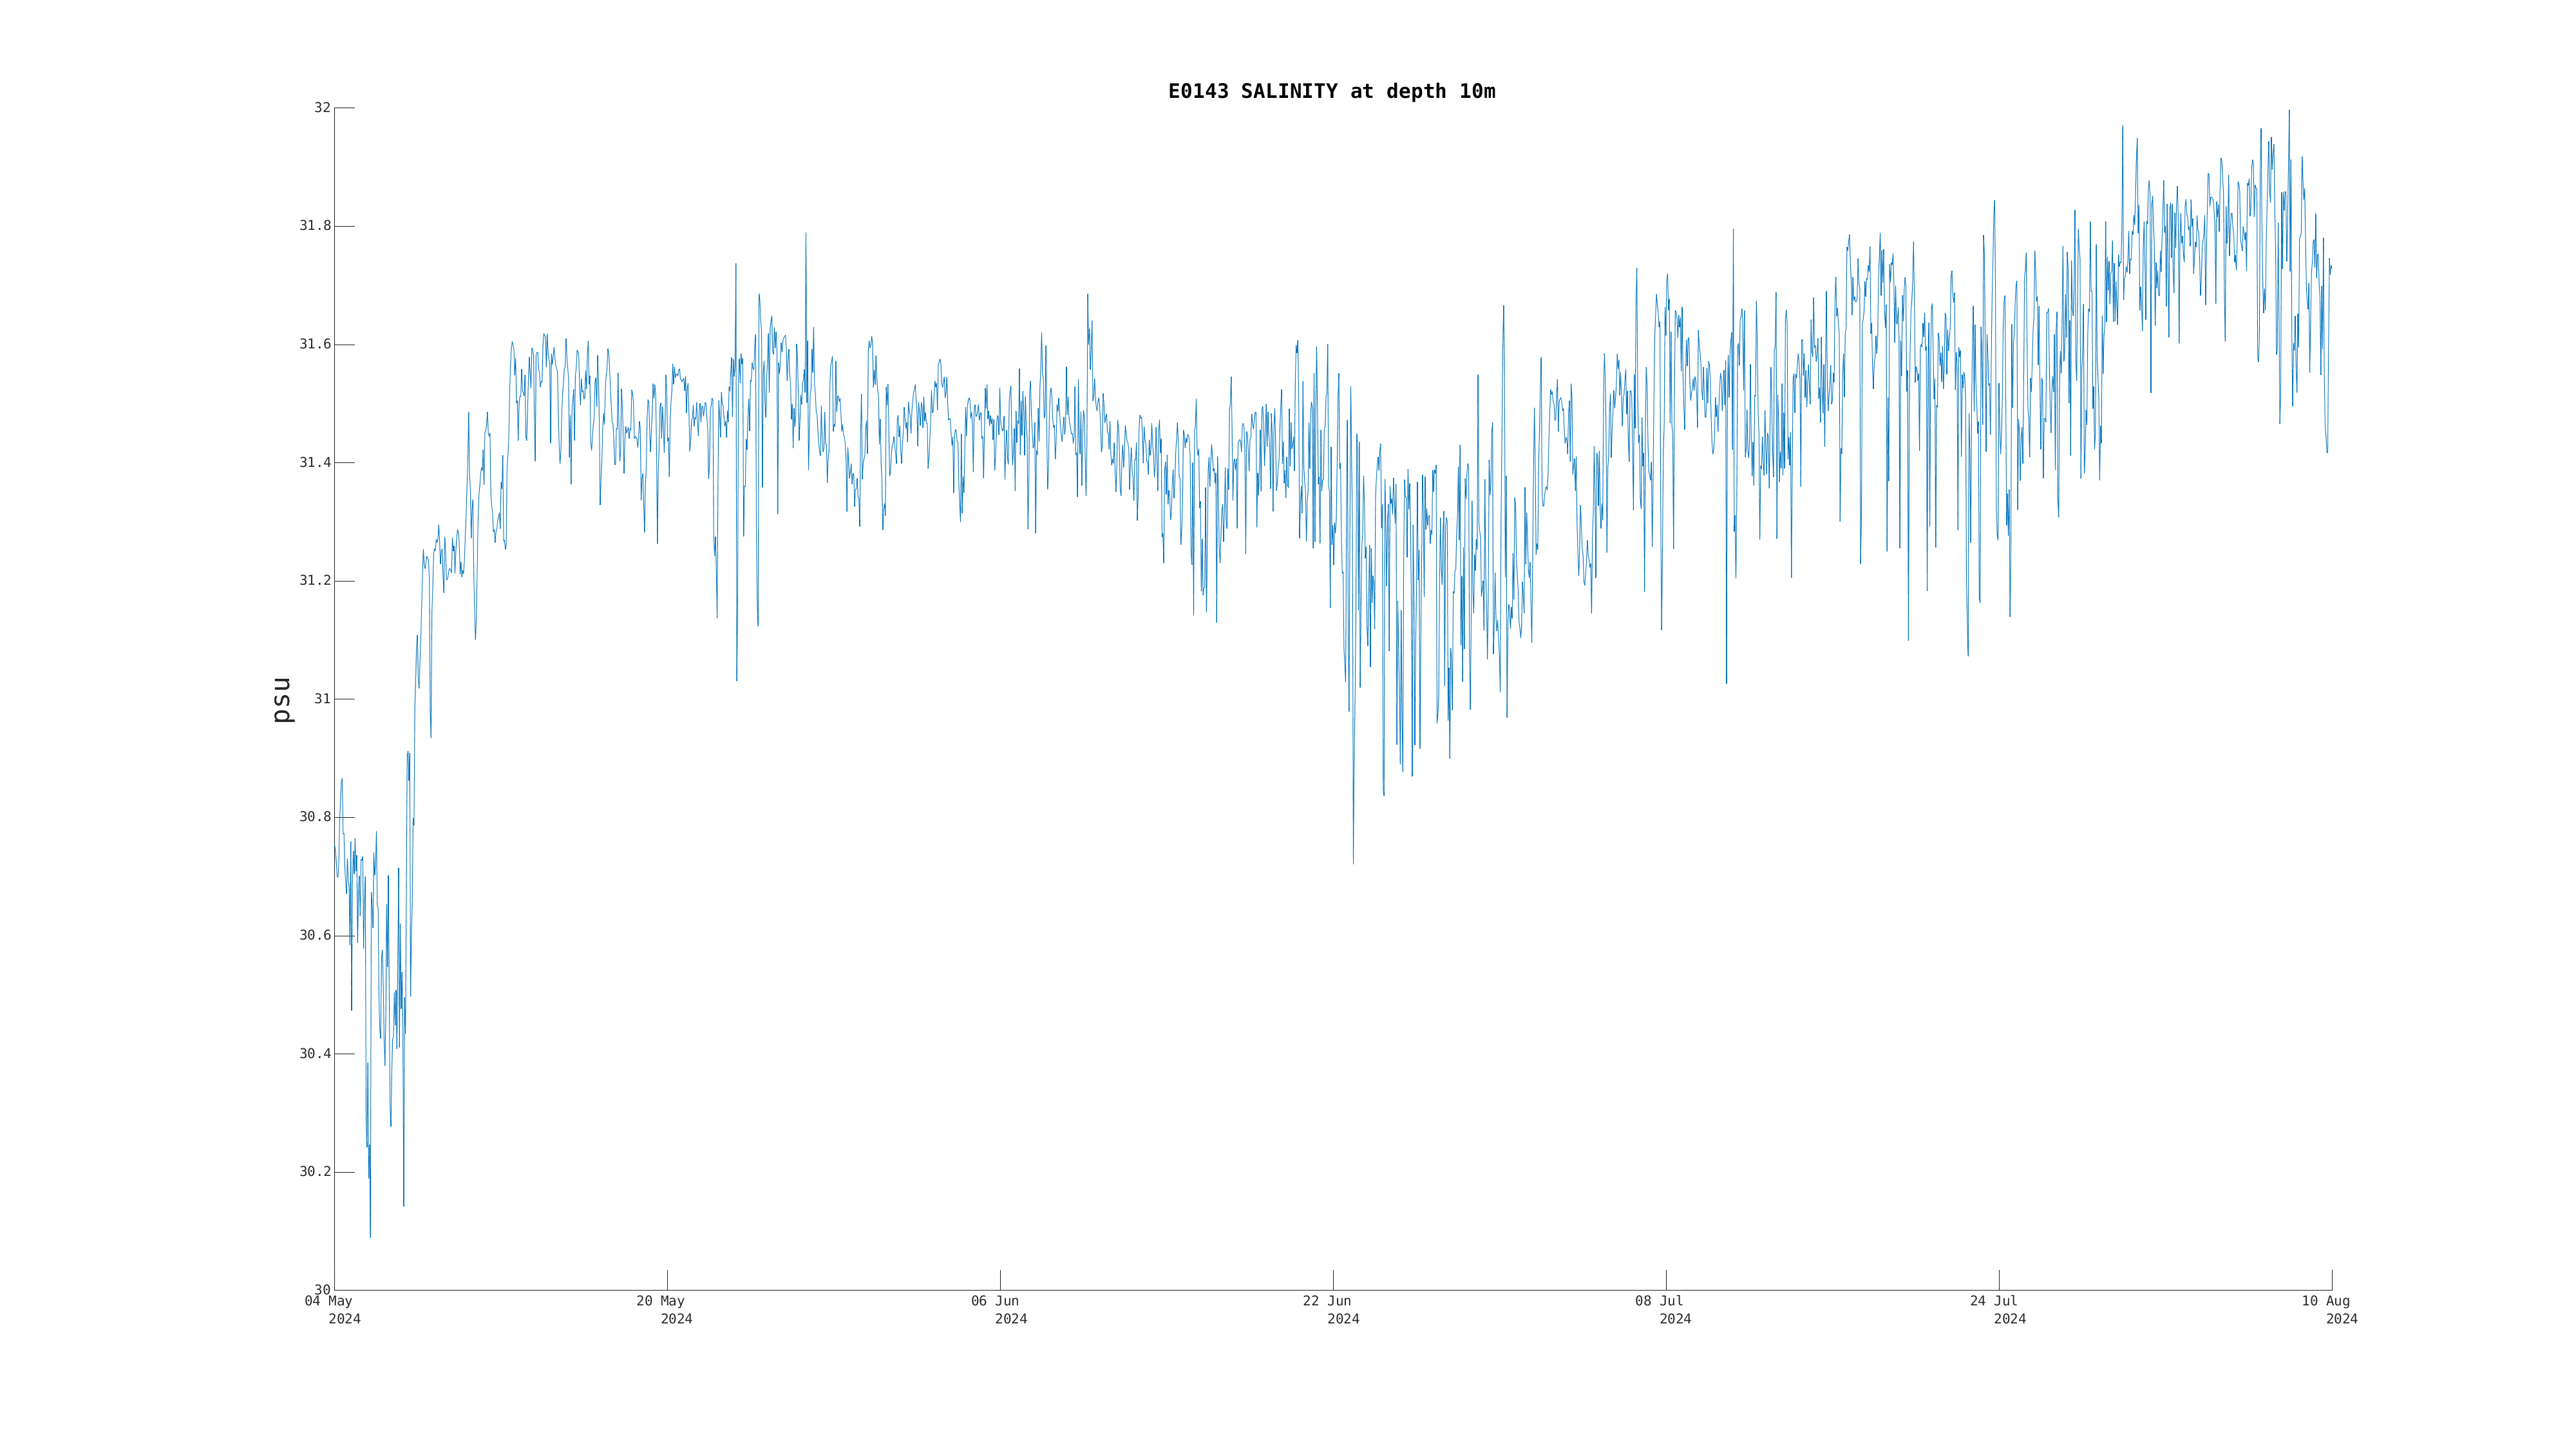
| Salinity (10m) | Sensor Failure | Sep 29 7:00 AM |

|
|
|
|
| Salinity (20m) | Sensor Failure | Dec 21 9:00 PM |
|
|
|
|
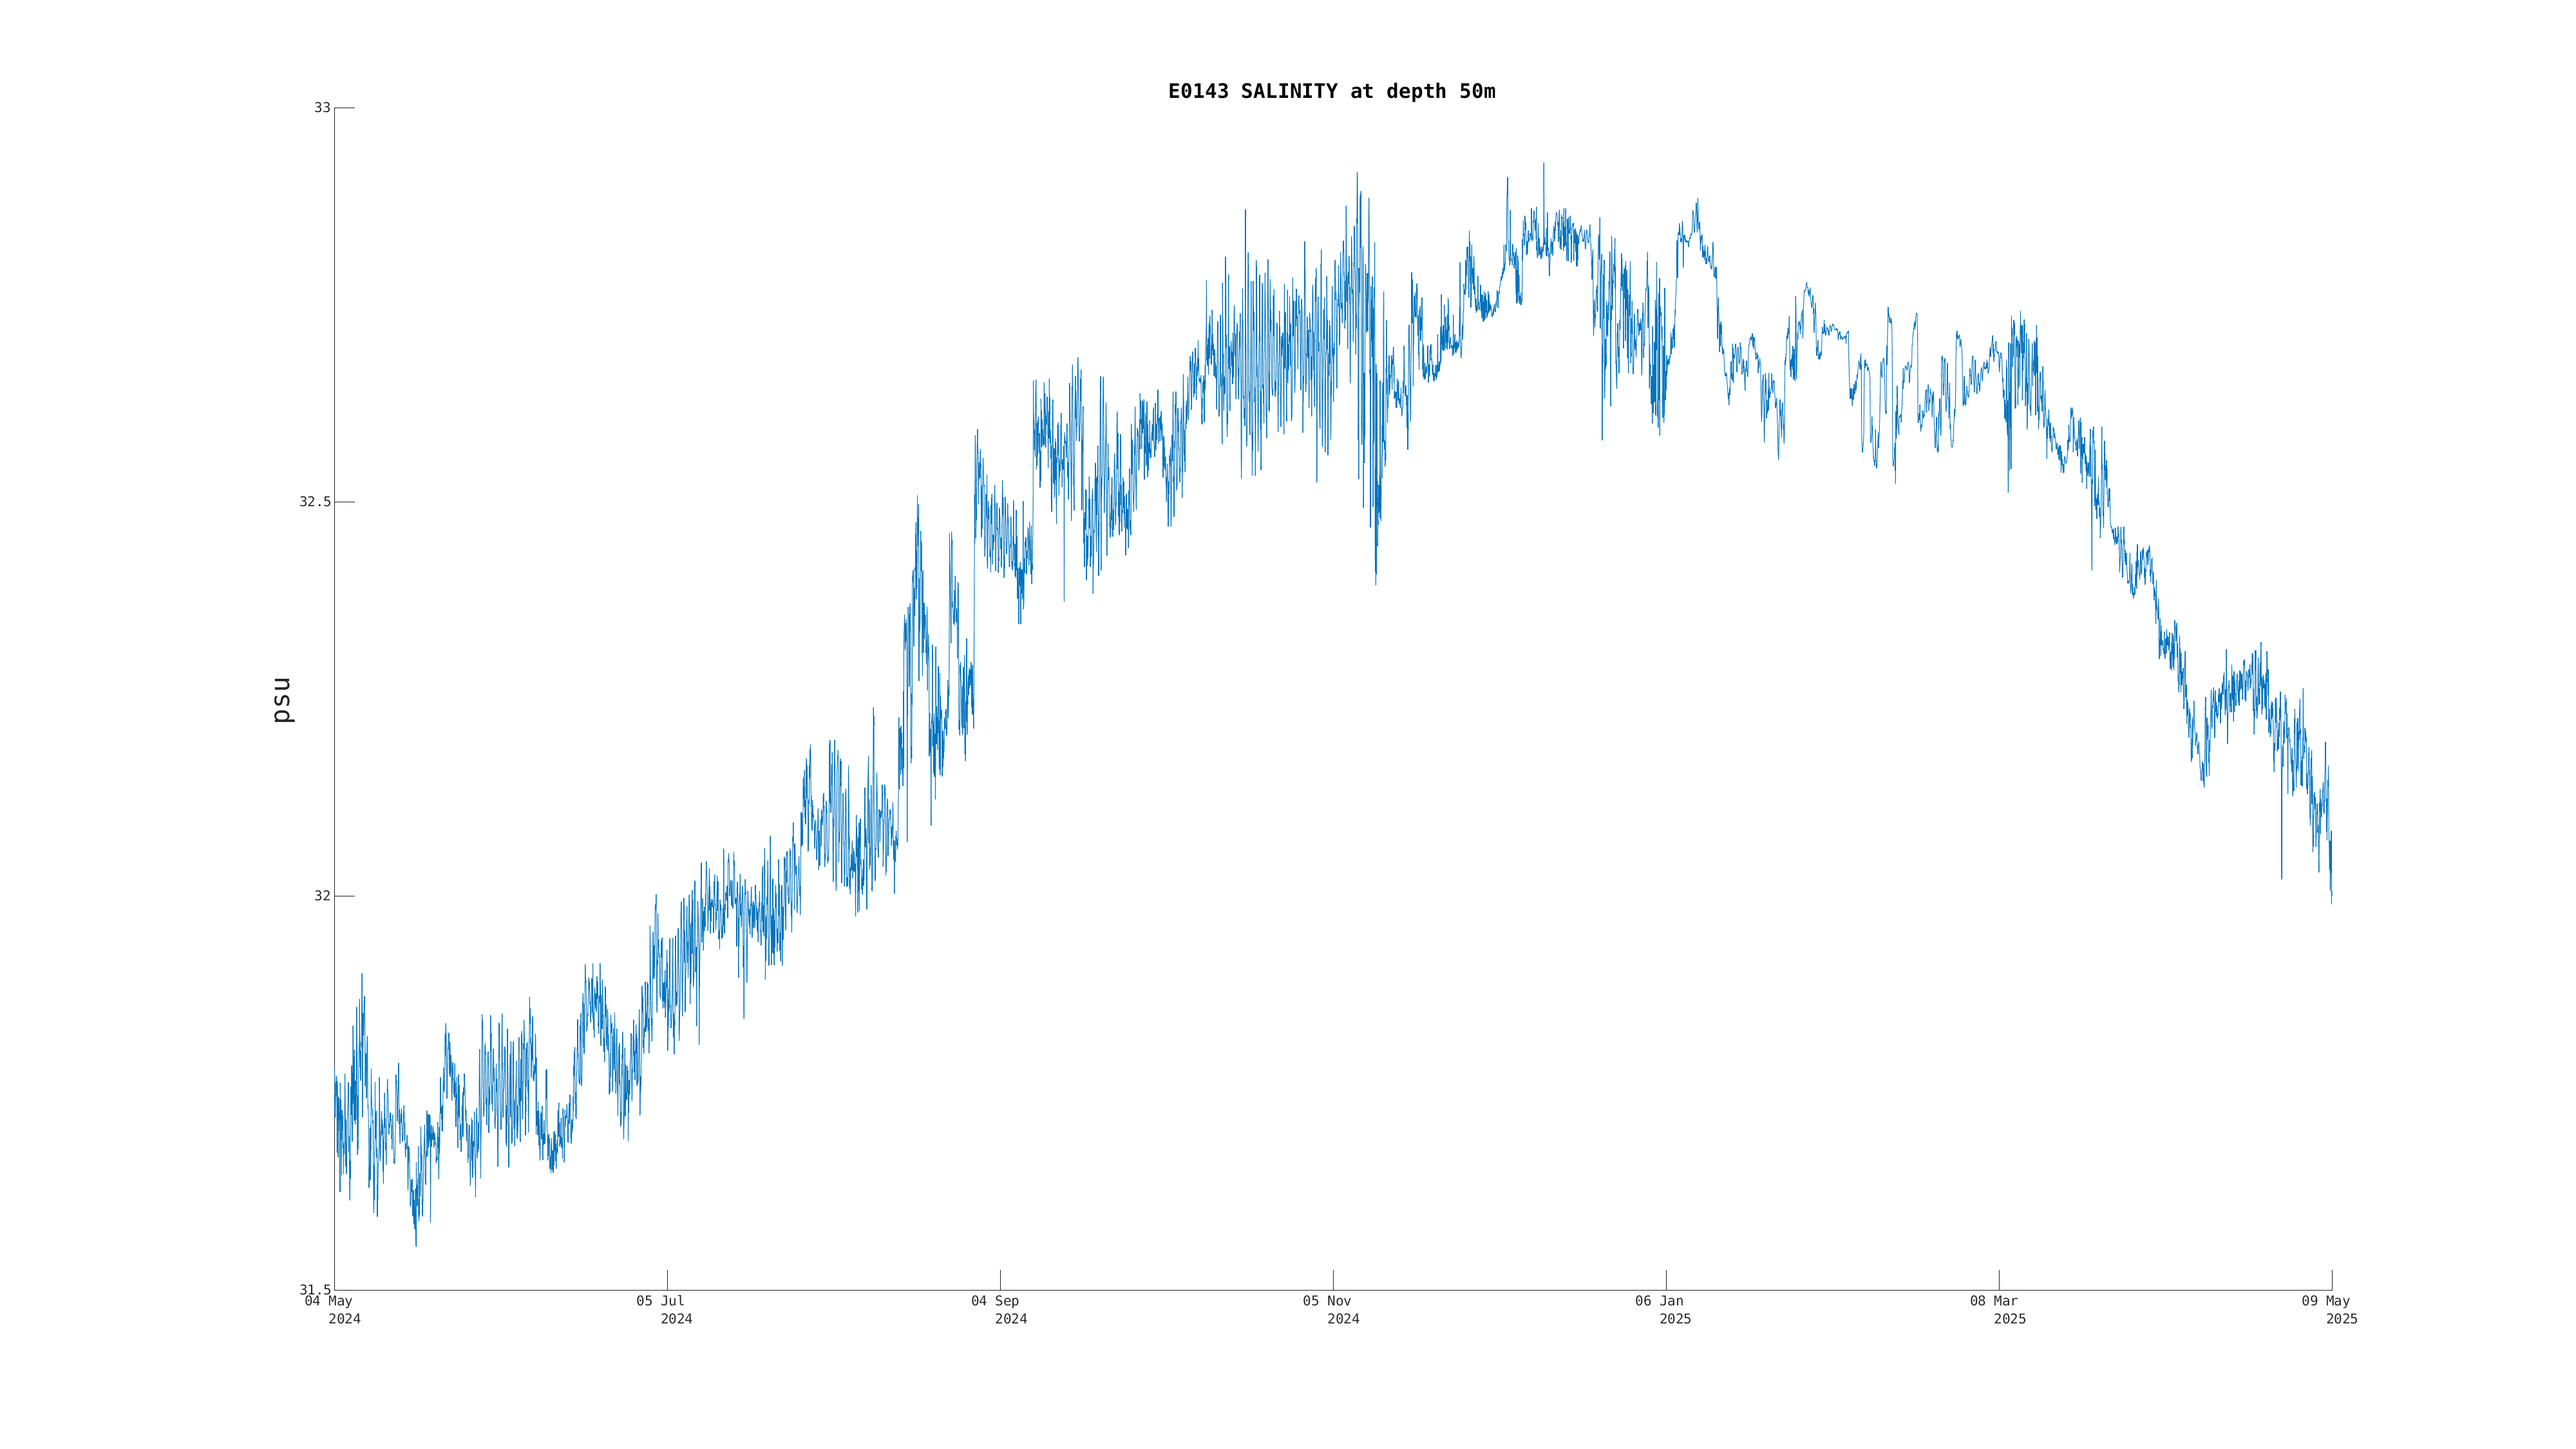
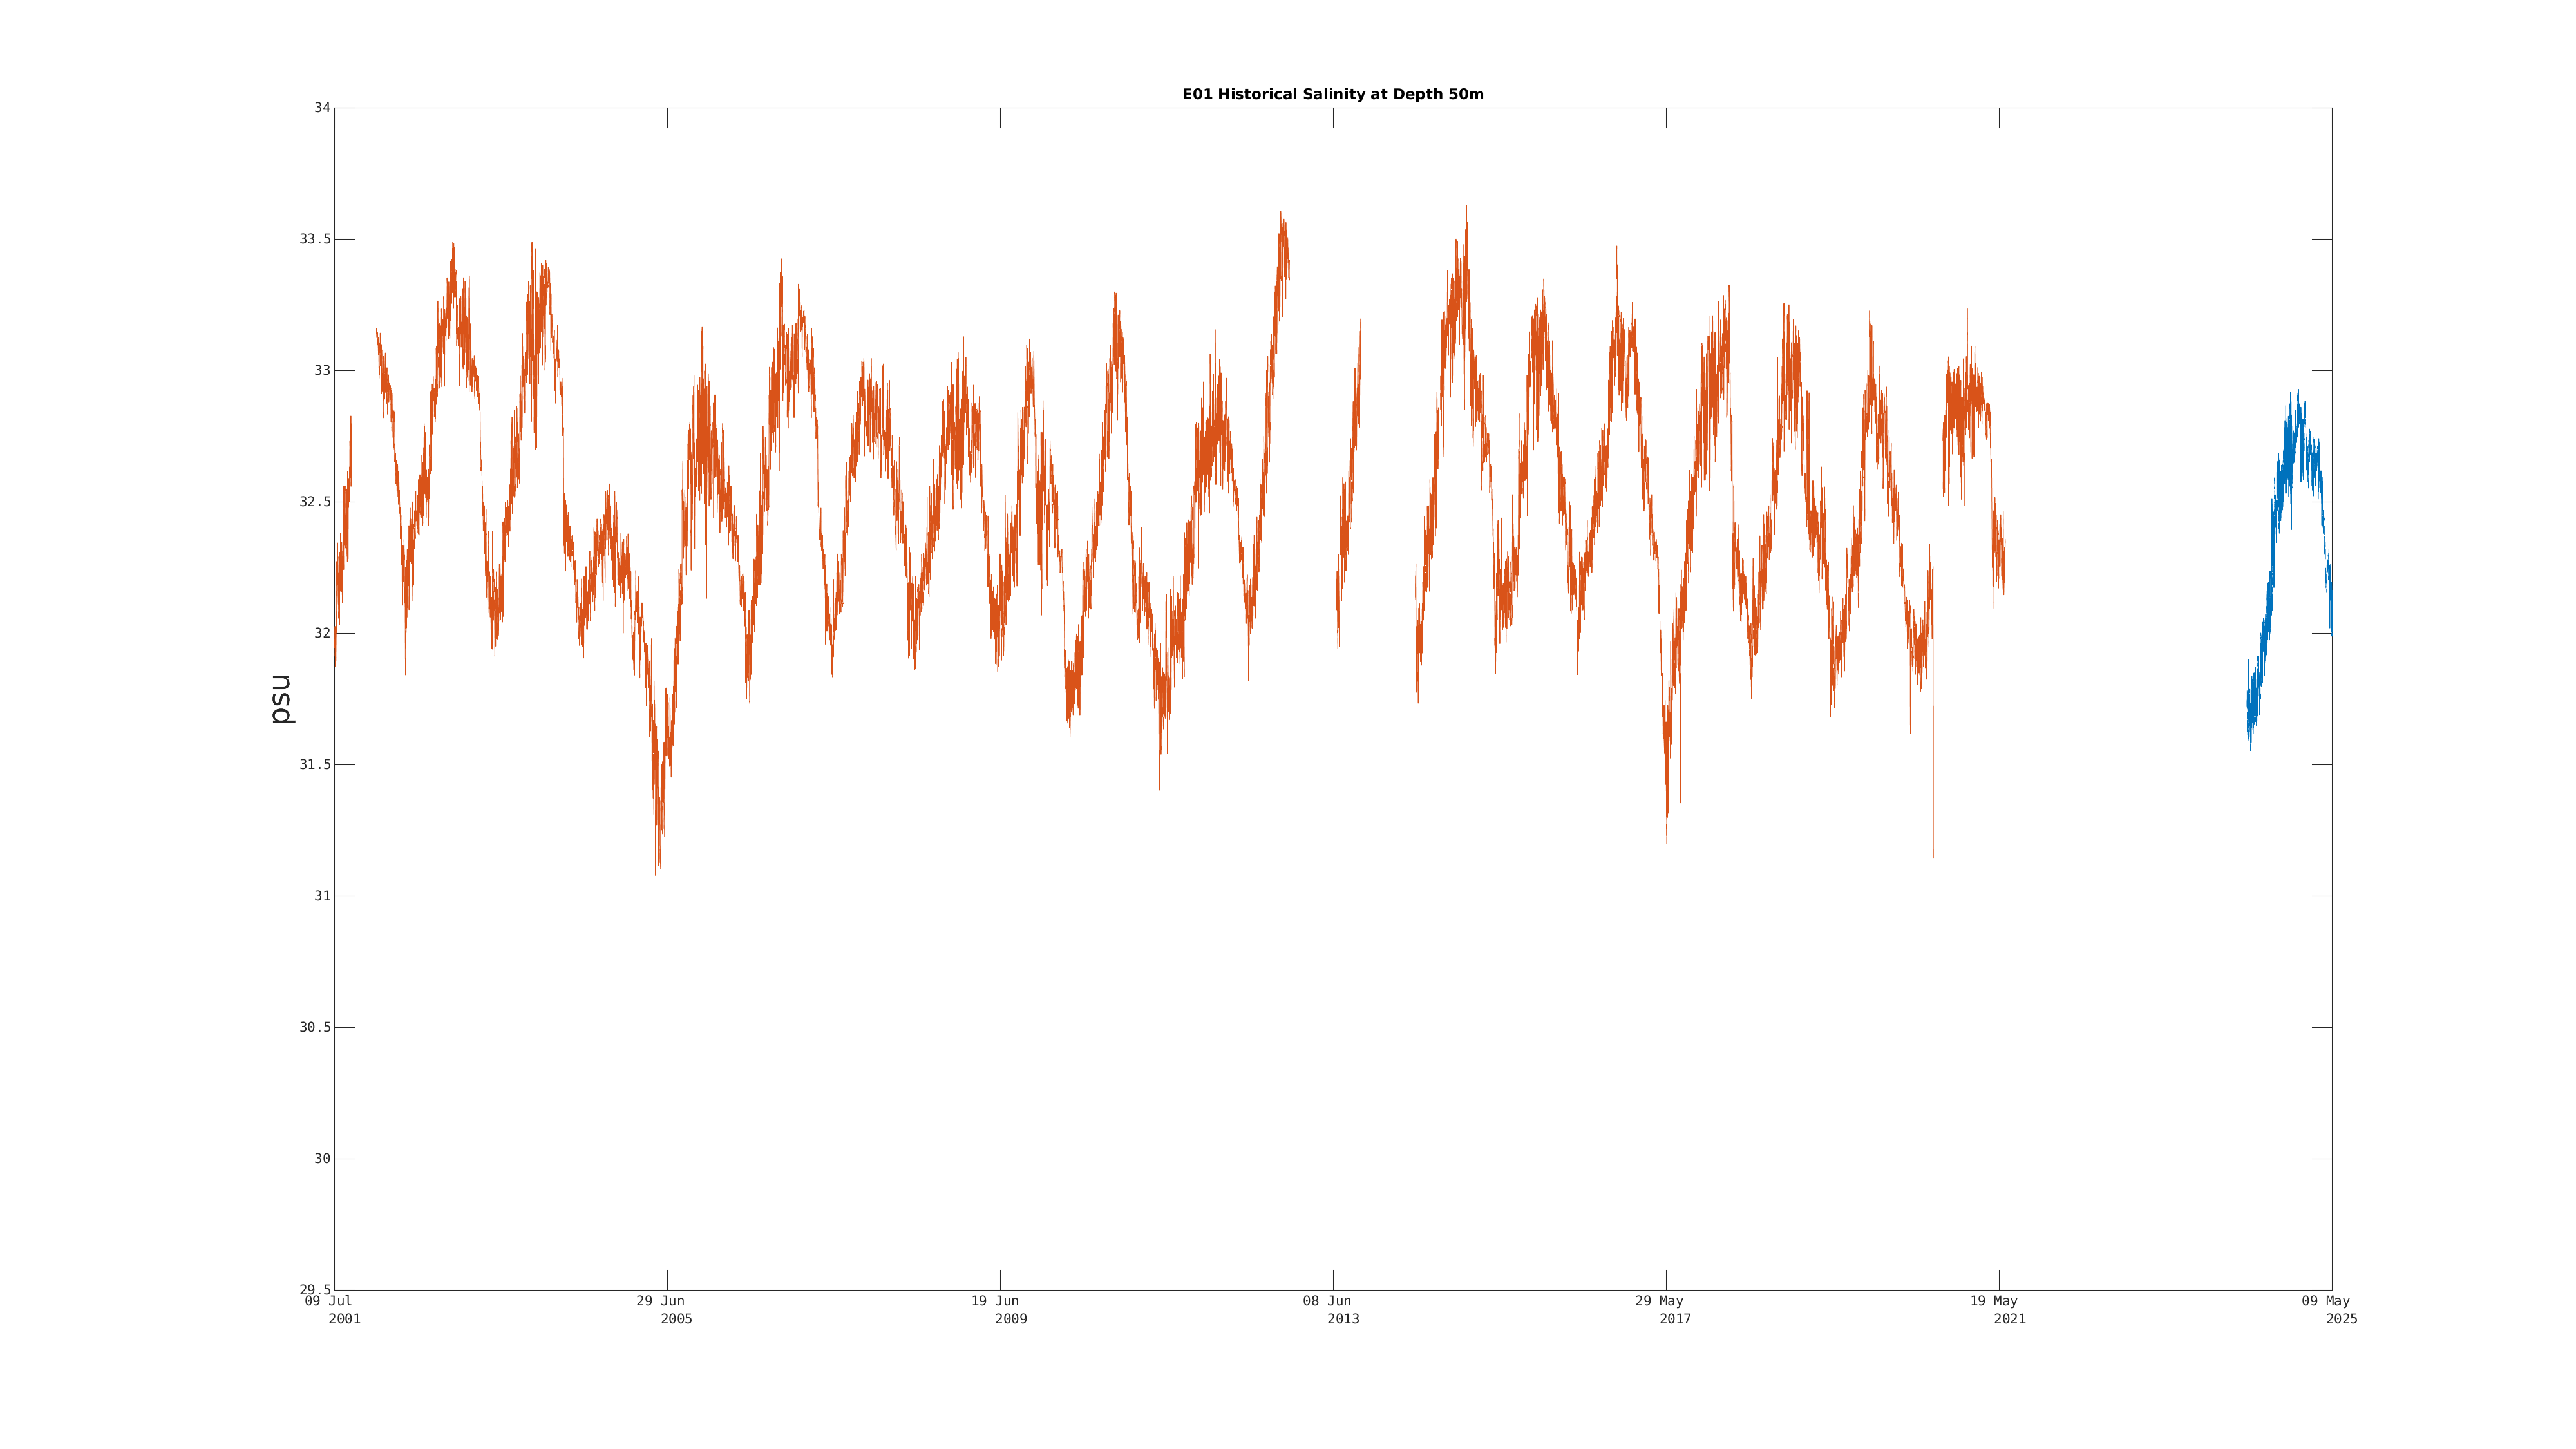
| Salinity (50m) | Sensor Failure | Dec 21 9:00 PM |
|
|
|
|
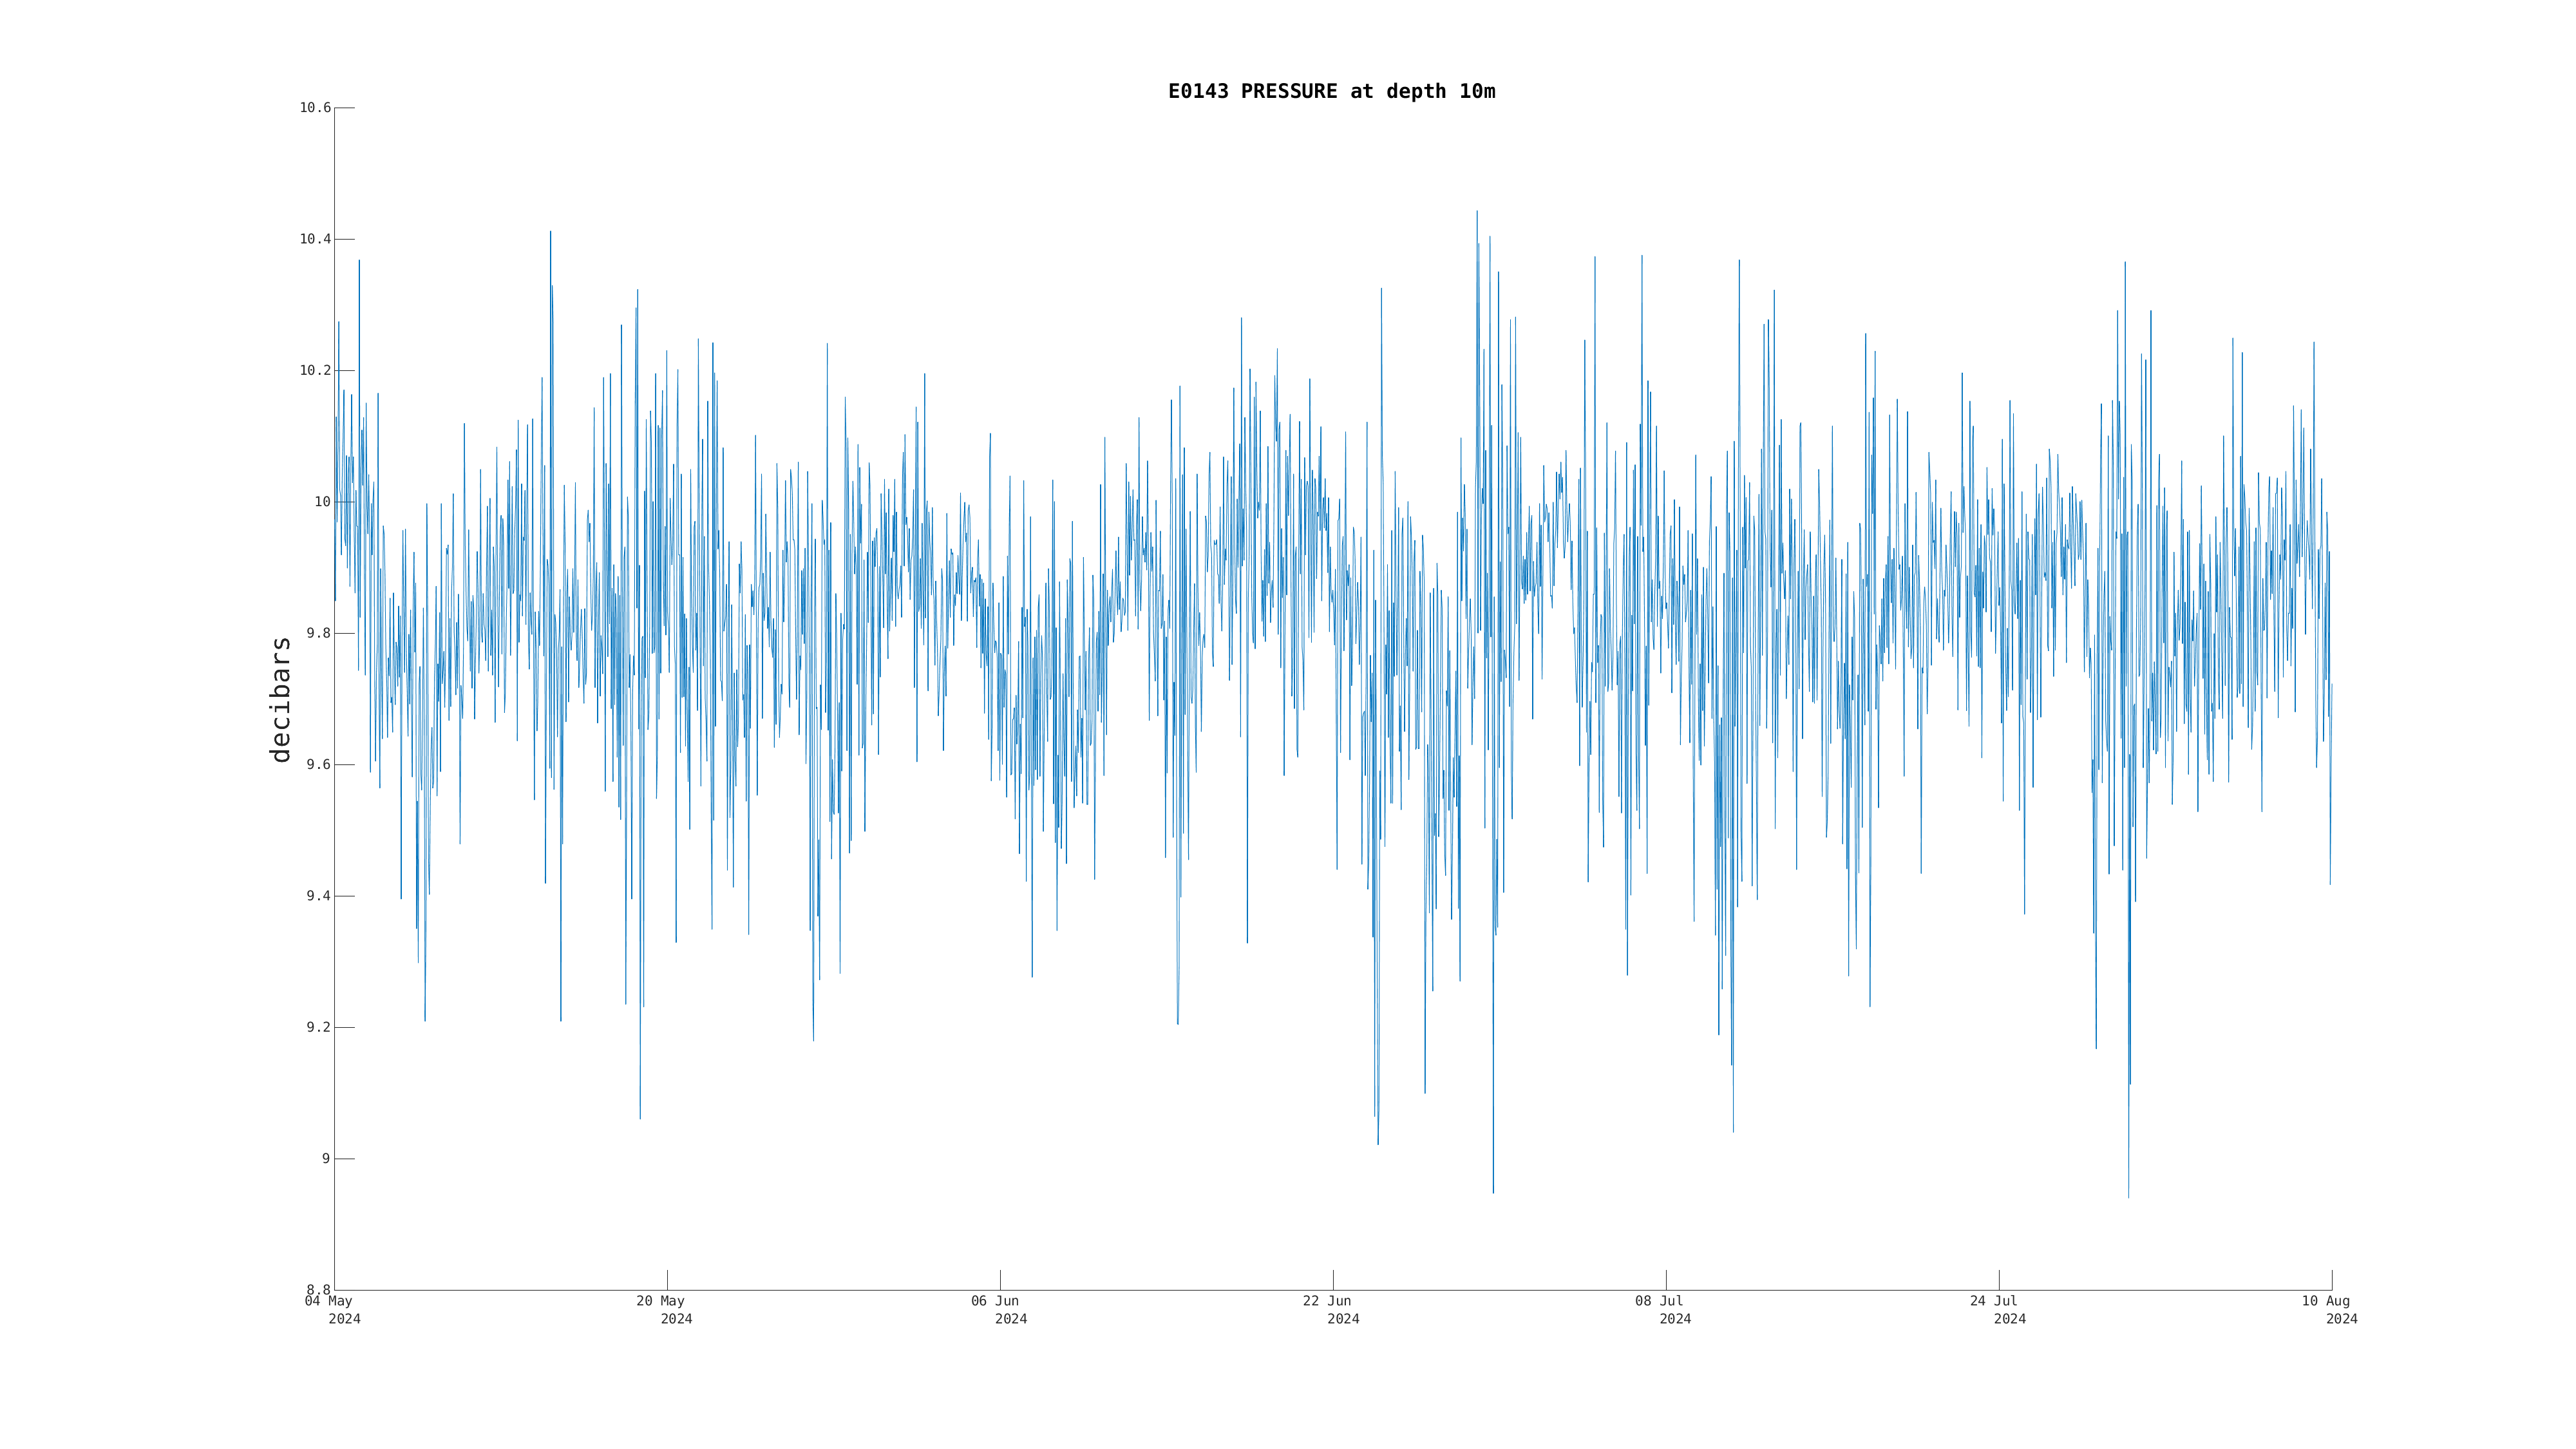
| Pressure (10m) | Sensor Failure | Sep 29 7:00 AM |
|
|
|
|
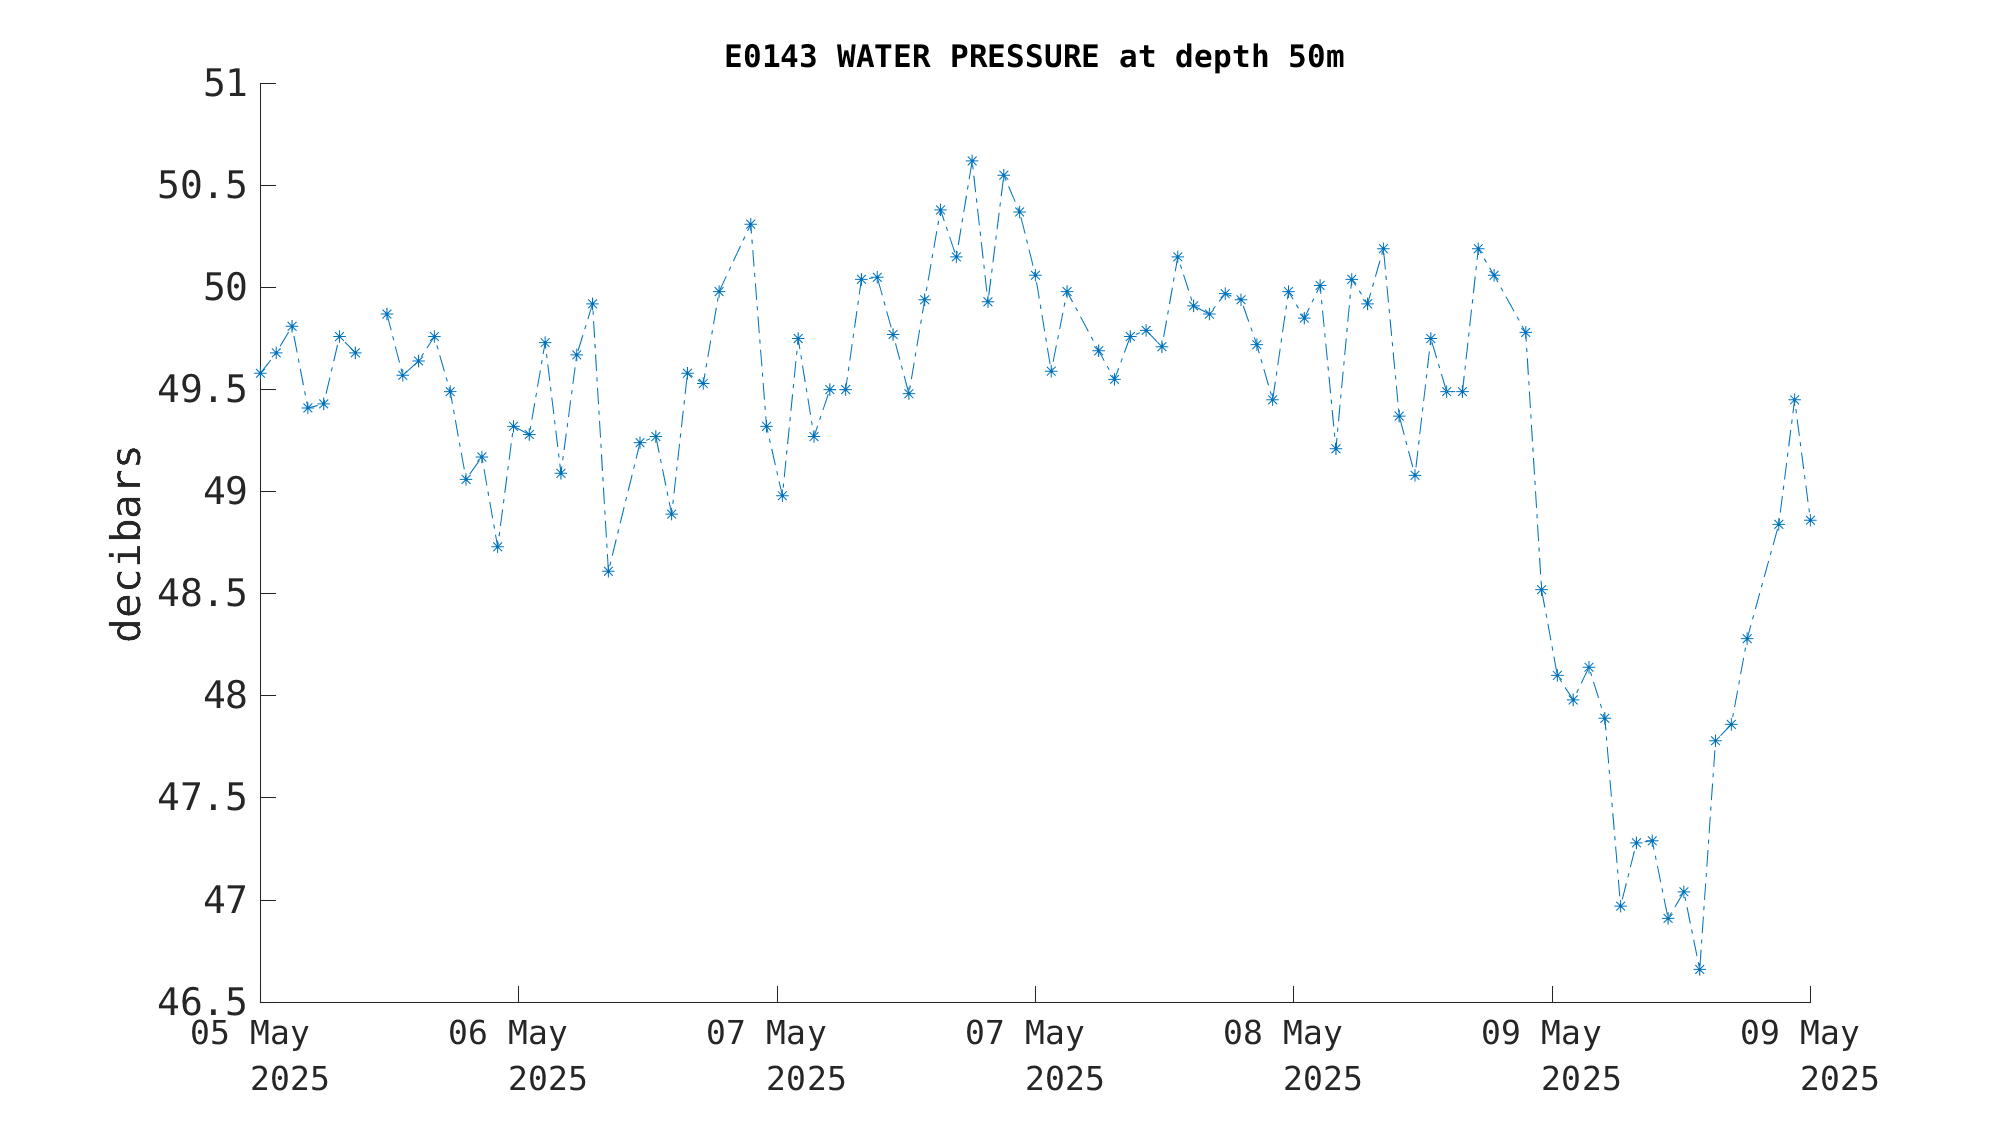
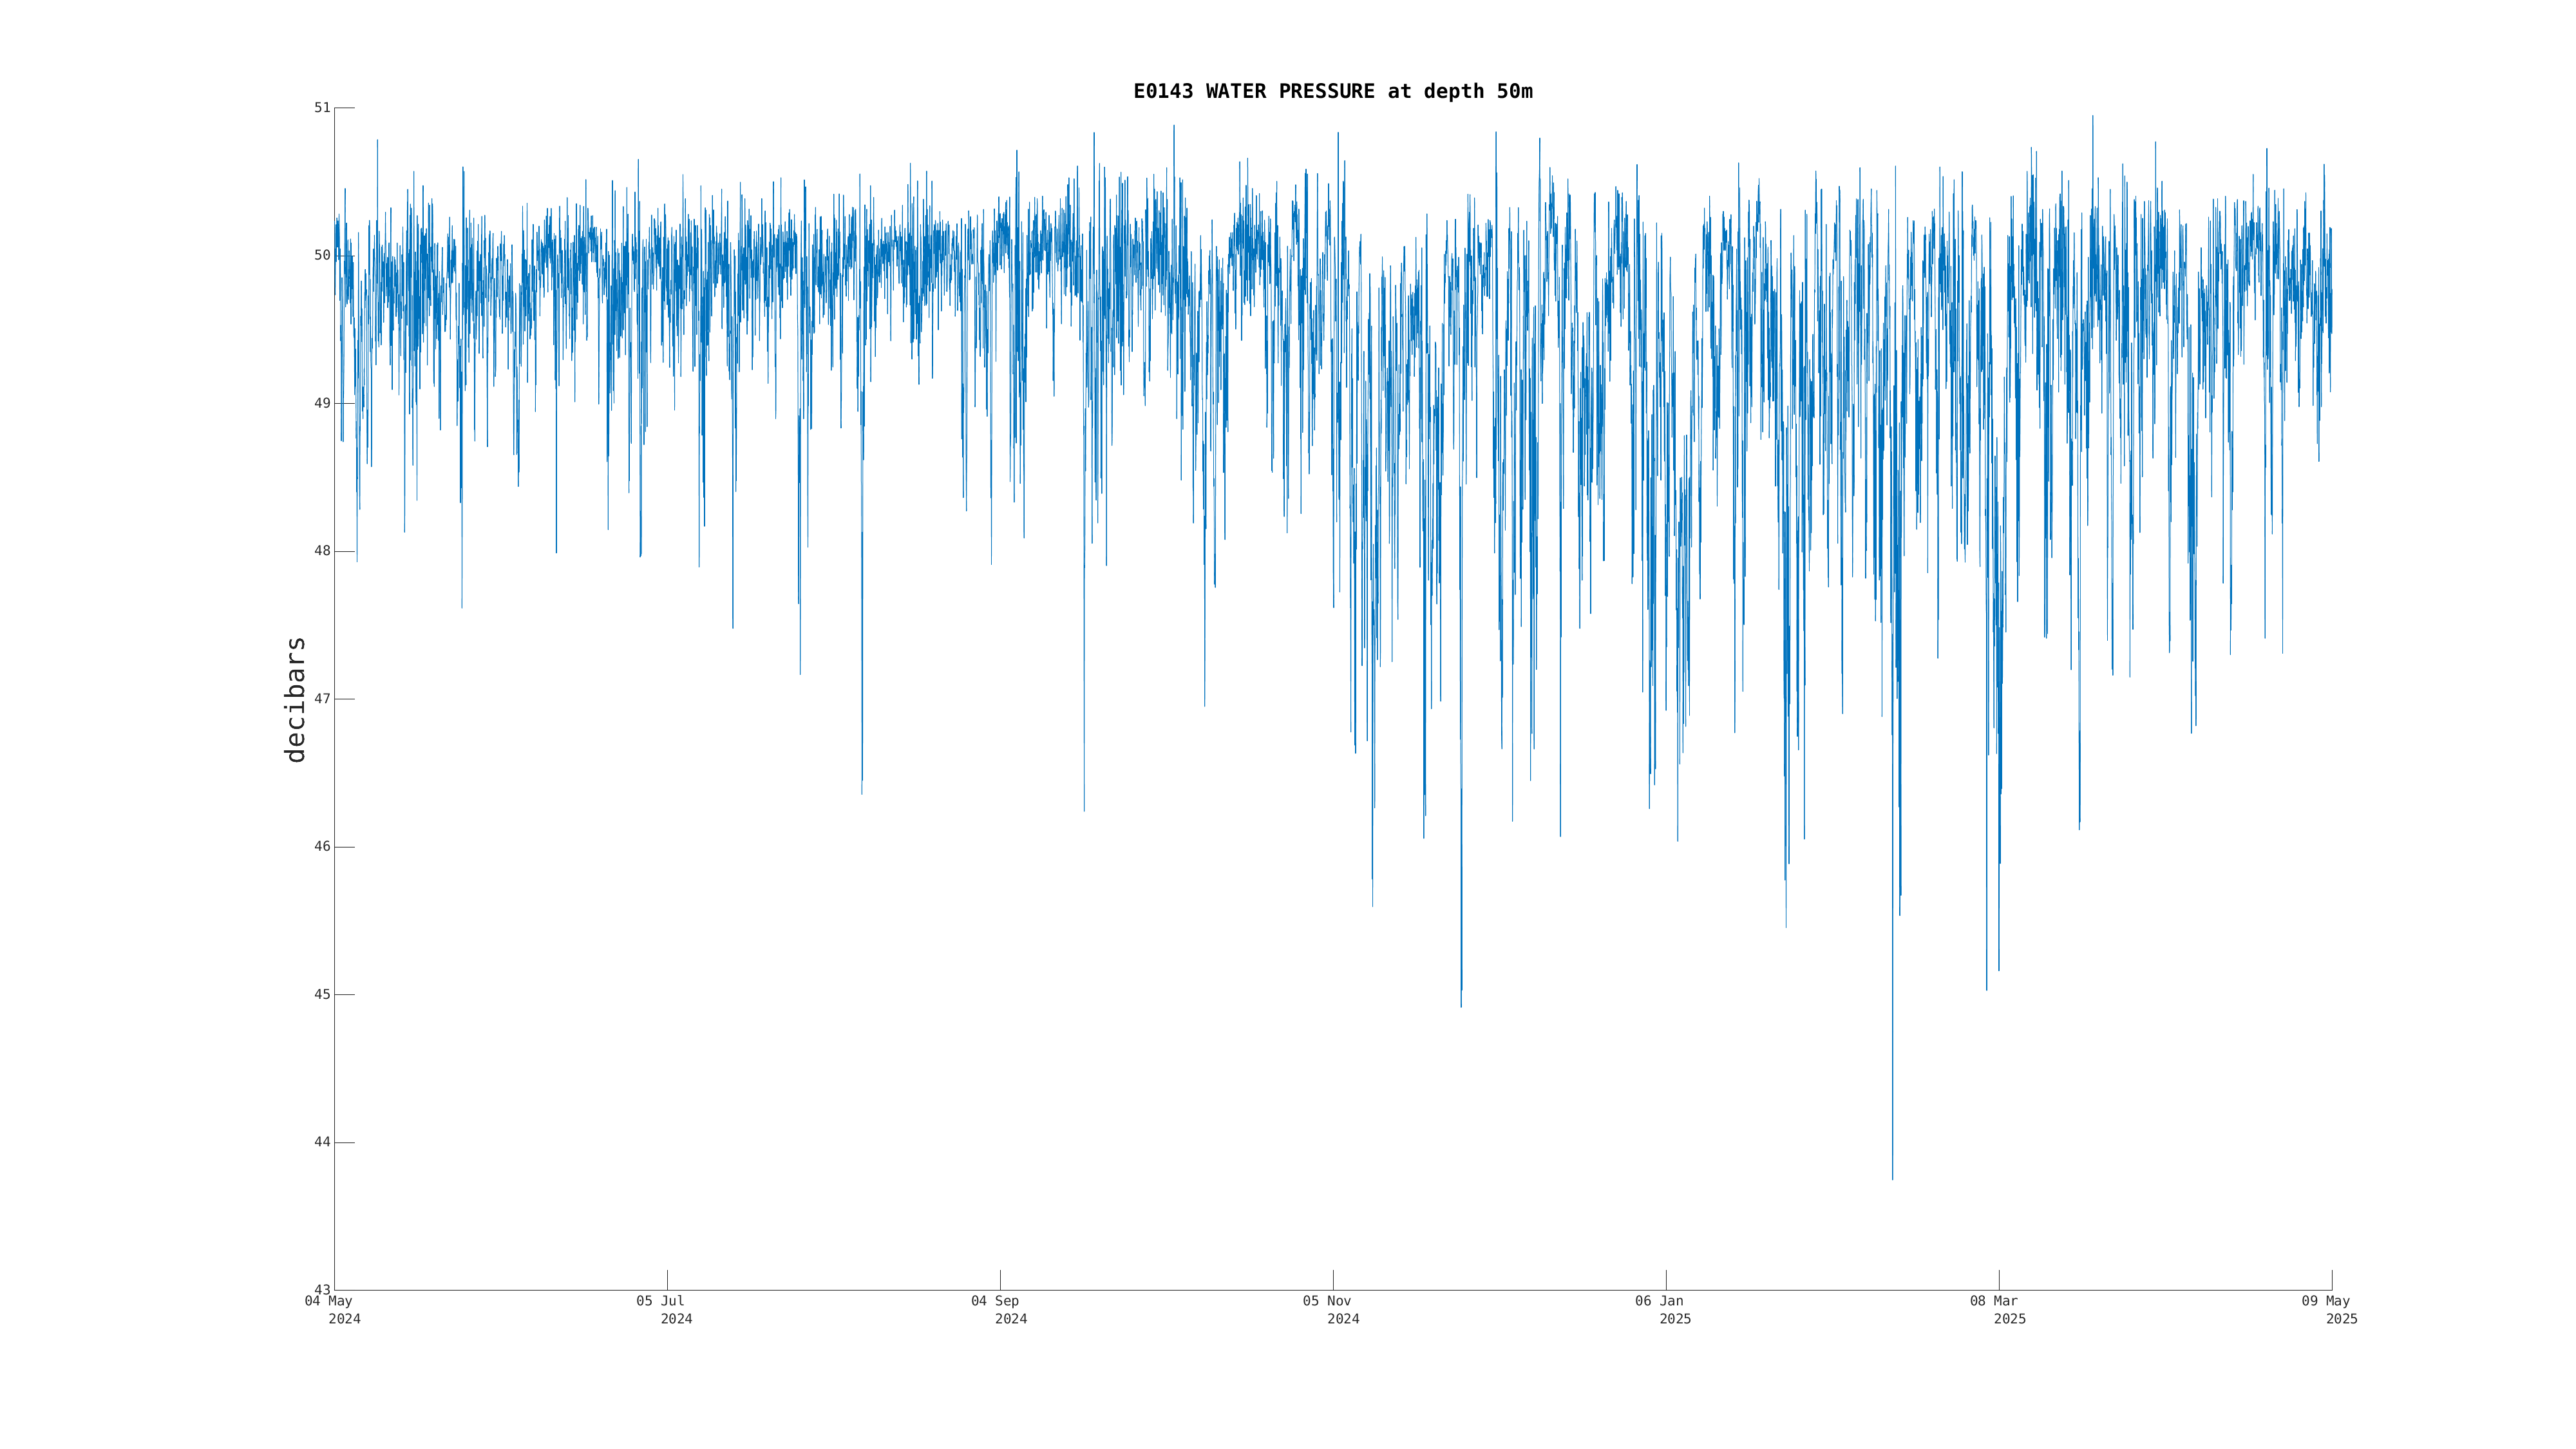
| Pressure (50m) | Sensor Failure | Dec 21 9:00 PM |
|
|
|
|
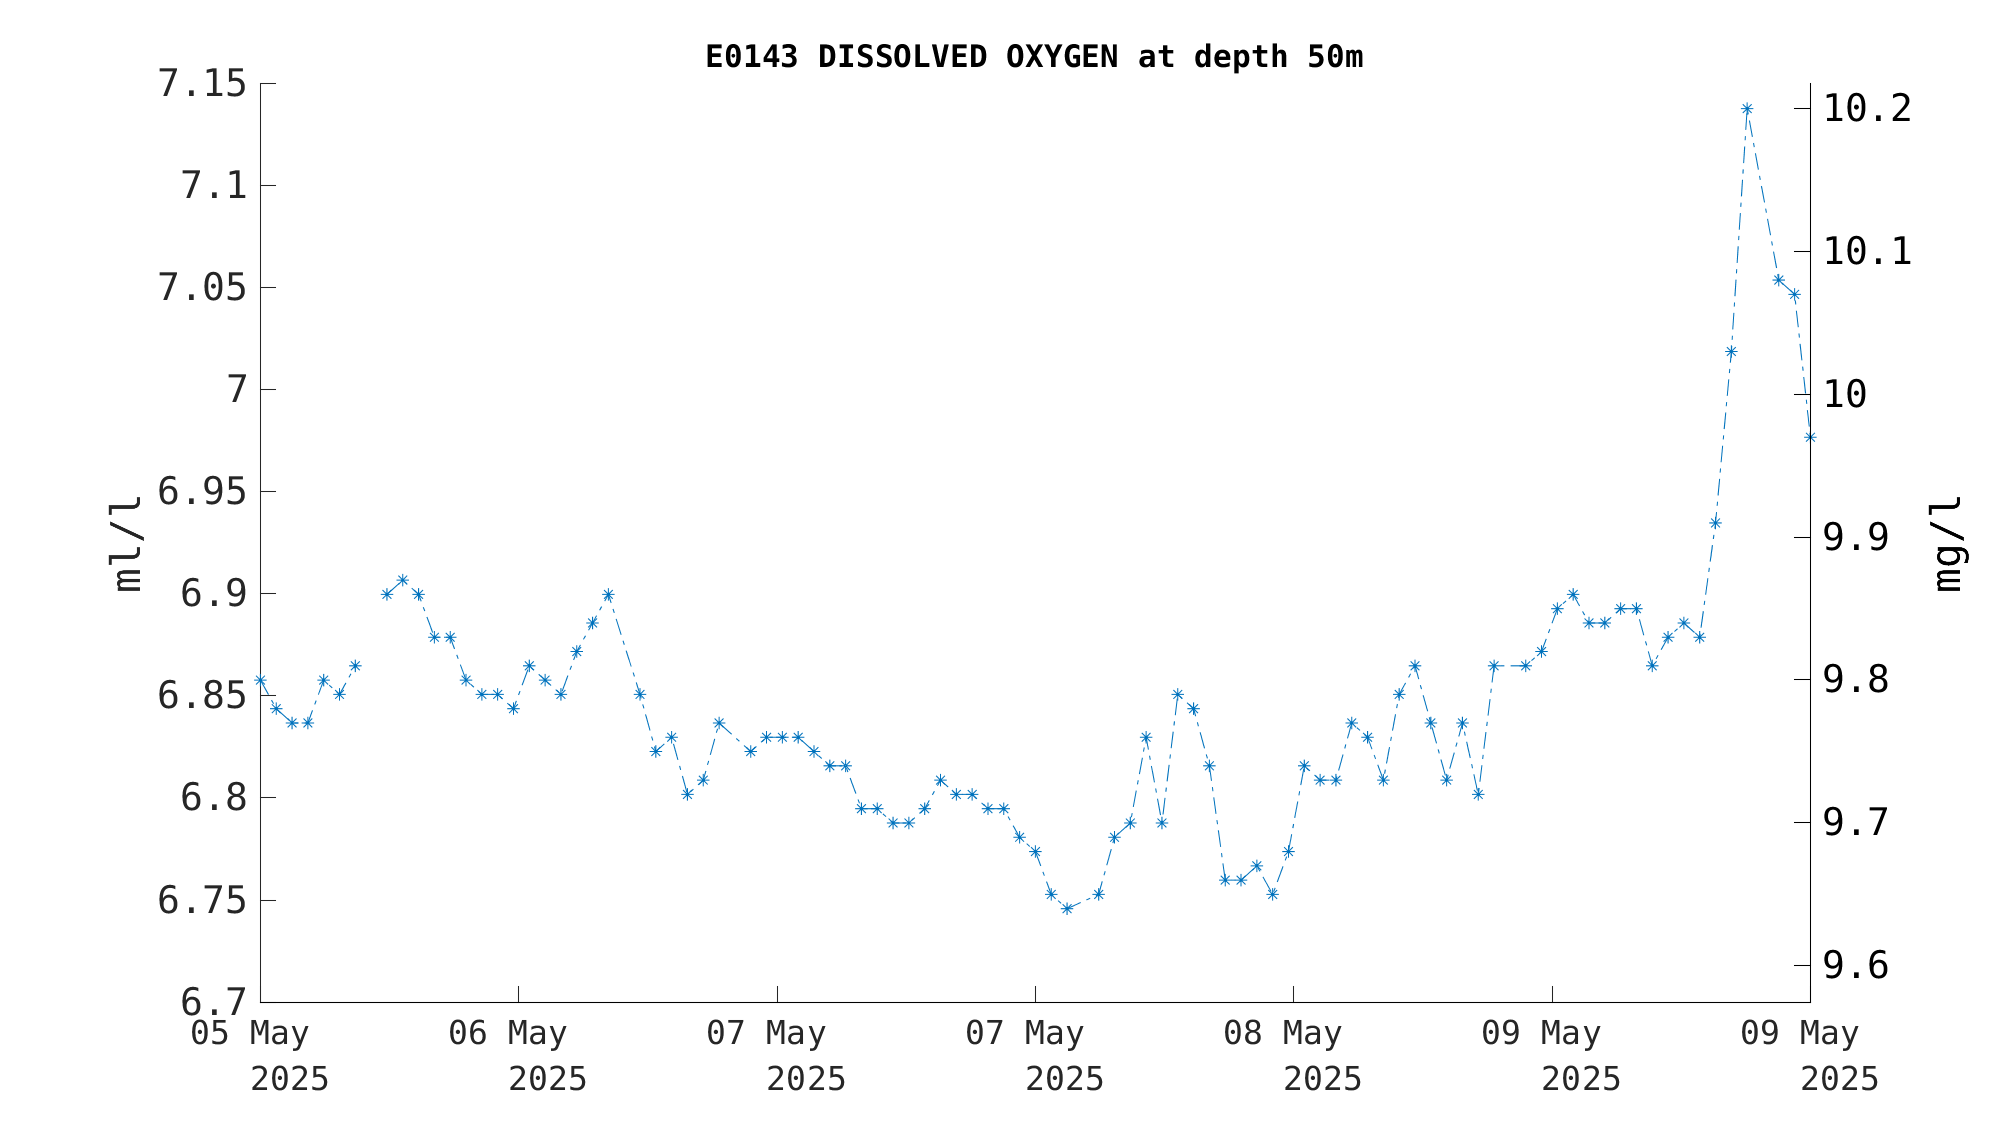
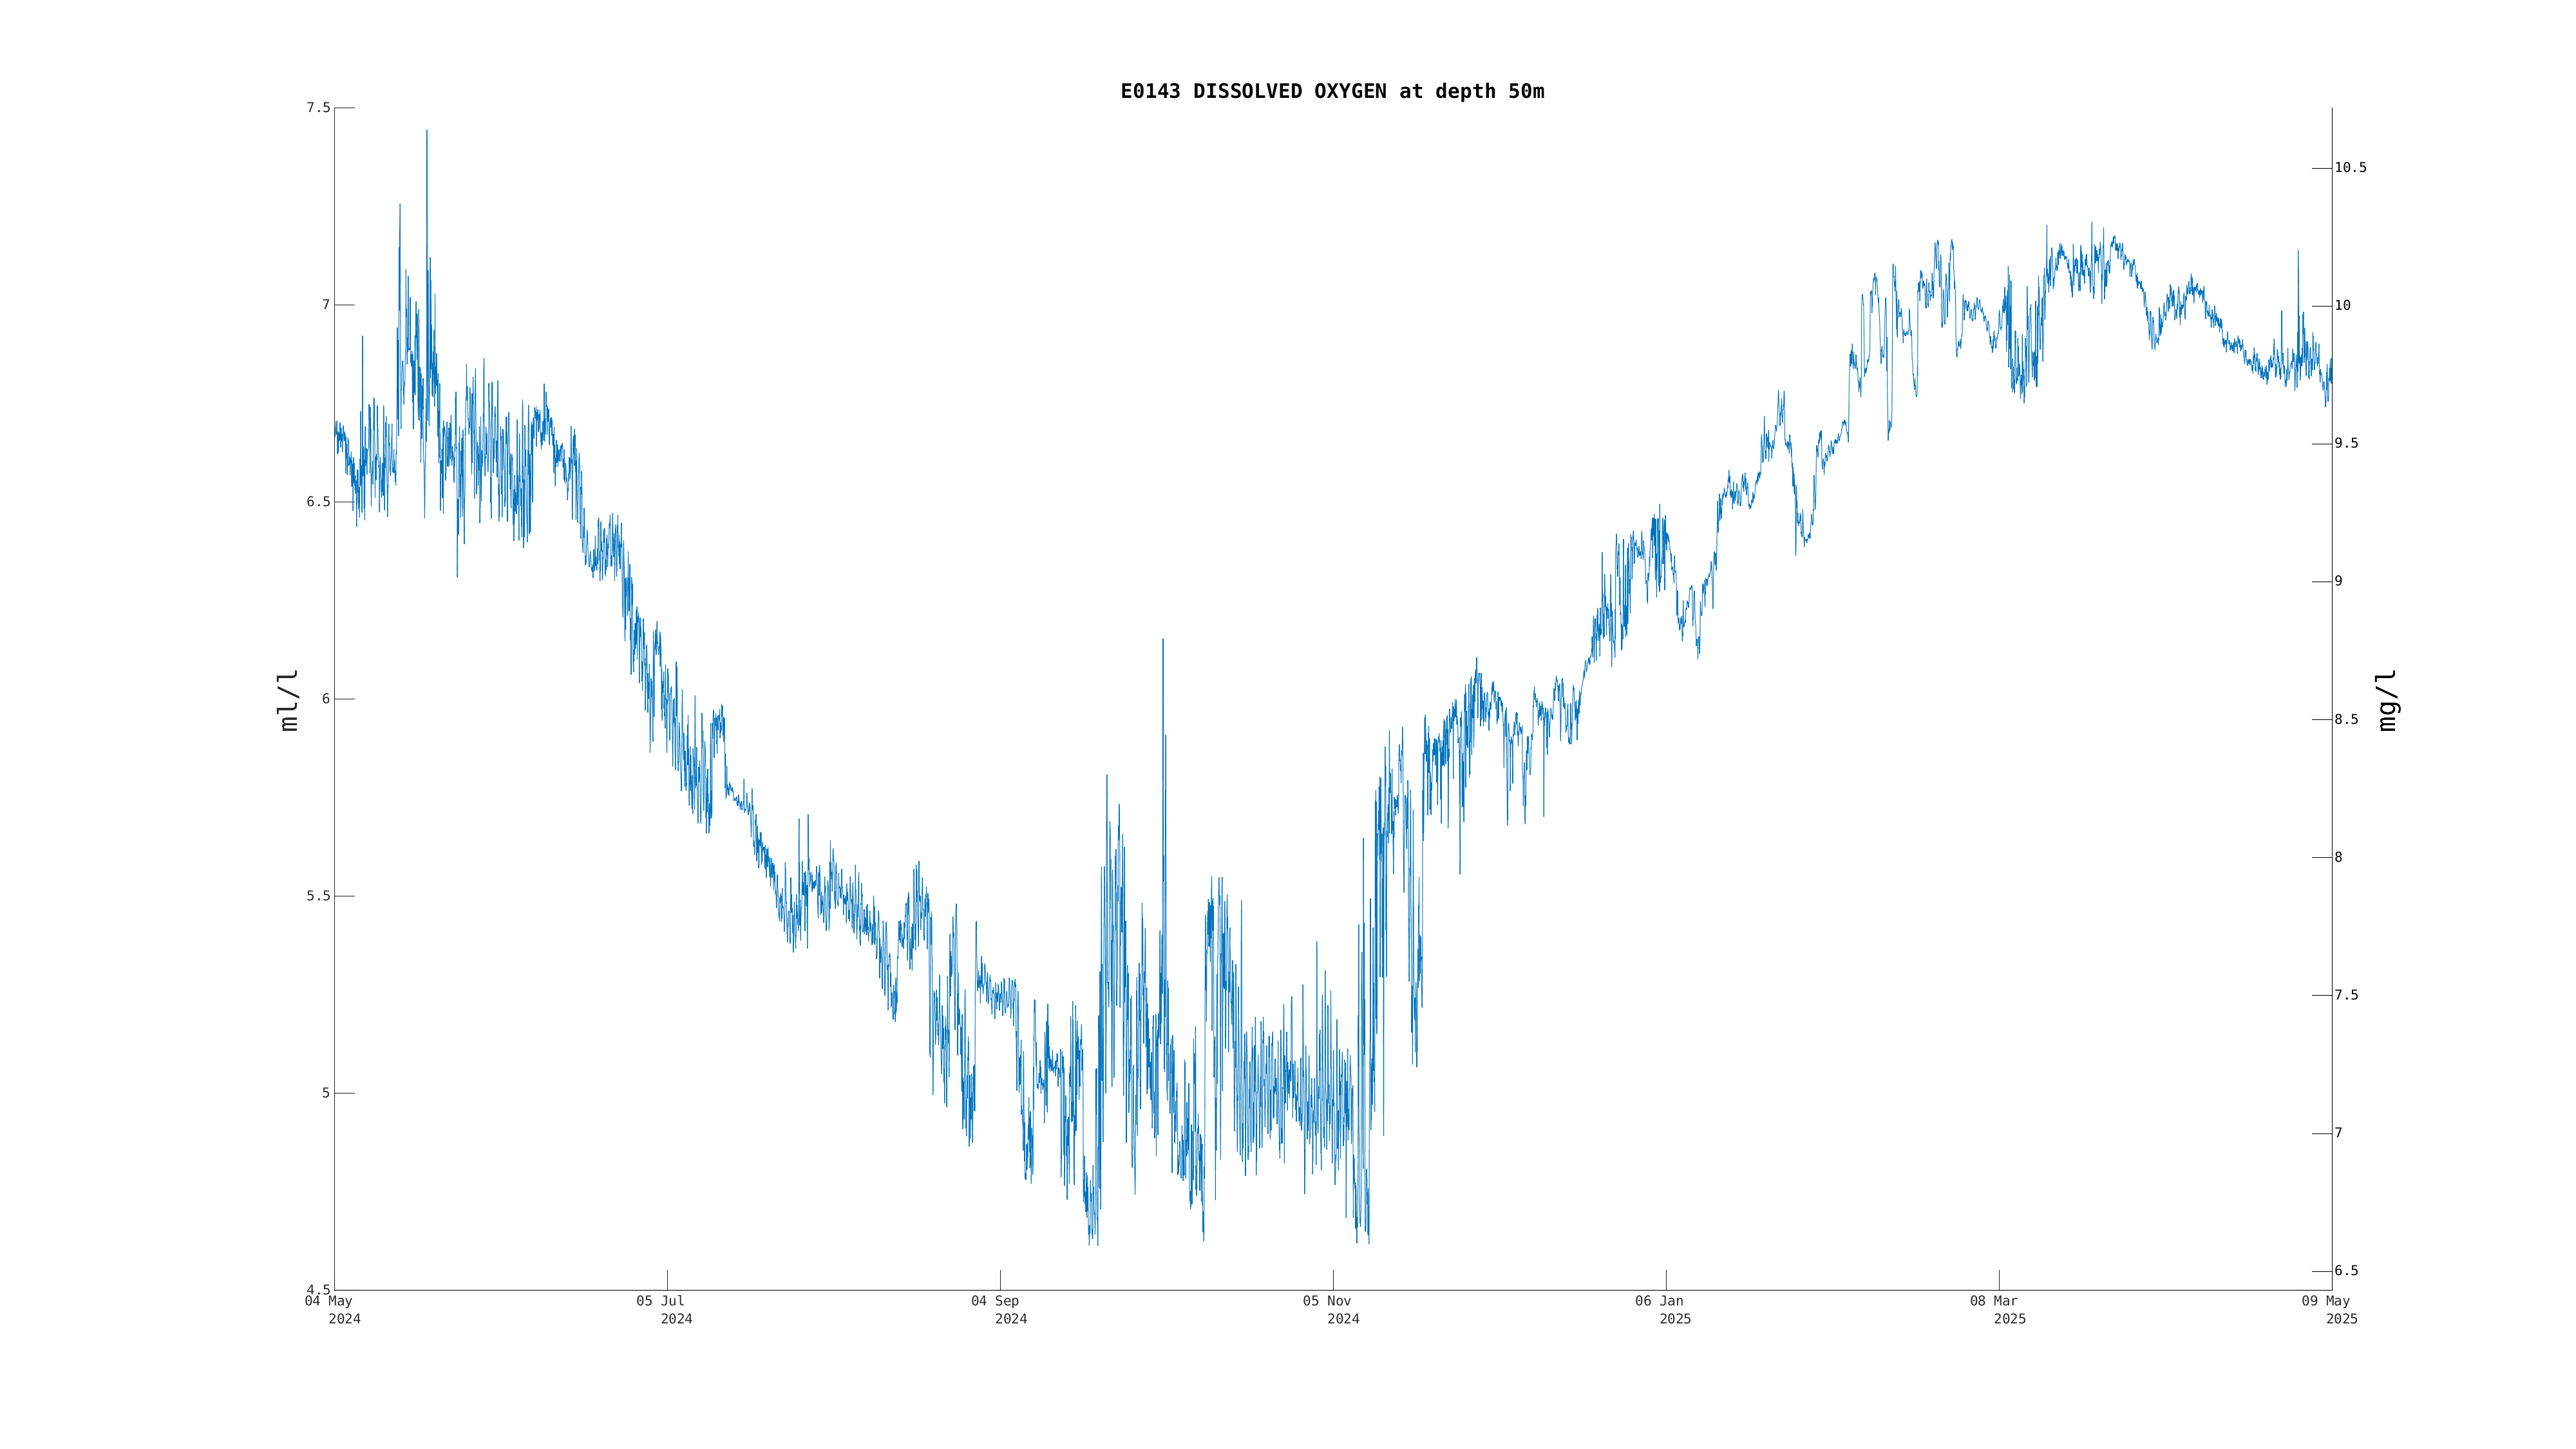
| Dissolved Oxygen (50m) | Sensor Failure | Dec 21 9:00 PM |
|
|
|
|
| Oxygen Saturation (50m) | Sensor Failure | Dec 21 9:00 PM |
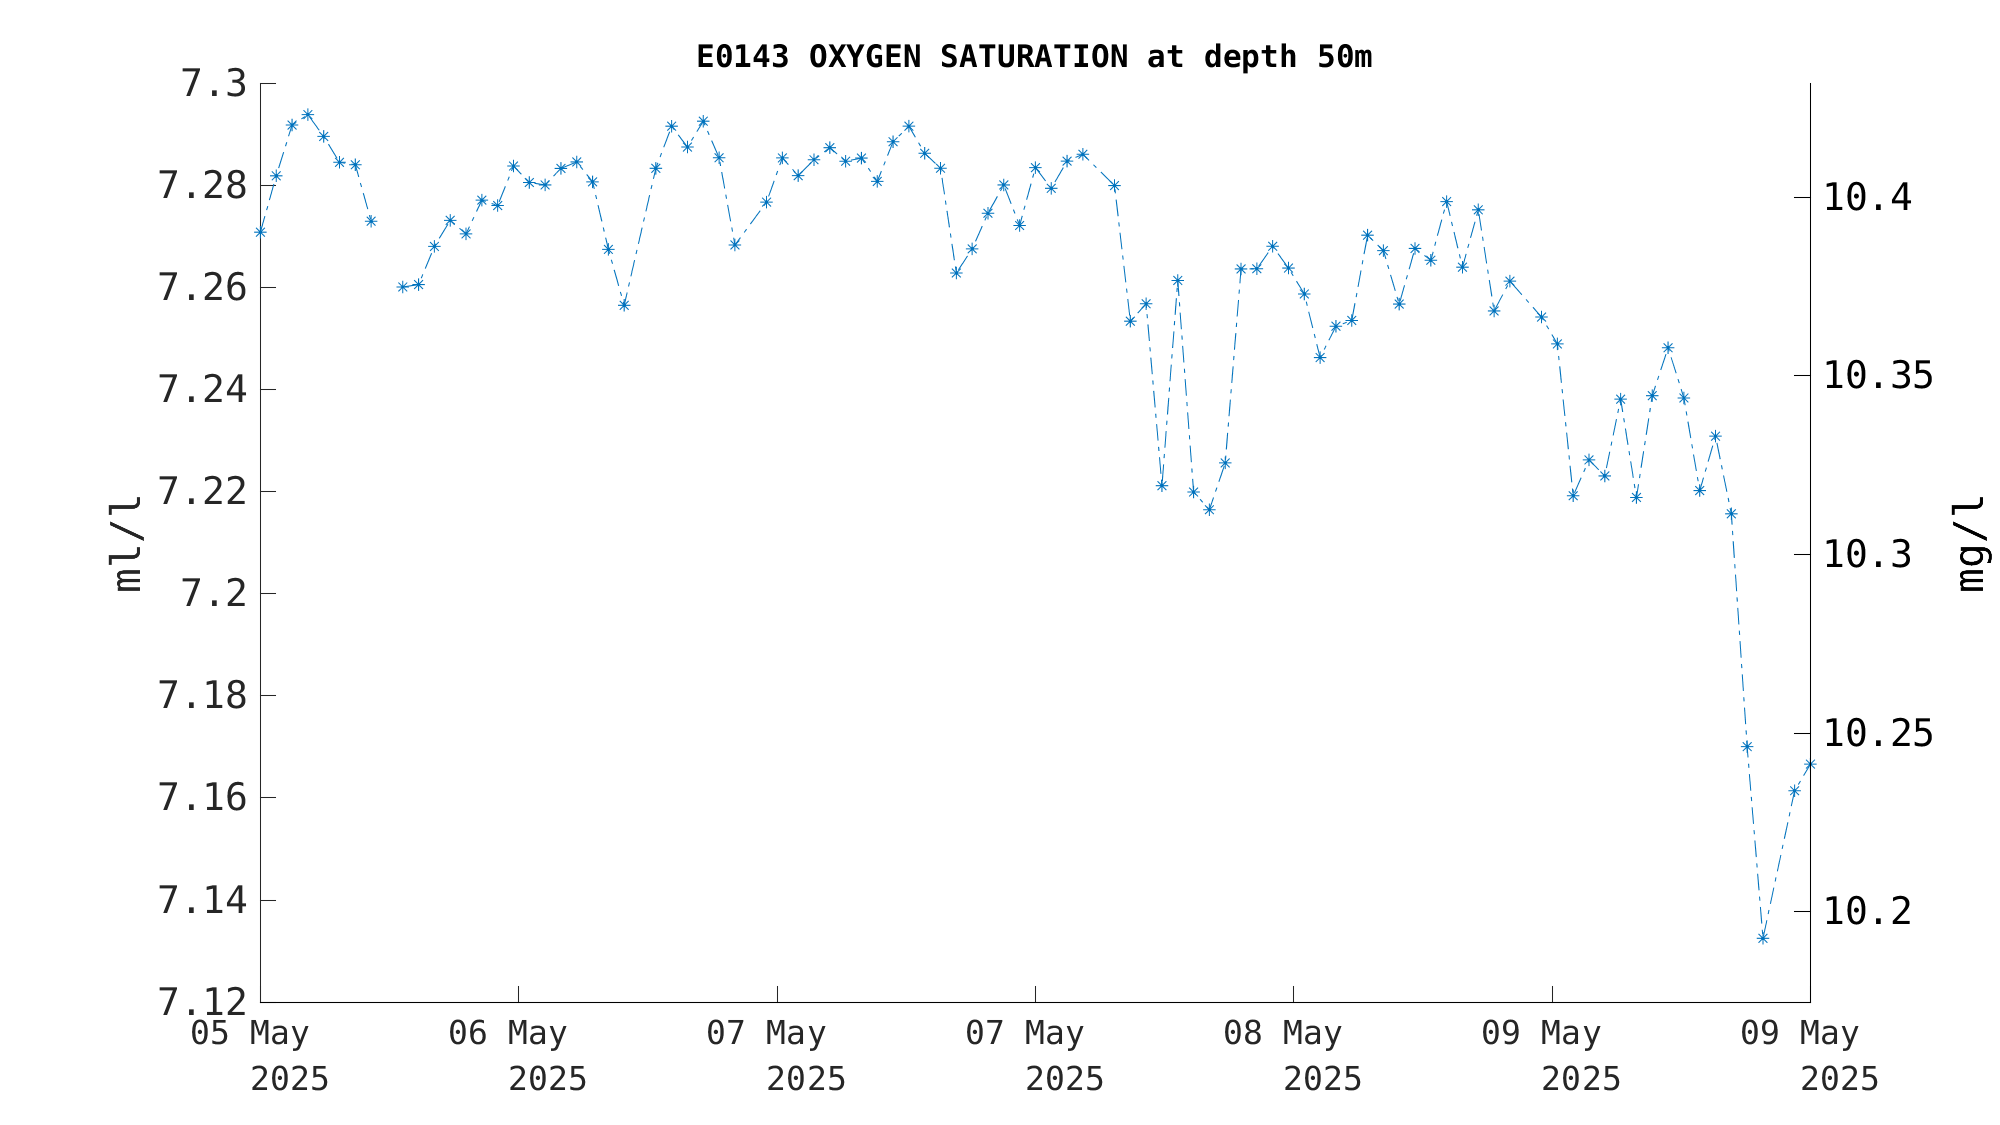
|
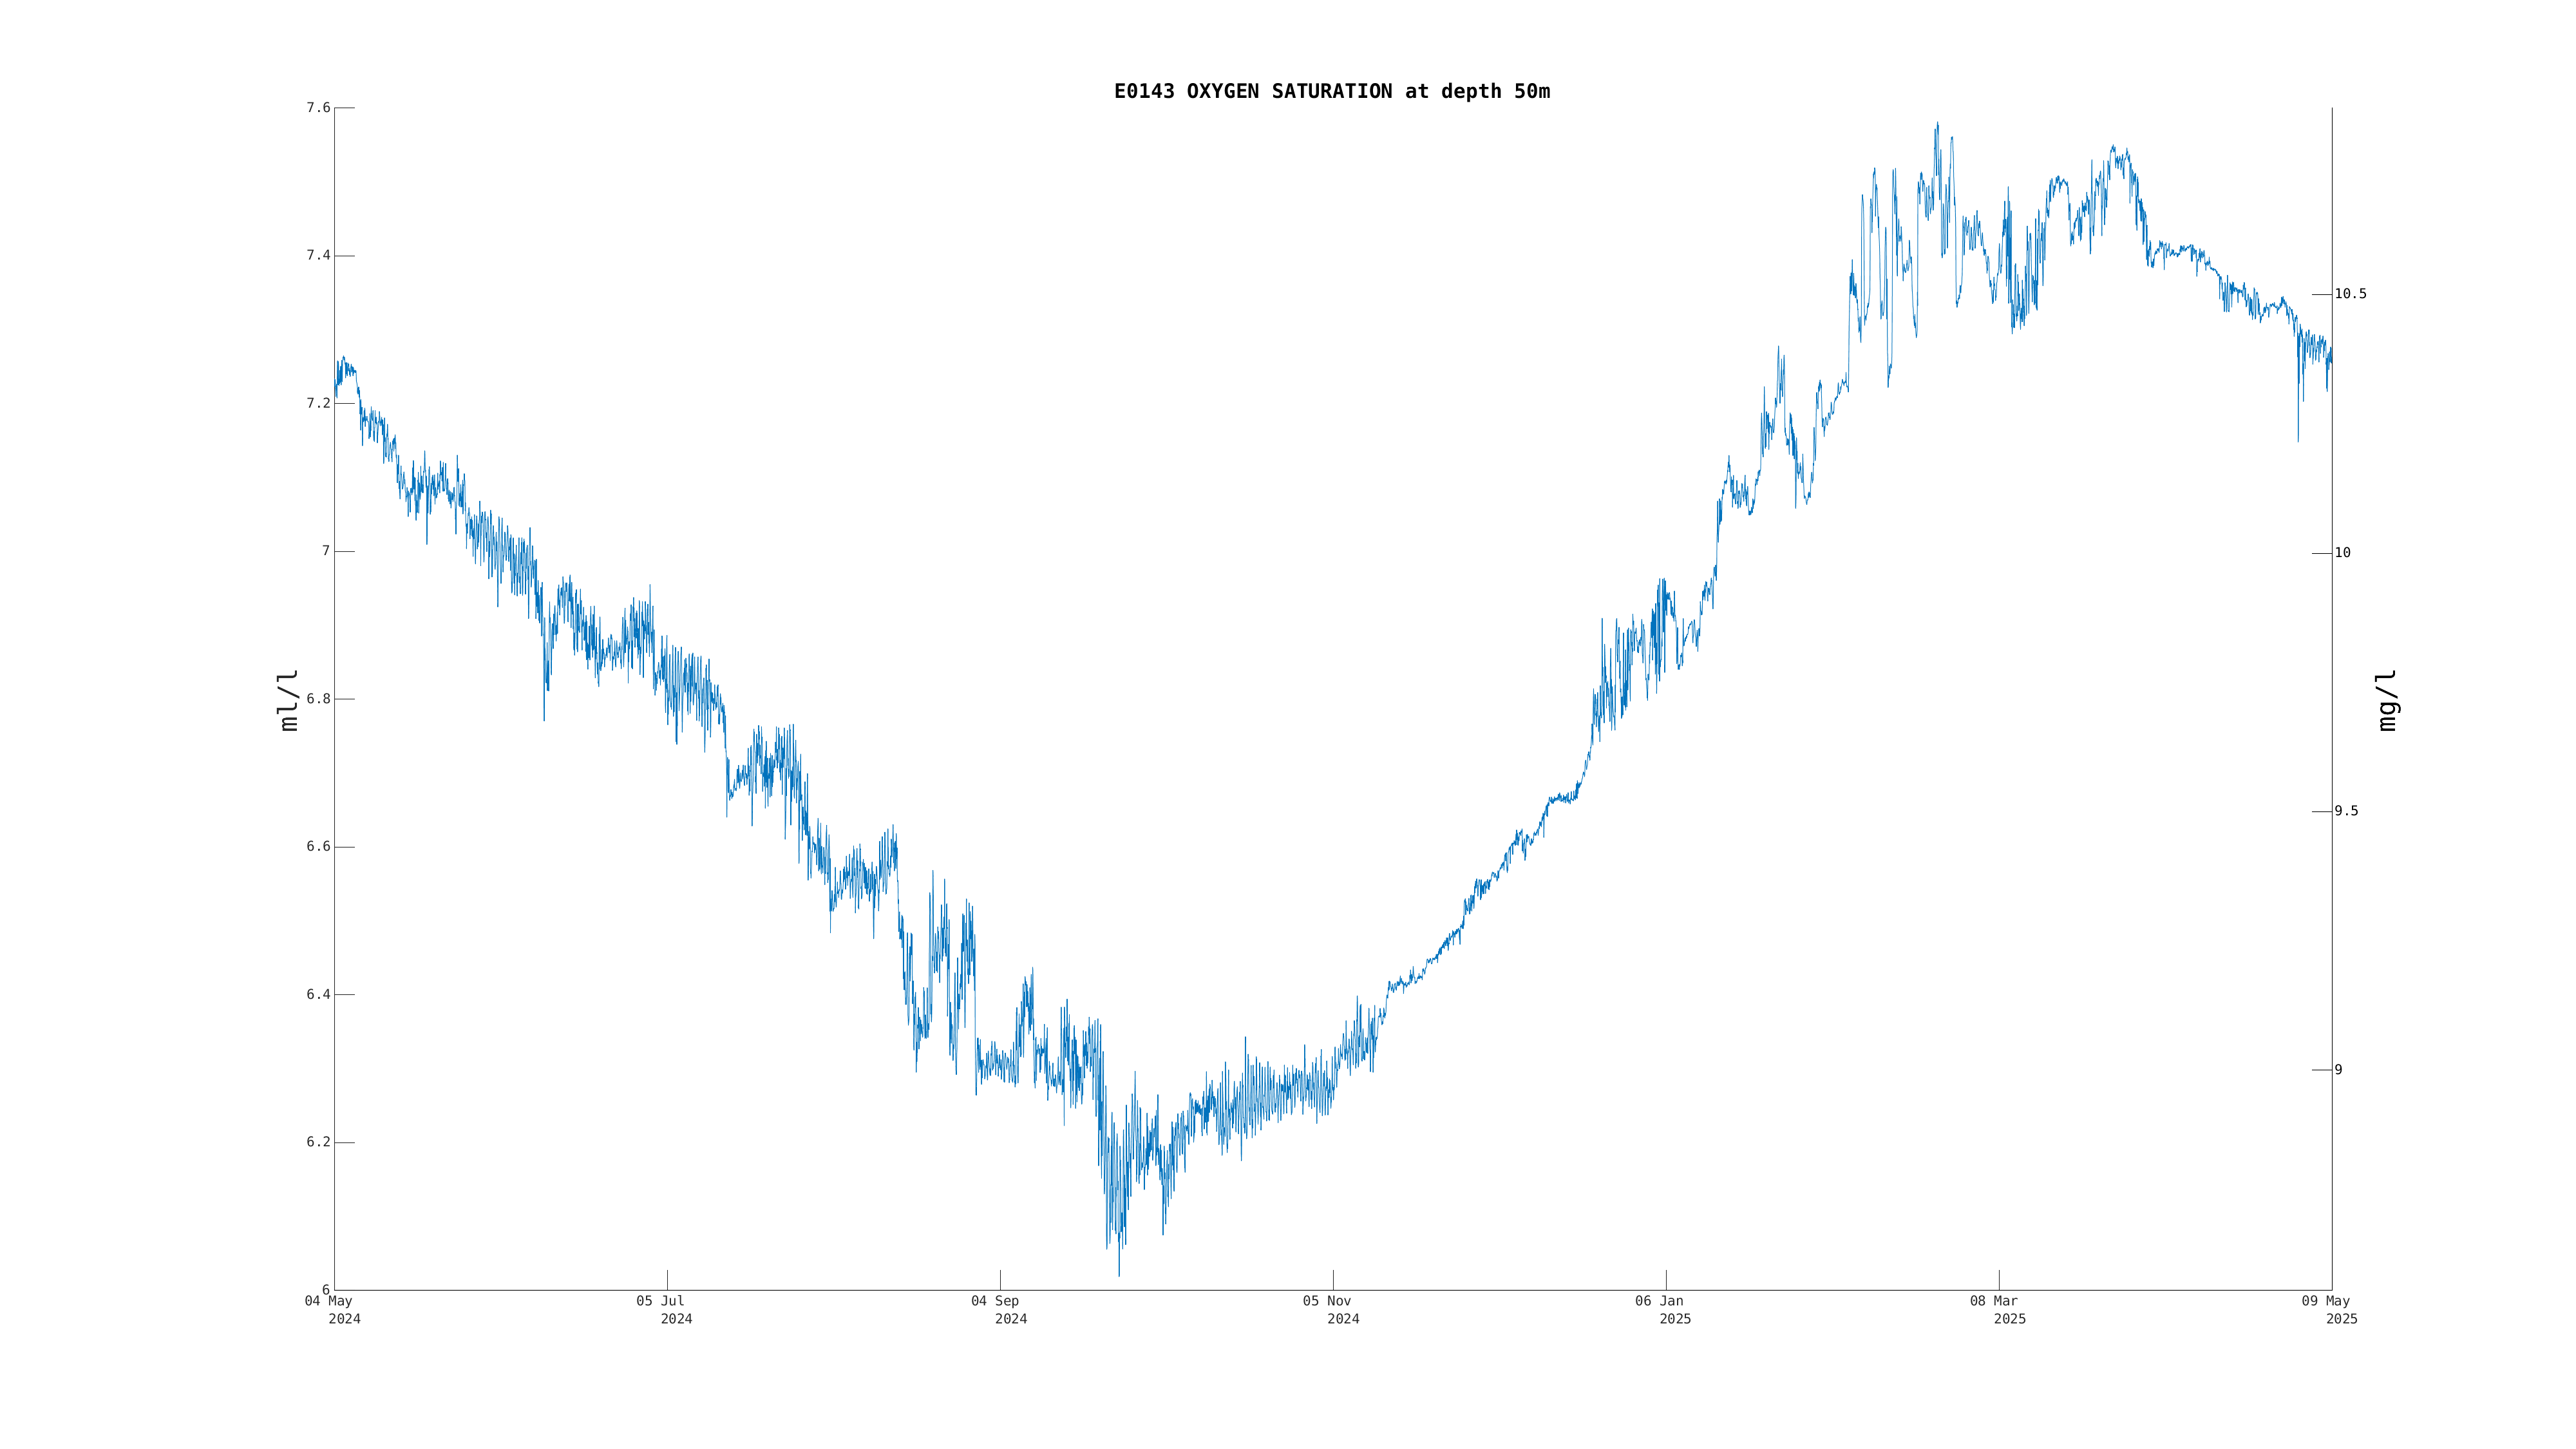
|
|
|
| Percent Oxygen Saturation (50m) | Sensor Failure | Dec 21 9:00 PM |
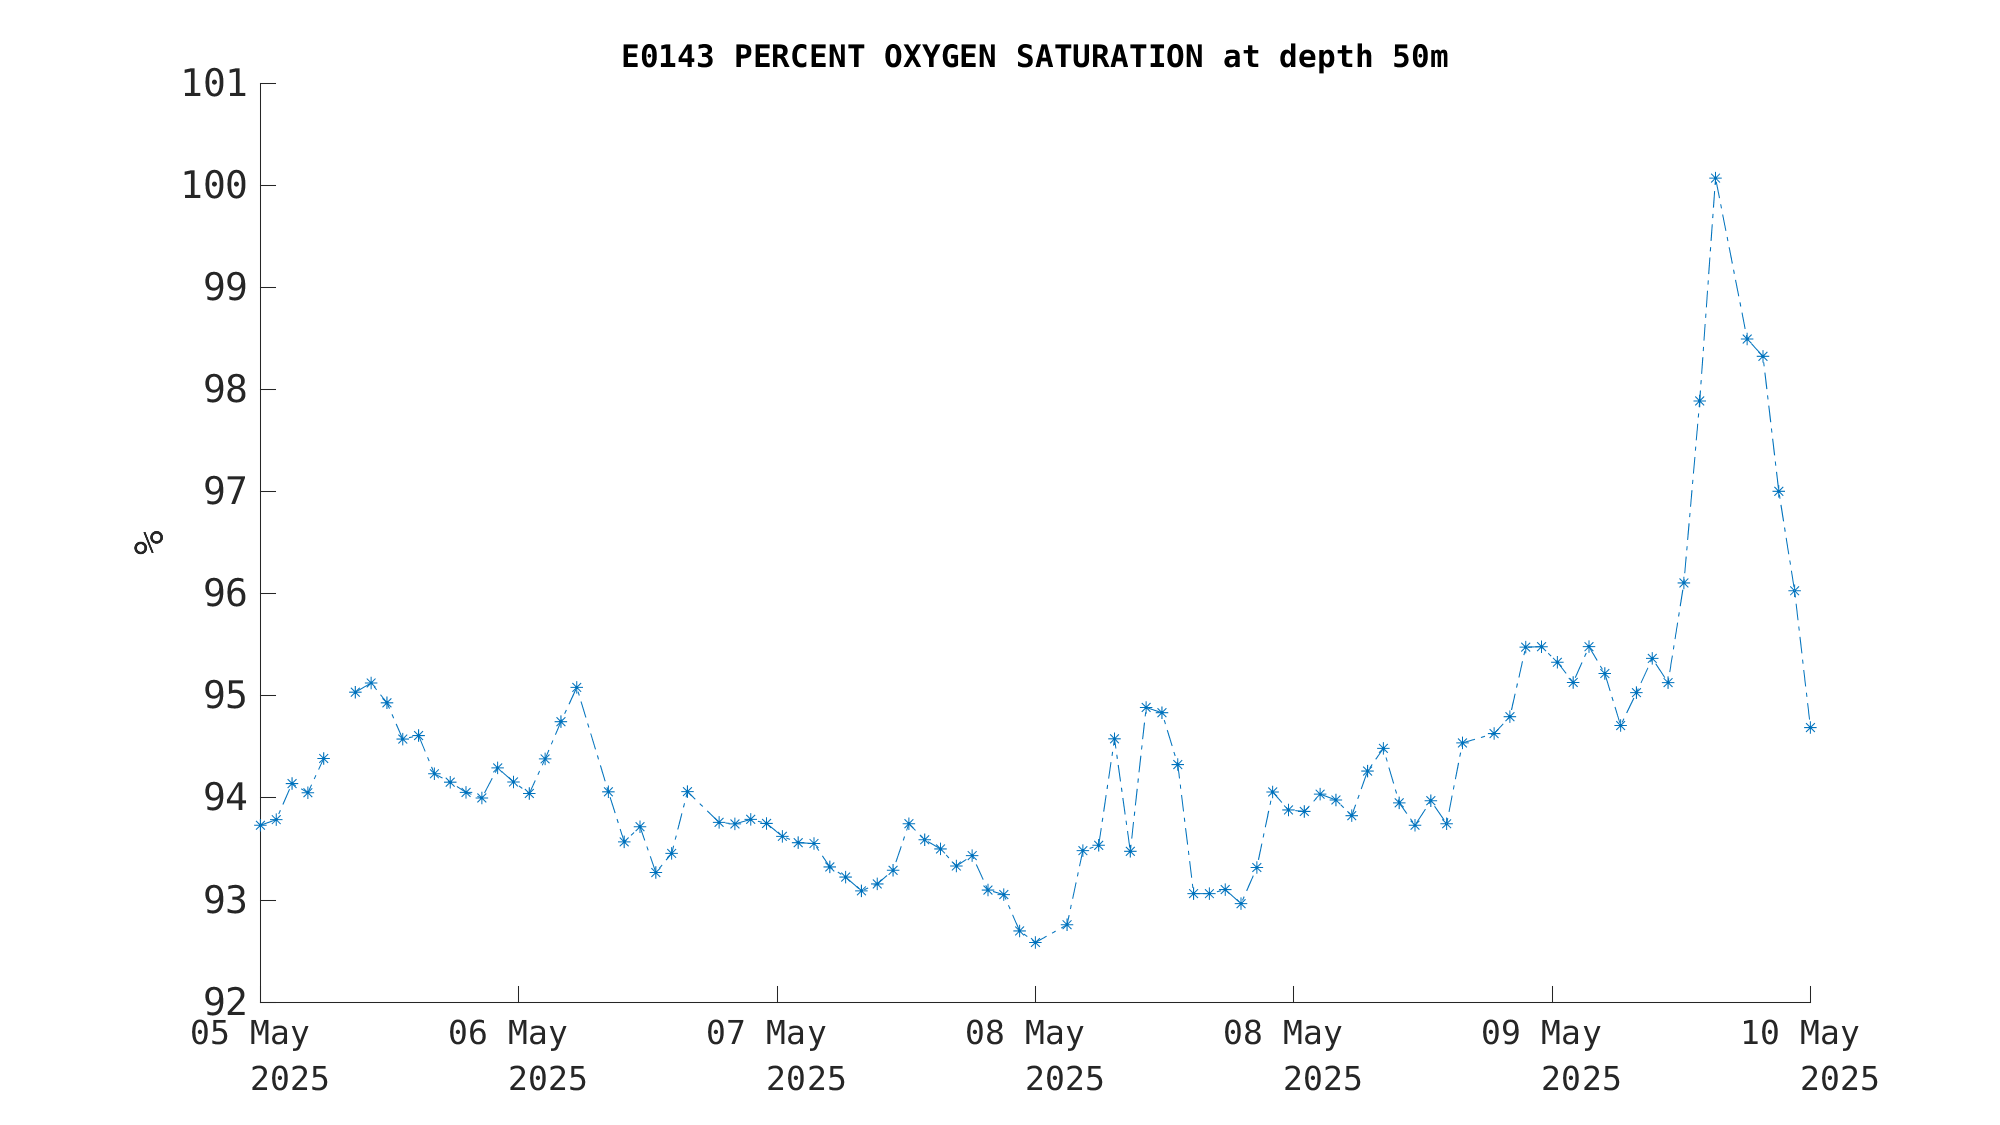
|
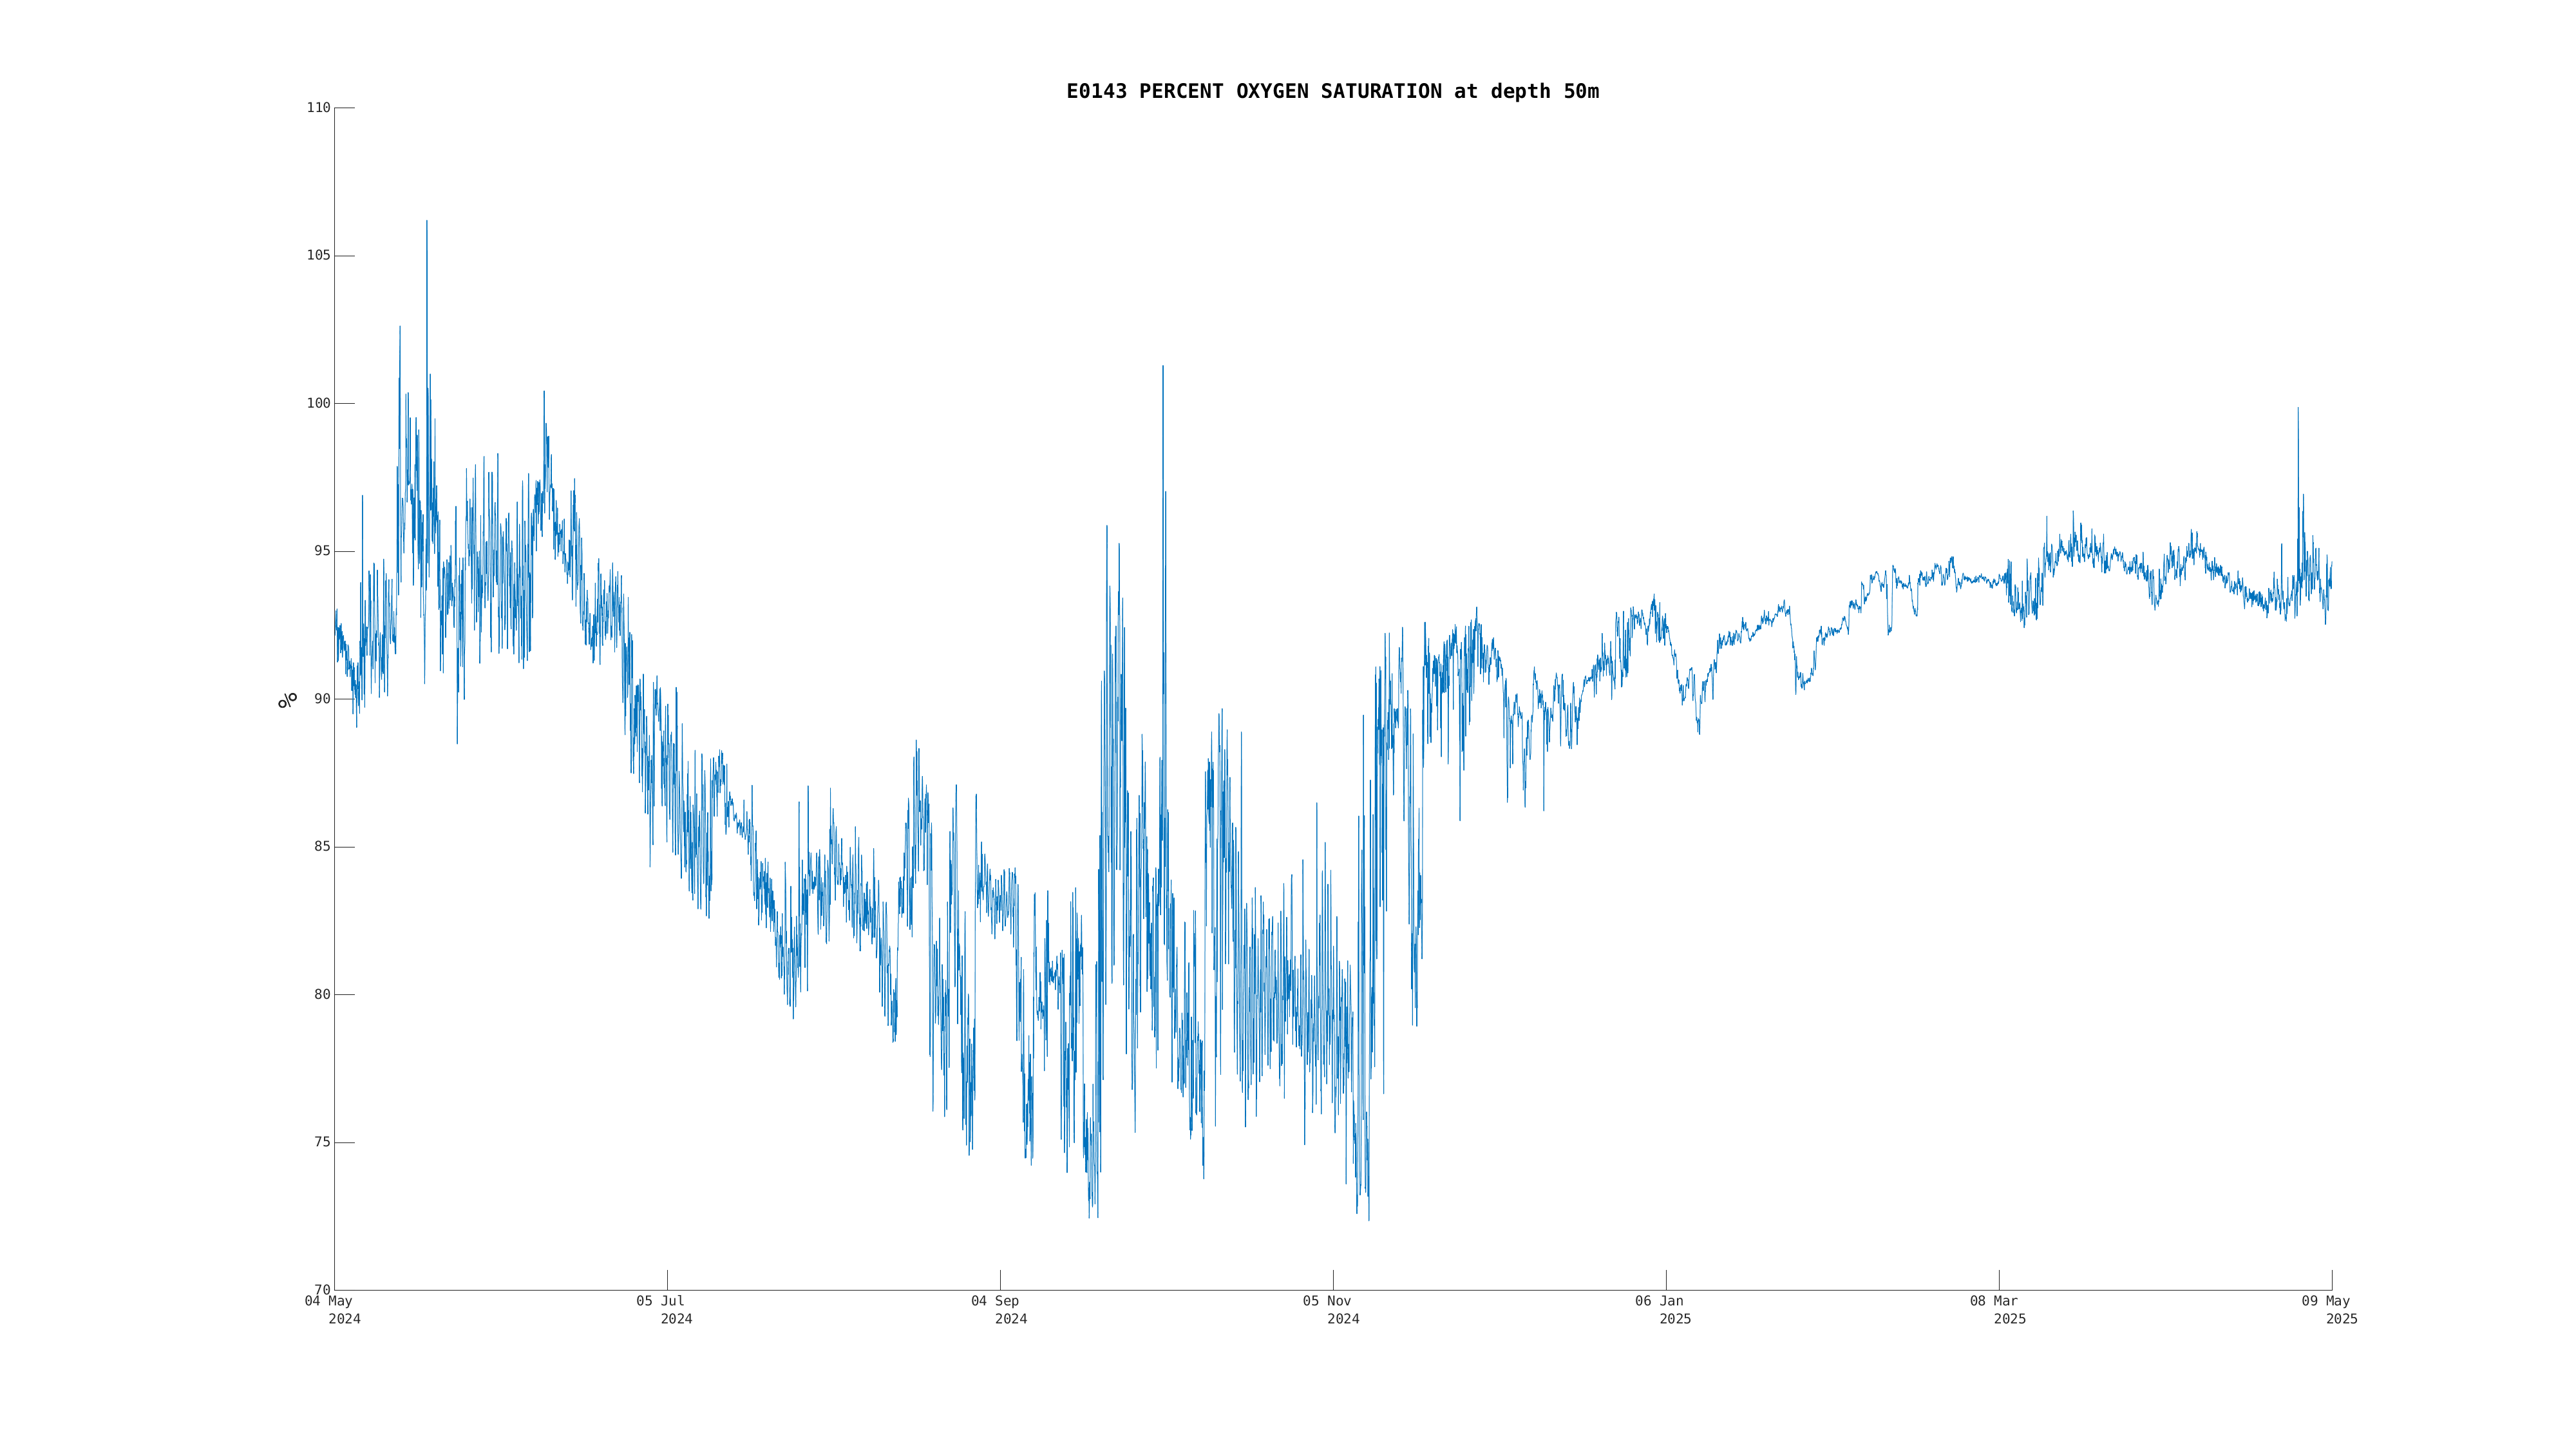
|
|
|
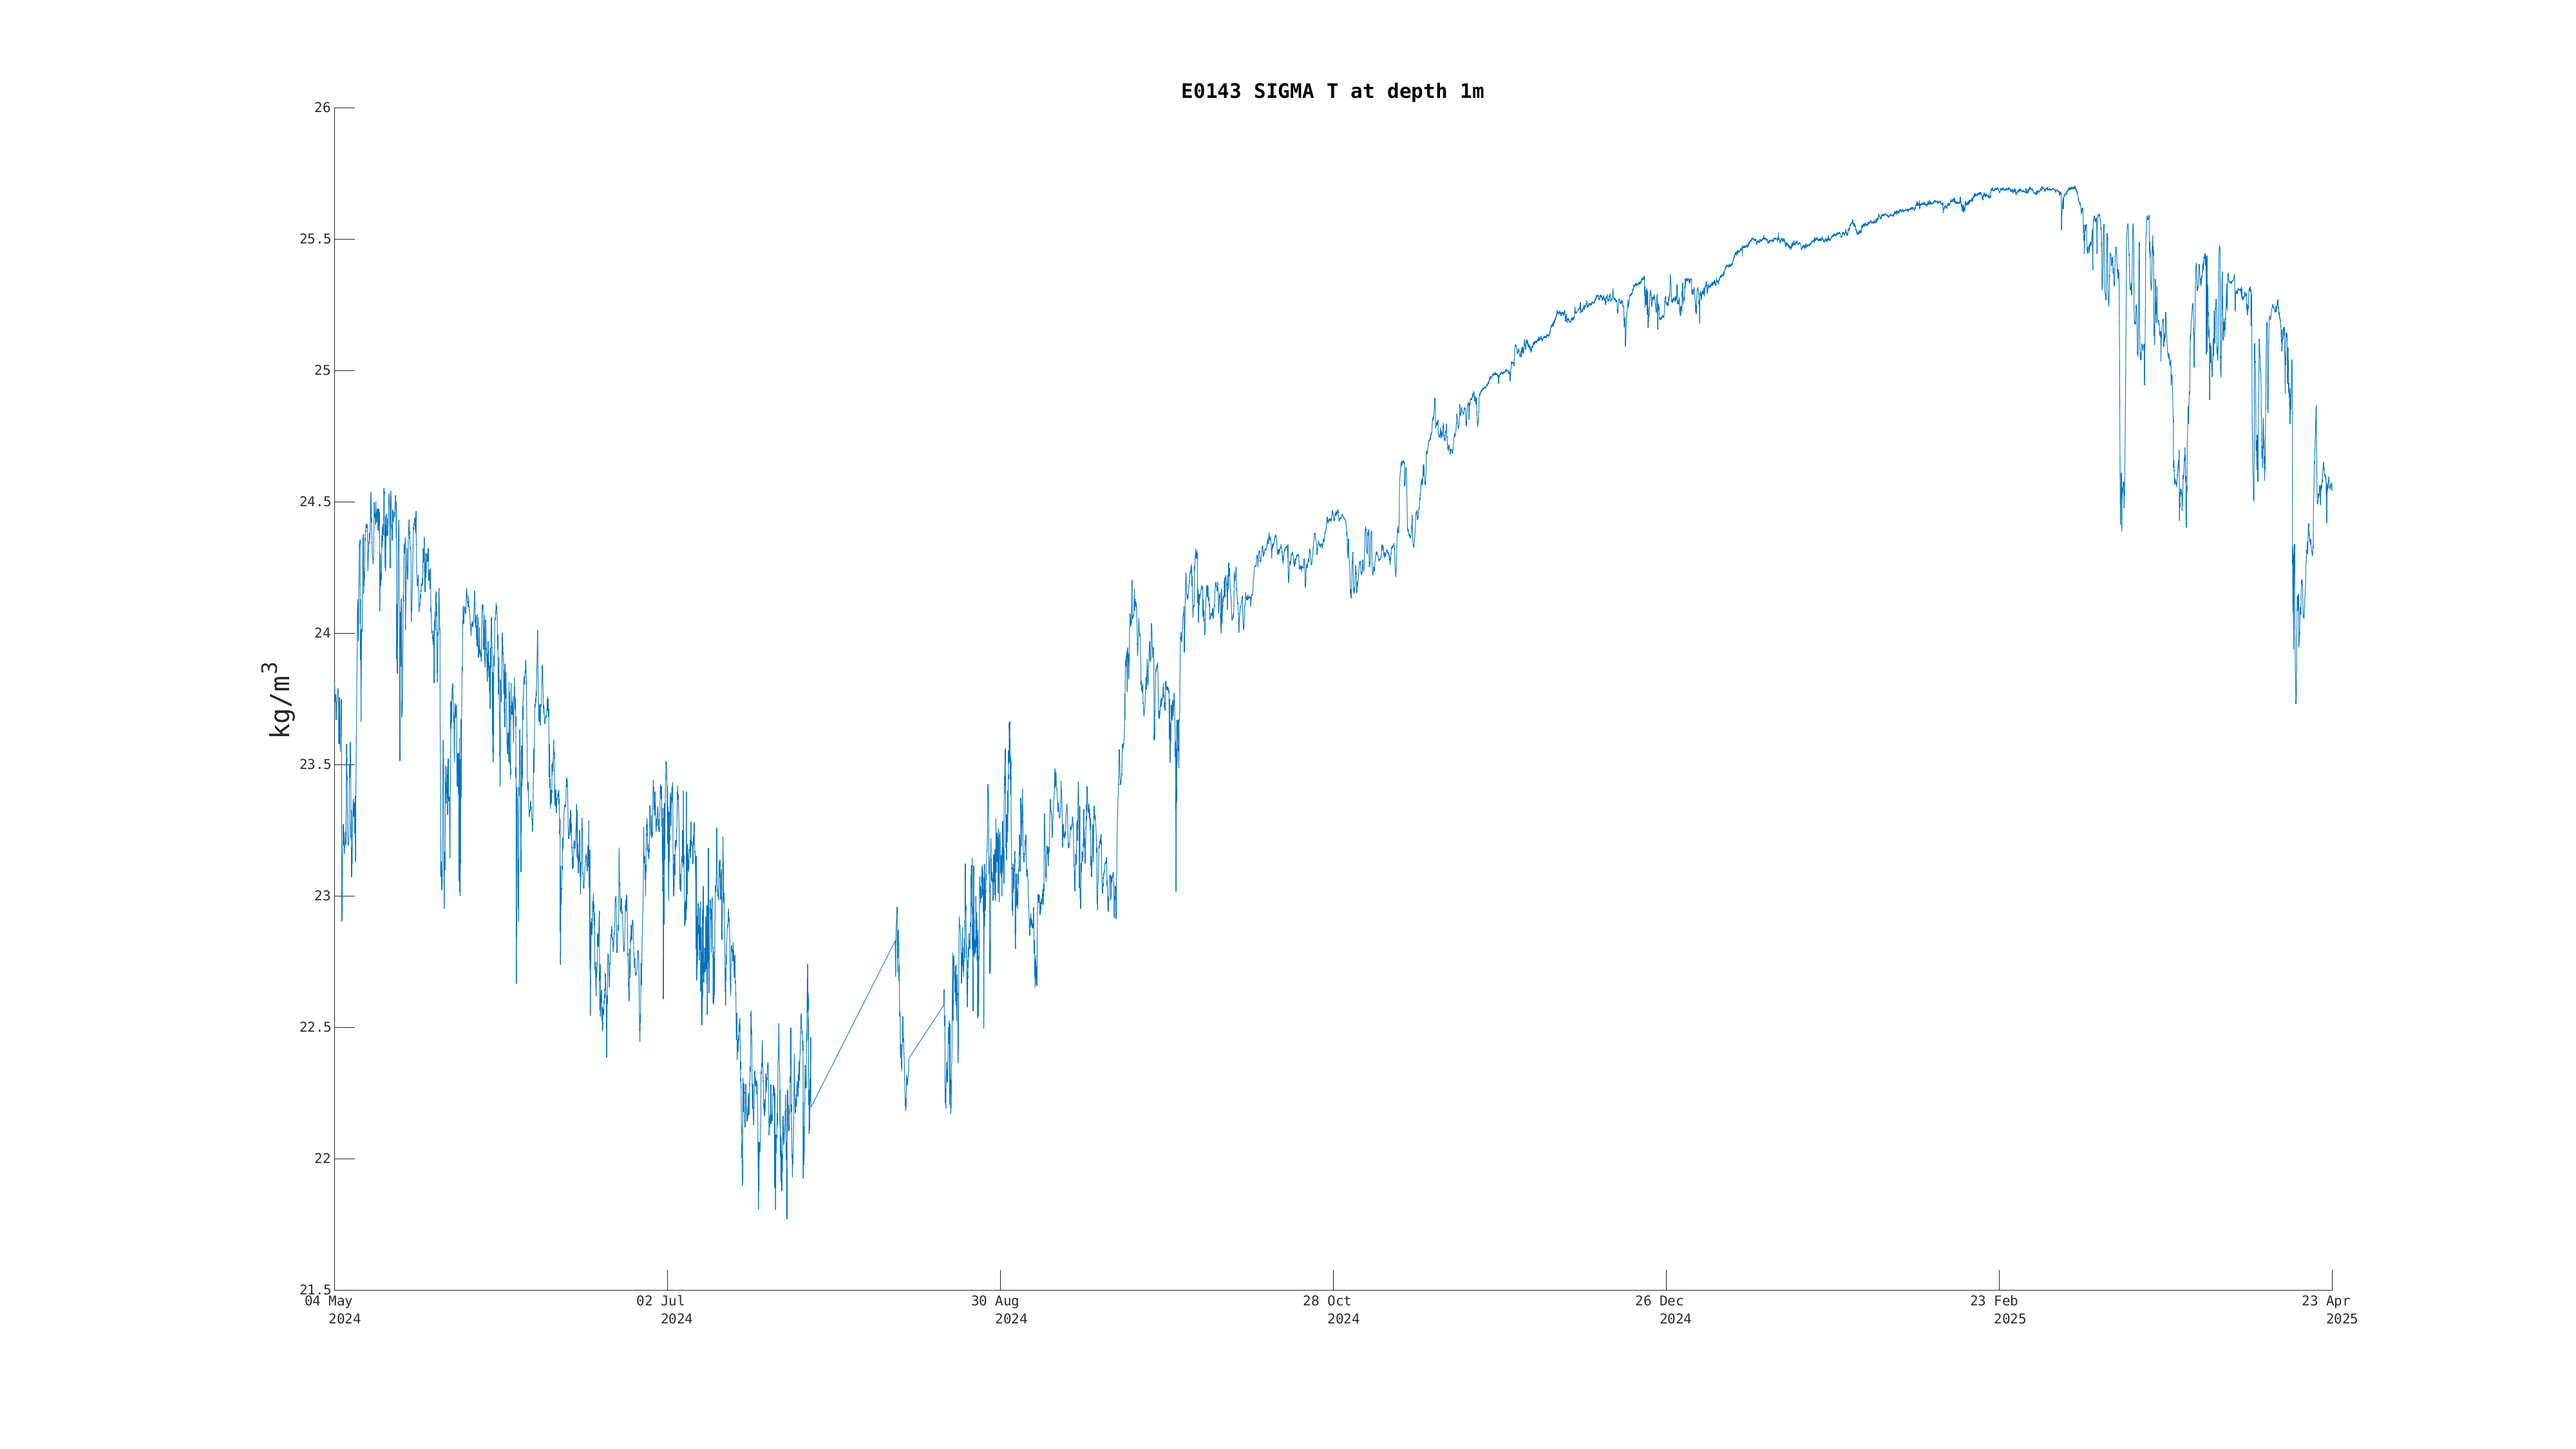
| Sigma-T (1m) | Sensor Failure | Oct 09 6:00 AM |
|
|
|
|
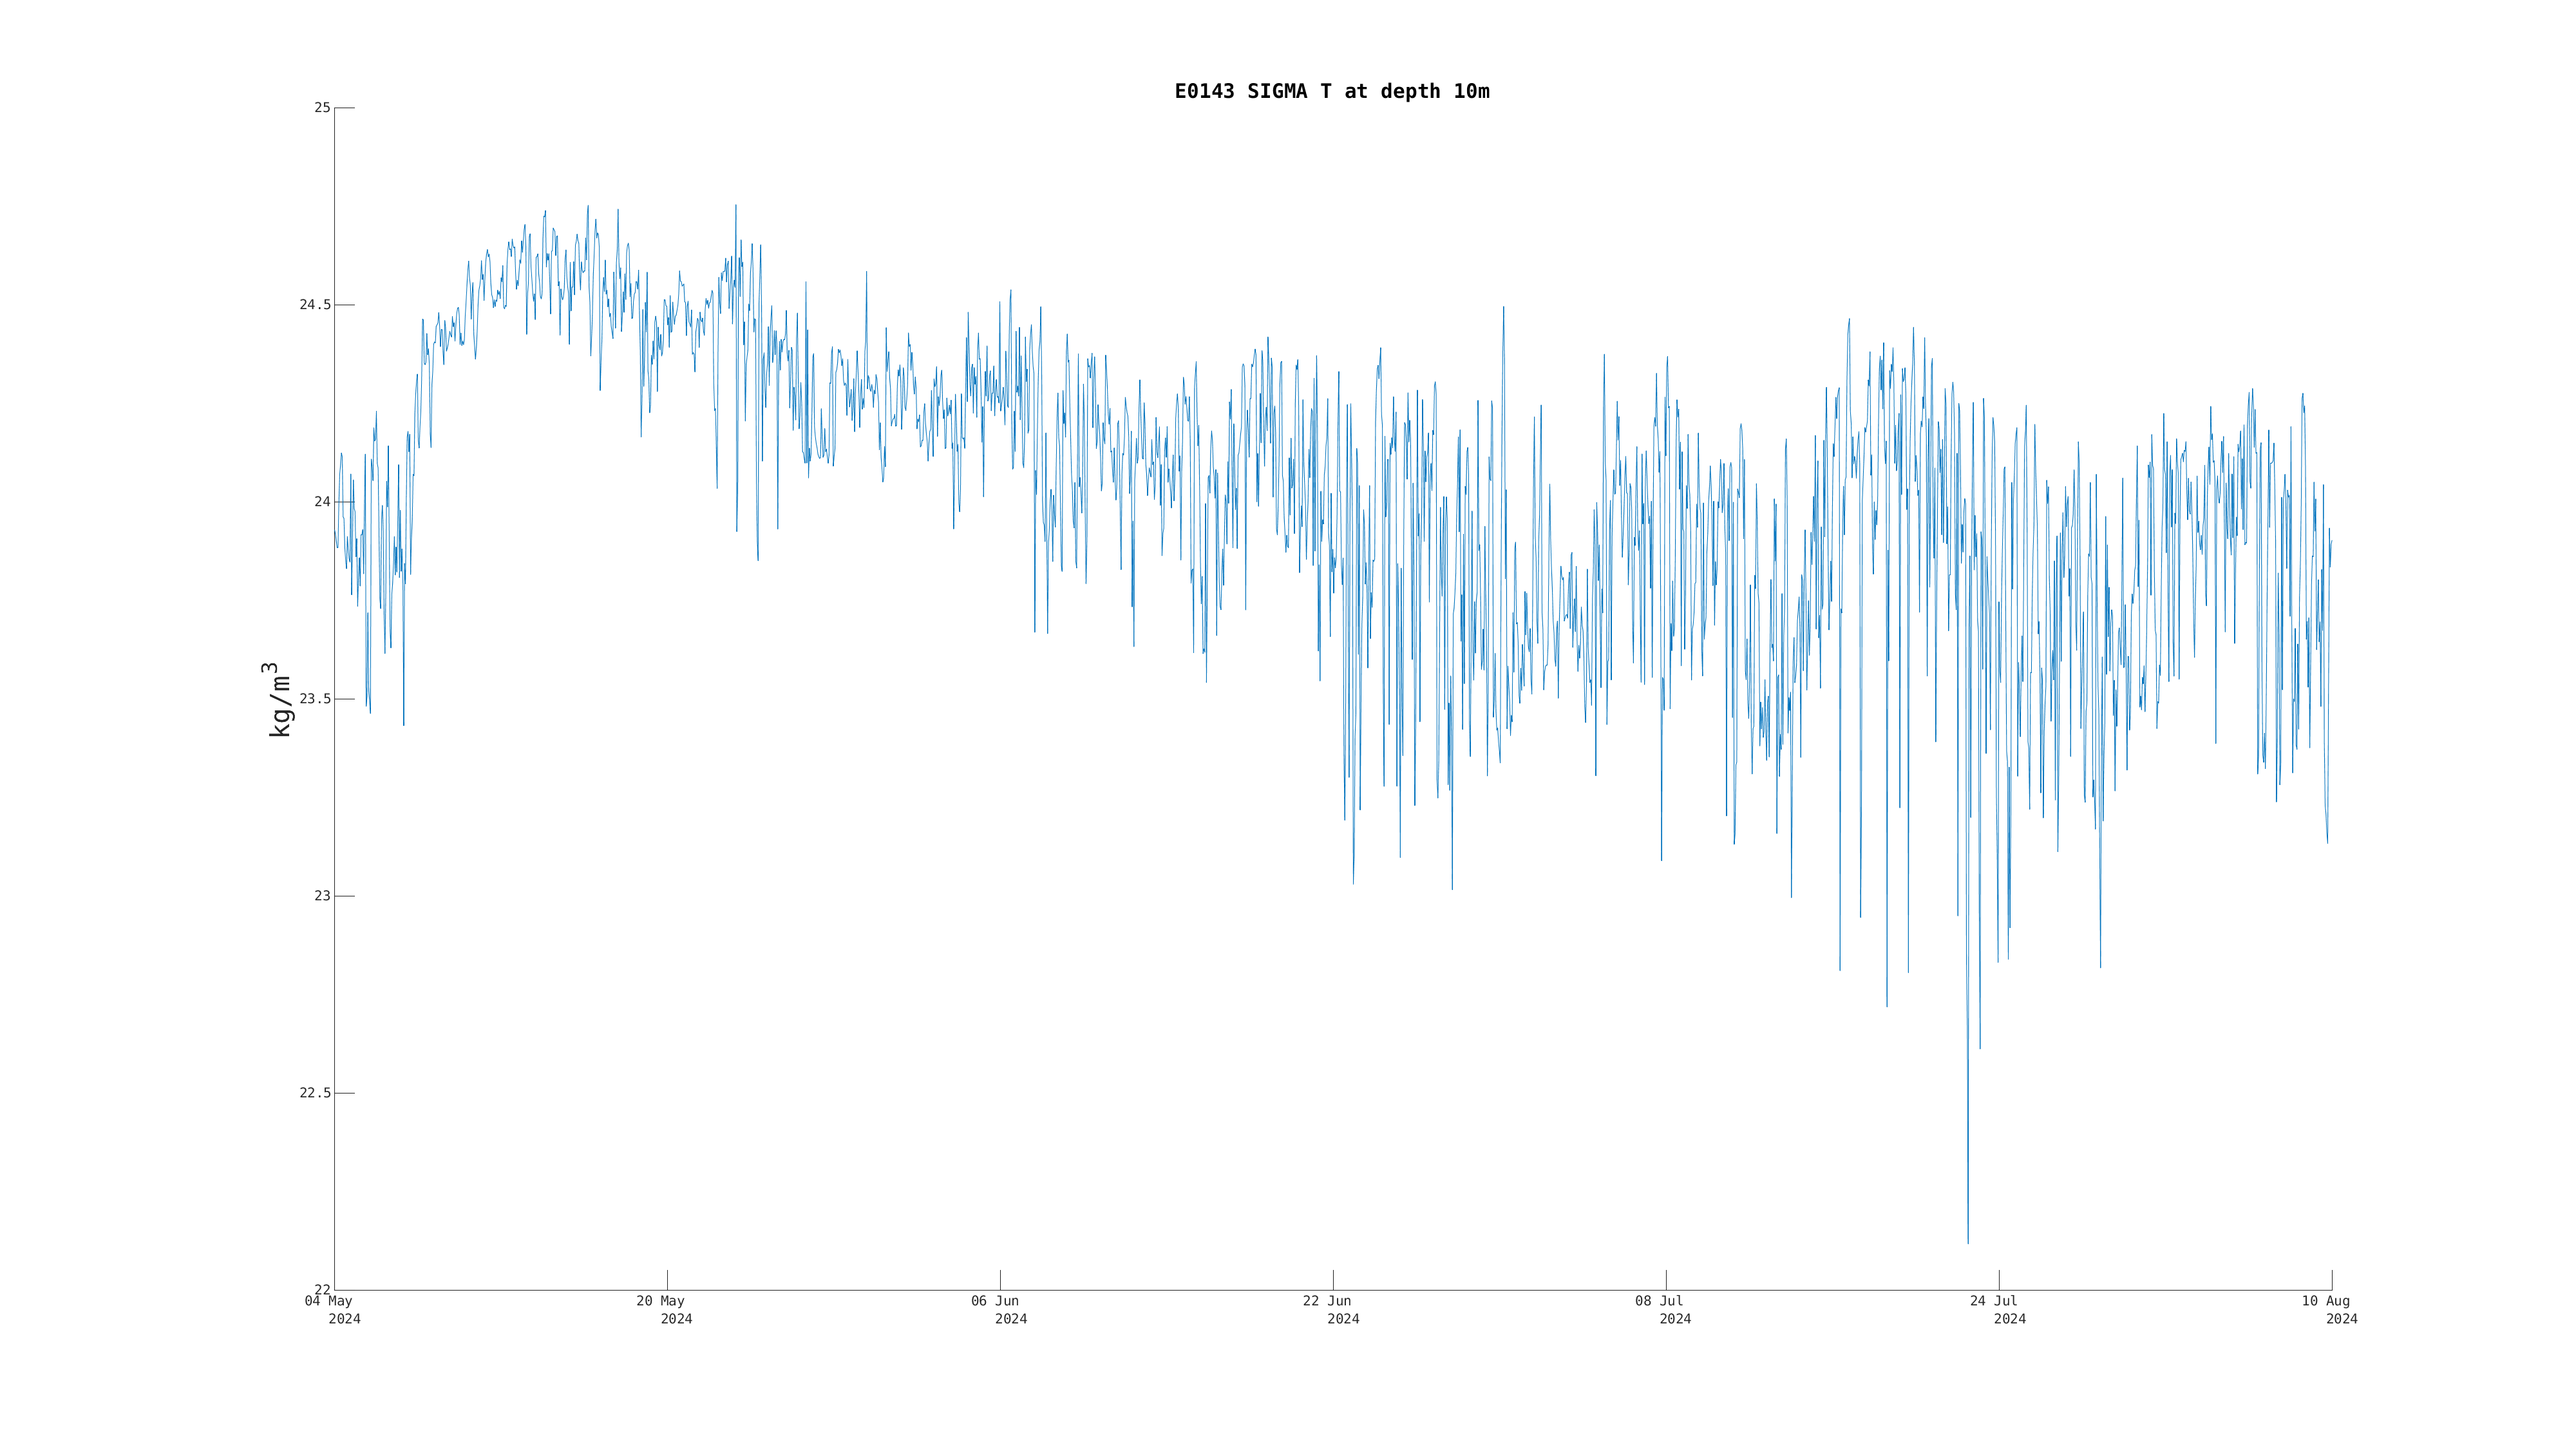
| Sigma-T (10m) | Sensor Failure | Sep 29 7:00 AM |
|
|
|
|
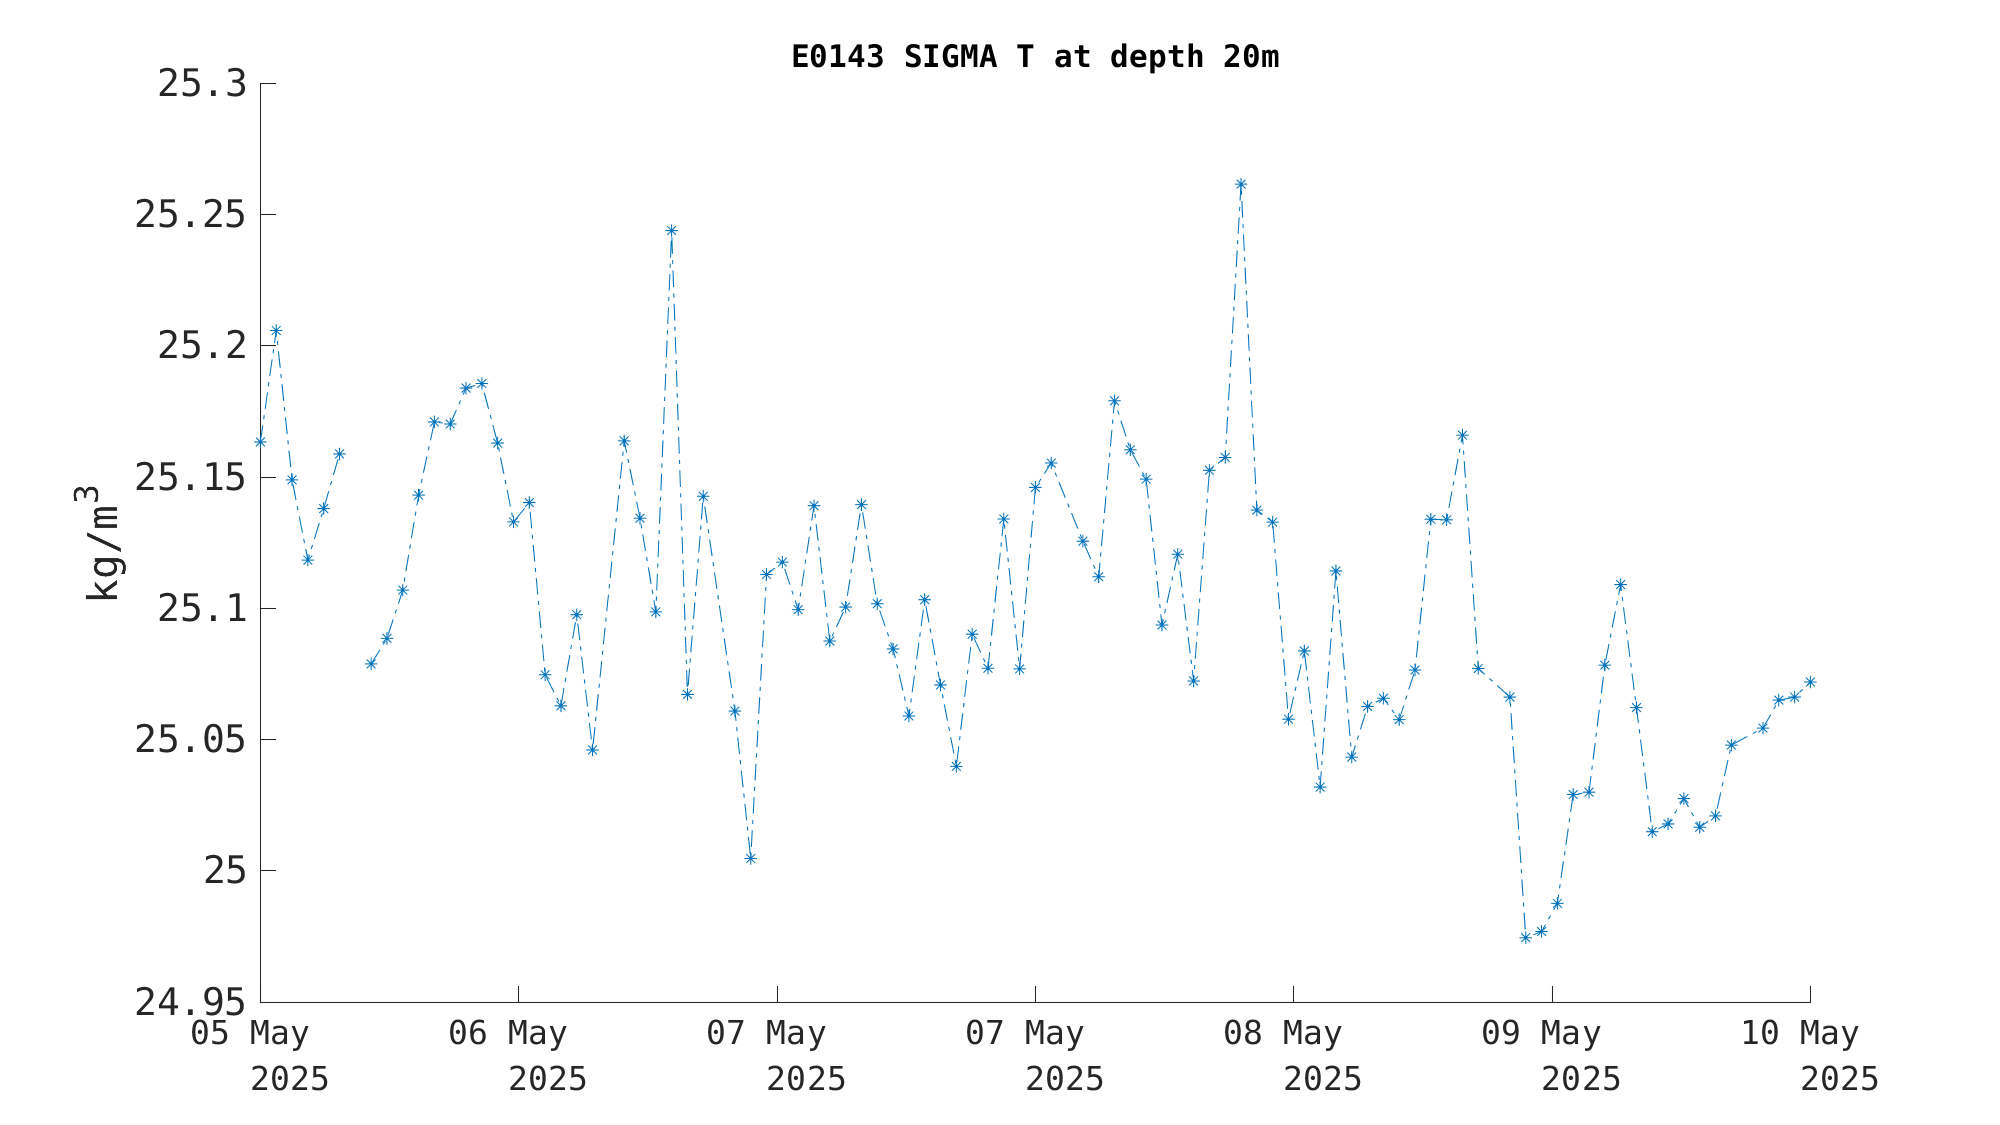
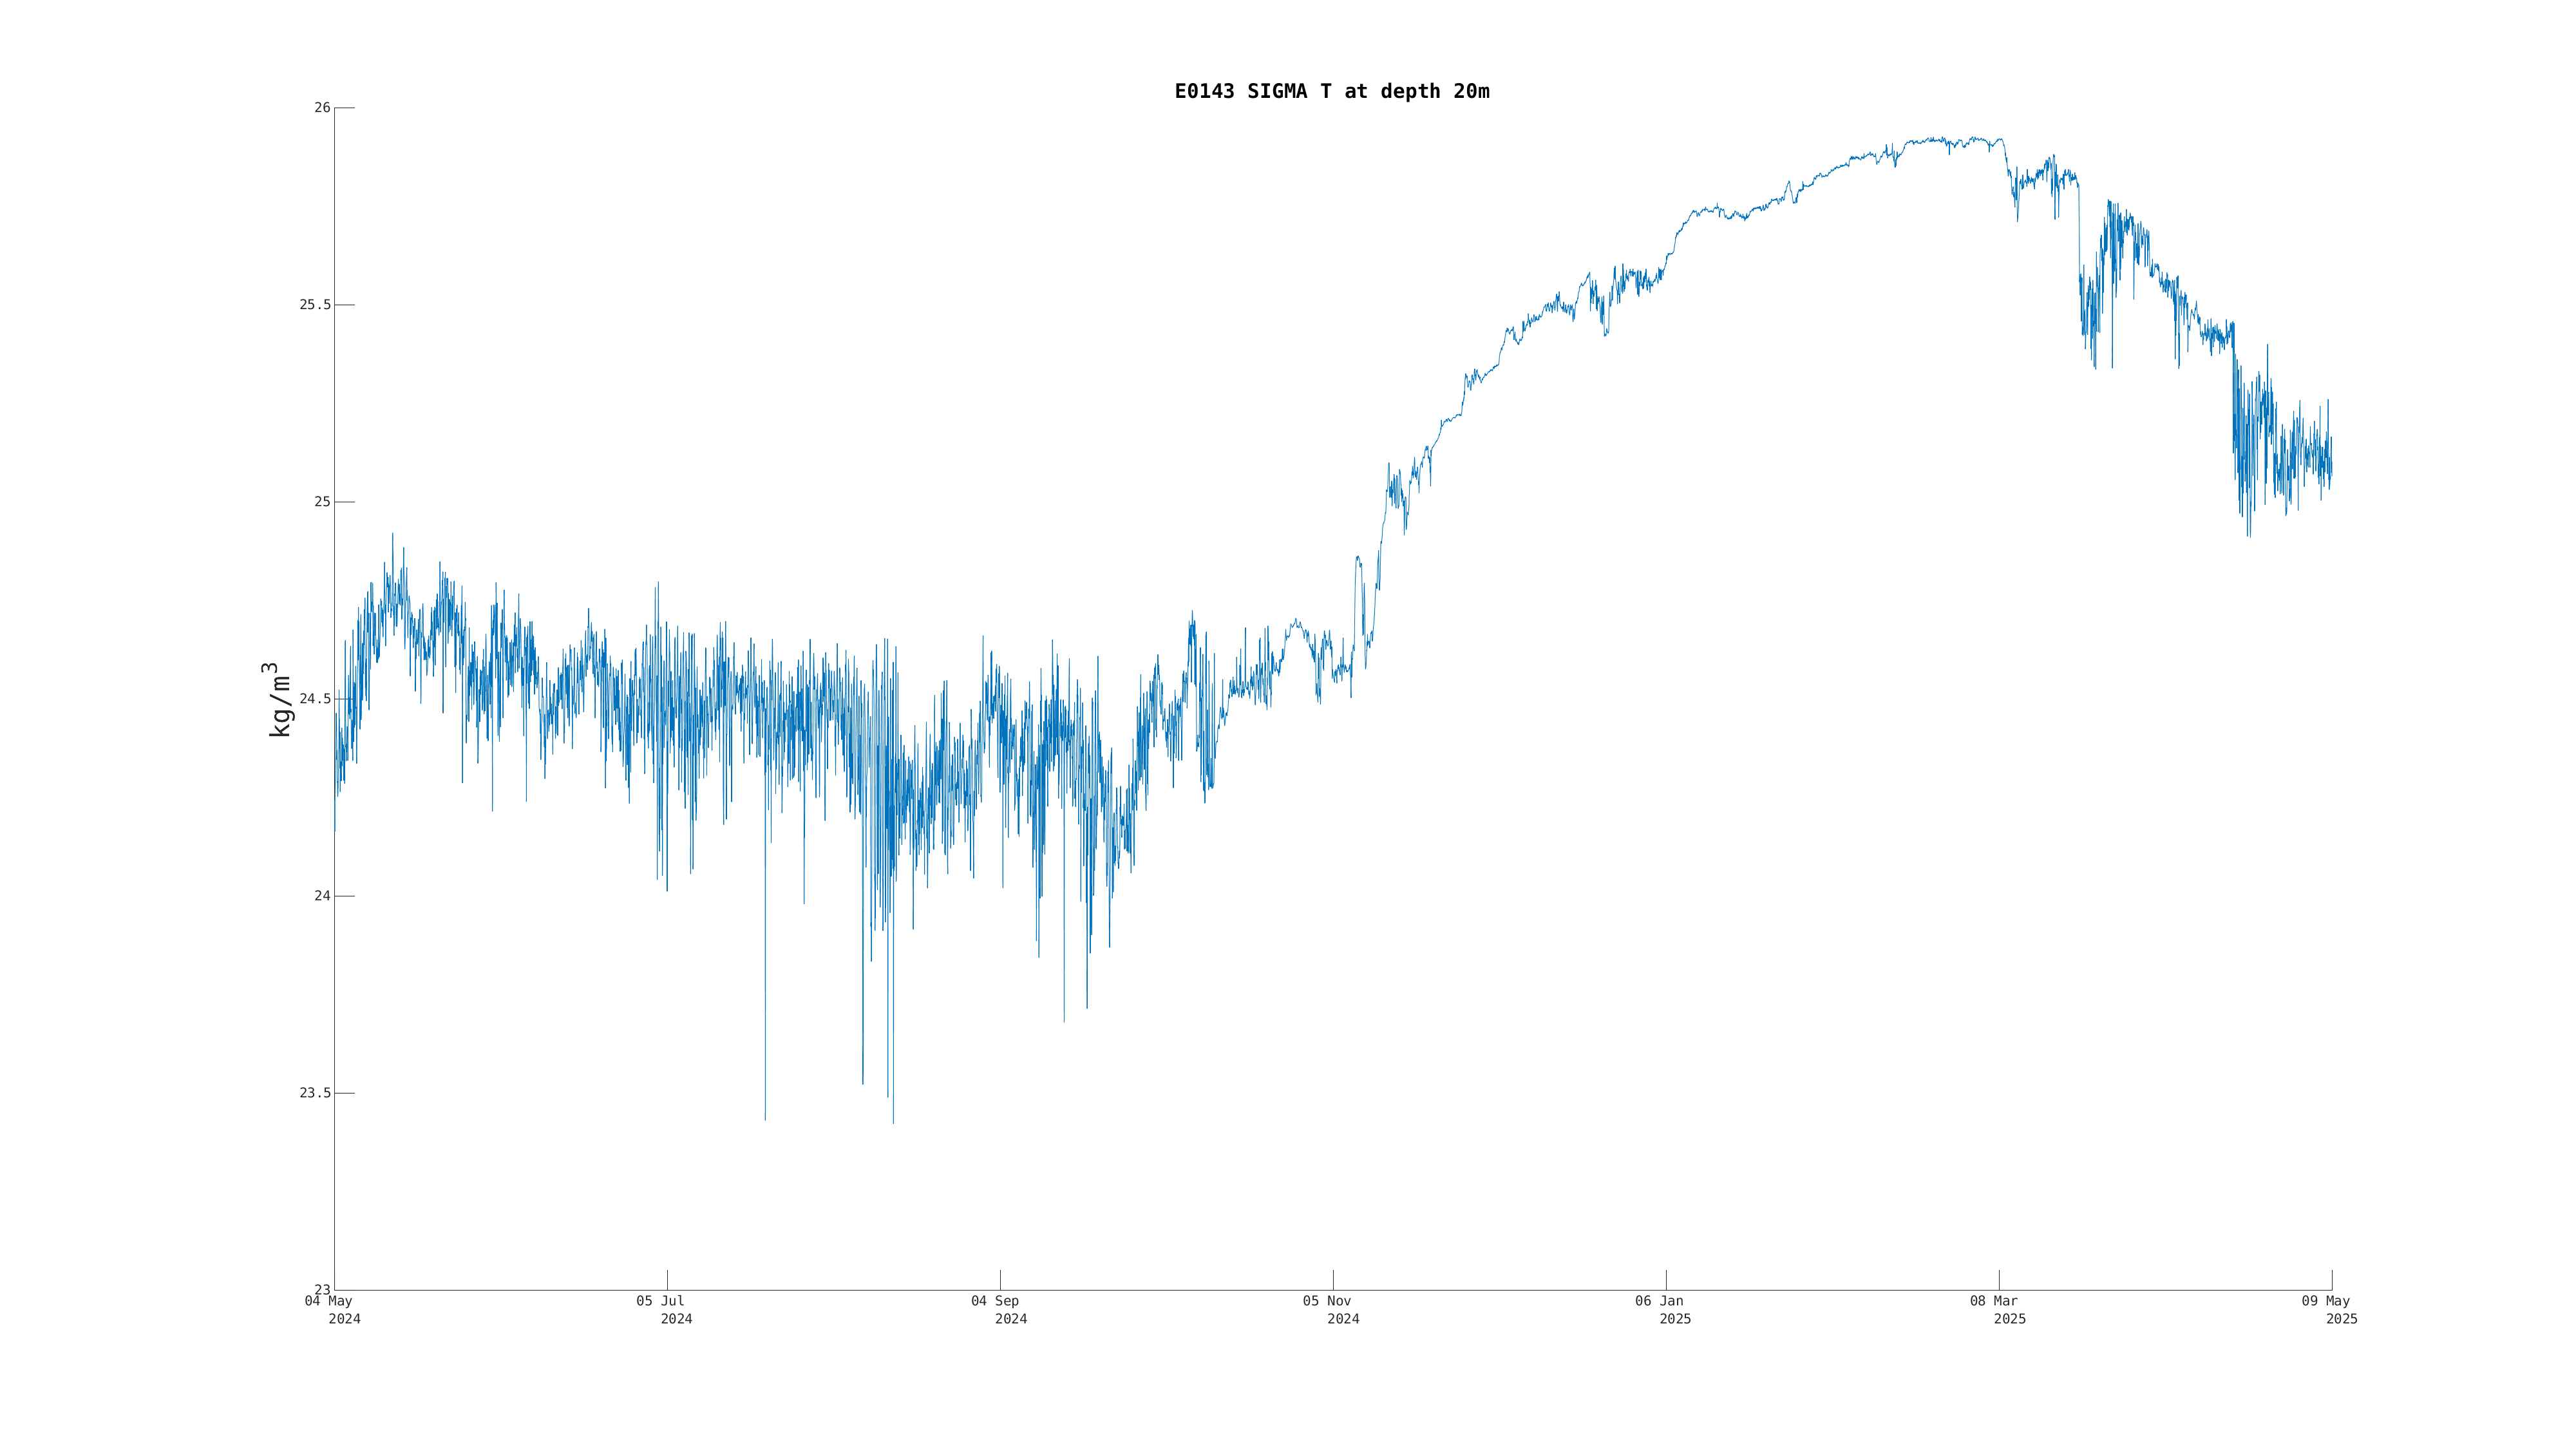
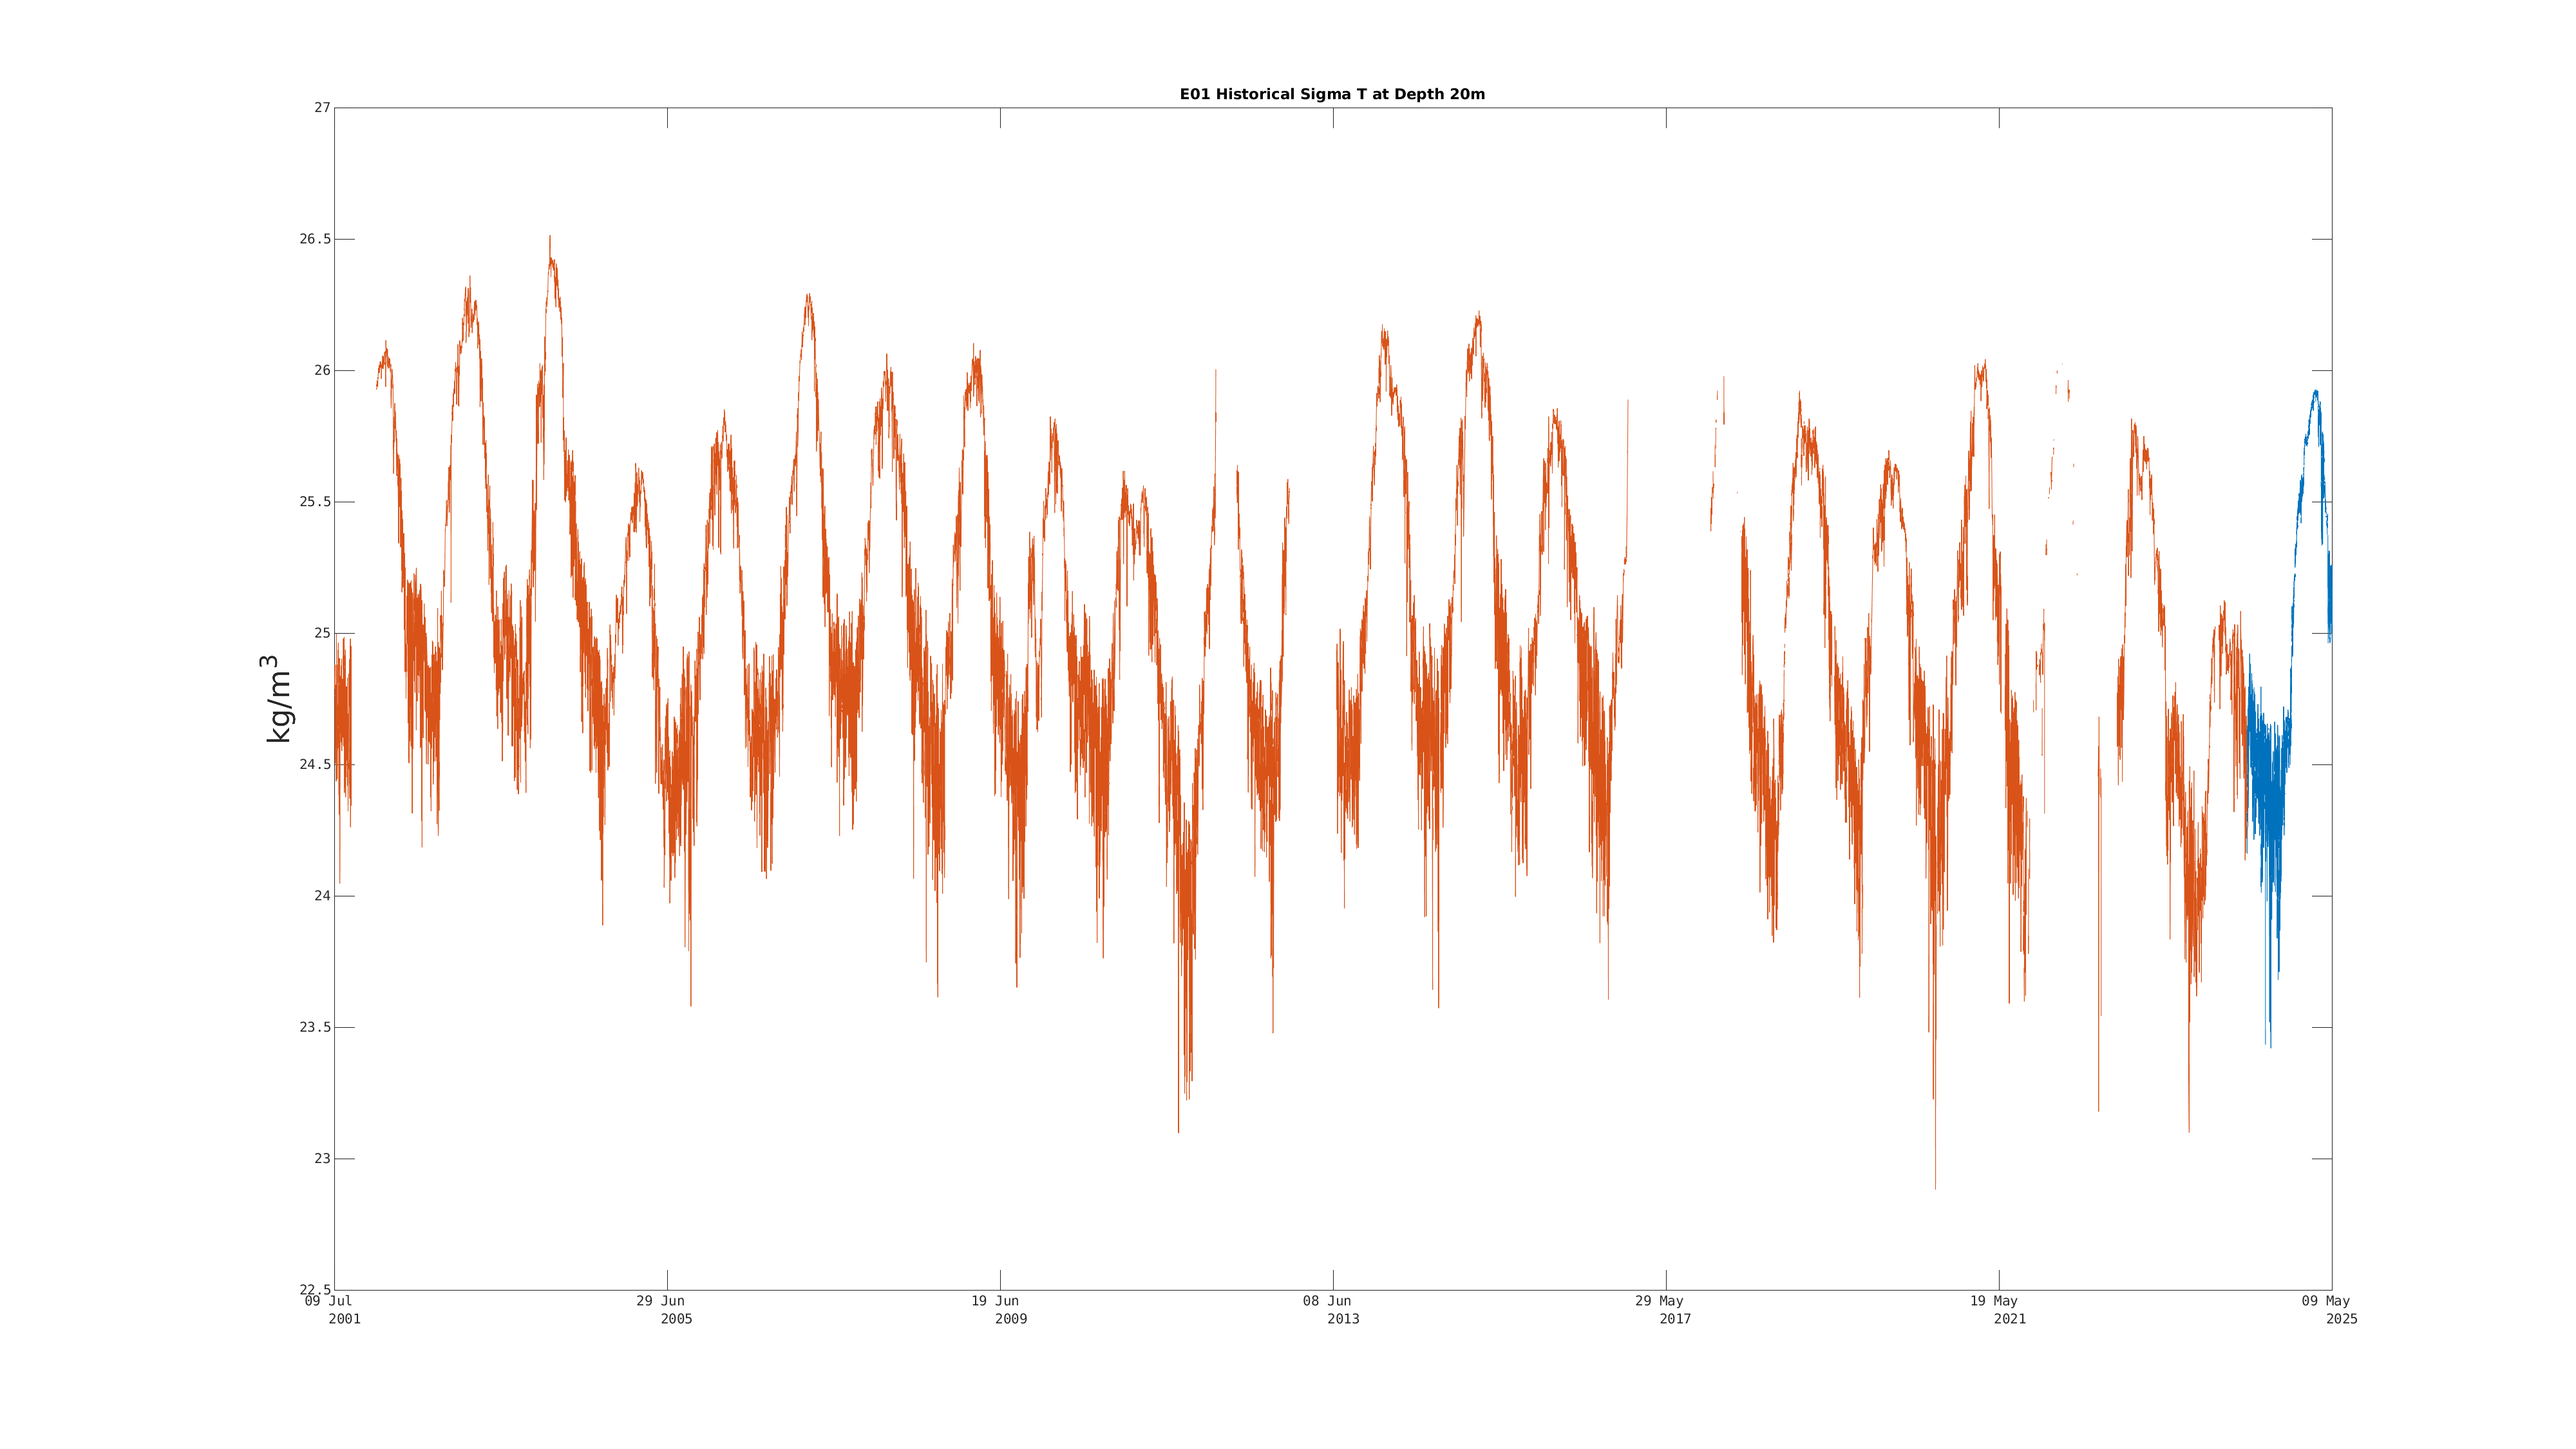
| Sigma-T (20m) | Sensor Failure | Dec 21 9:00 PM |
|
|
|
|
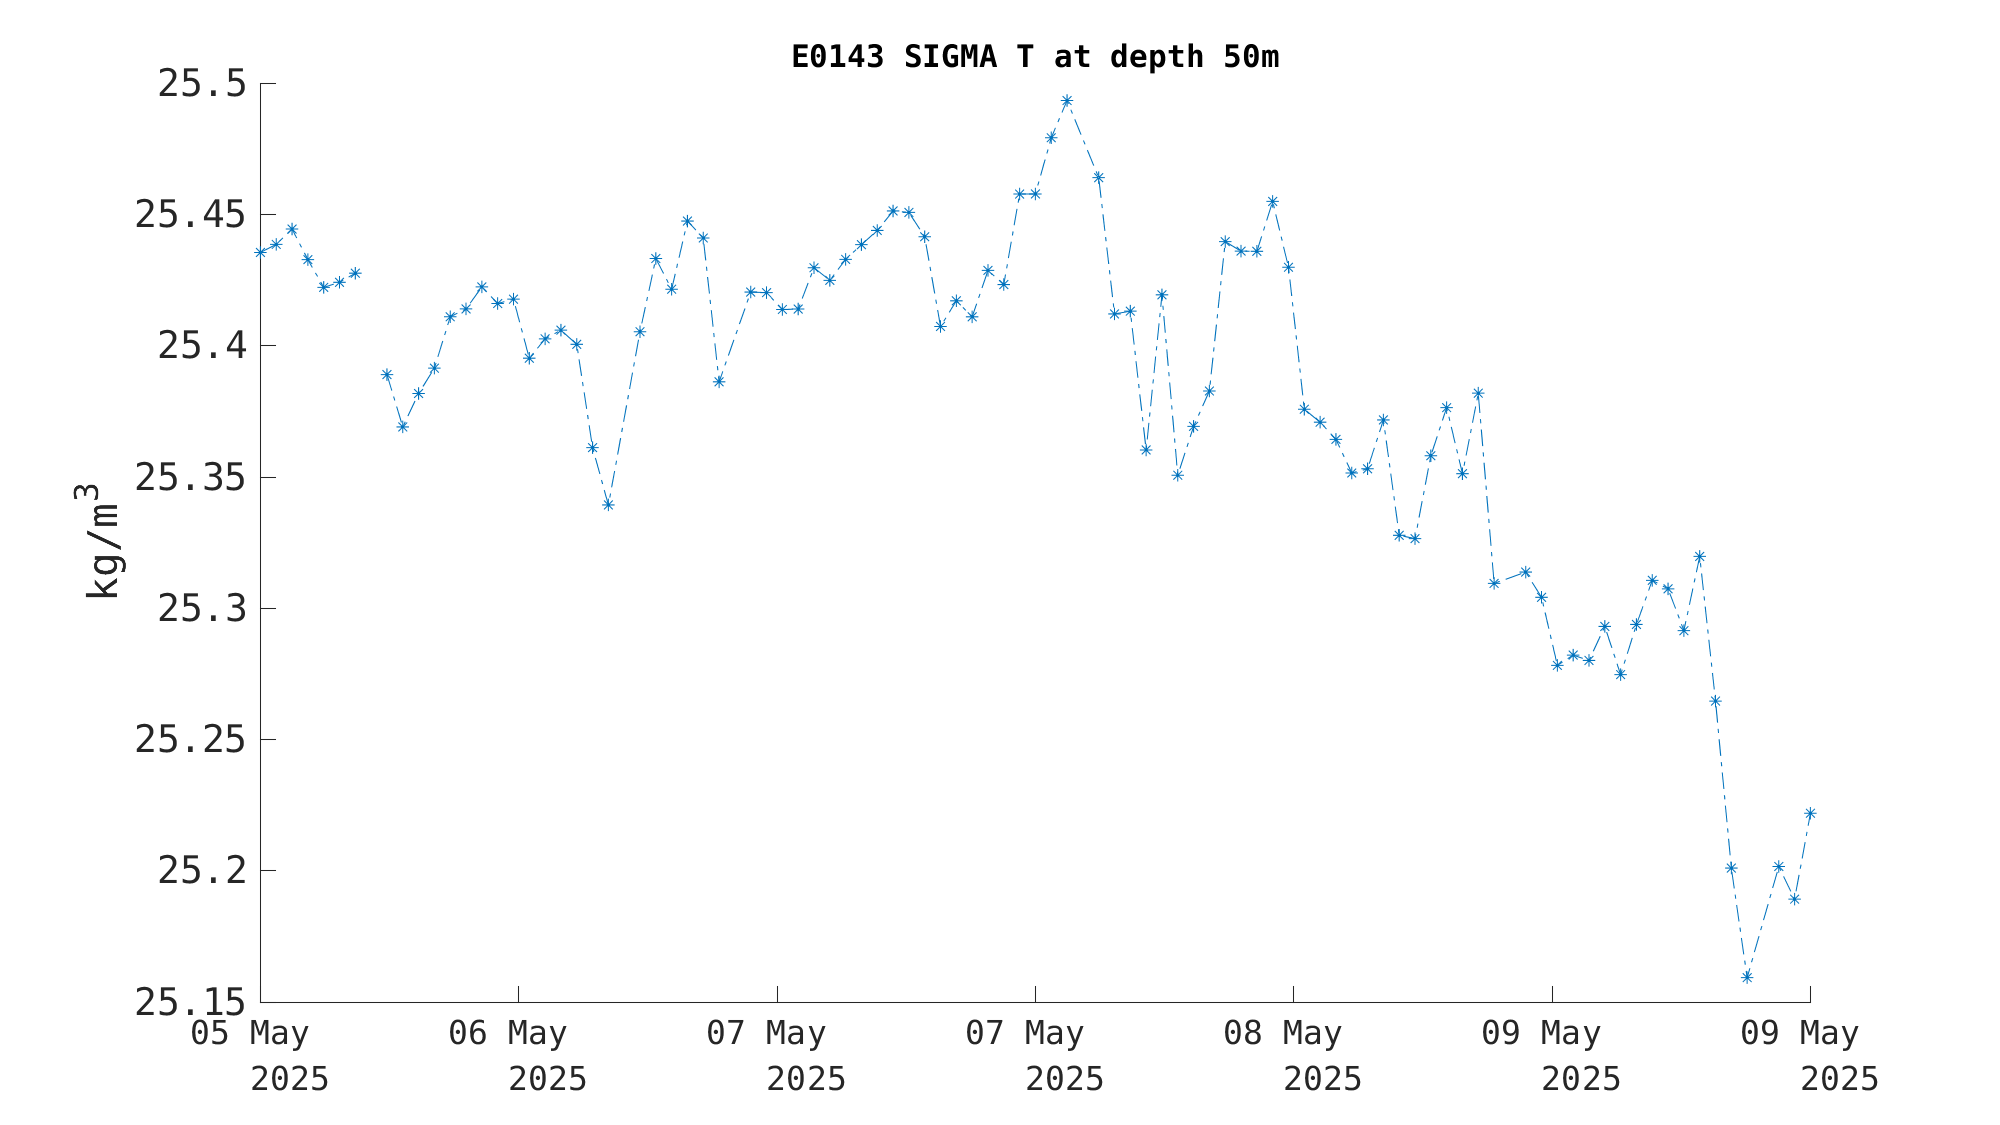
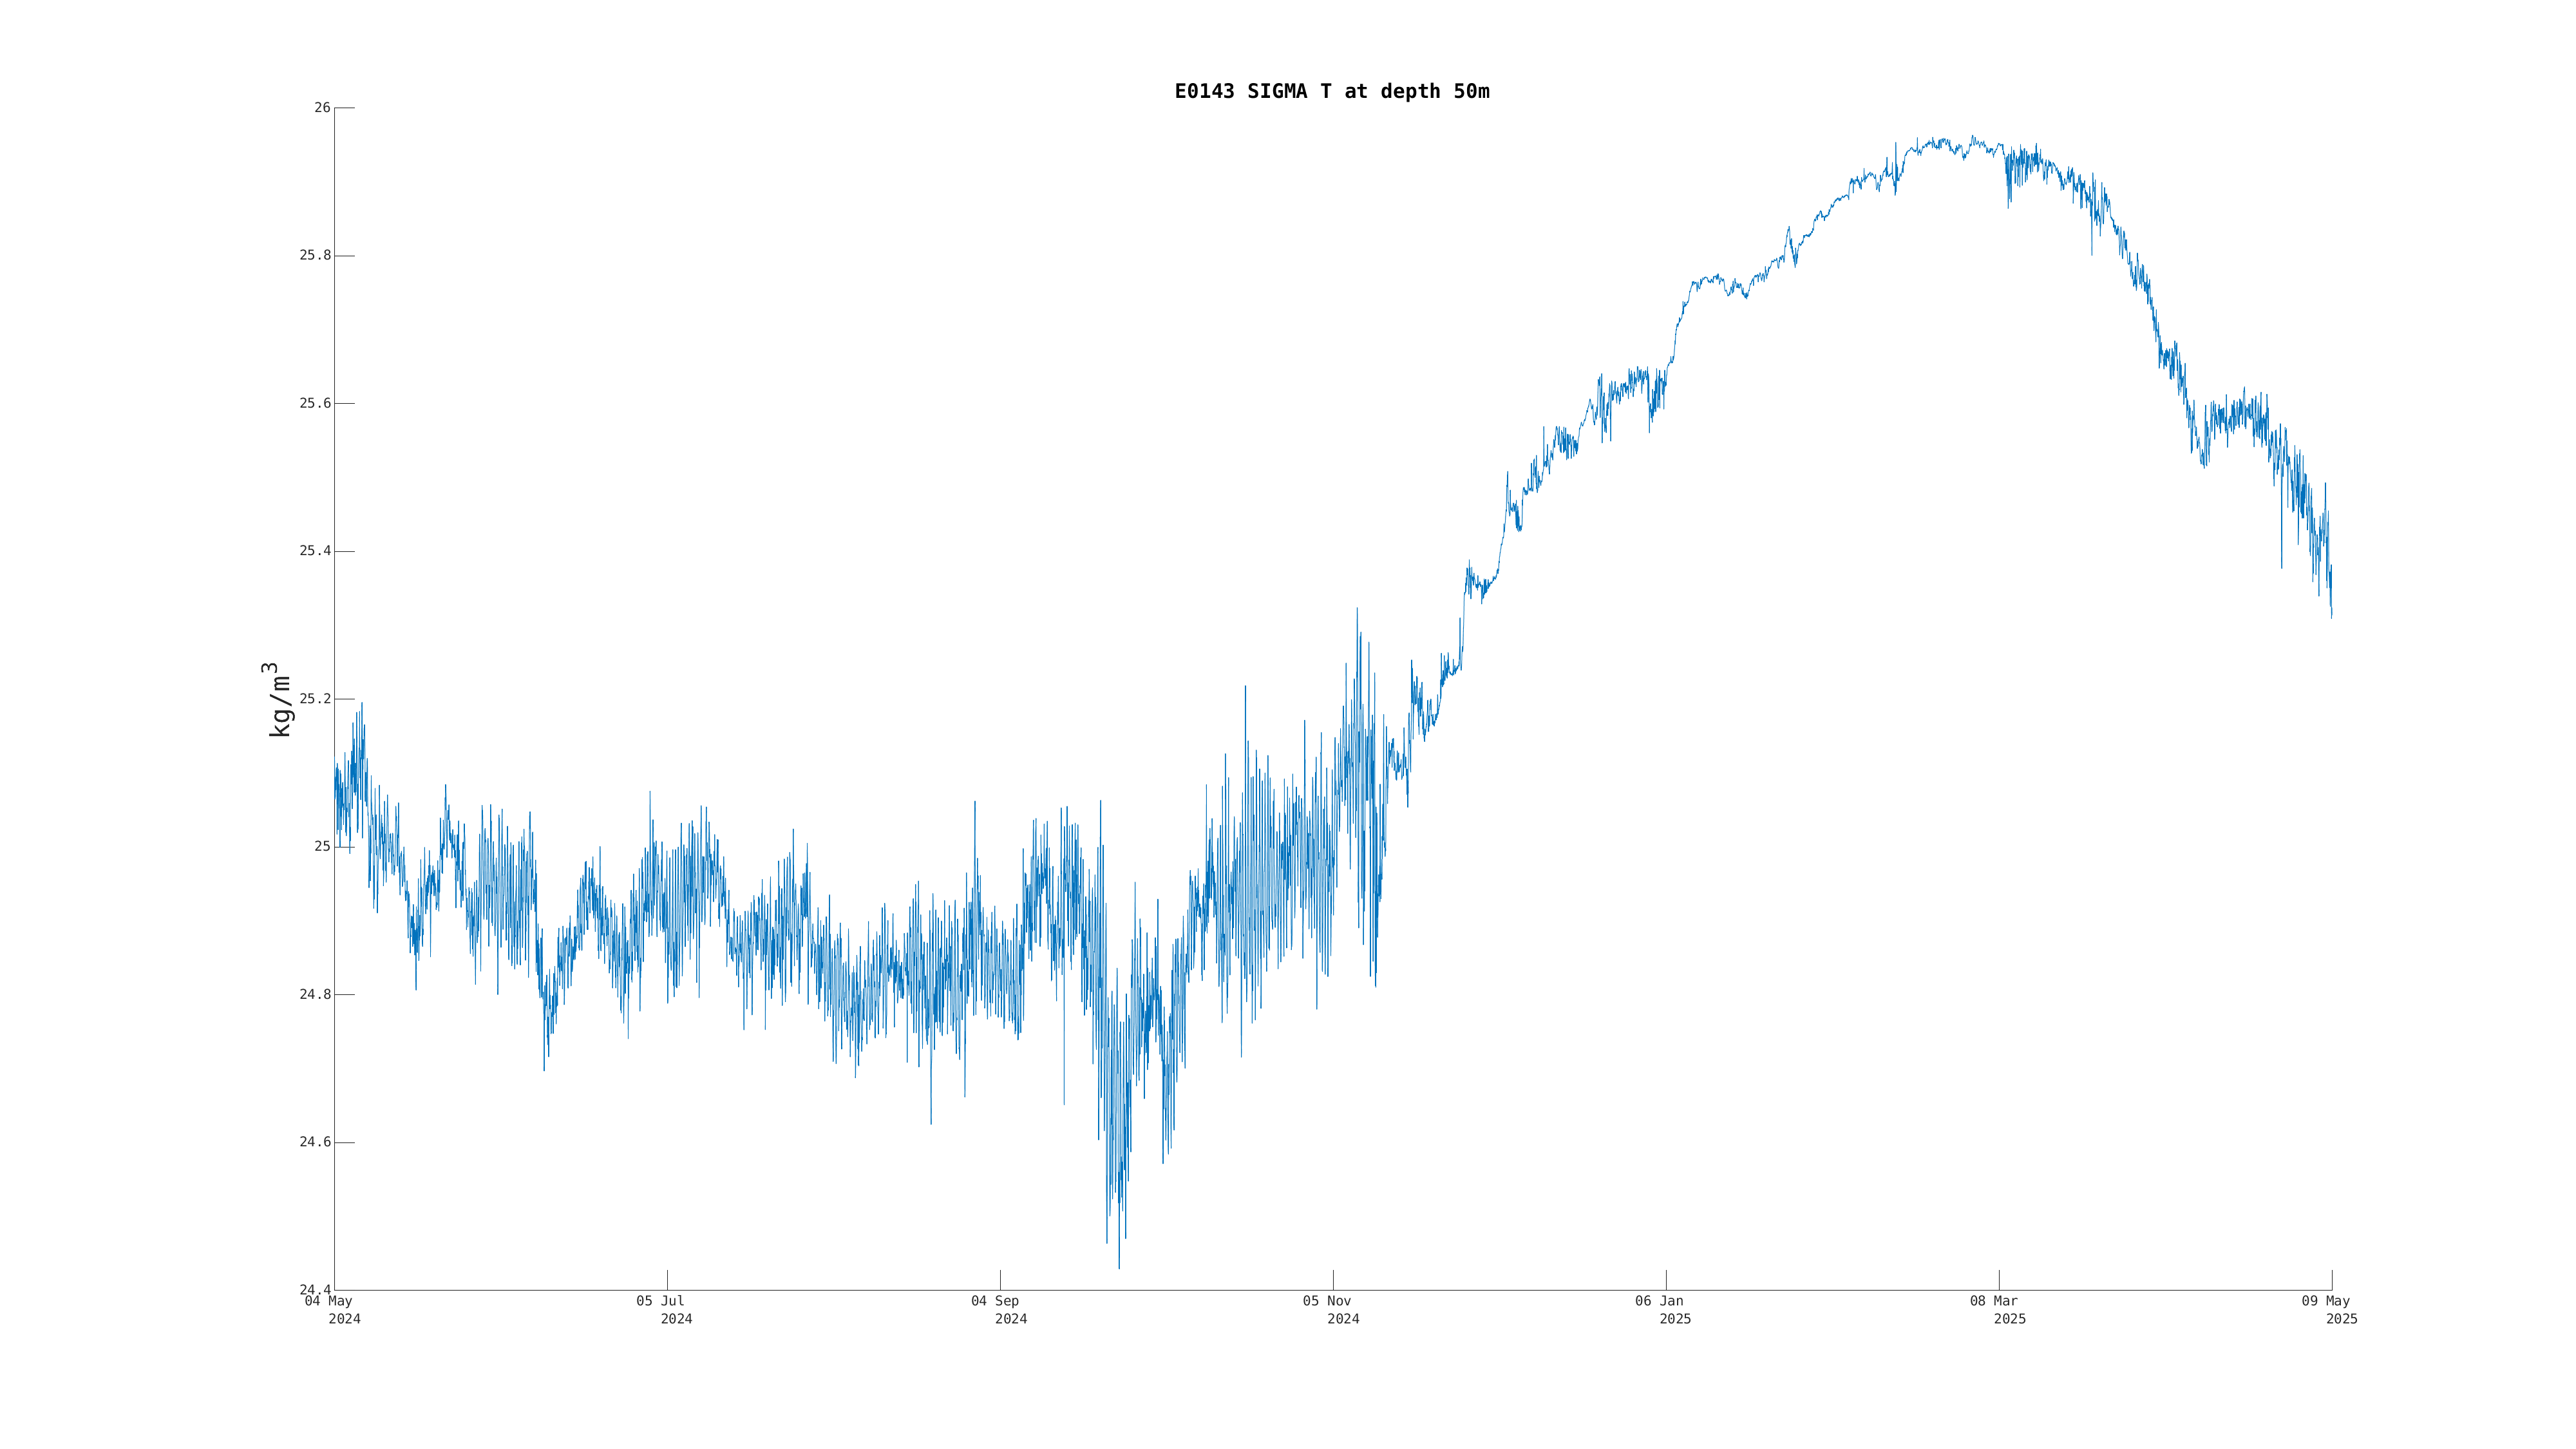
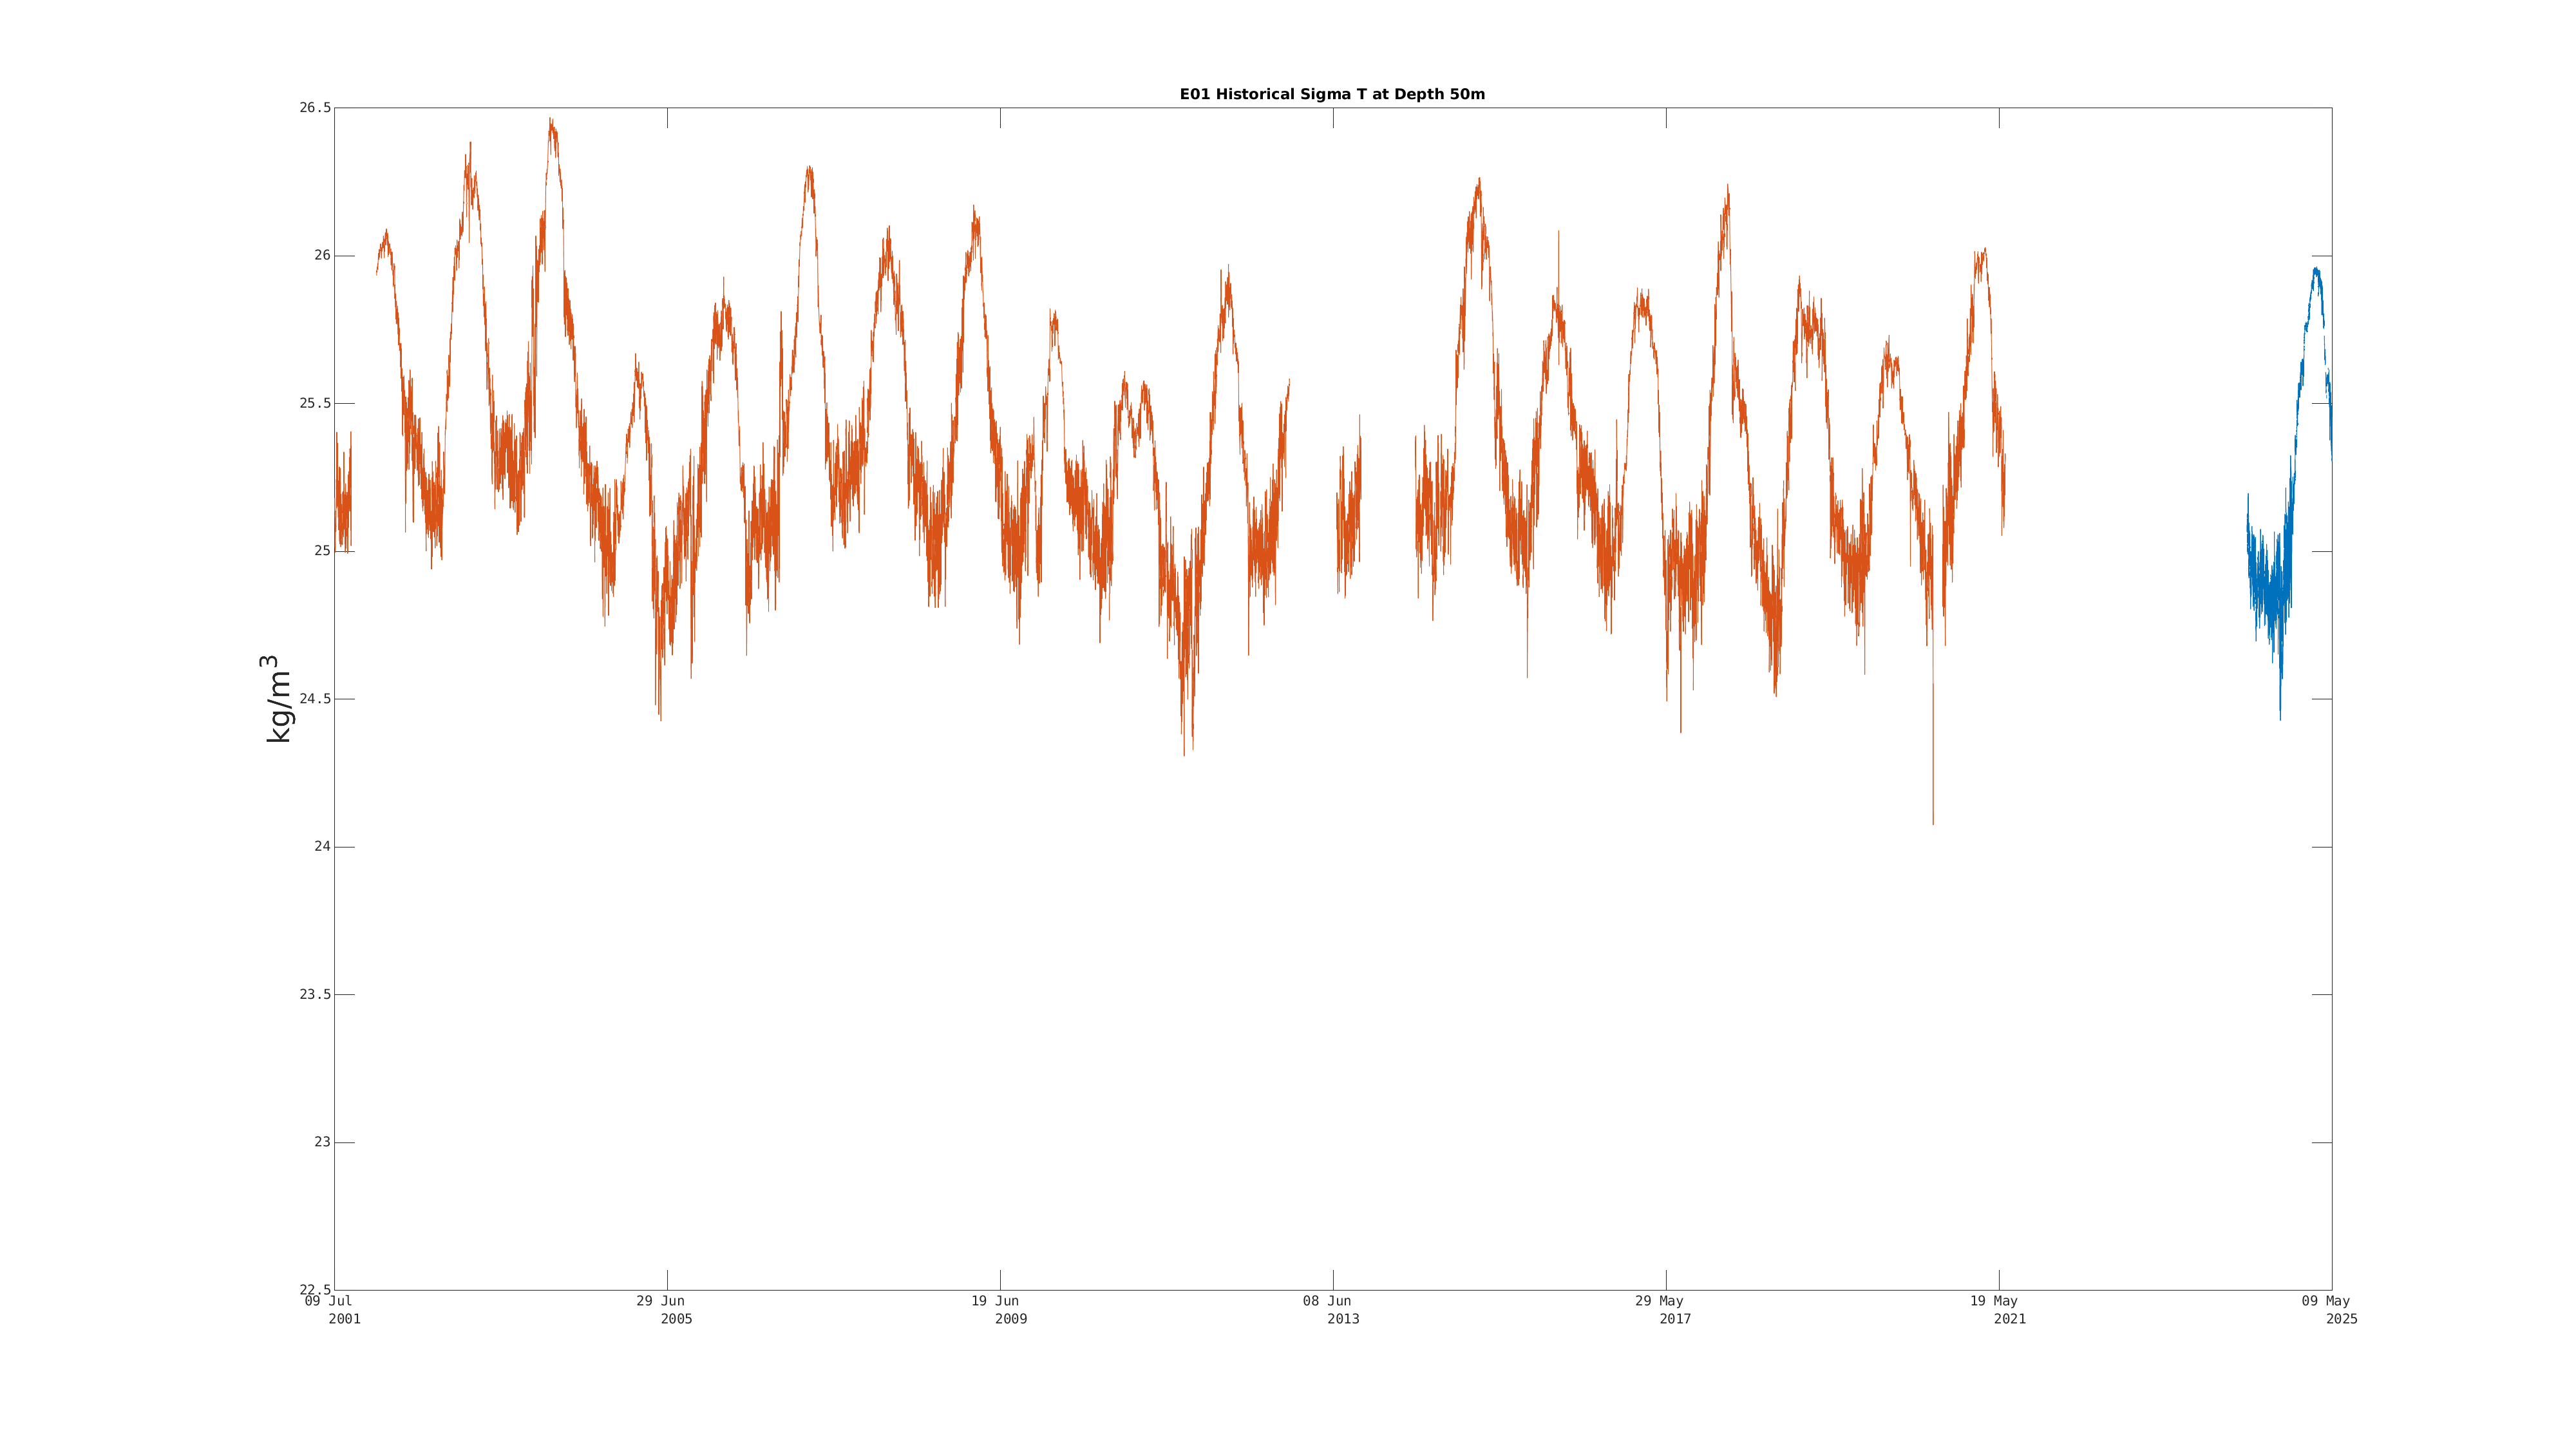
| Sigma-T (50m) | Sensor Failure | Dec 21 9:00 PM |
|
|
|
|
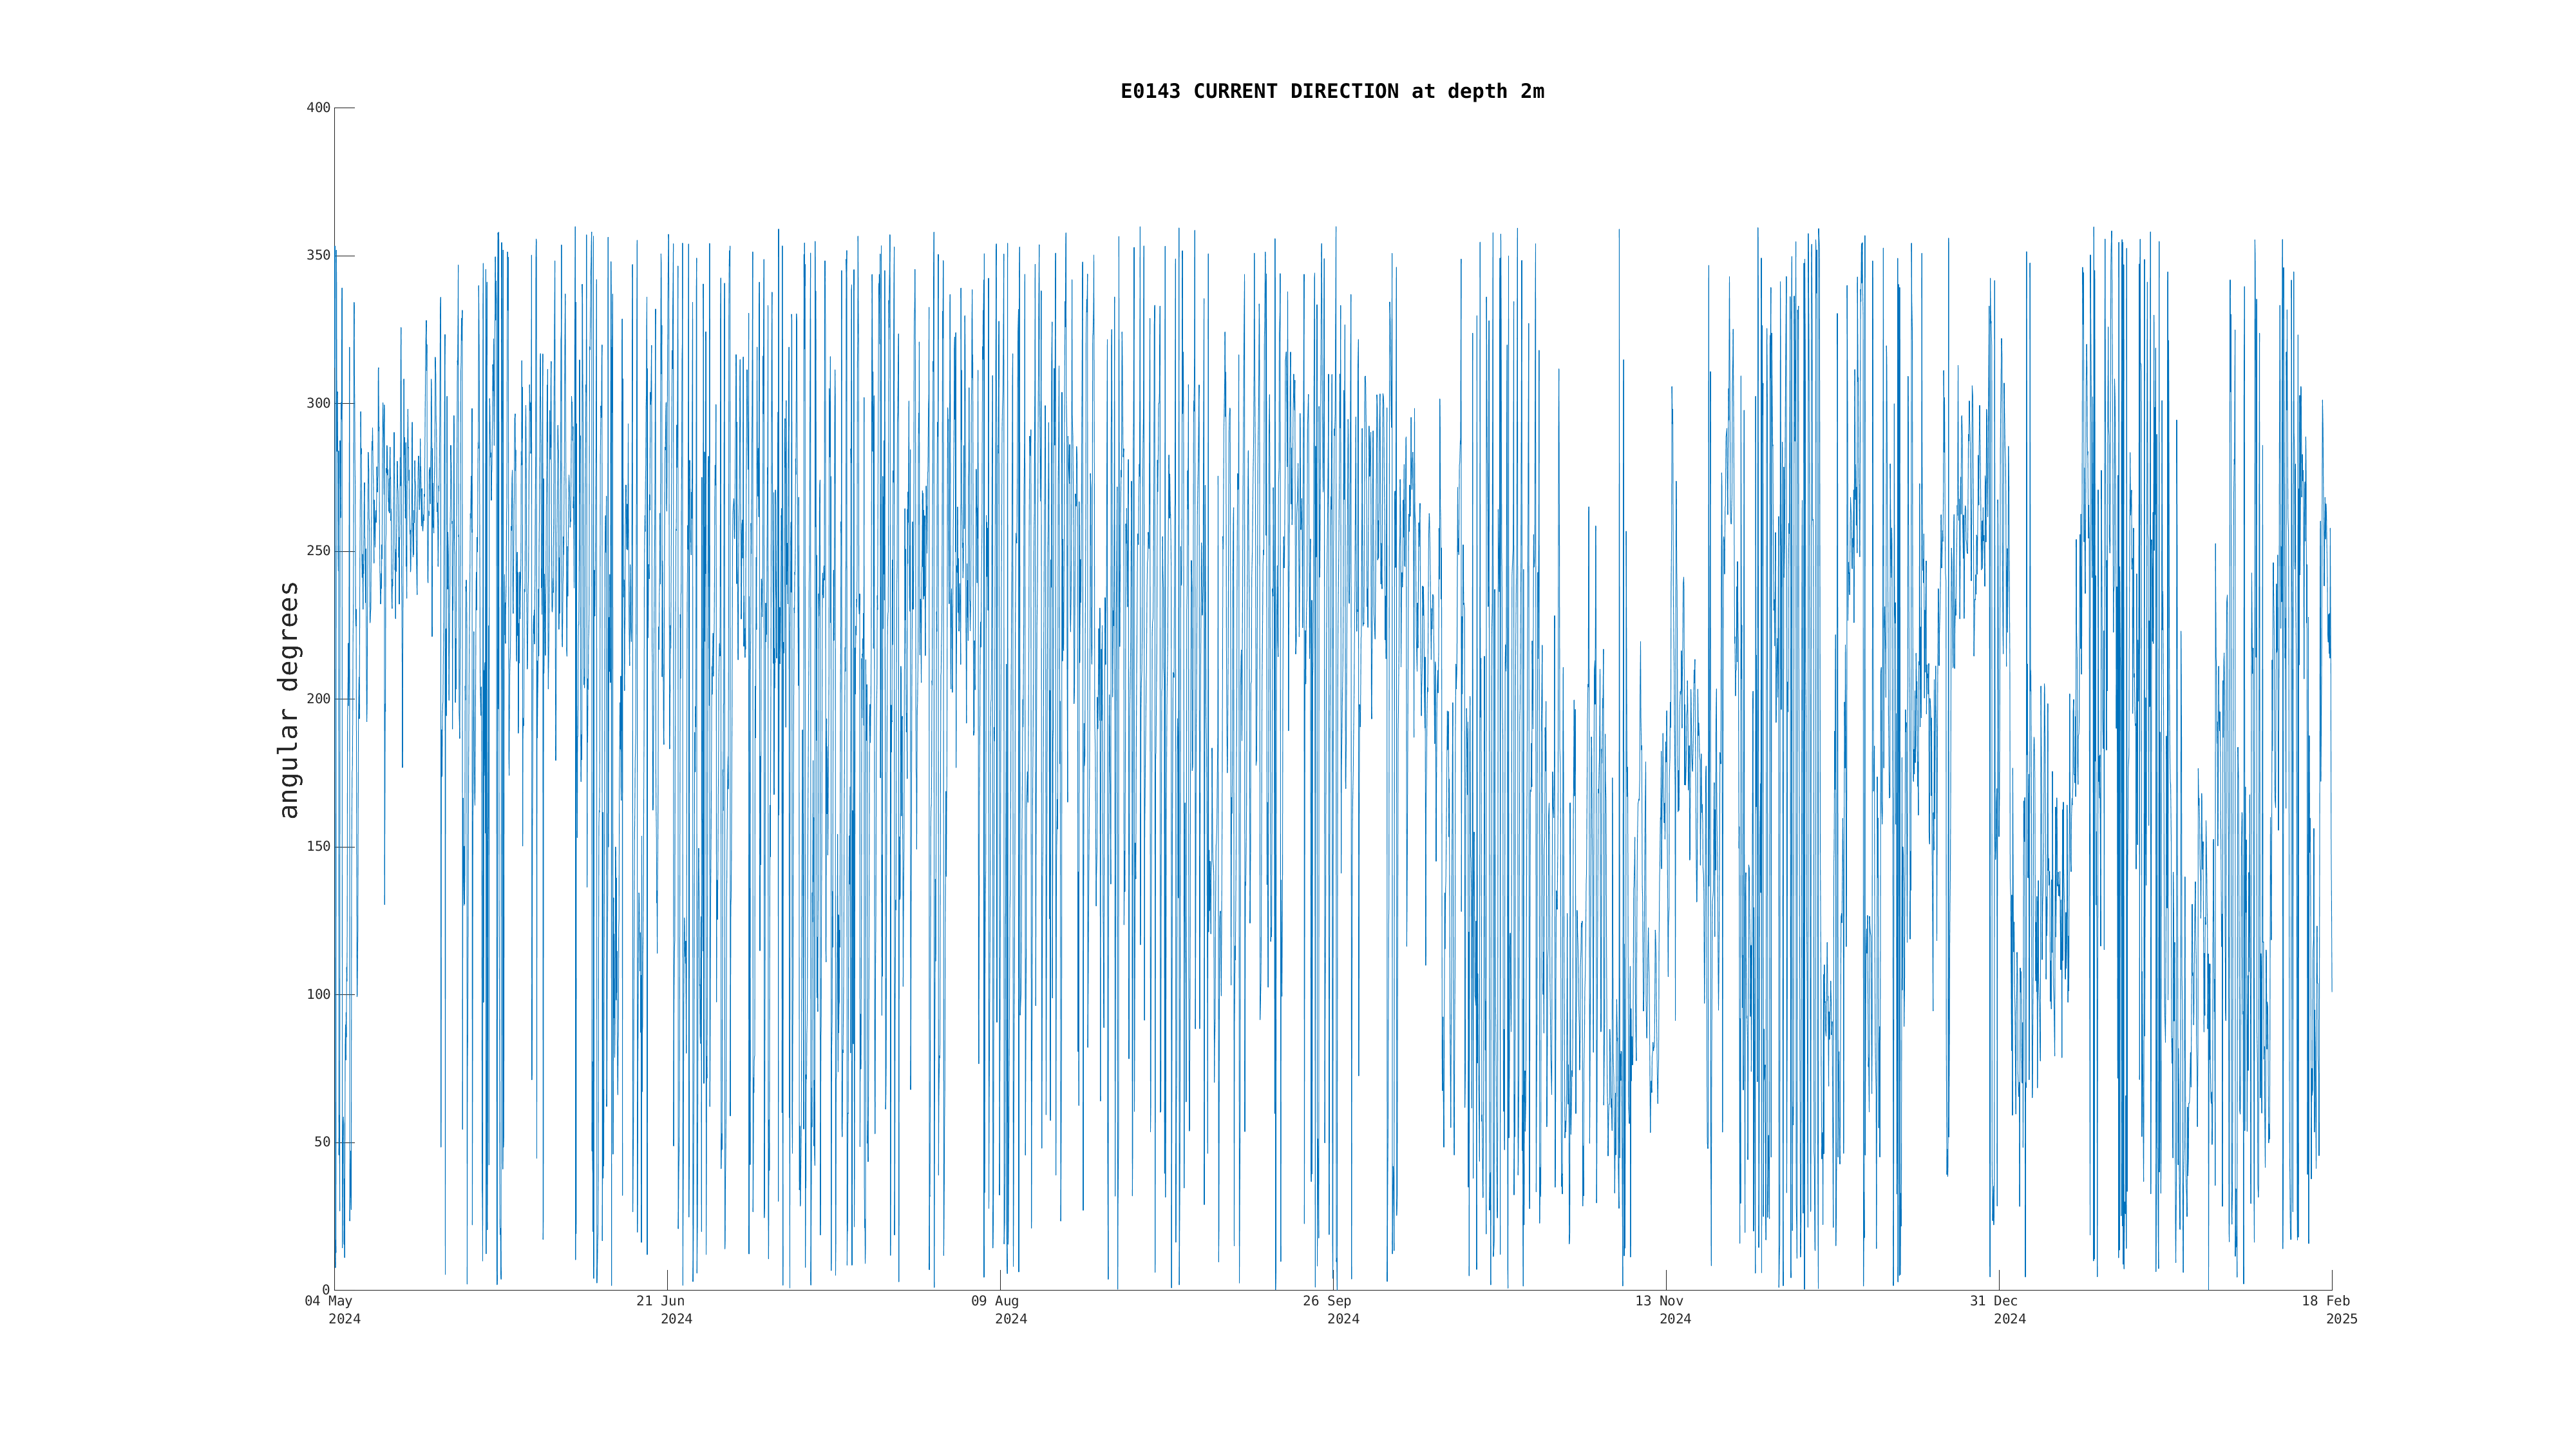
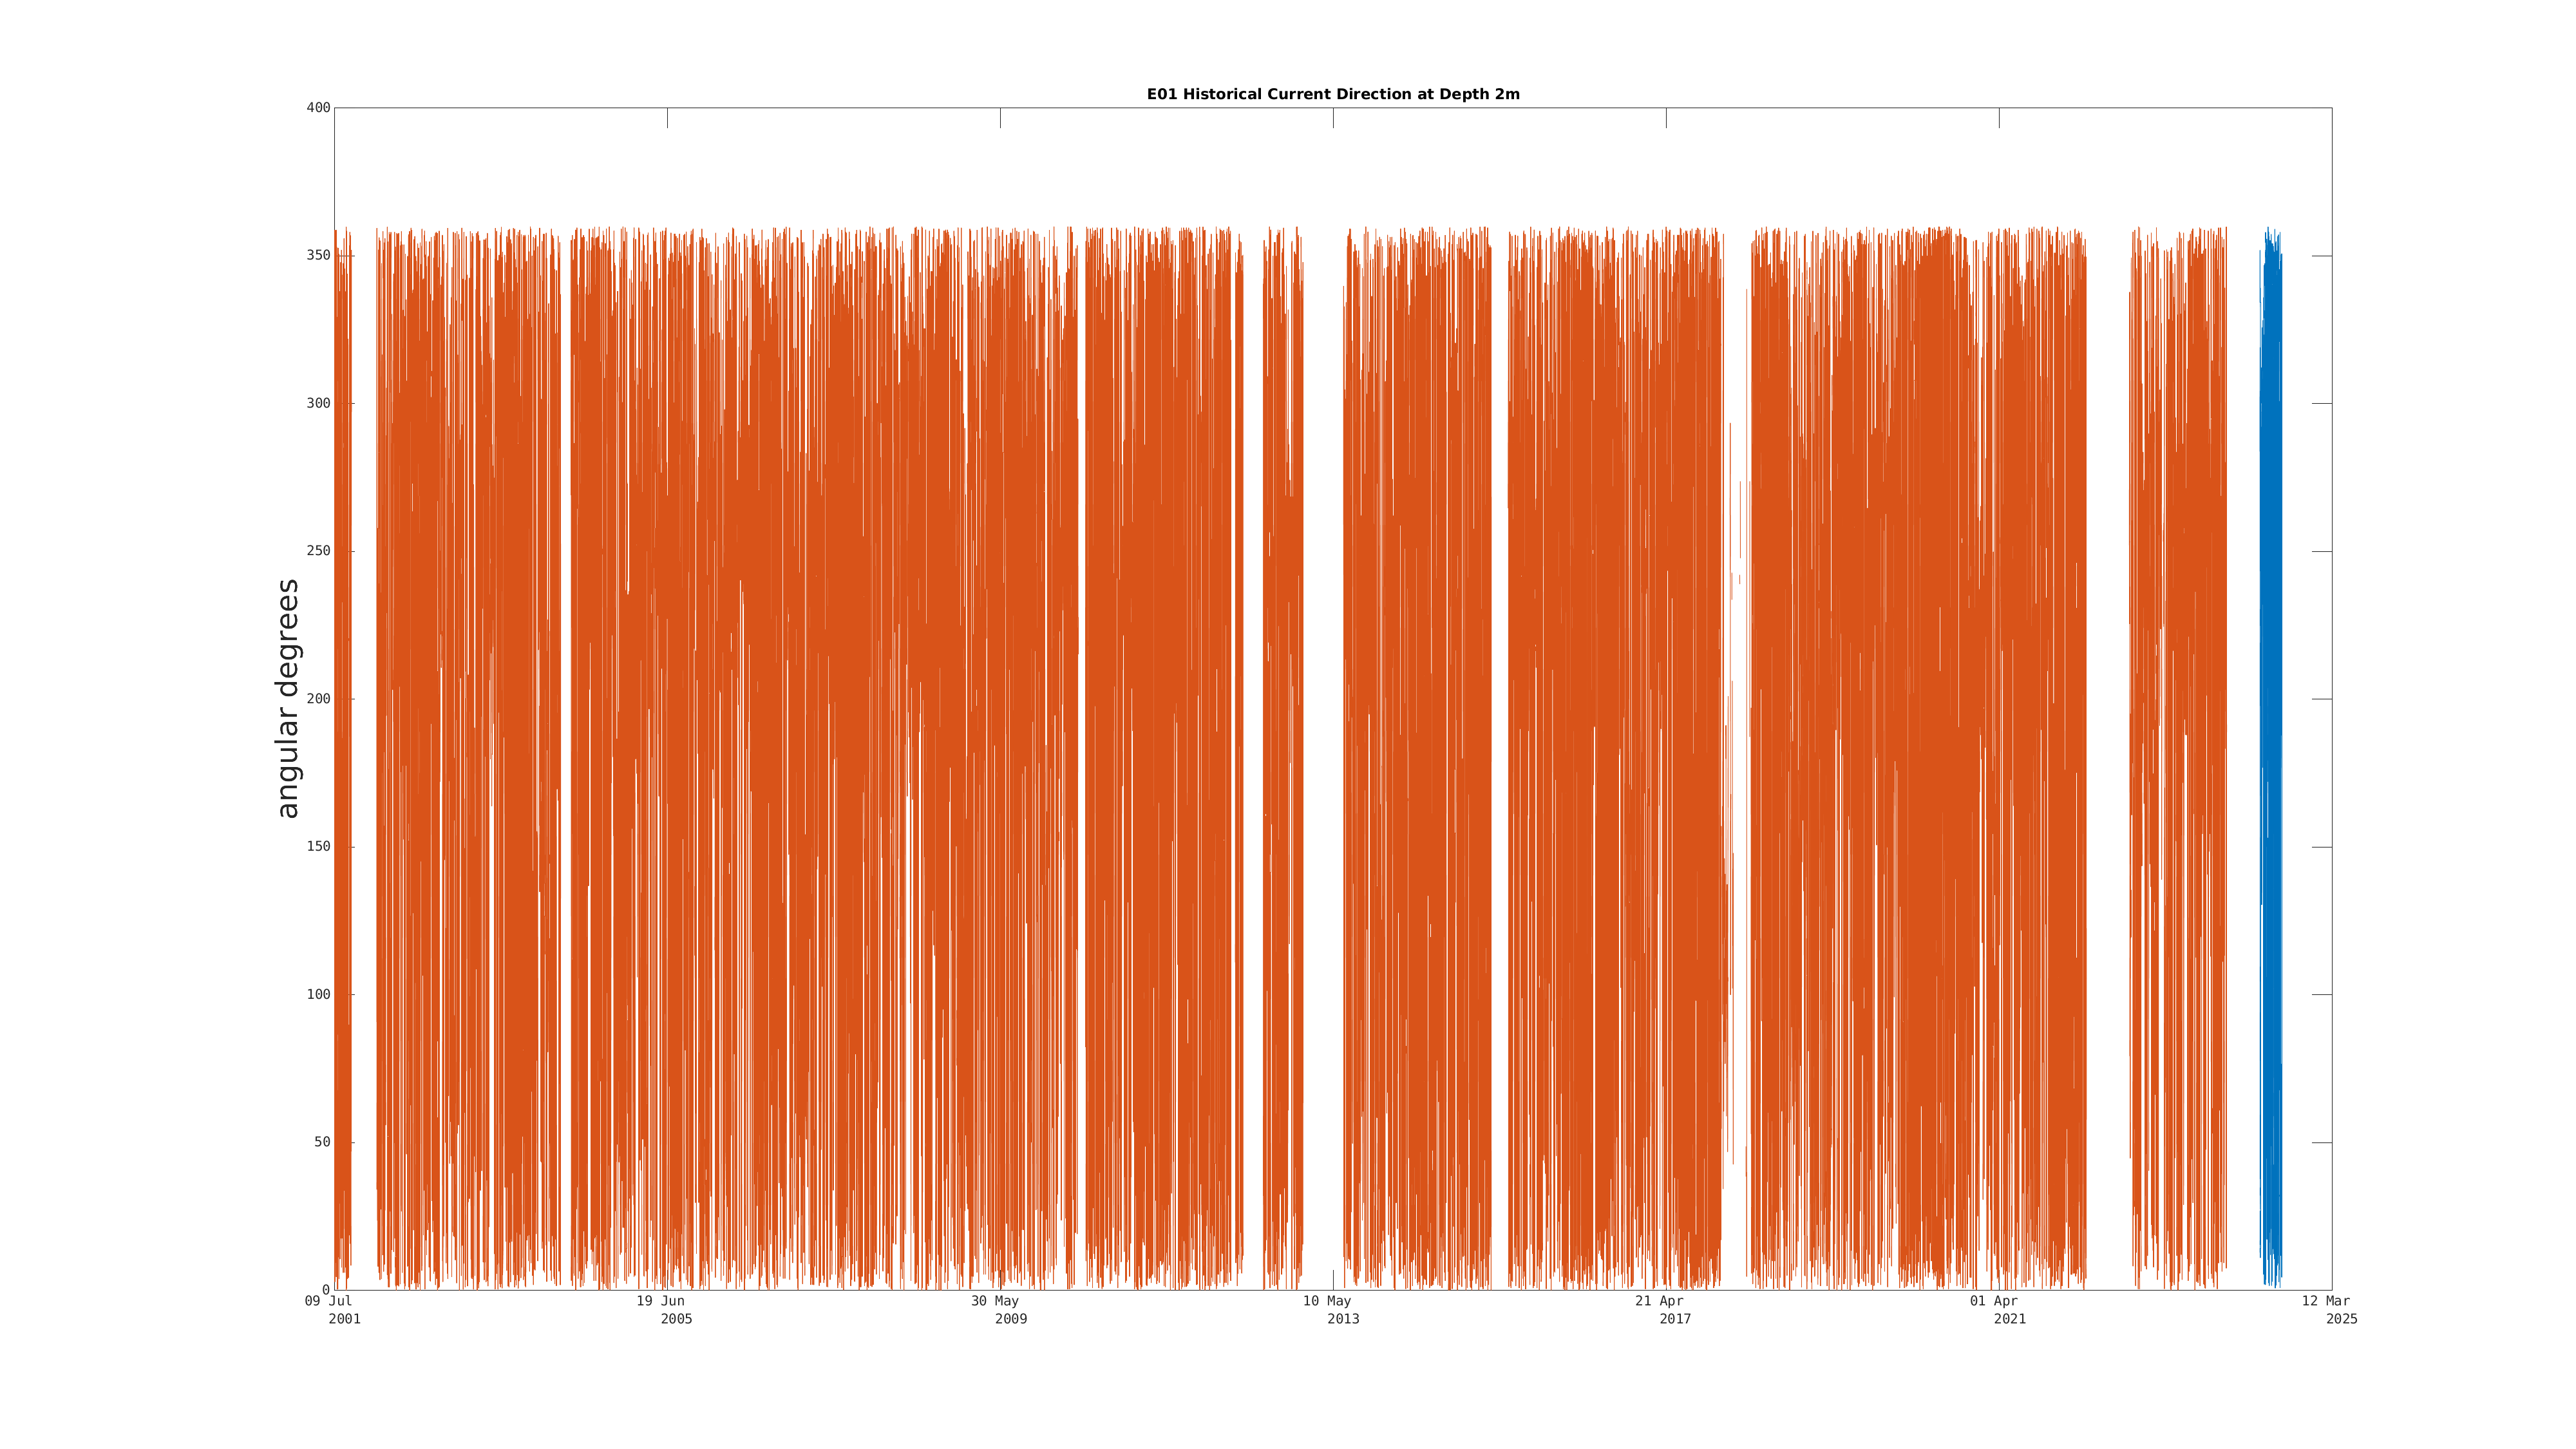
| Current Direction (2m) | Sensor Failure | Oct 08 12:00 PM |
|
|
|
|
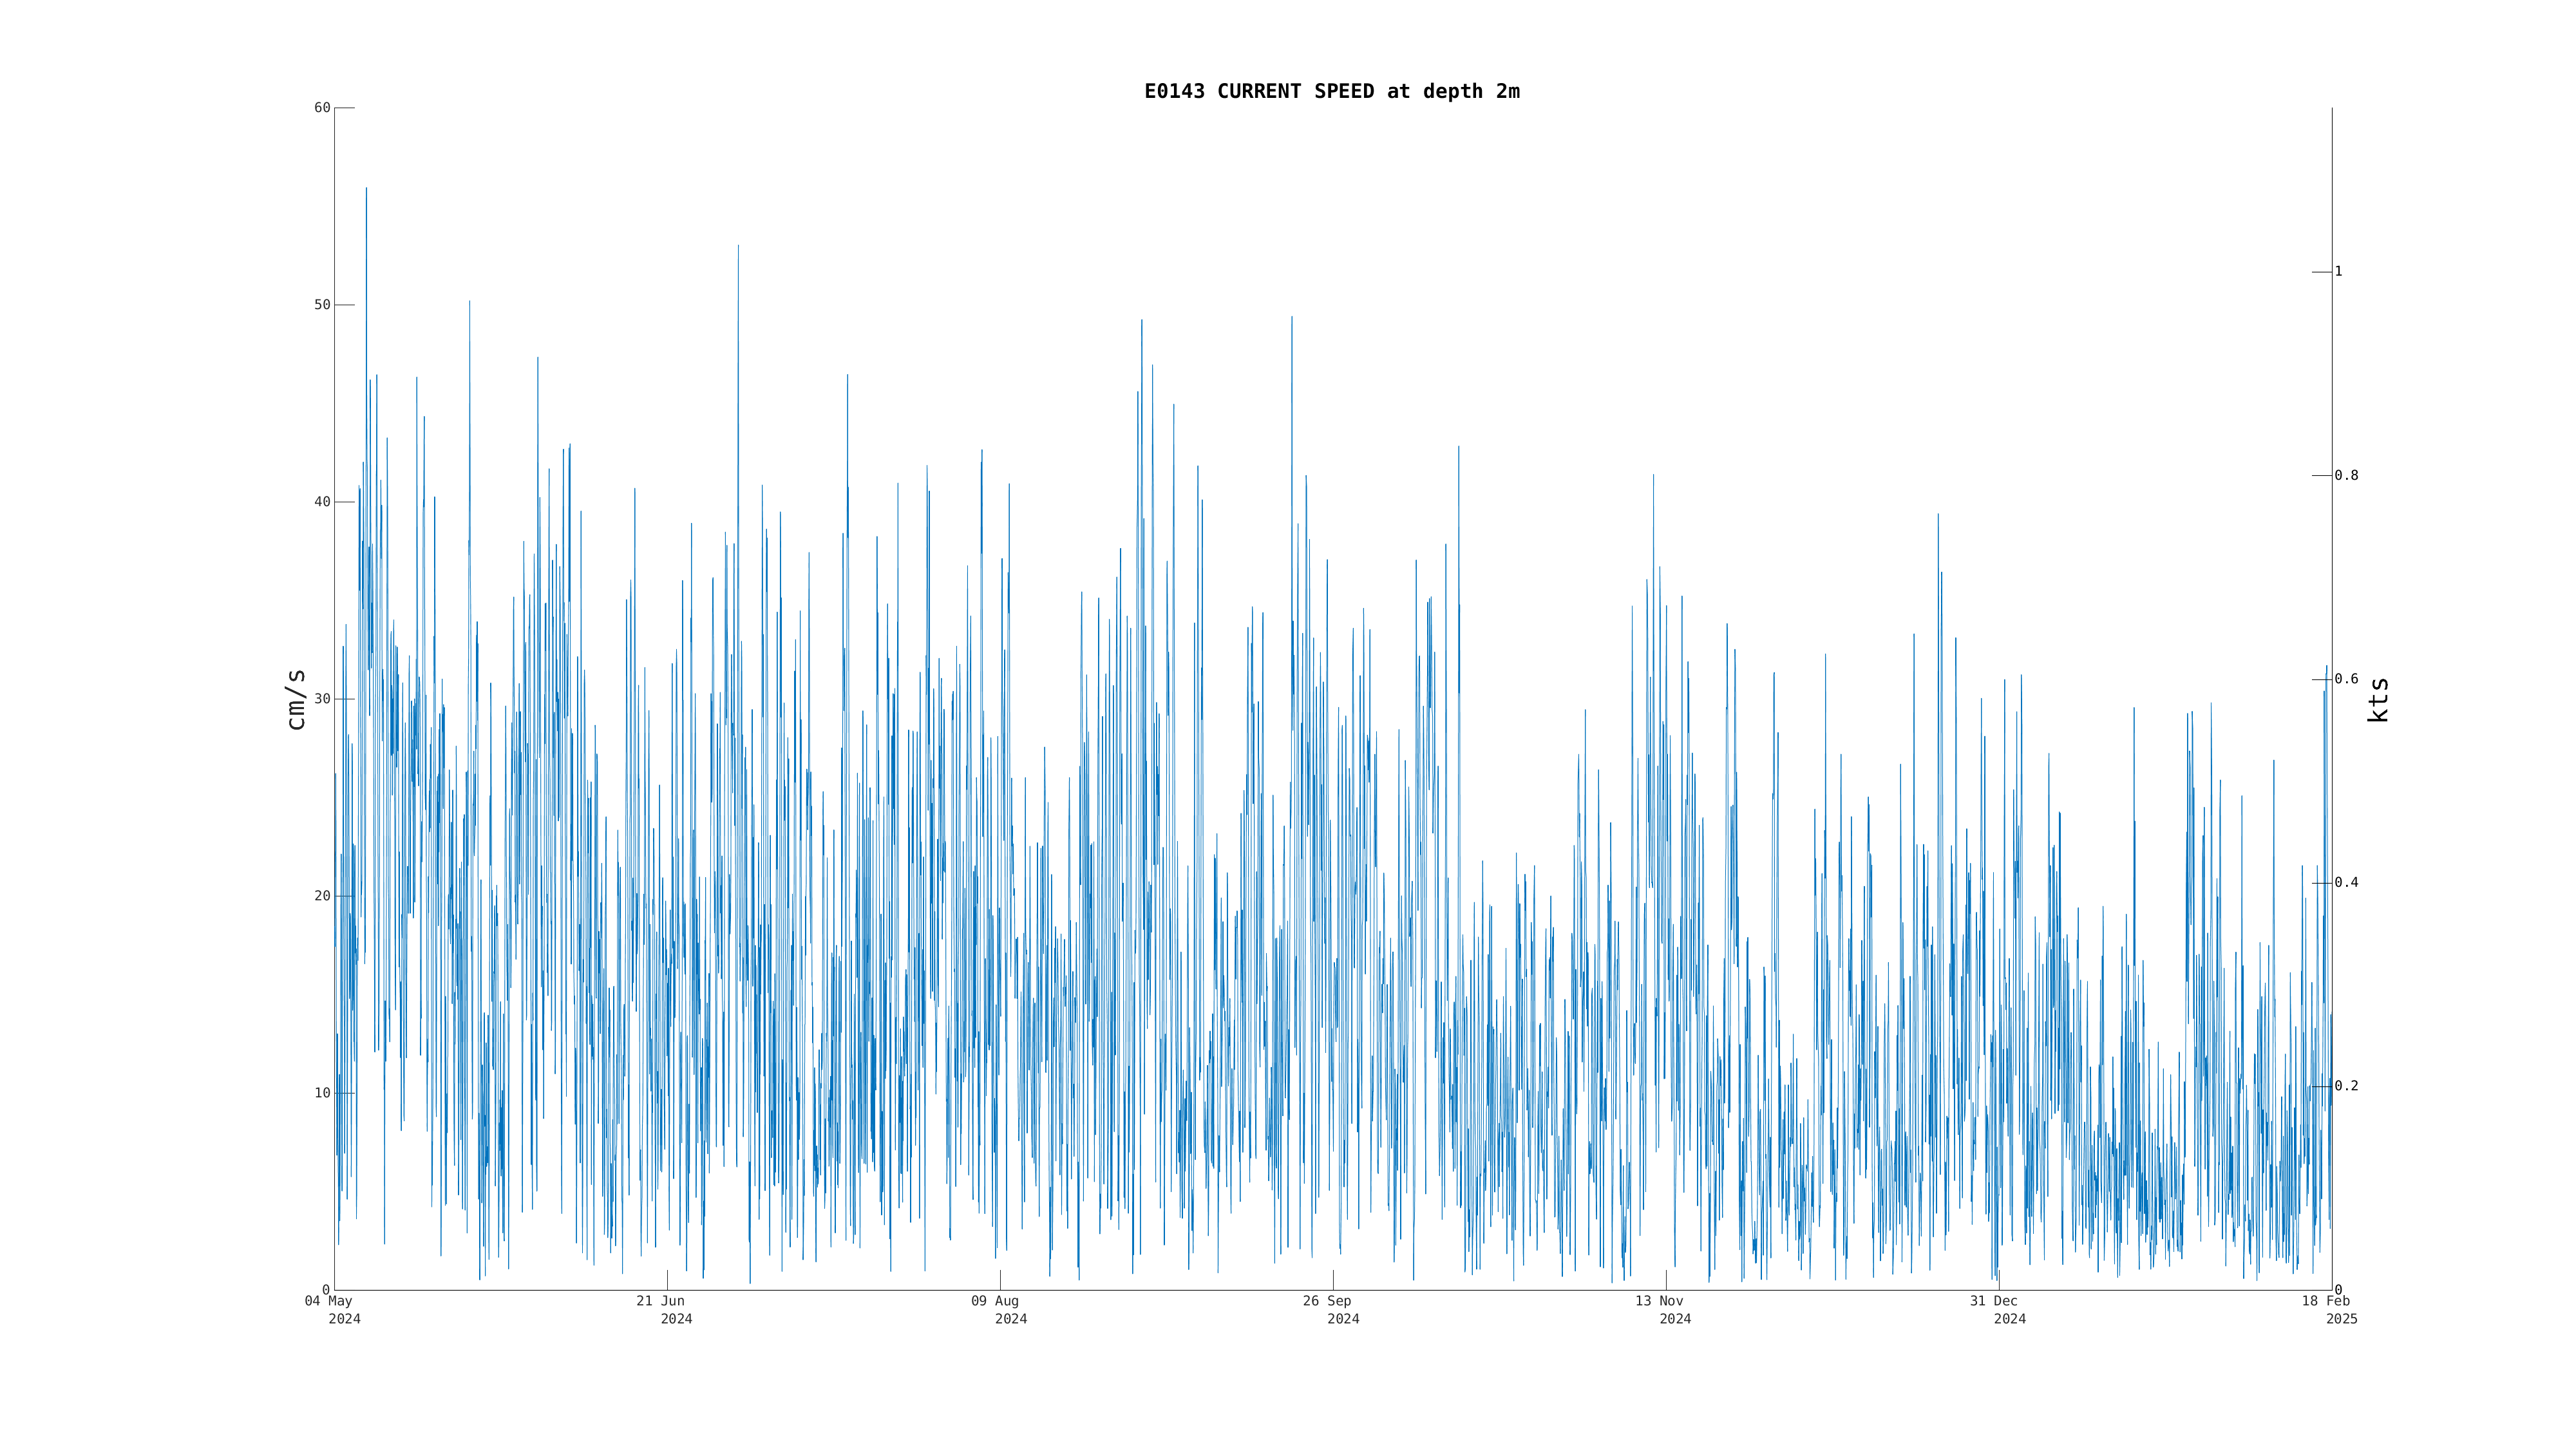
| Current Speed (2m) | Sensor Failure | Oct 08 12:00 PM |
|
|
|
|
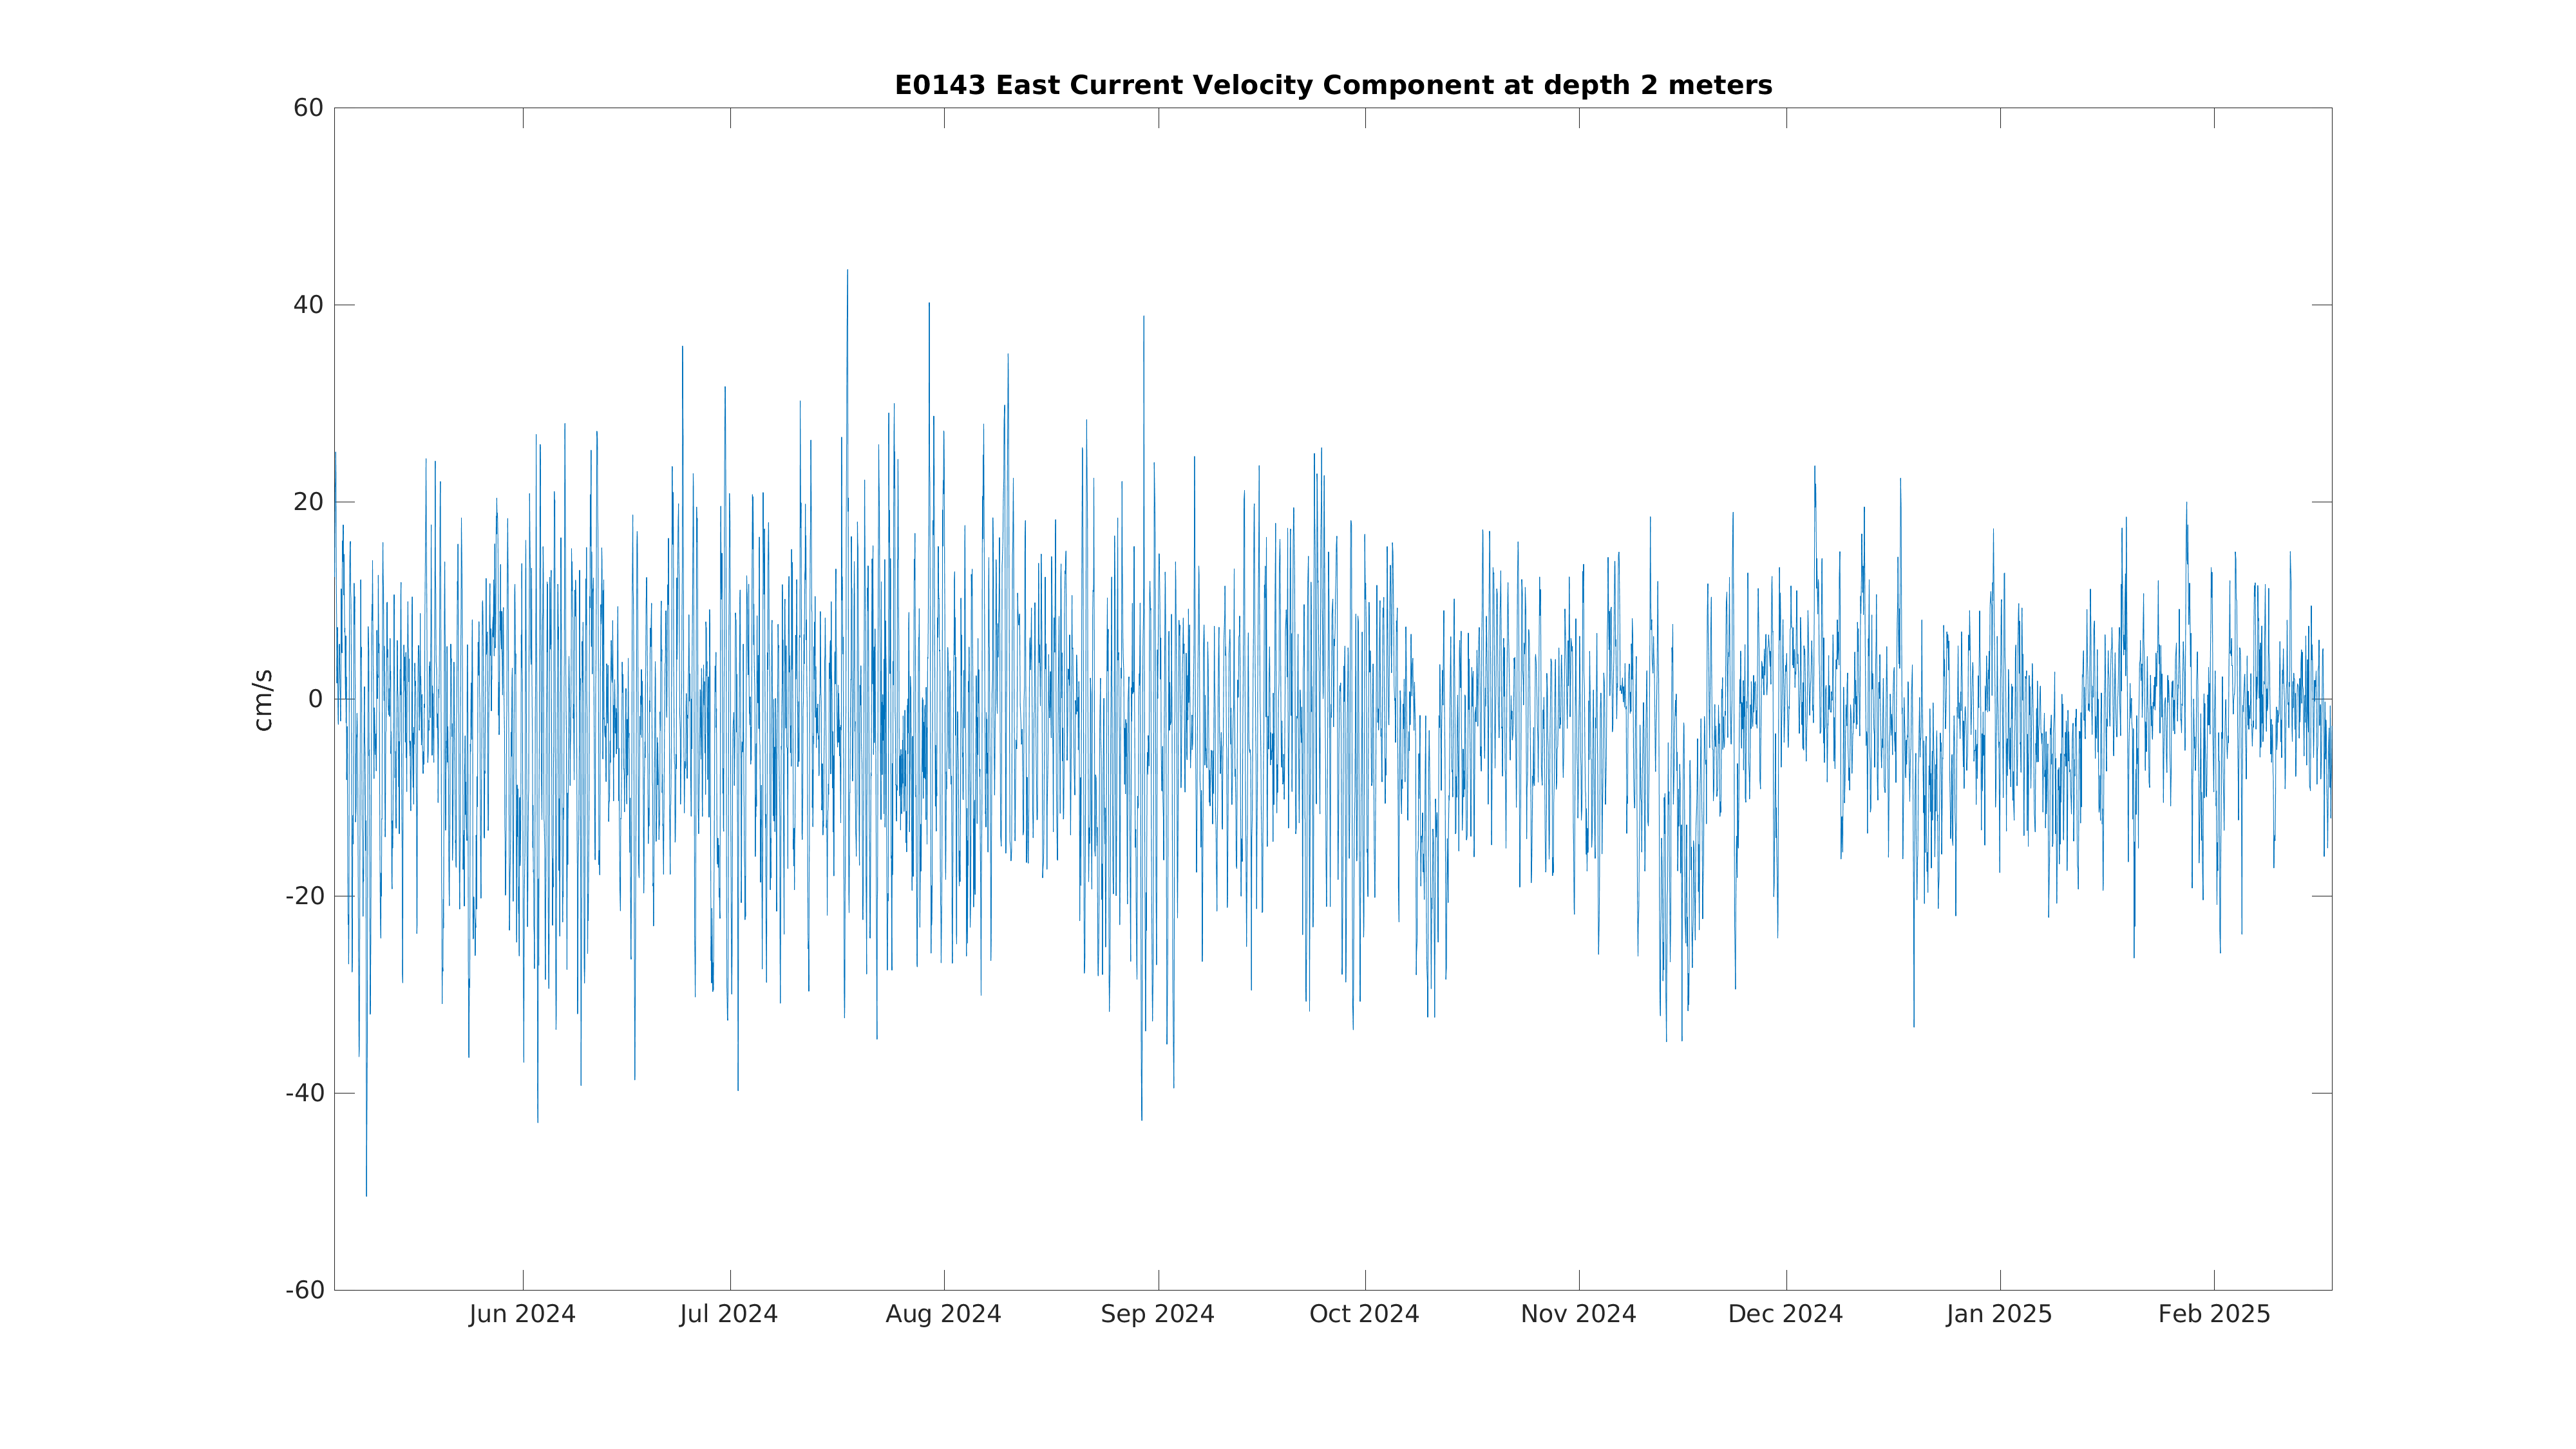
| East Current Velocity (2m) | Sensor Failure | Oct 08 12:00 PM |

|
|
|
|
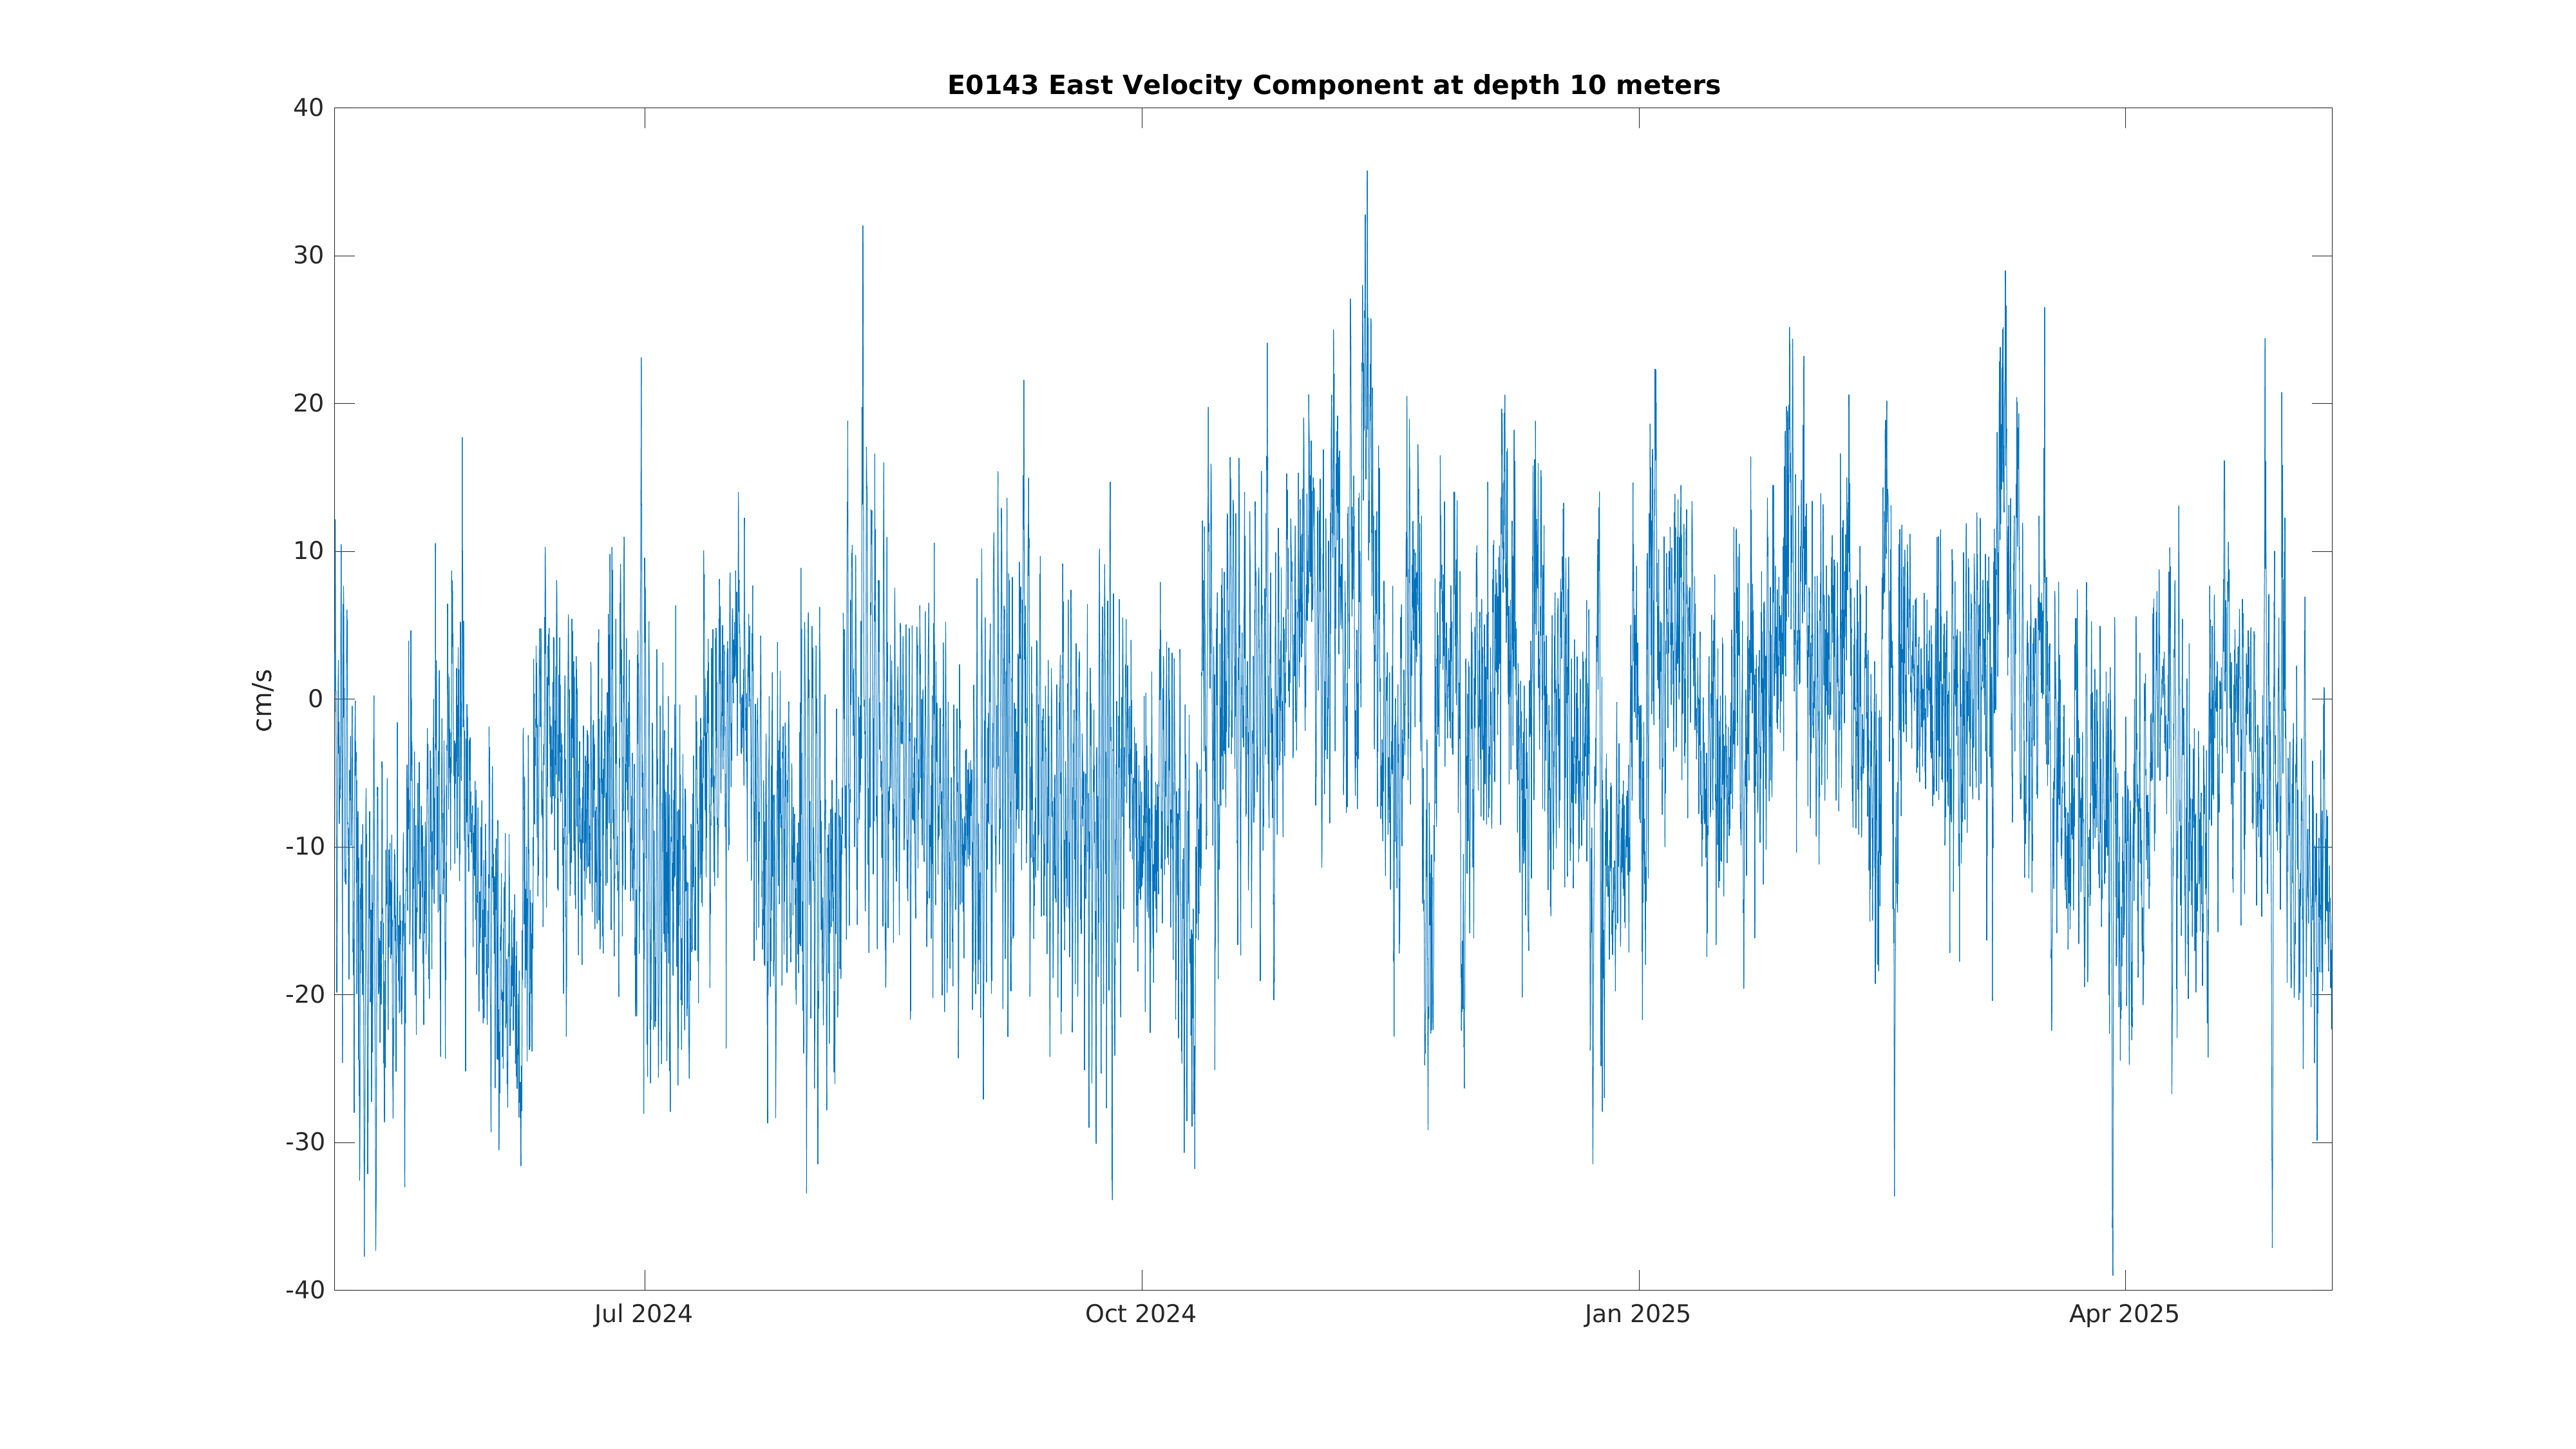
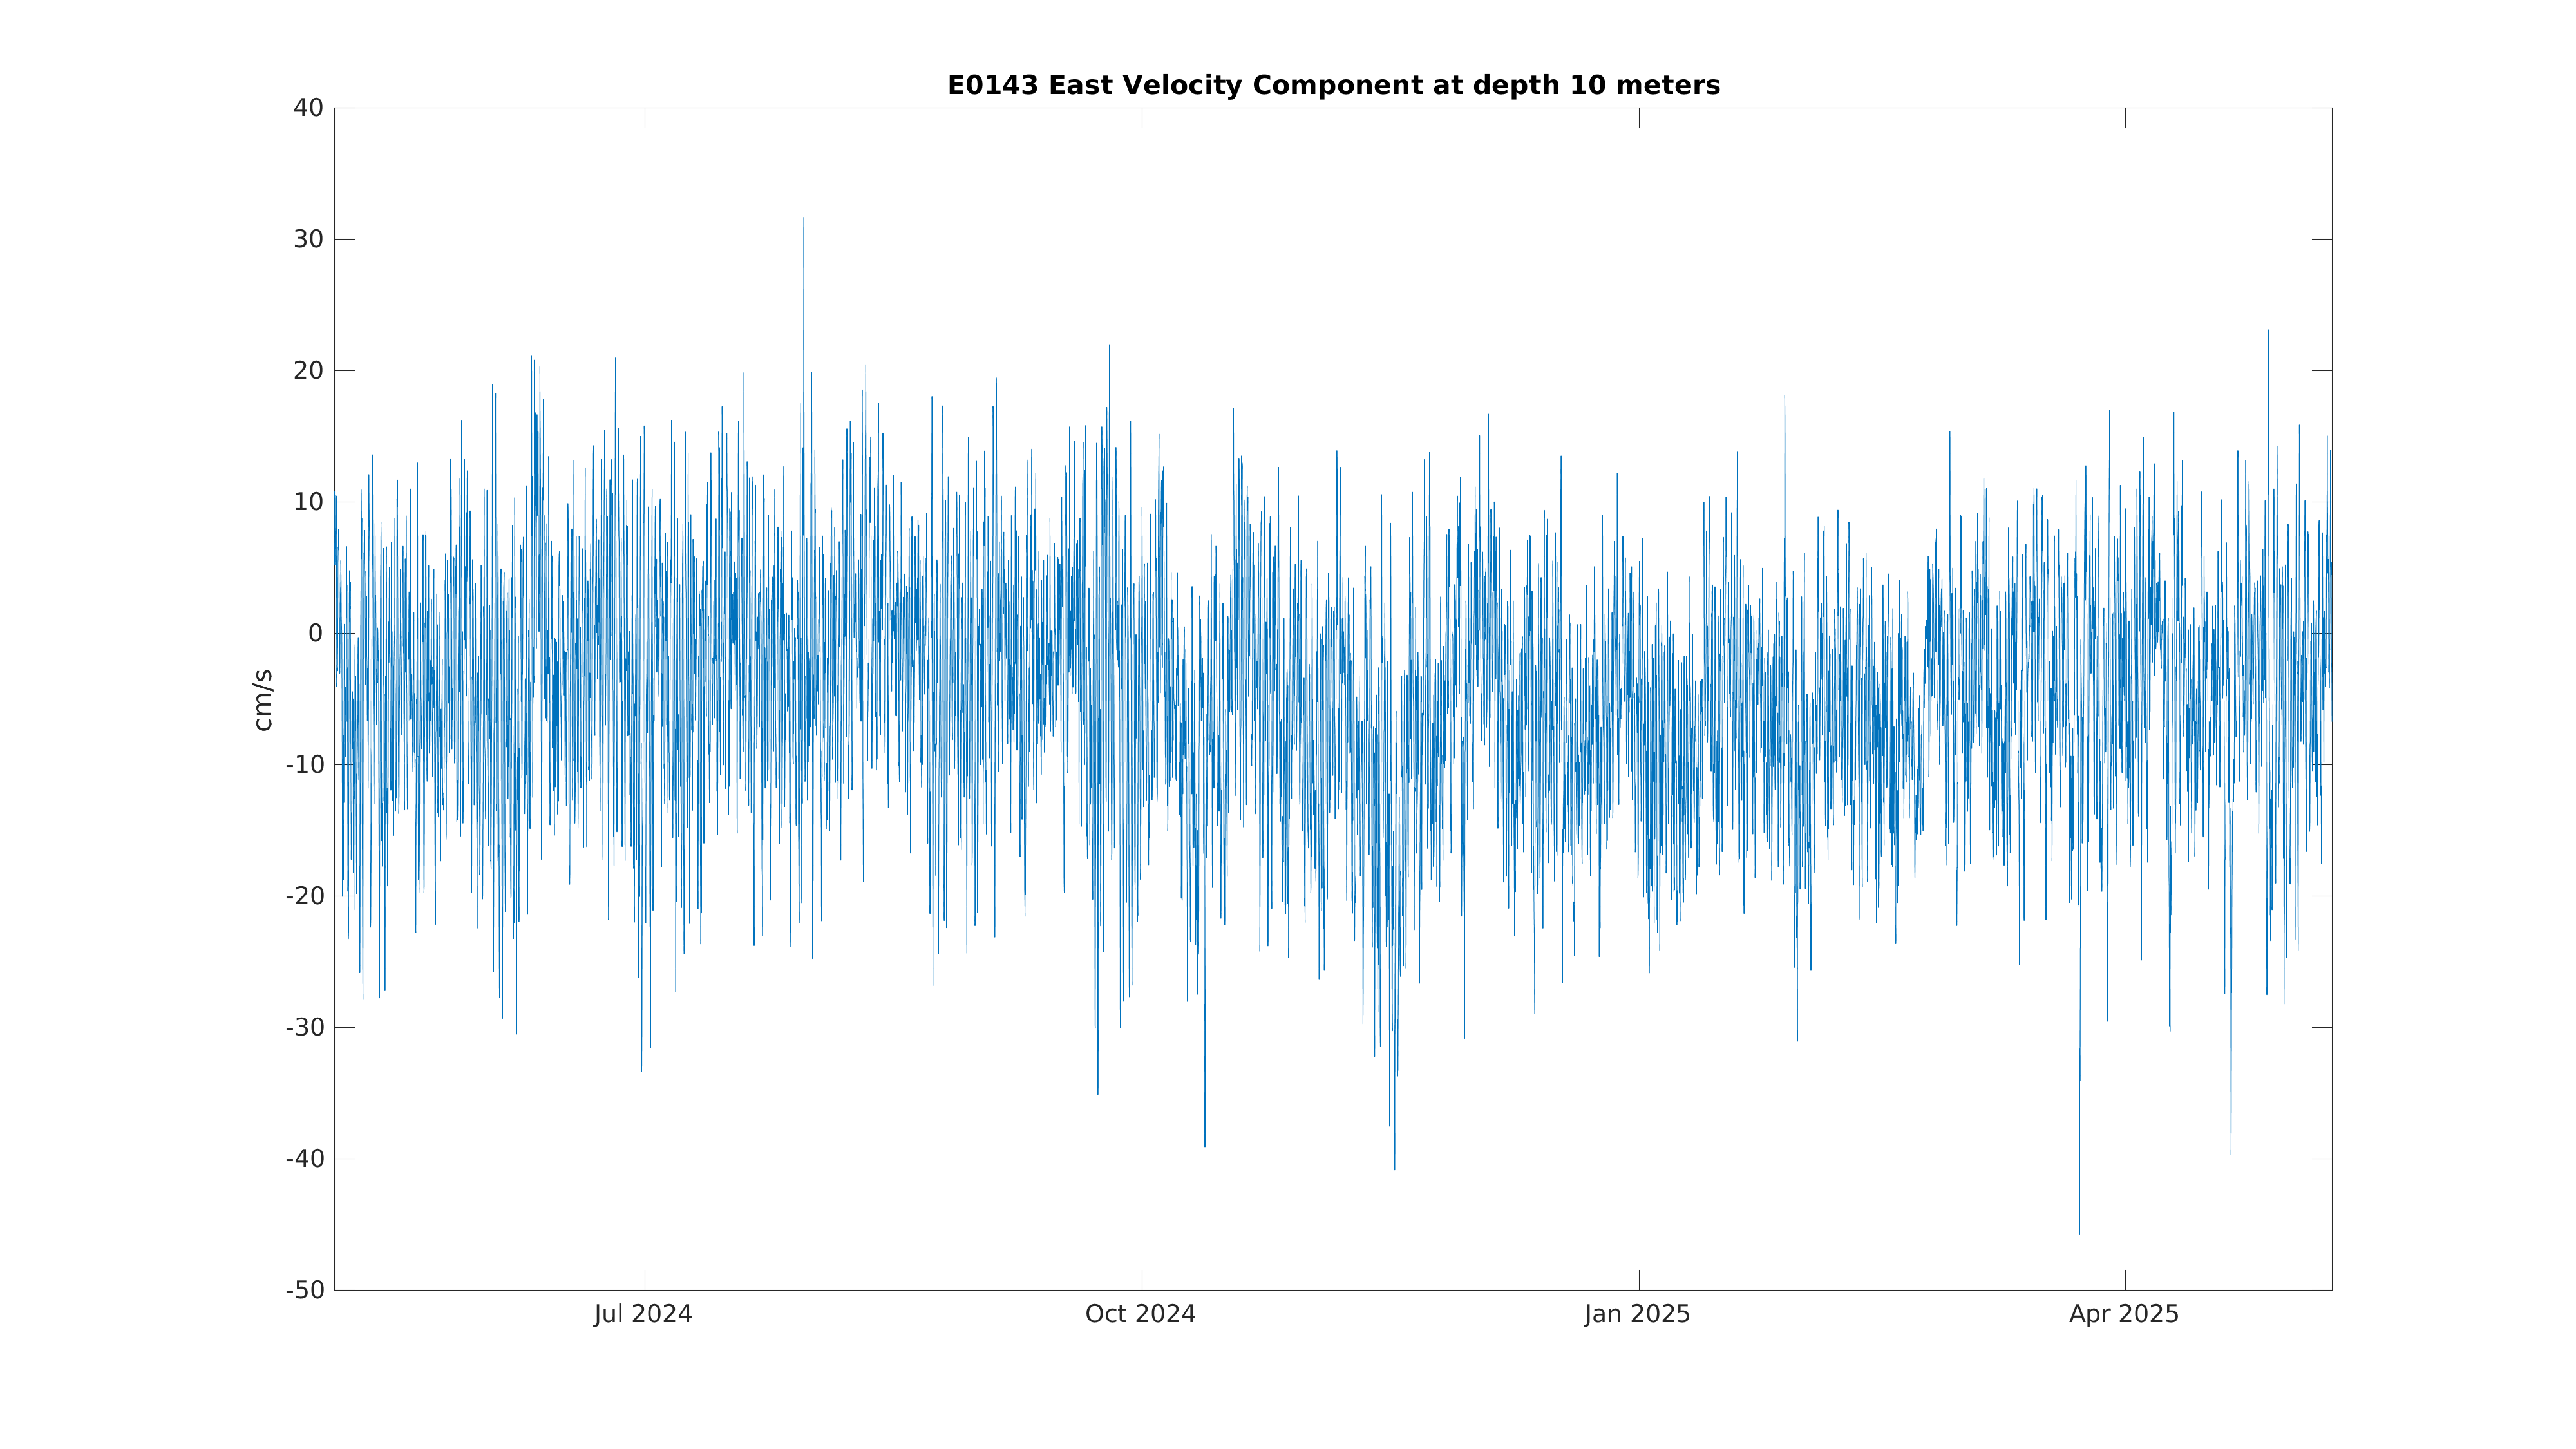
| East Current Velocity (10m) | Sensor Failure | Dec 21 9:00 PM |
|
|
|
|
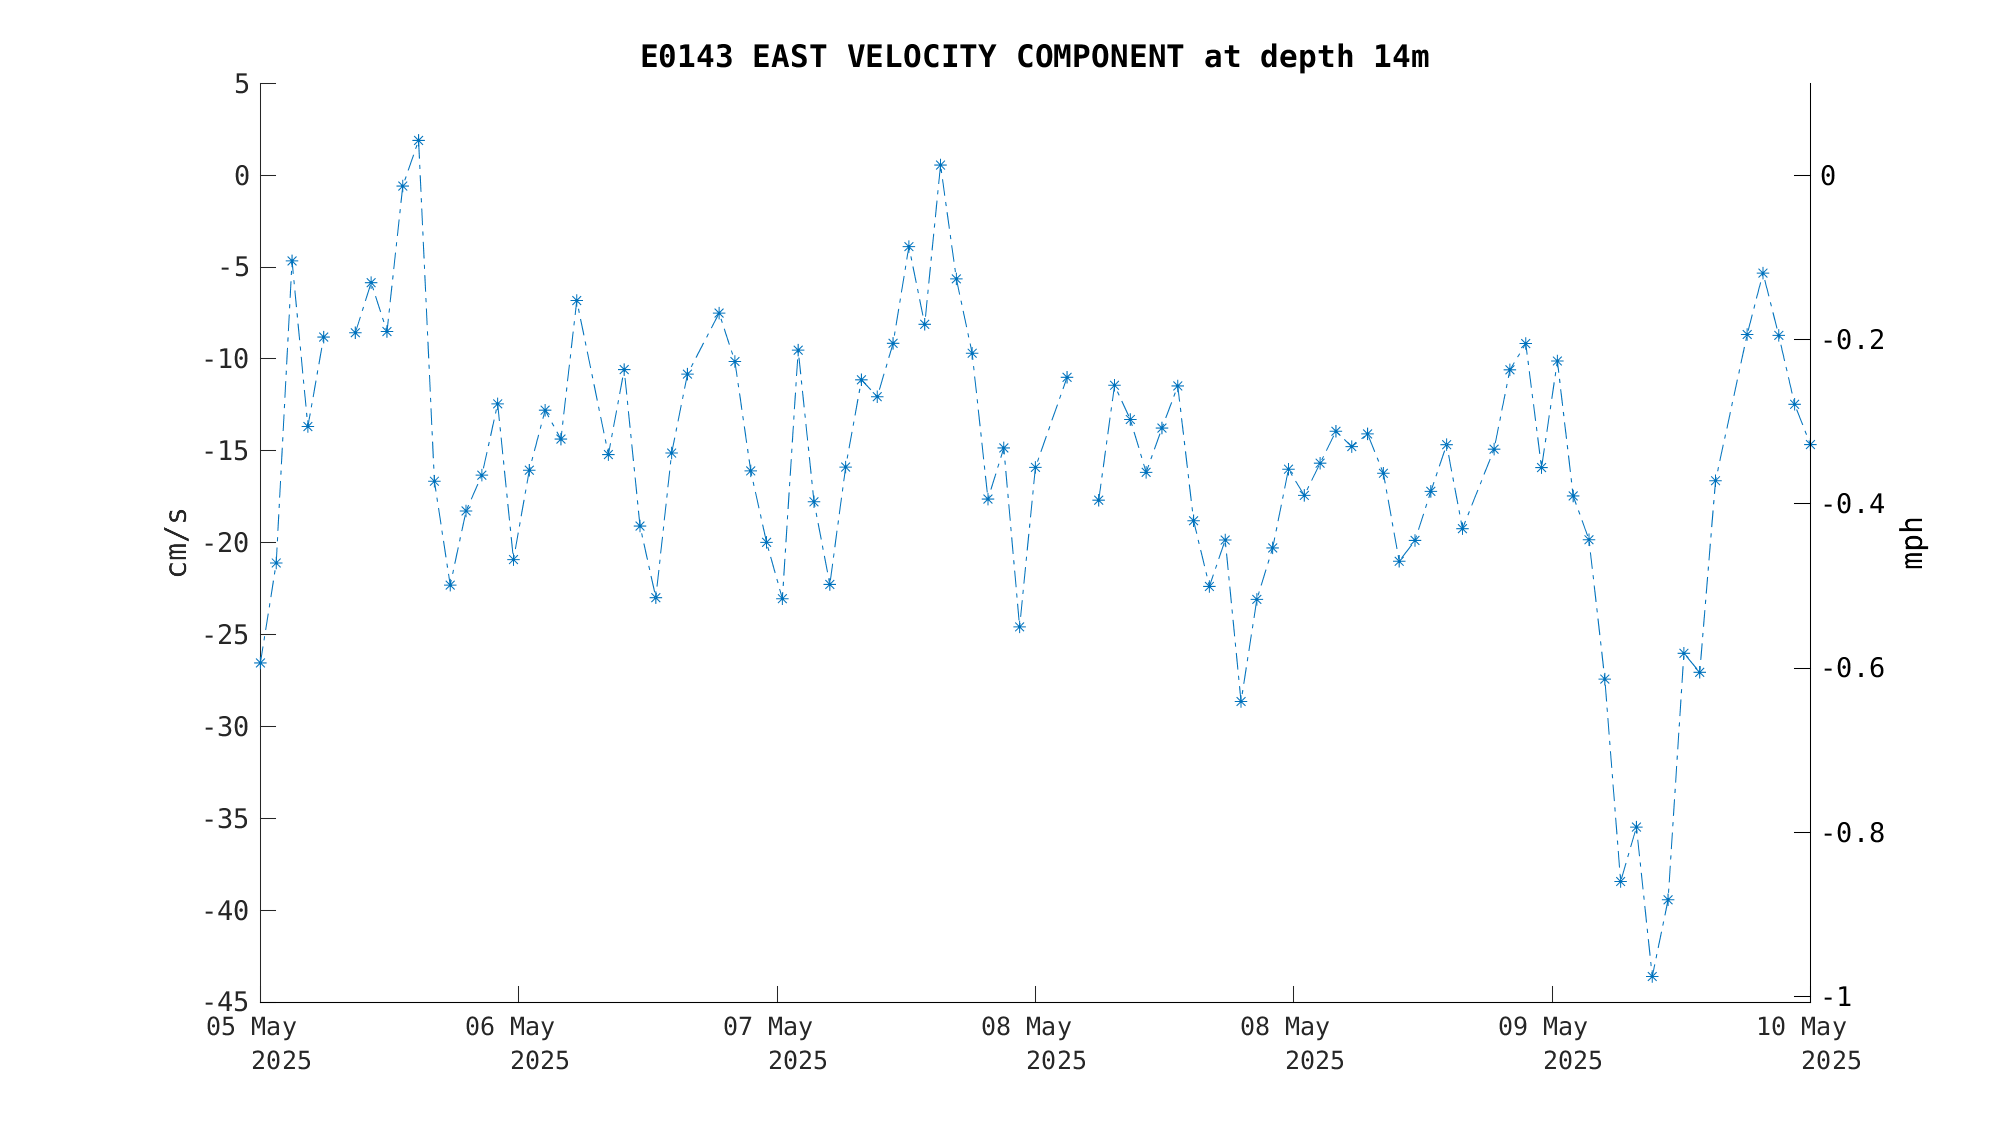
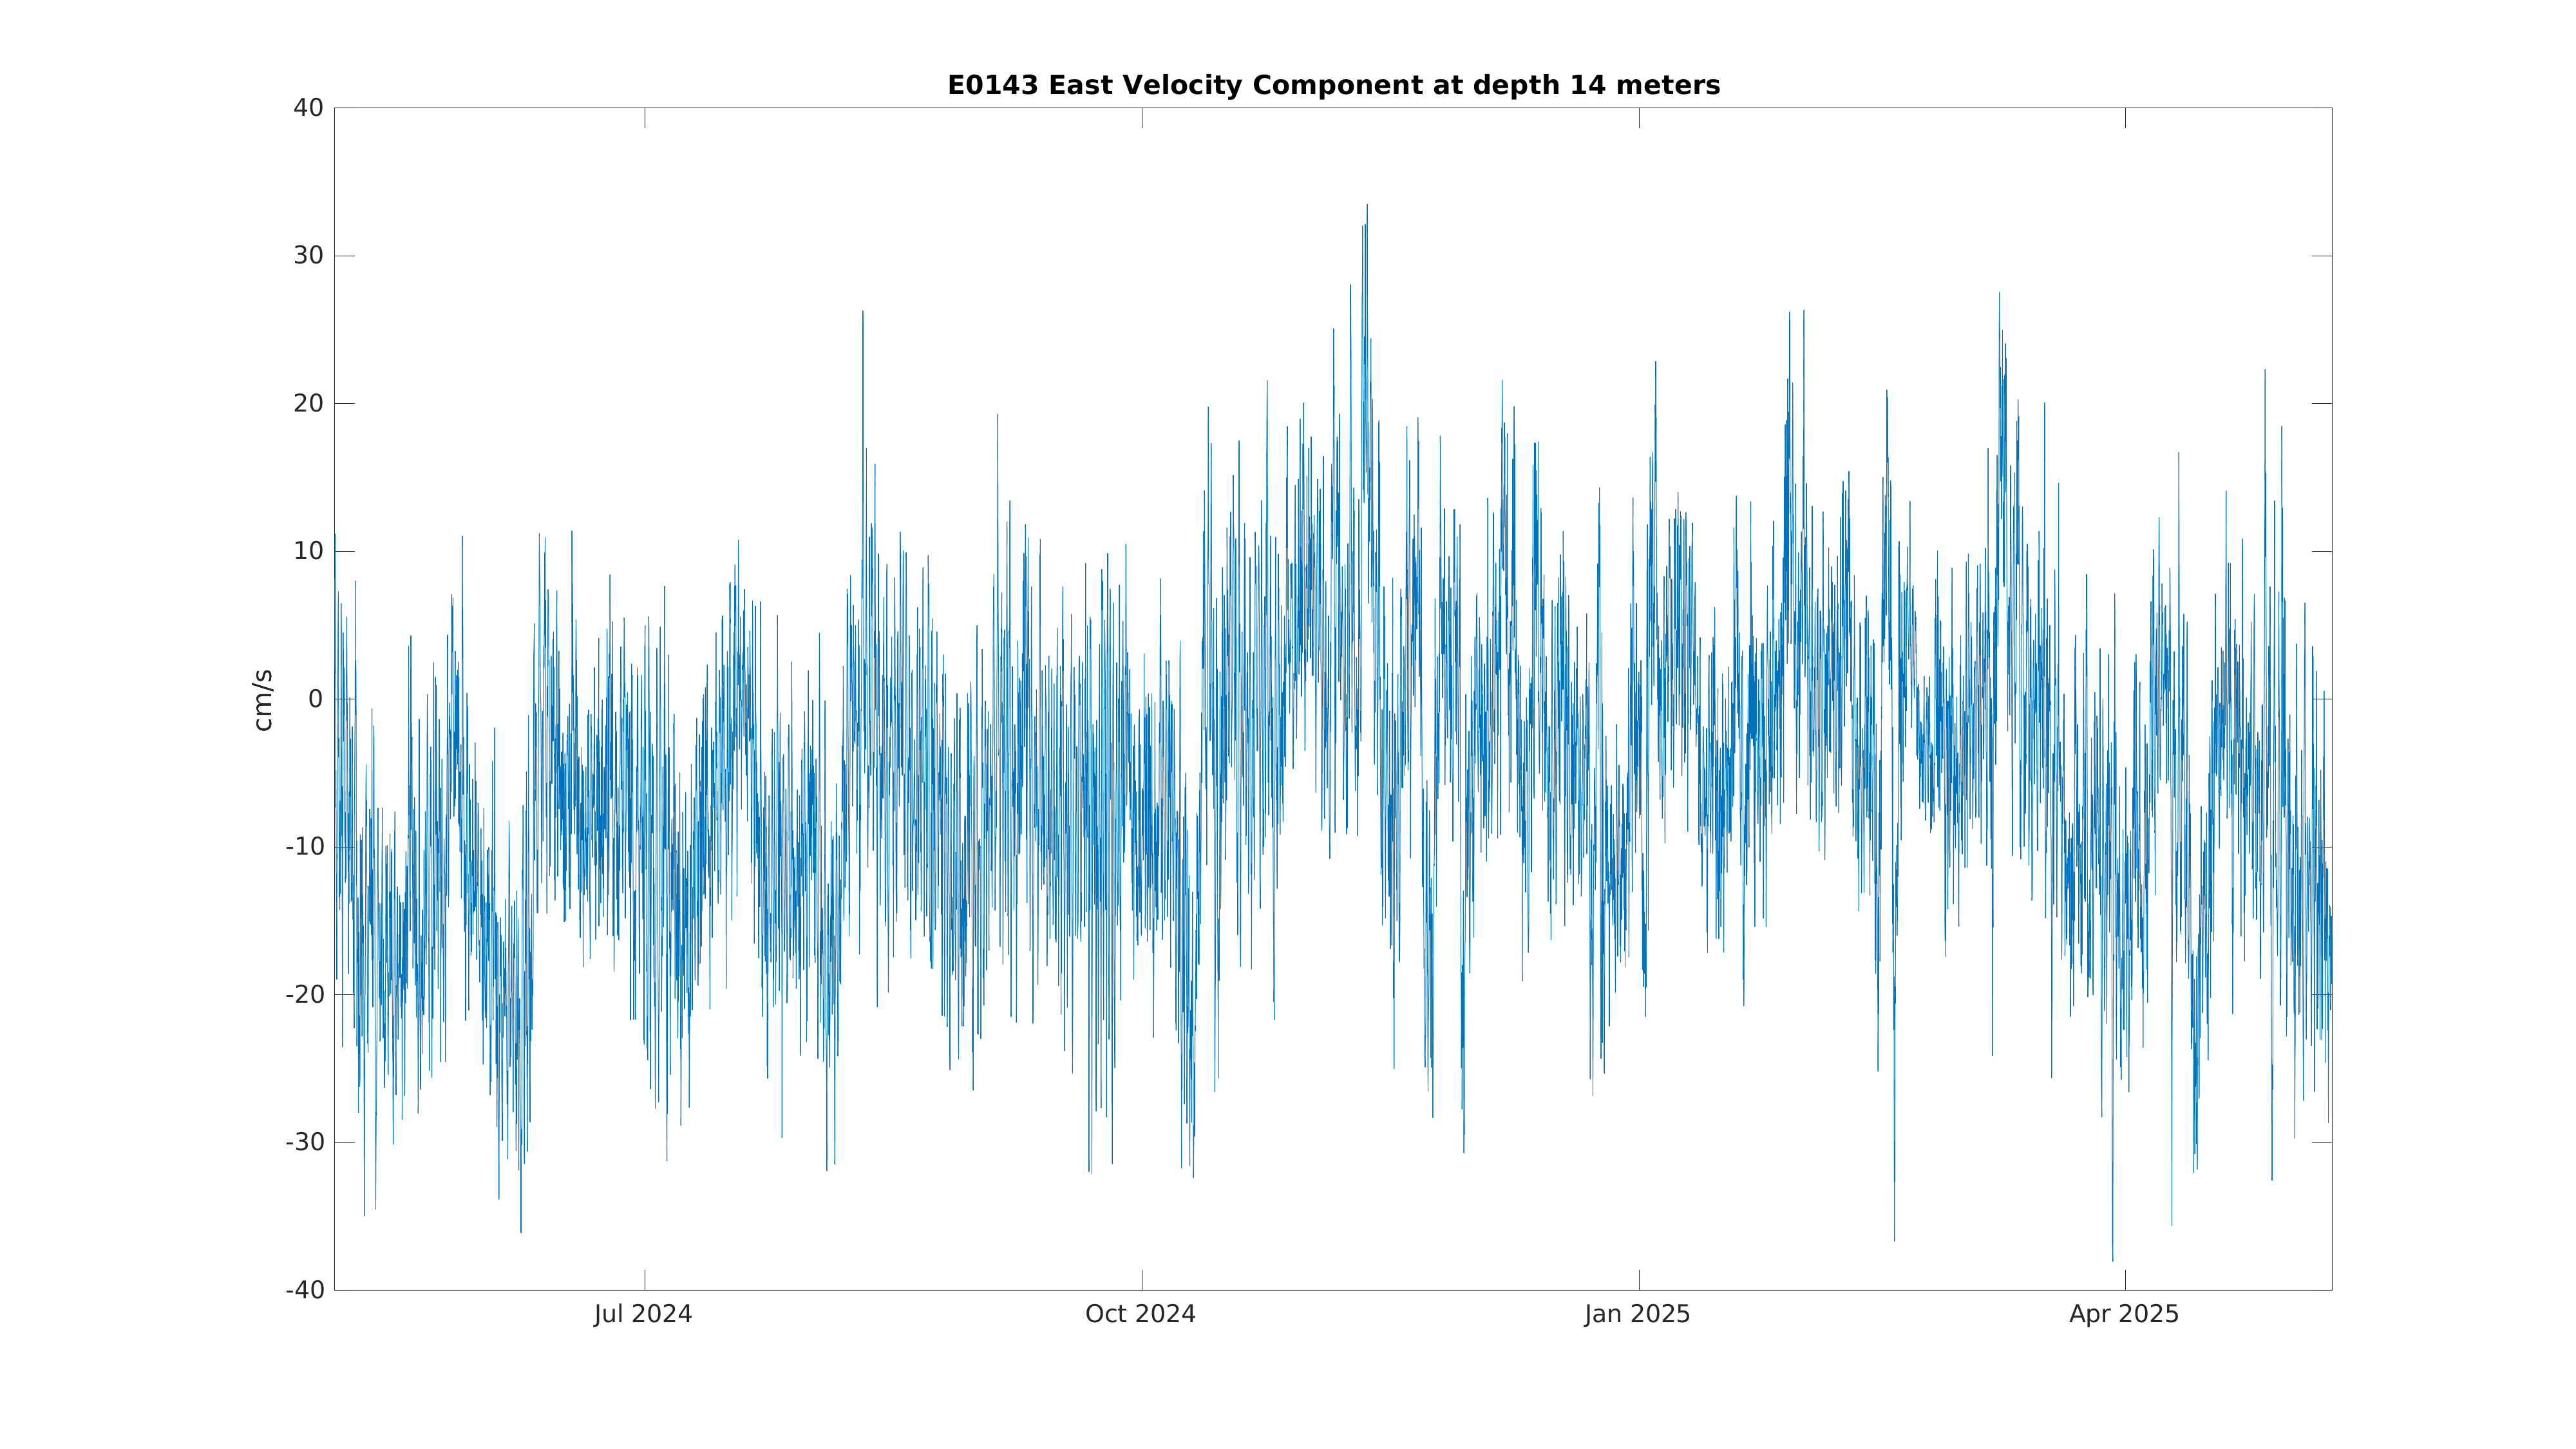
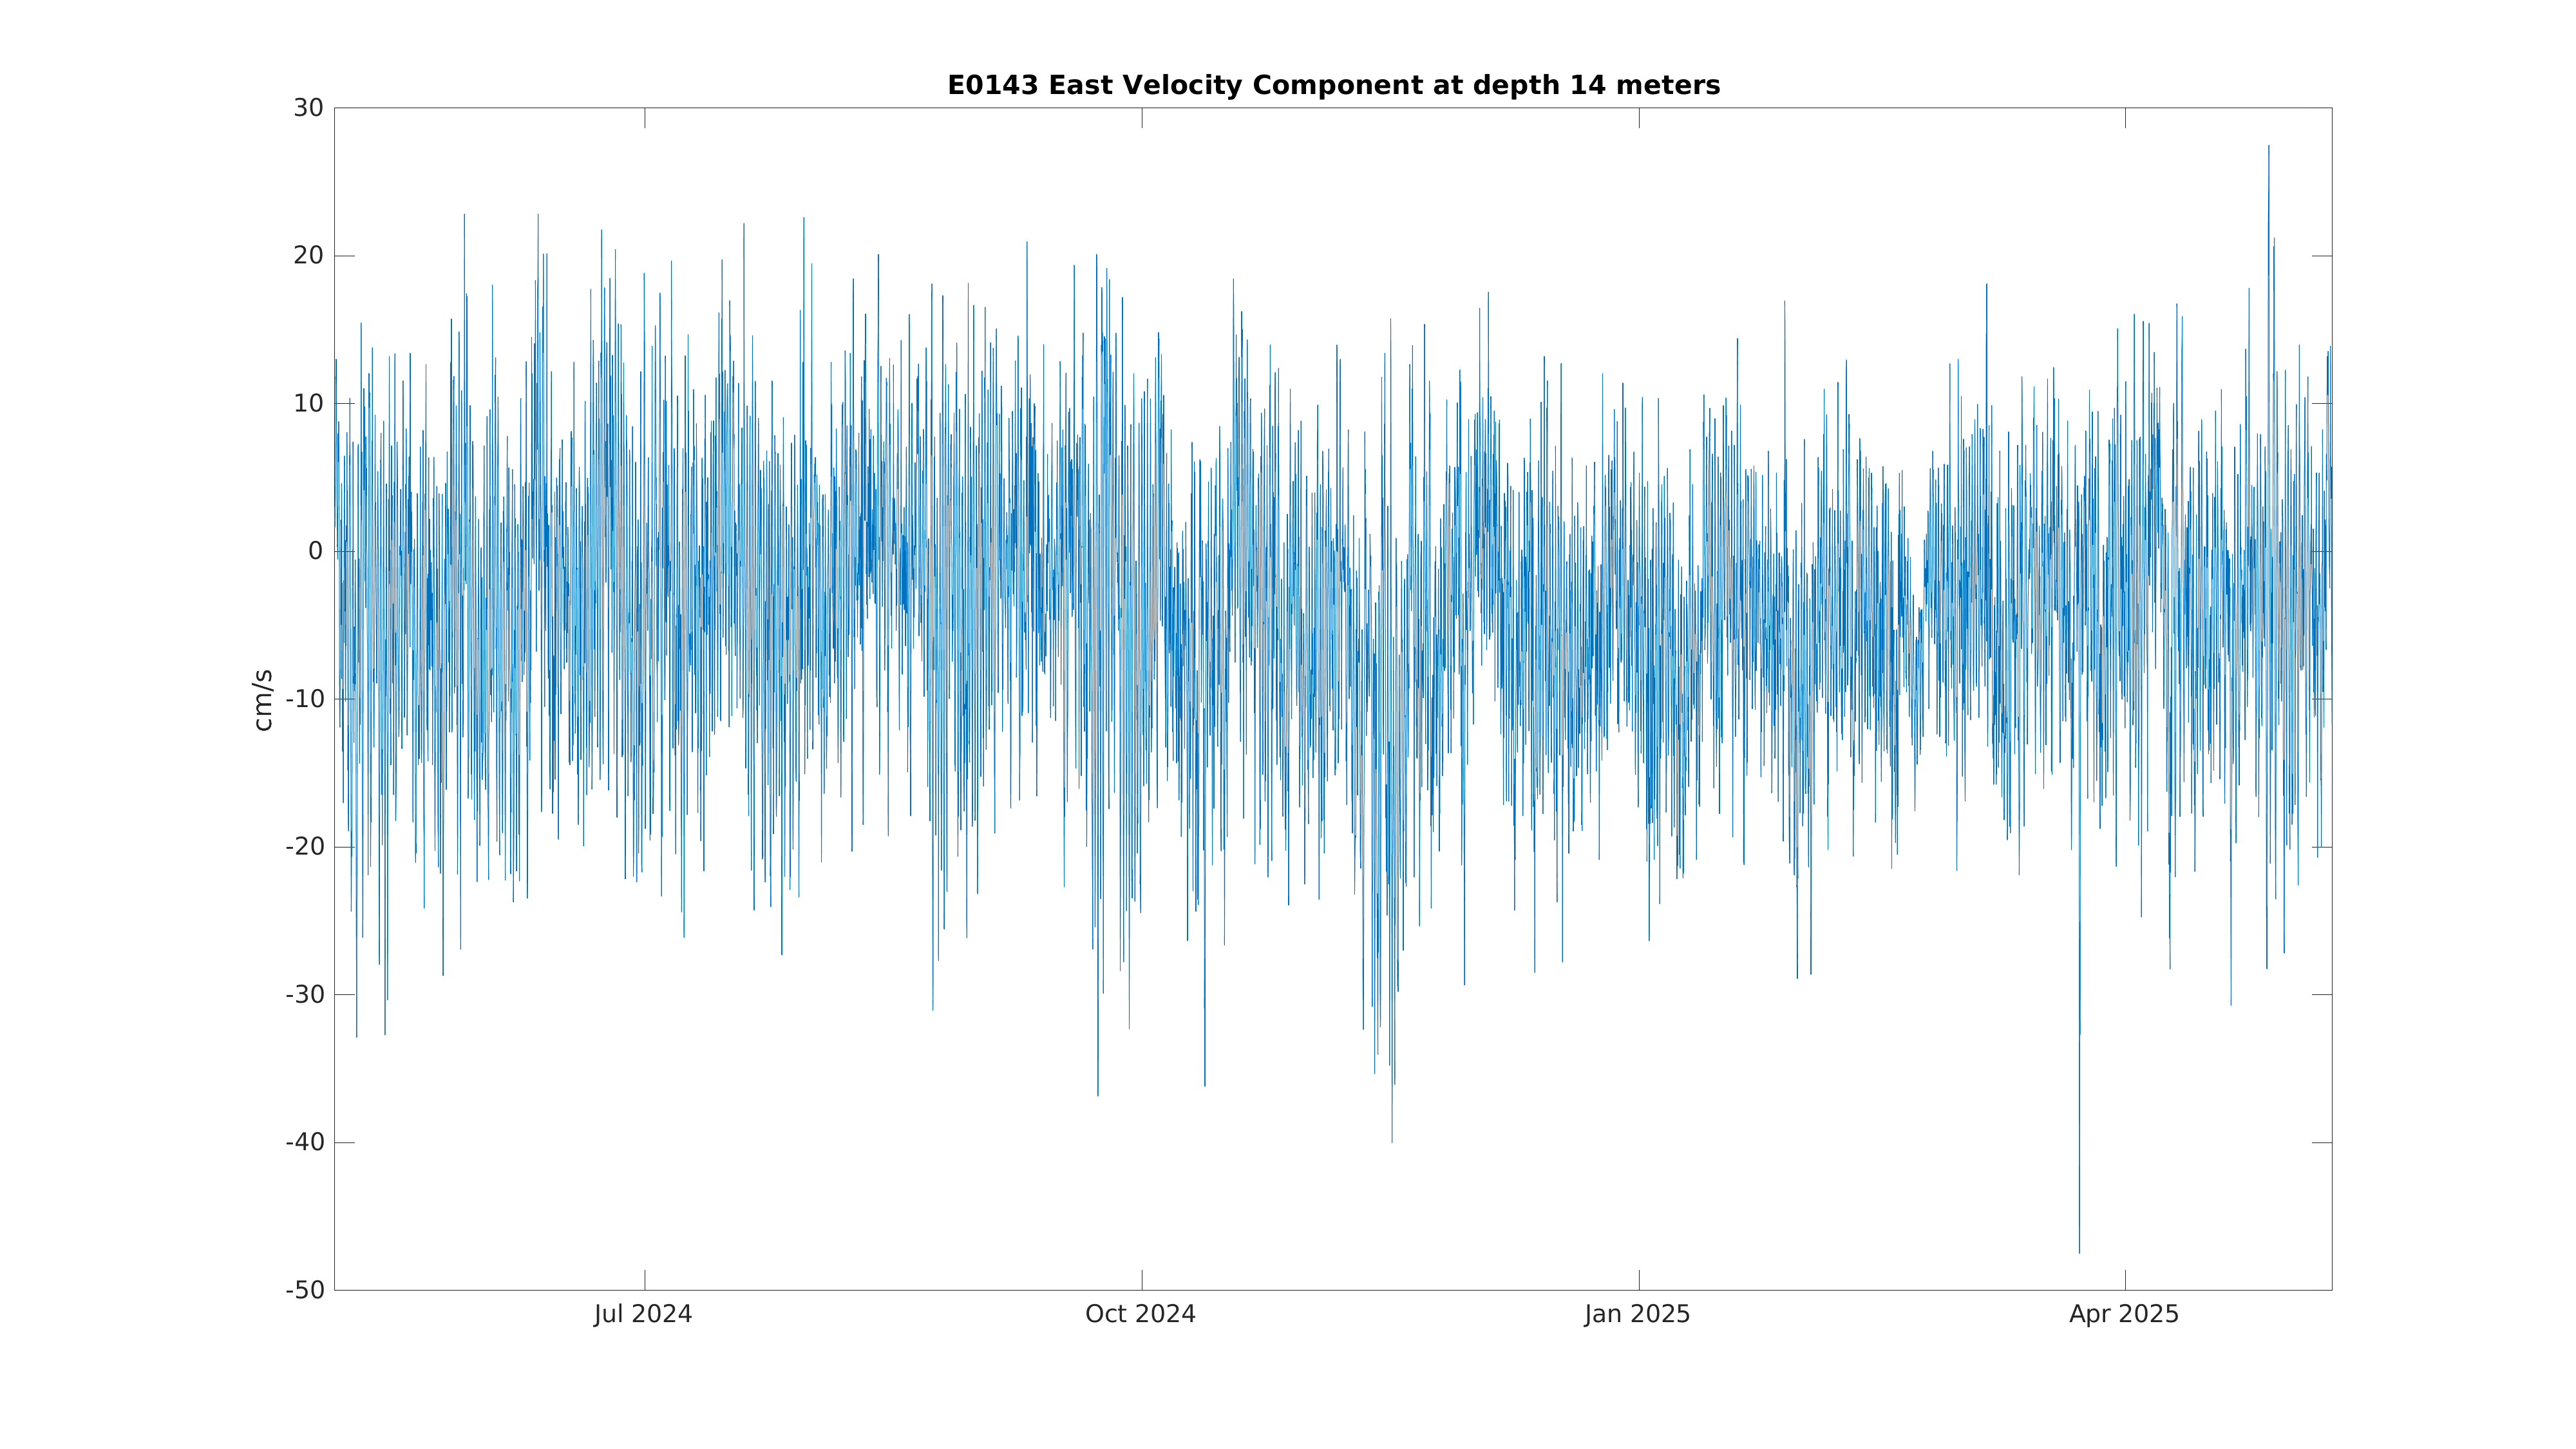
| East Current Velocity (14m) | Sensor Failure | Dec 21 9:00 PM |
|
|
|
|
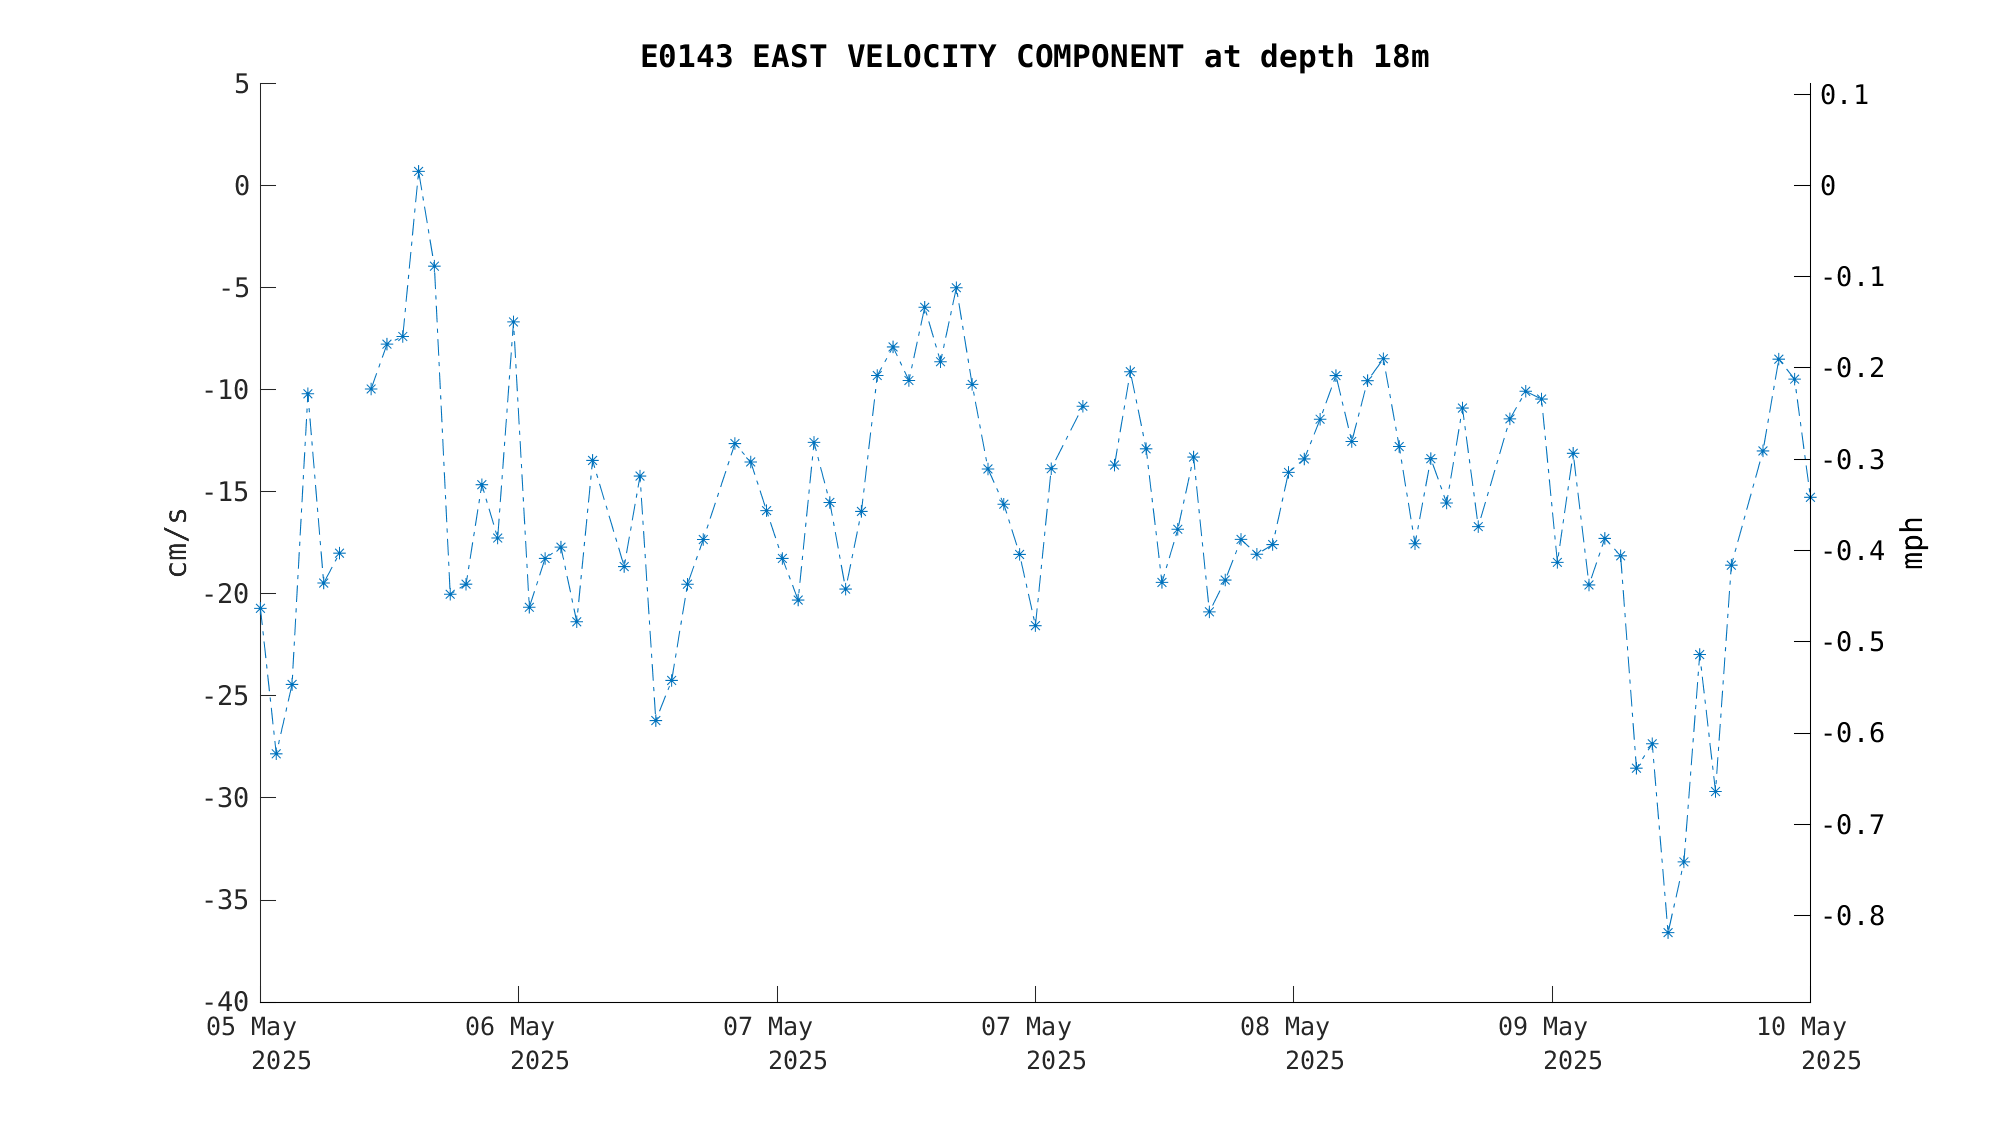
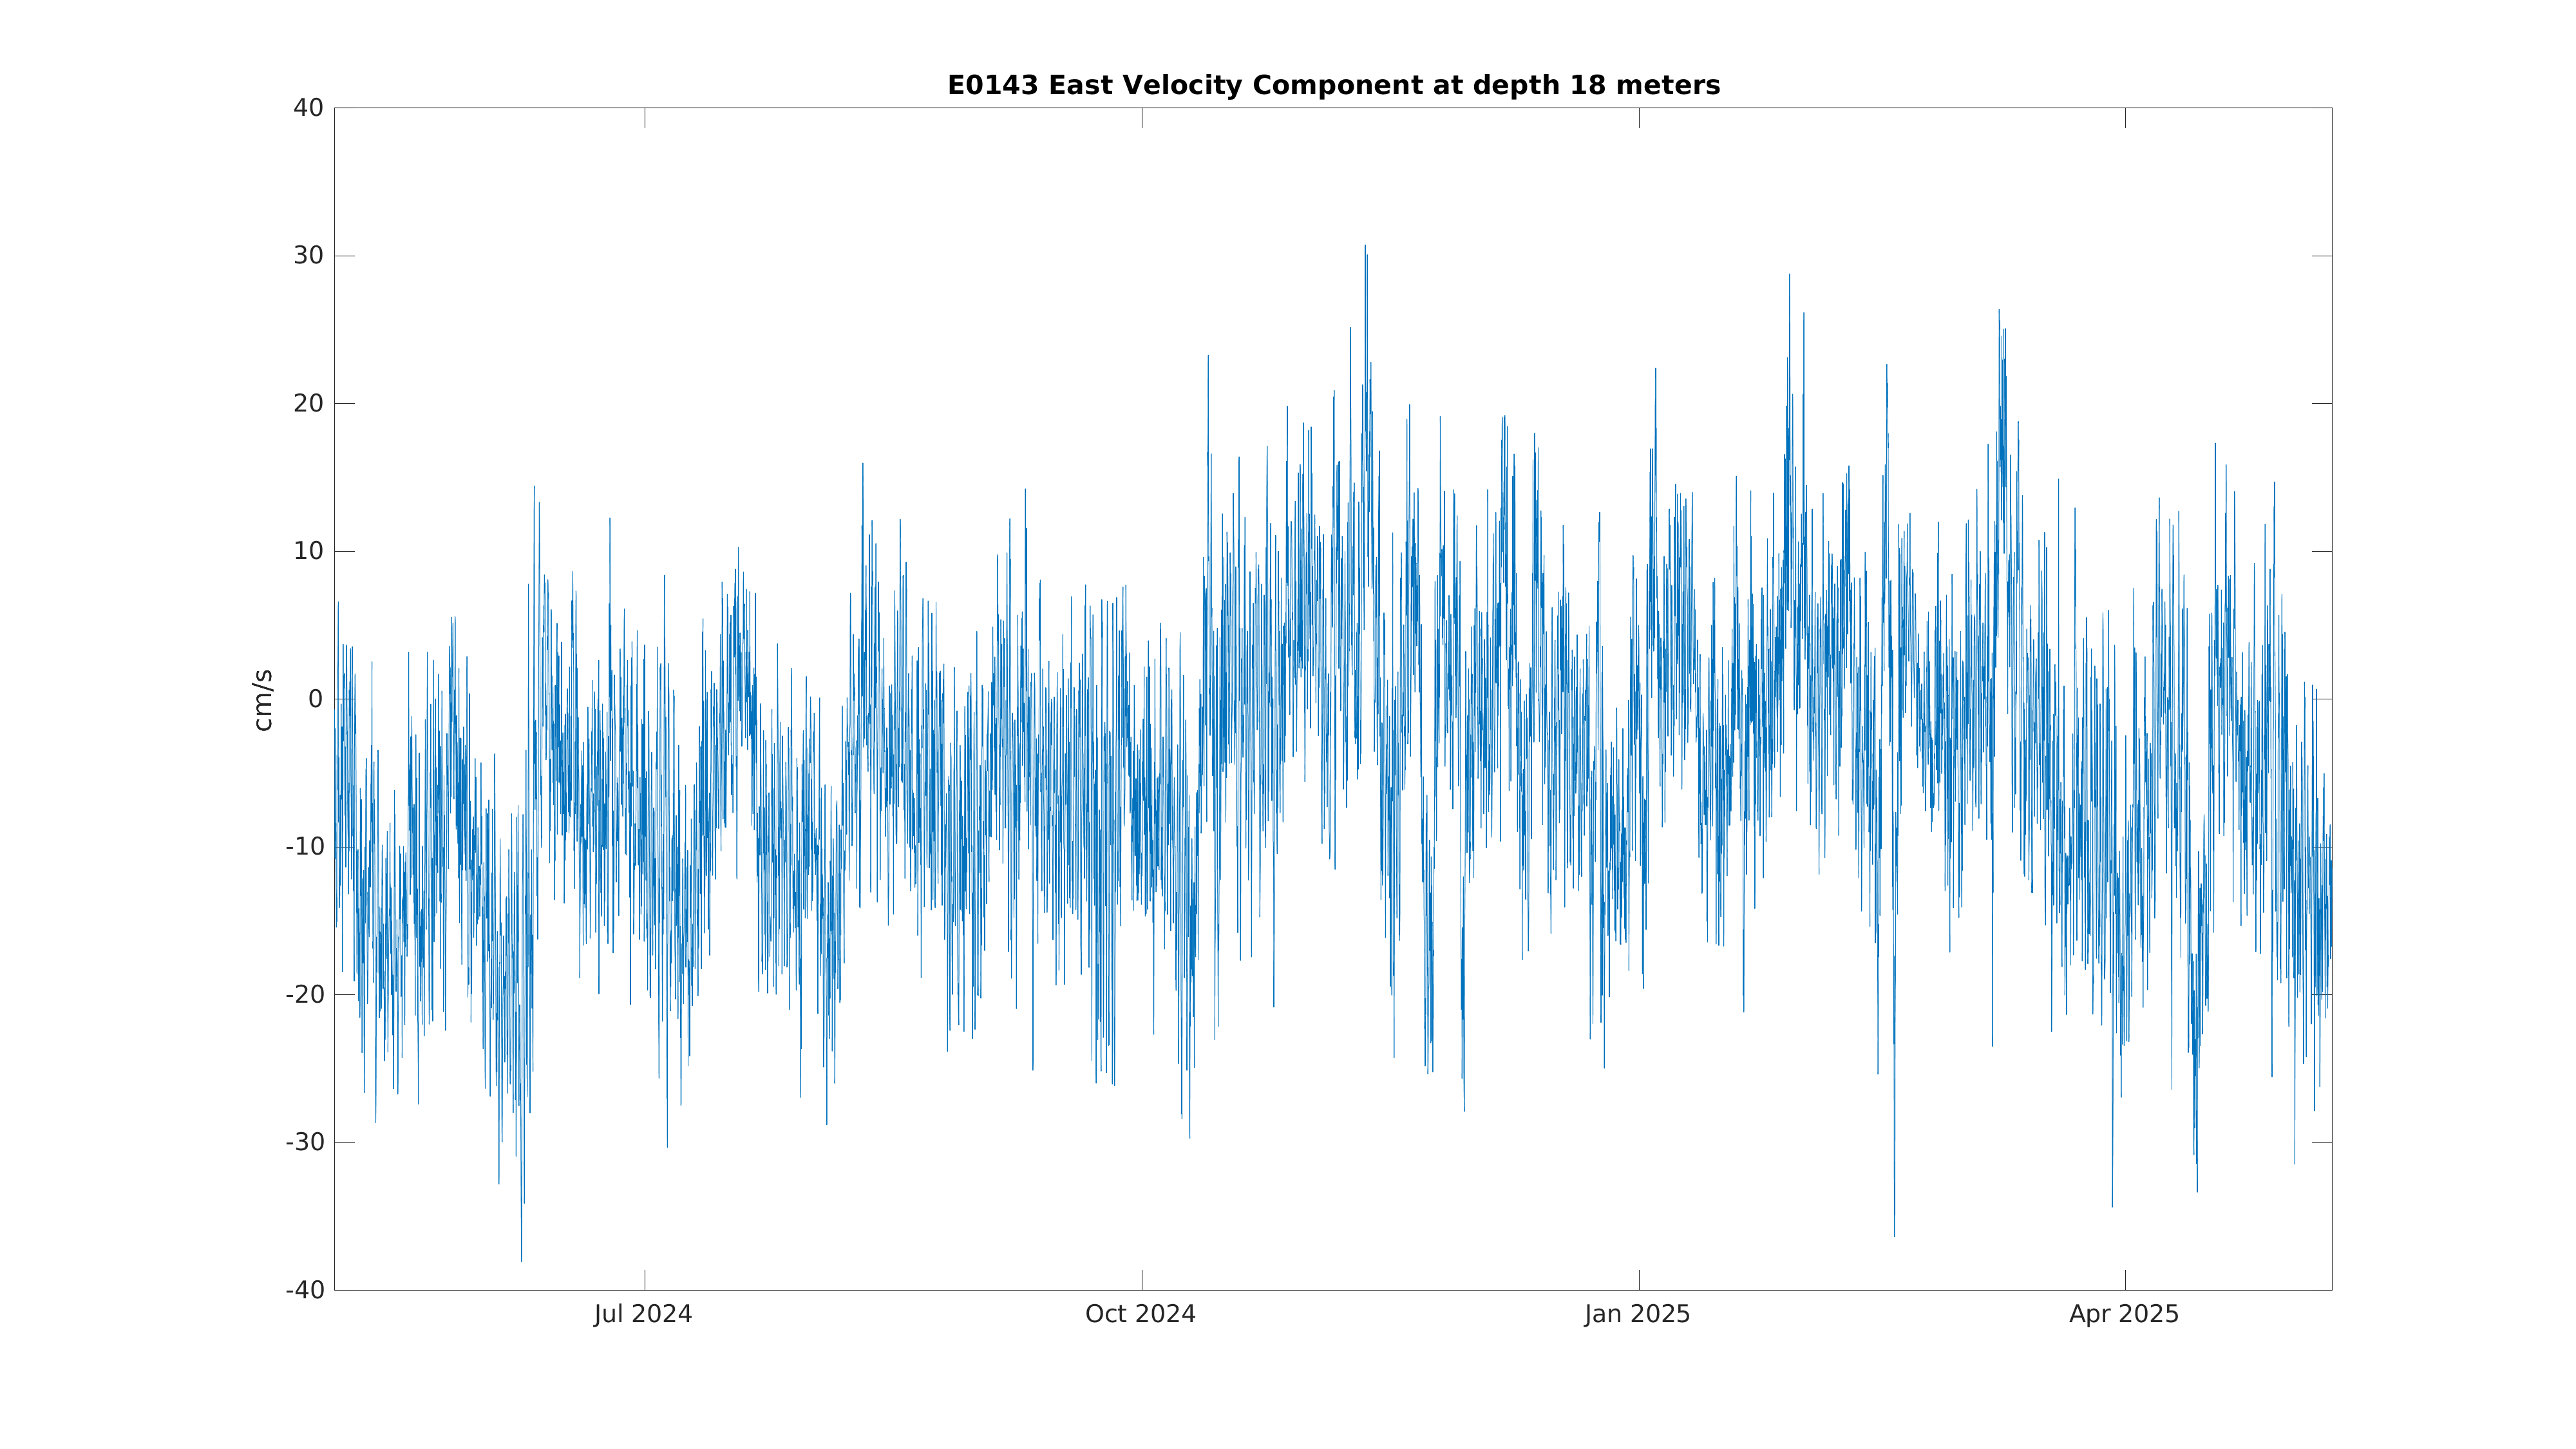
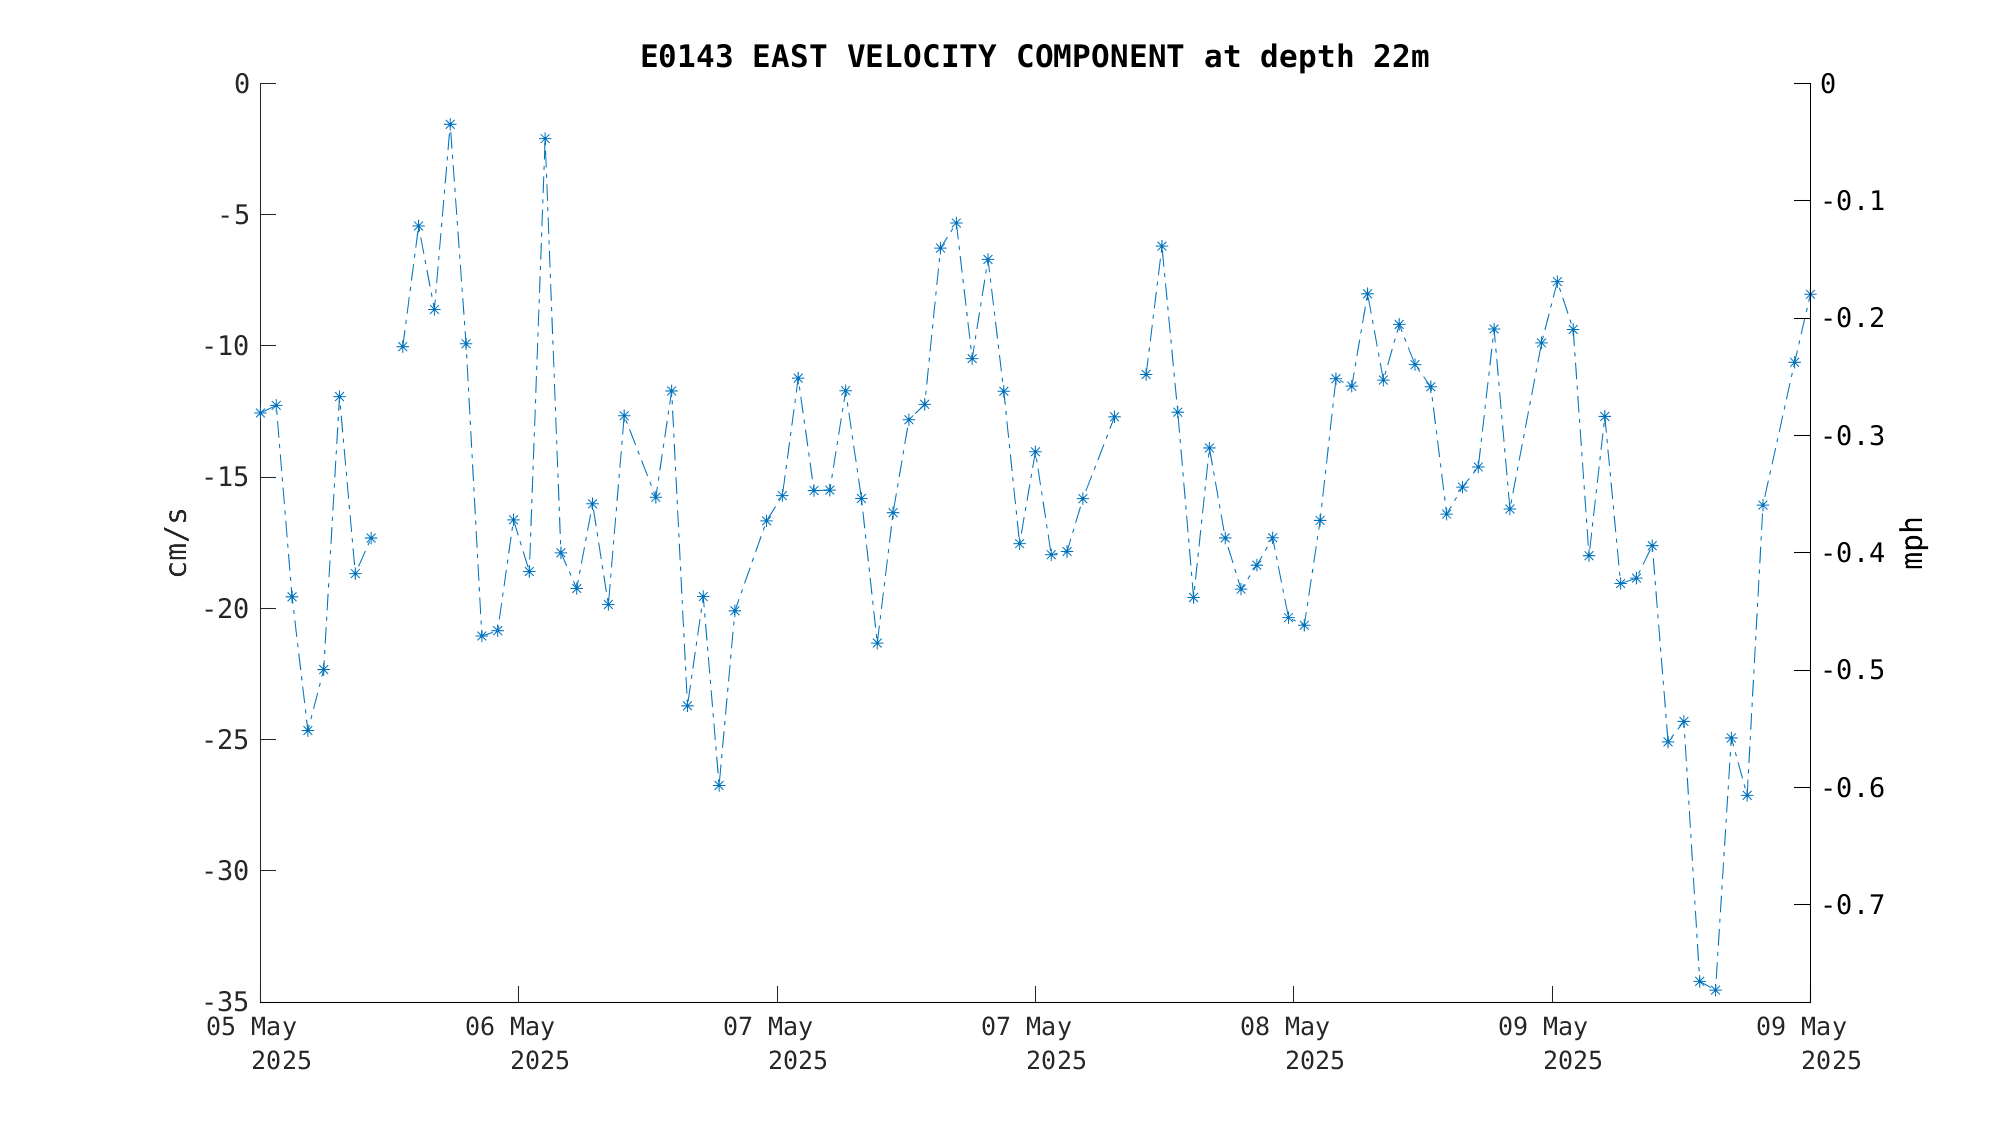
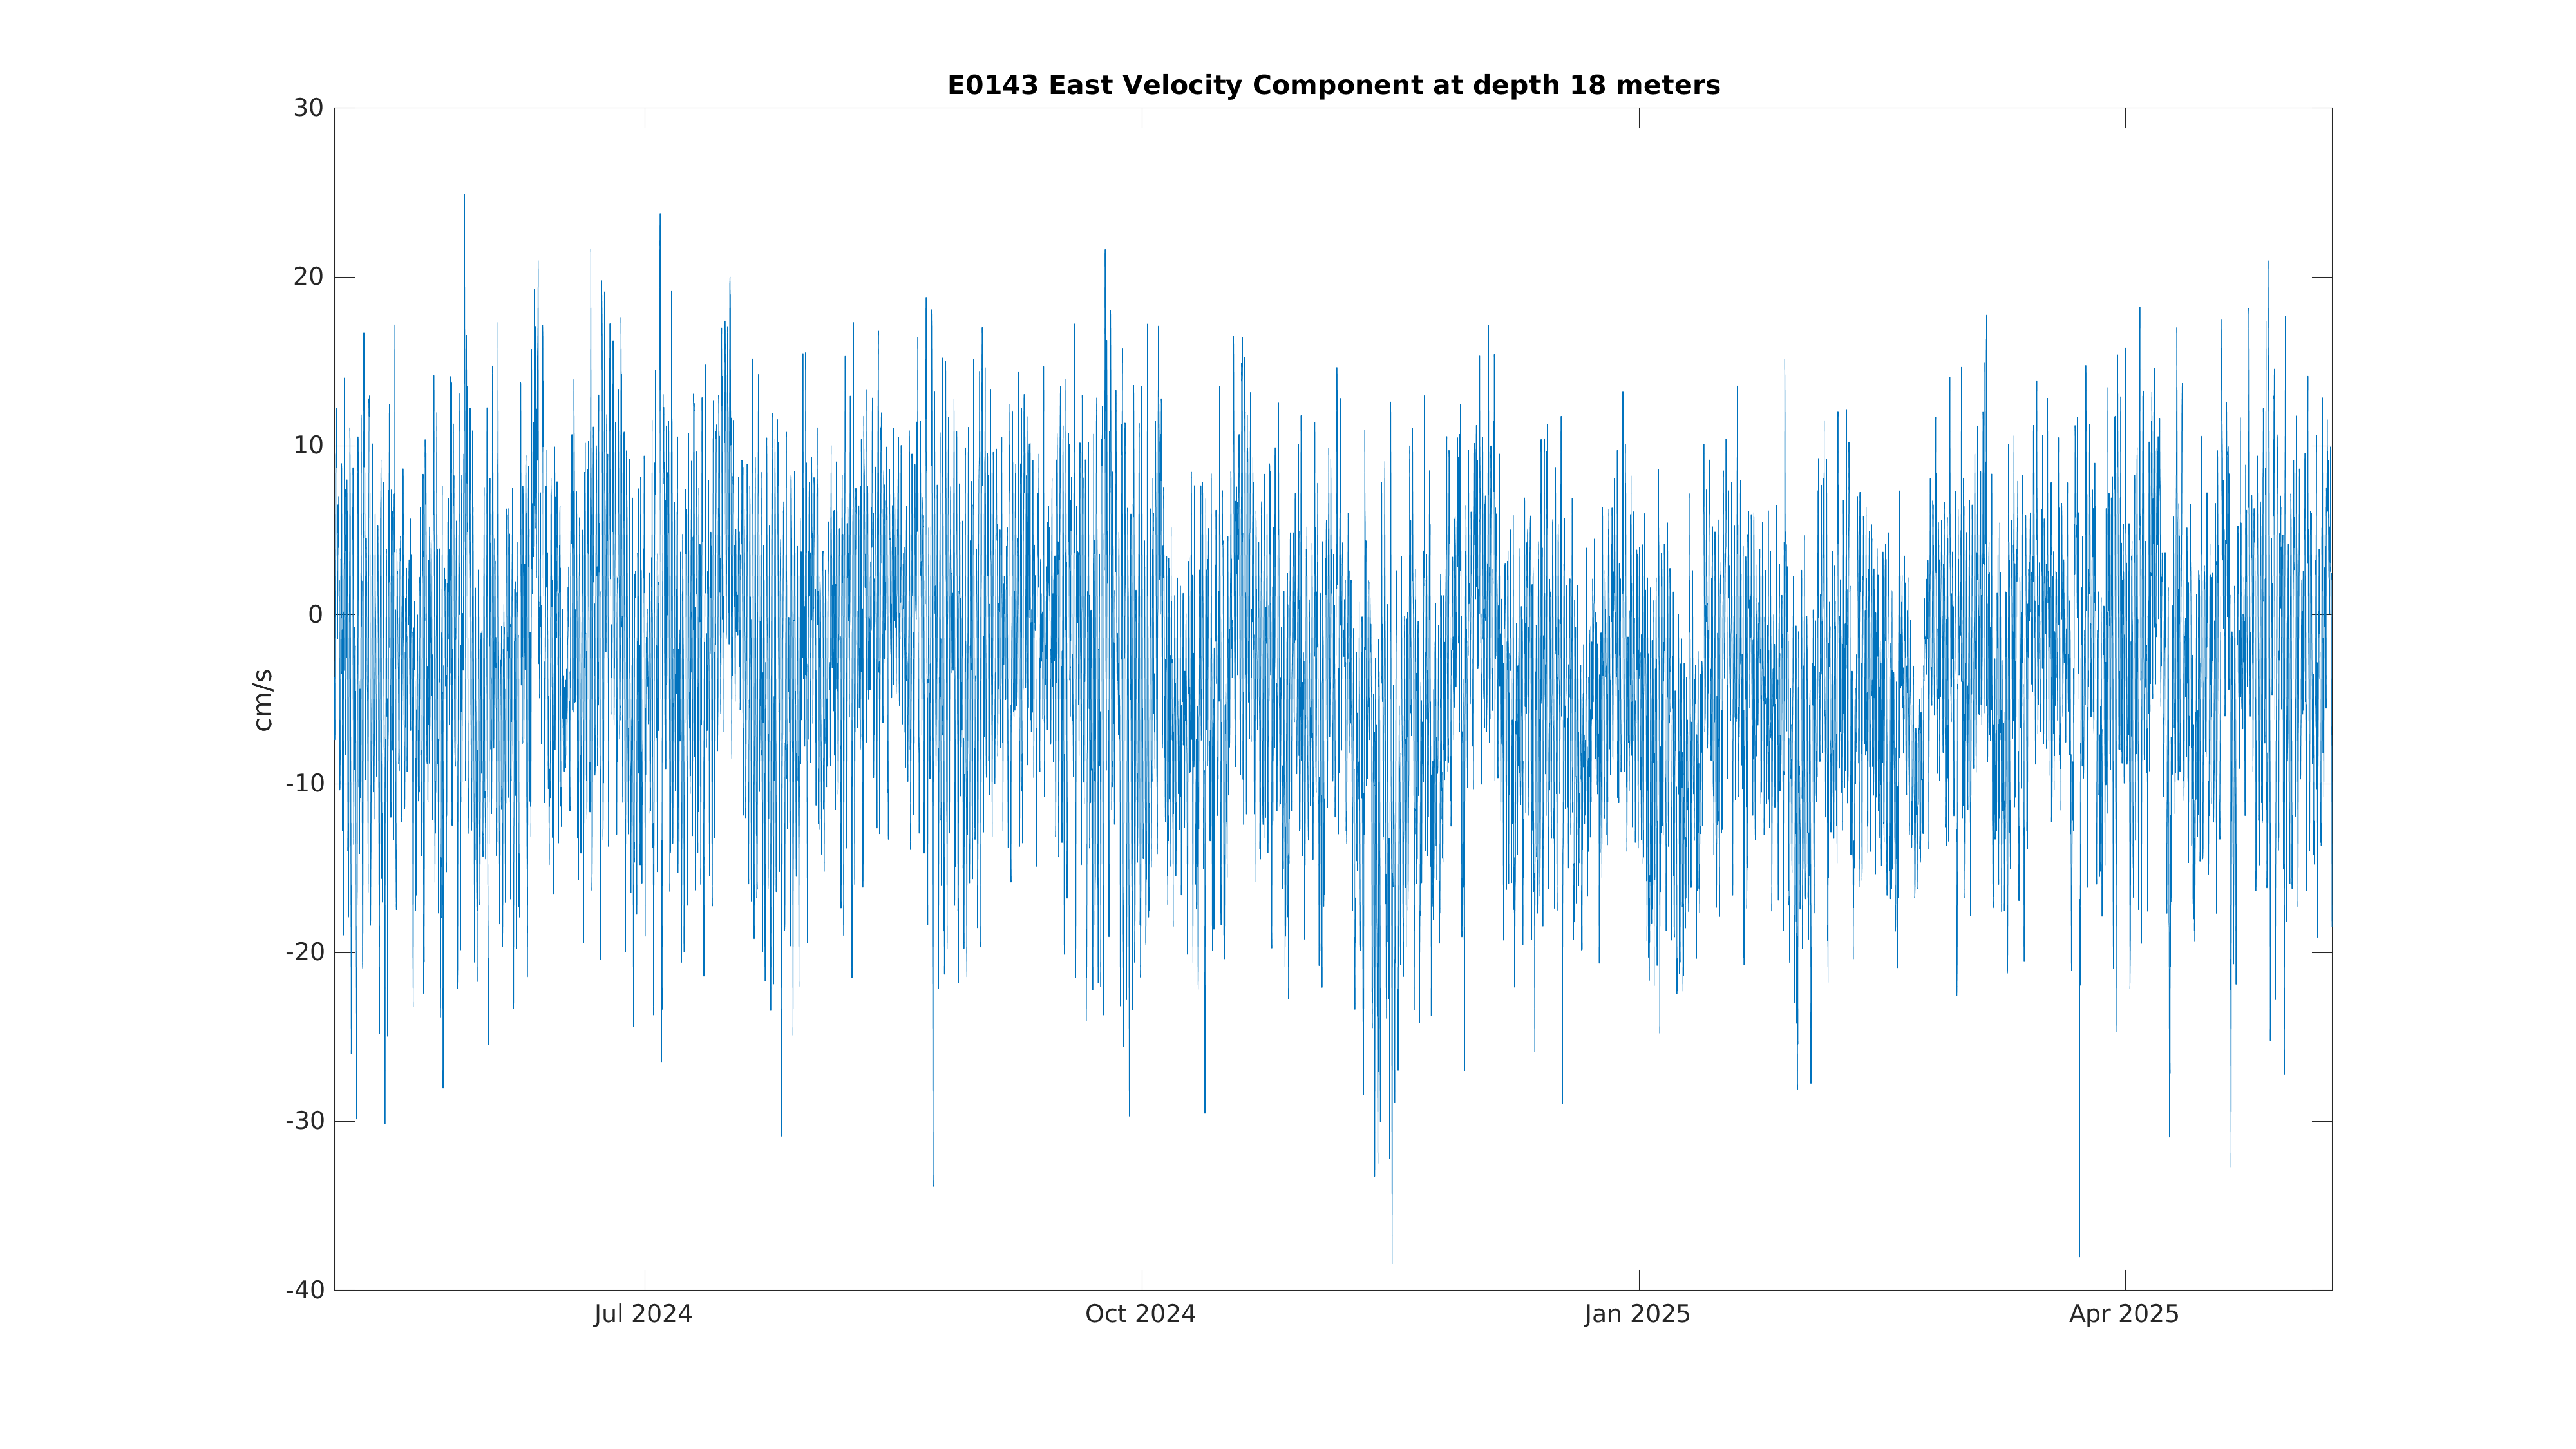
| East Current Velocity (18m) | Sensor Failure | Dec 21 9:00 PM |
|
|
|
|
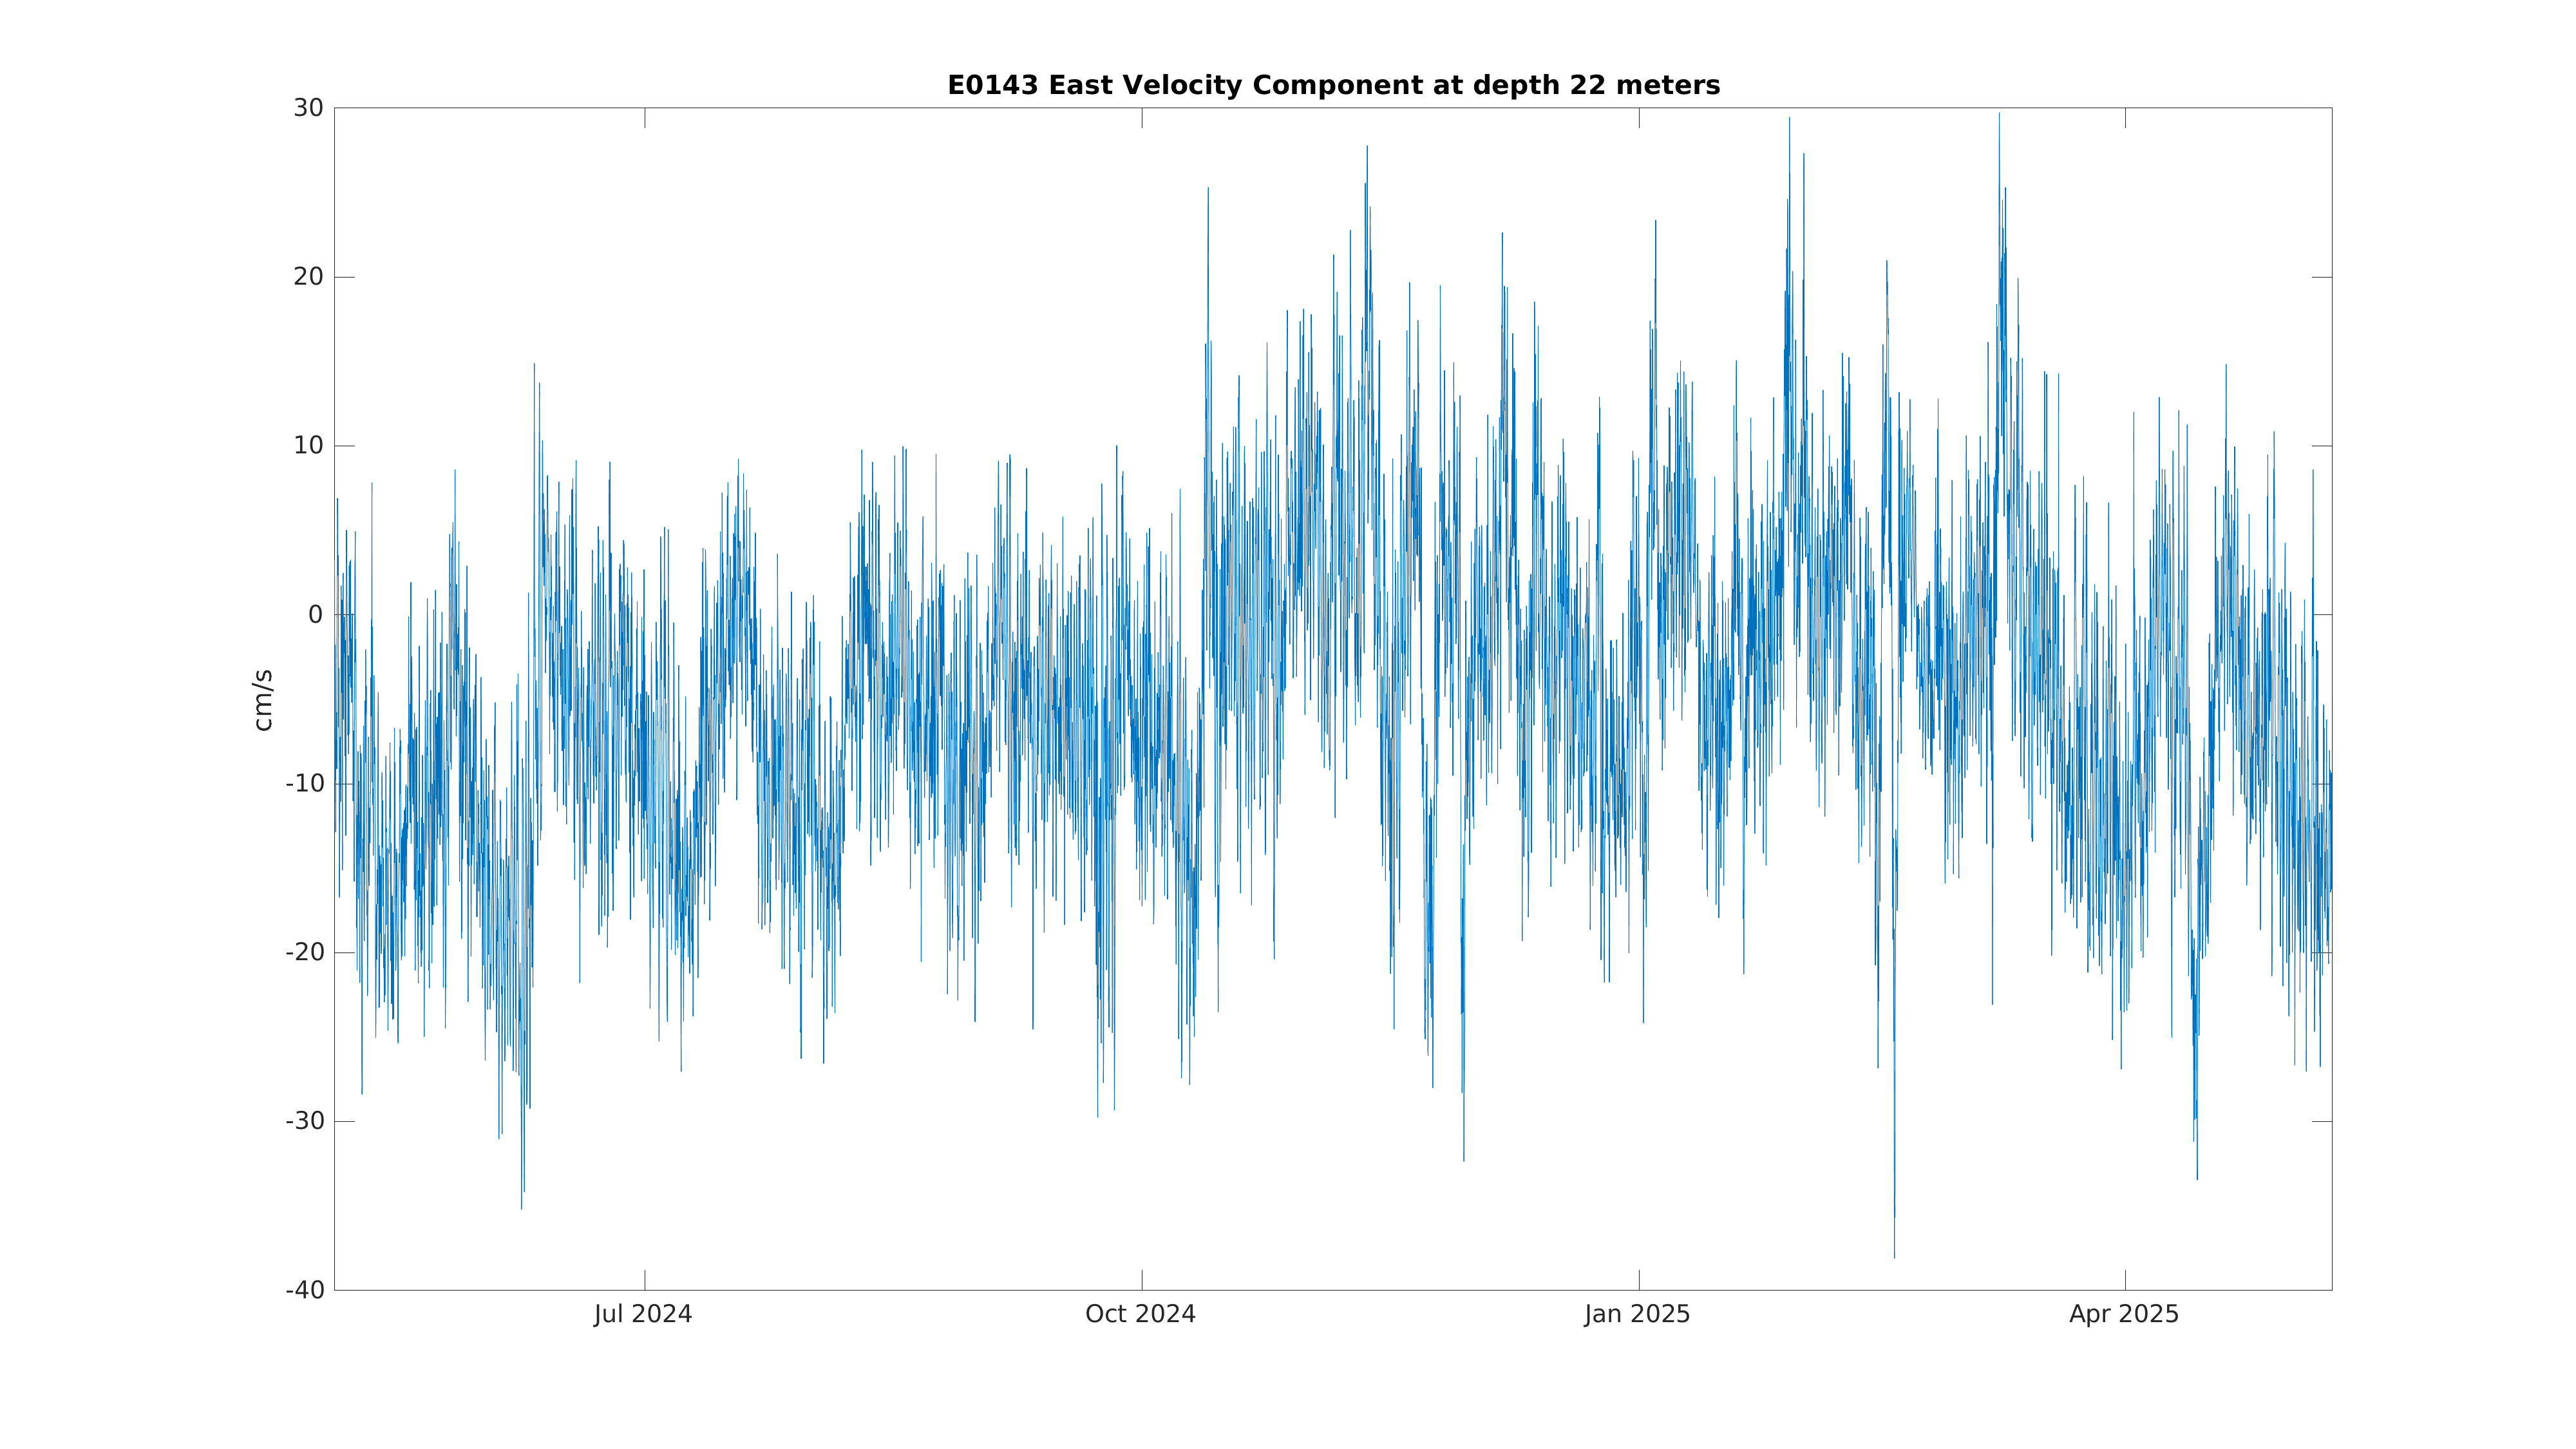
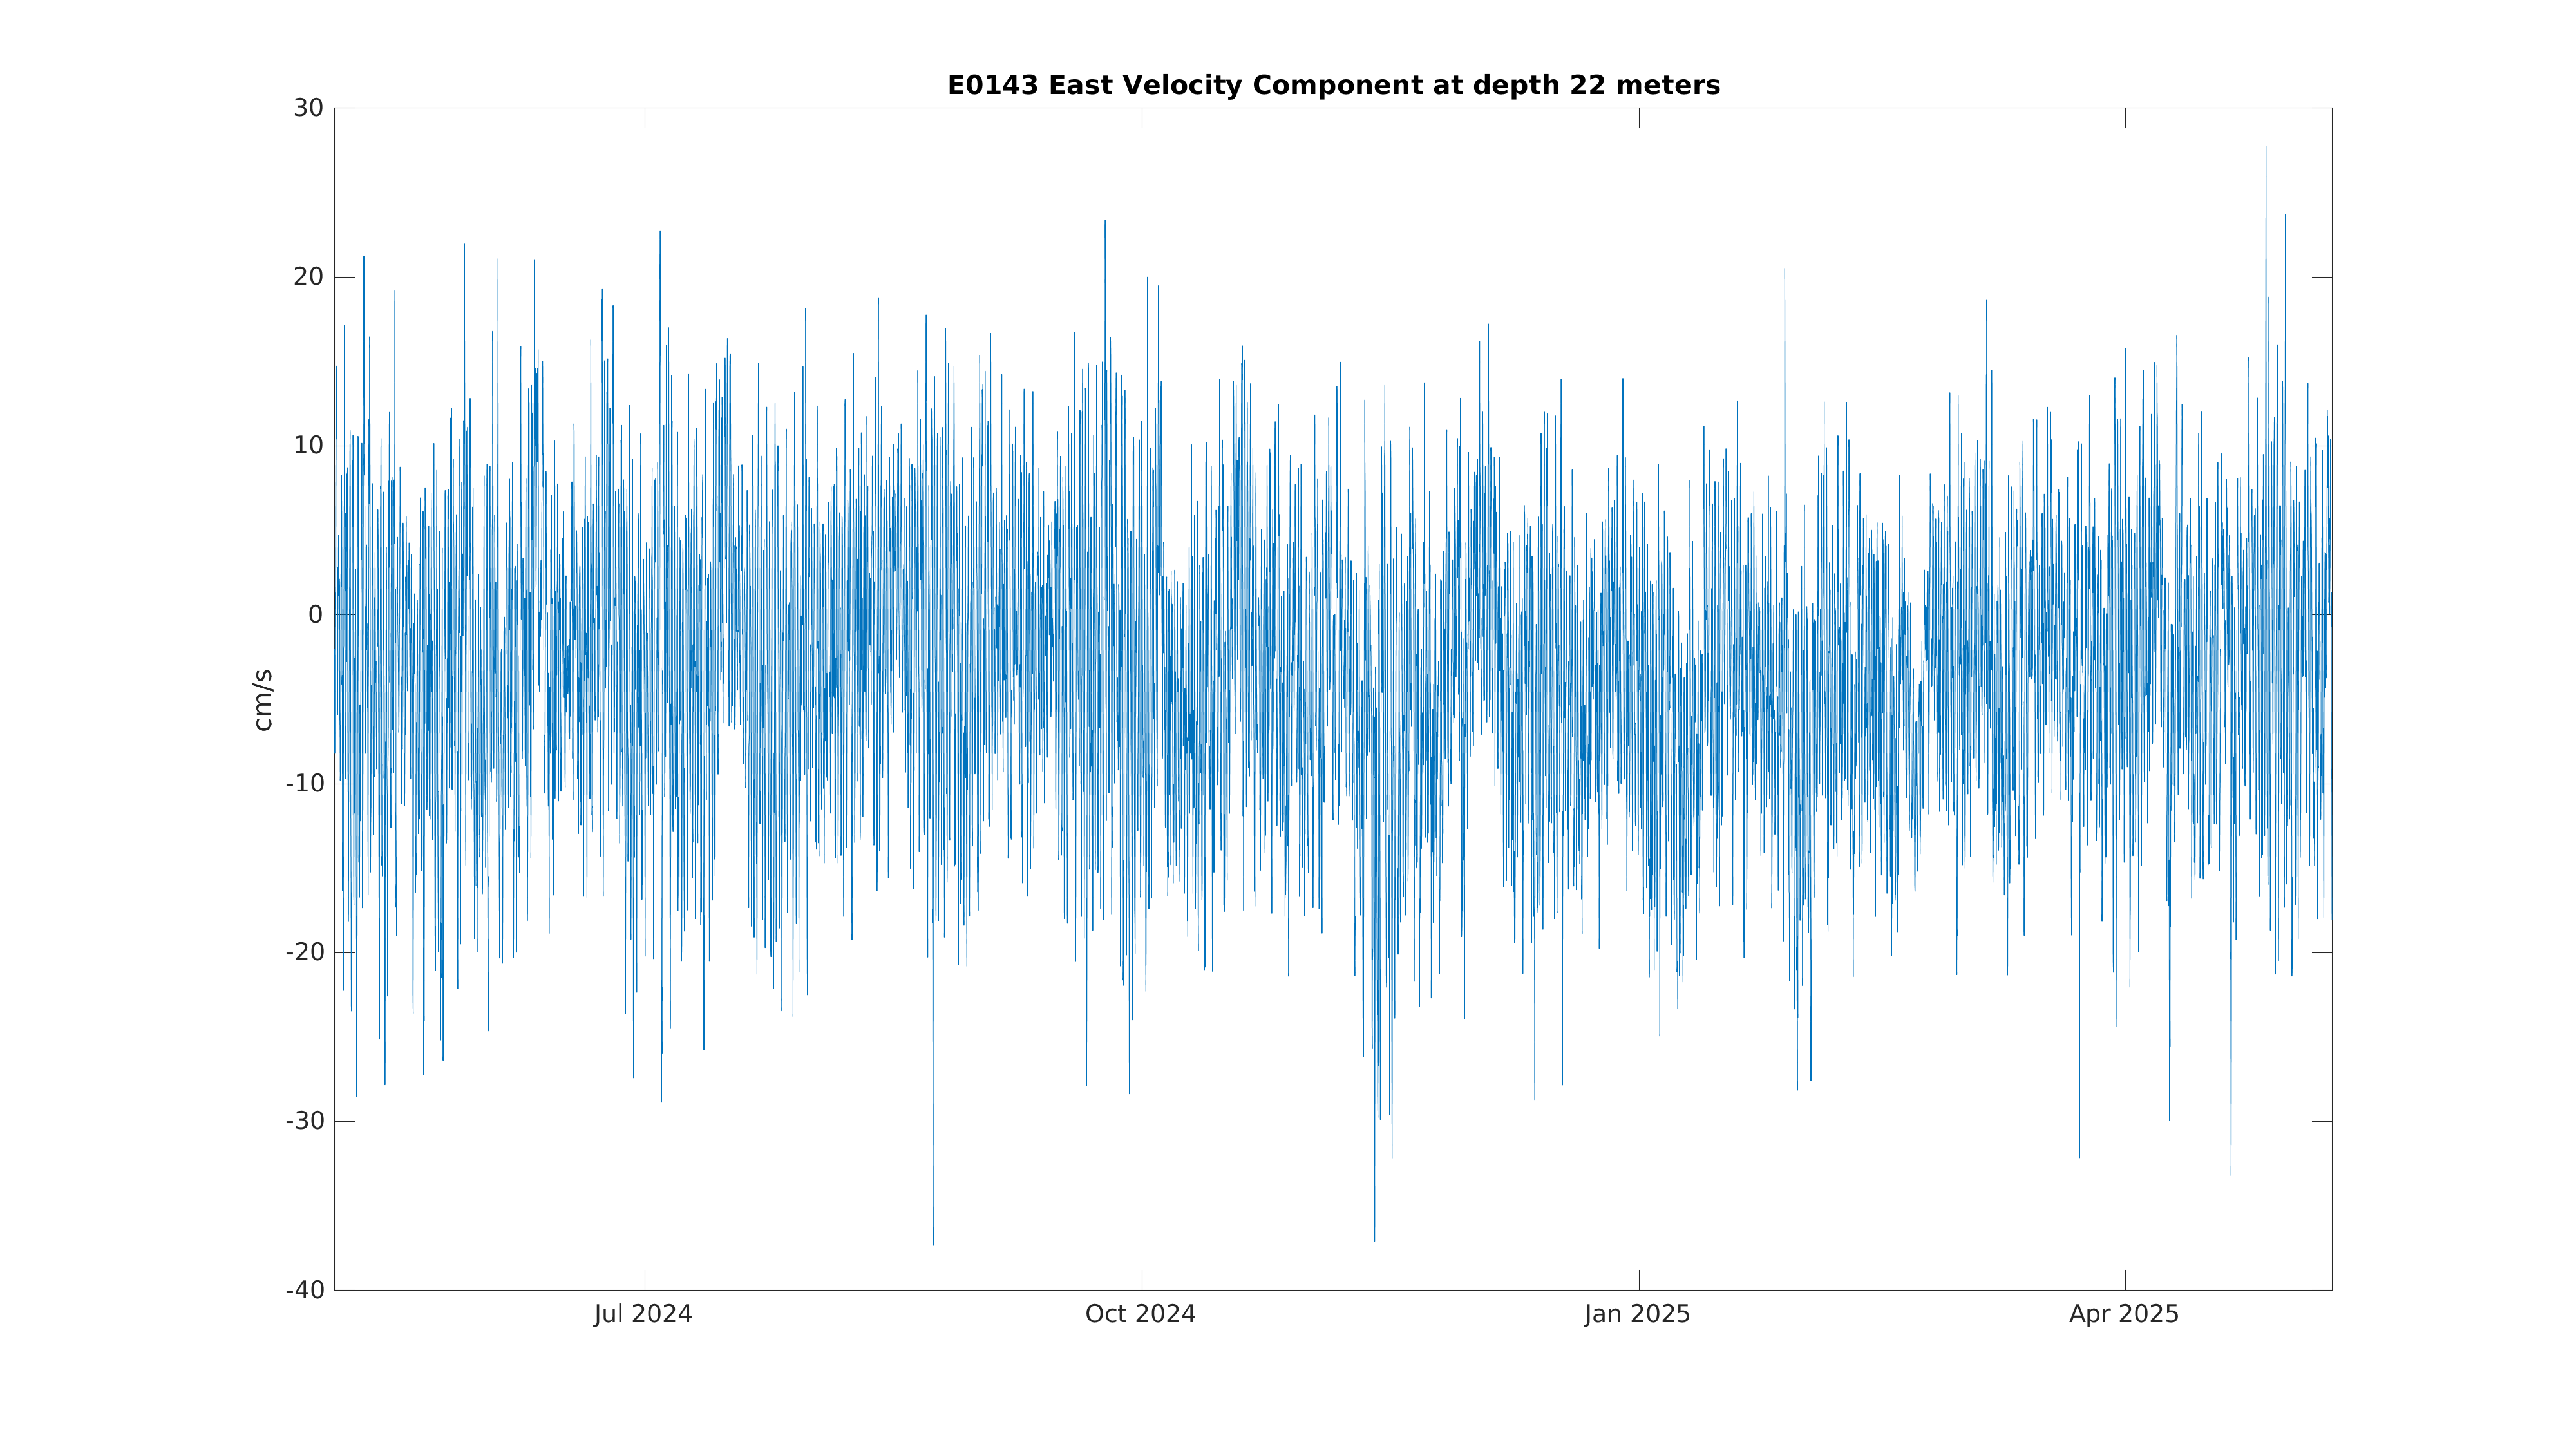
| East Current Velocity (22m) | Sensor Failure | Dec 21 9:00 PM |
|
|
|
|
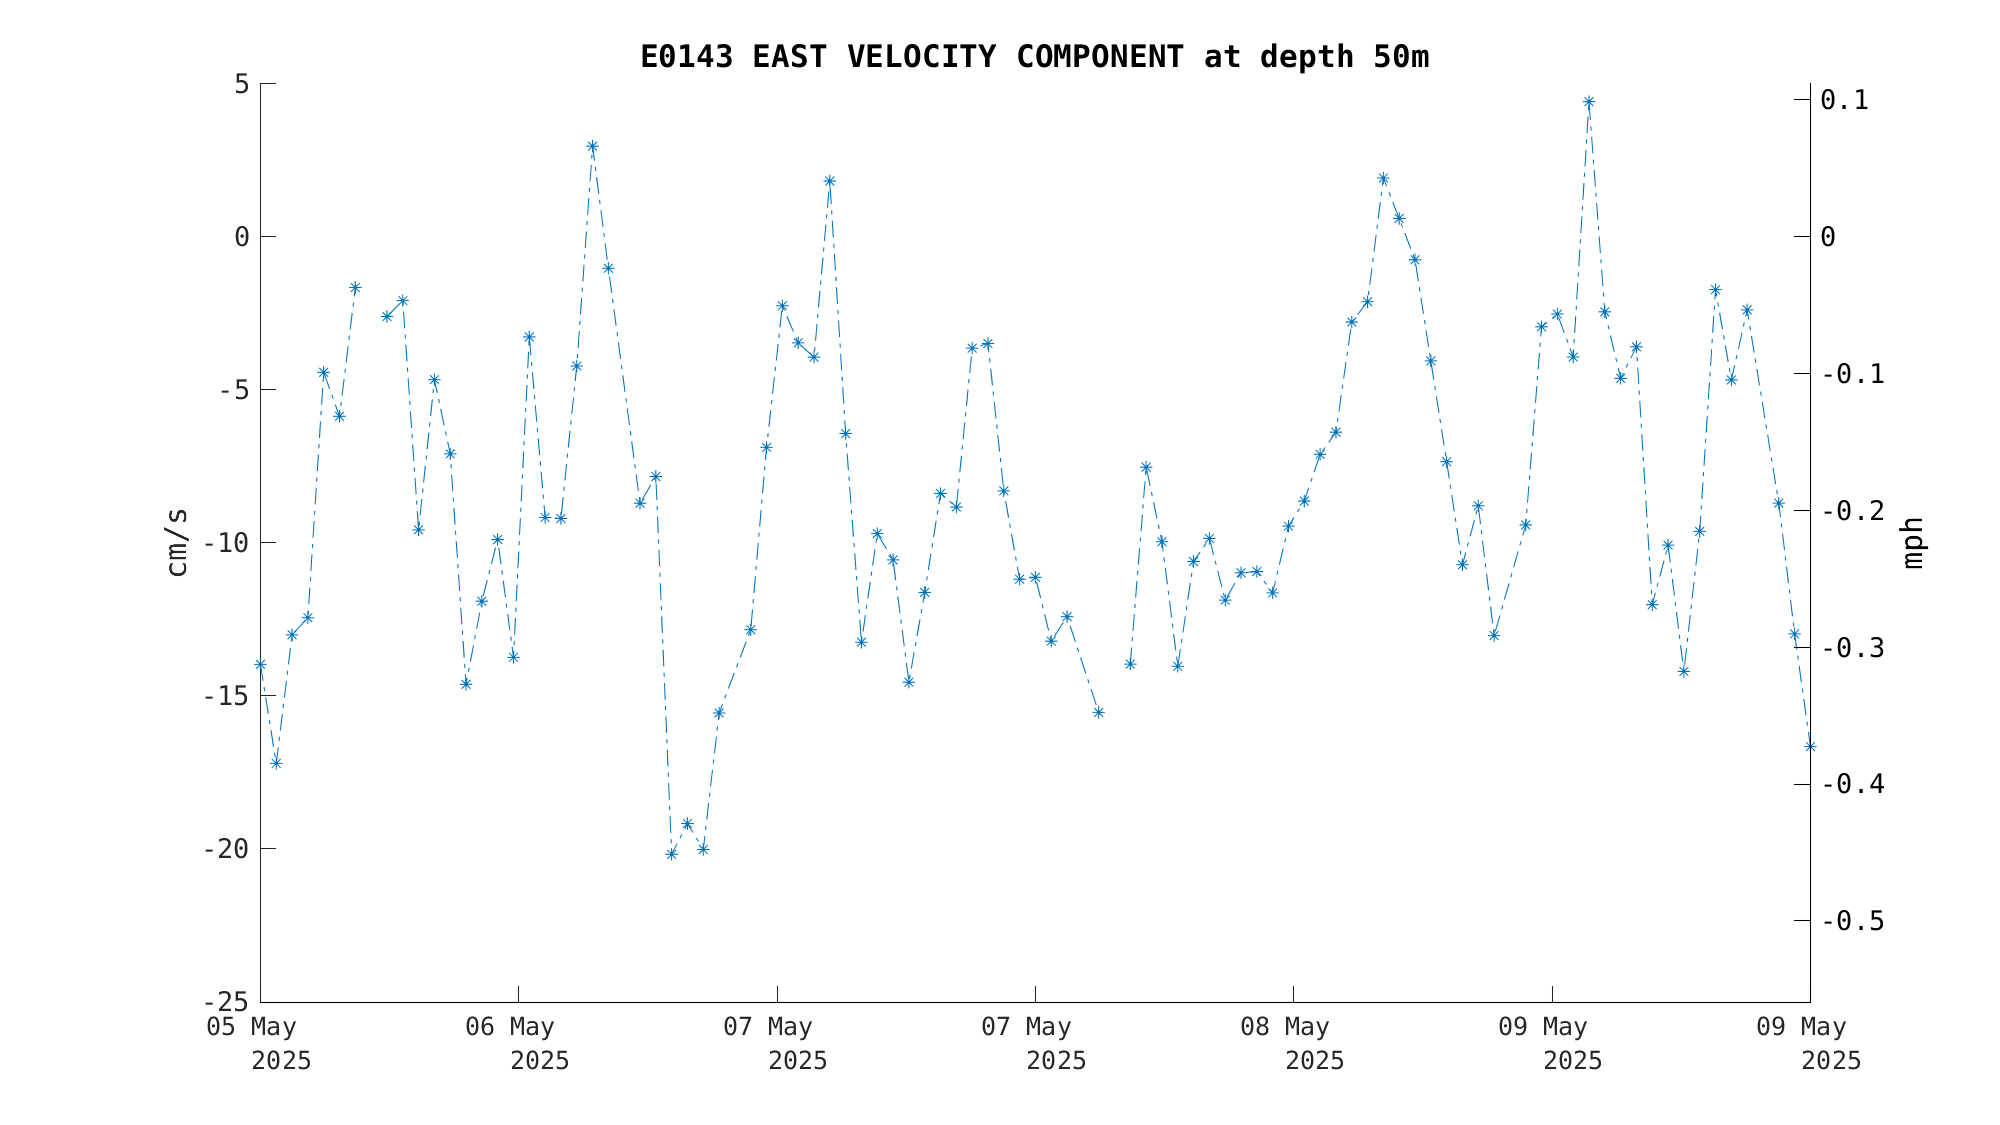
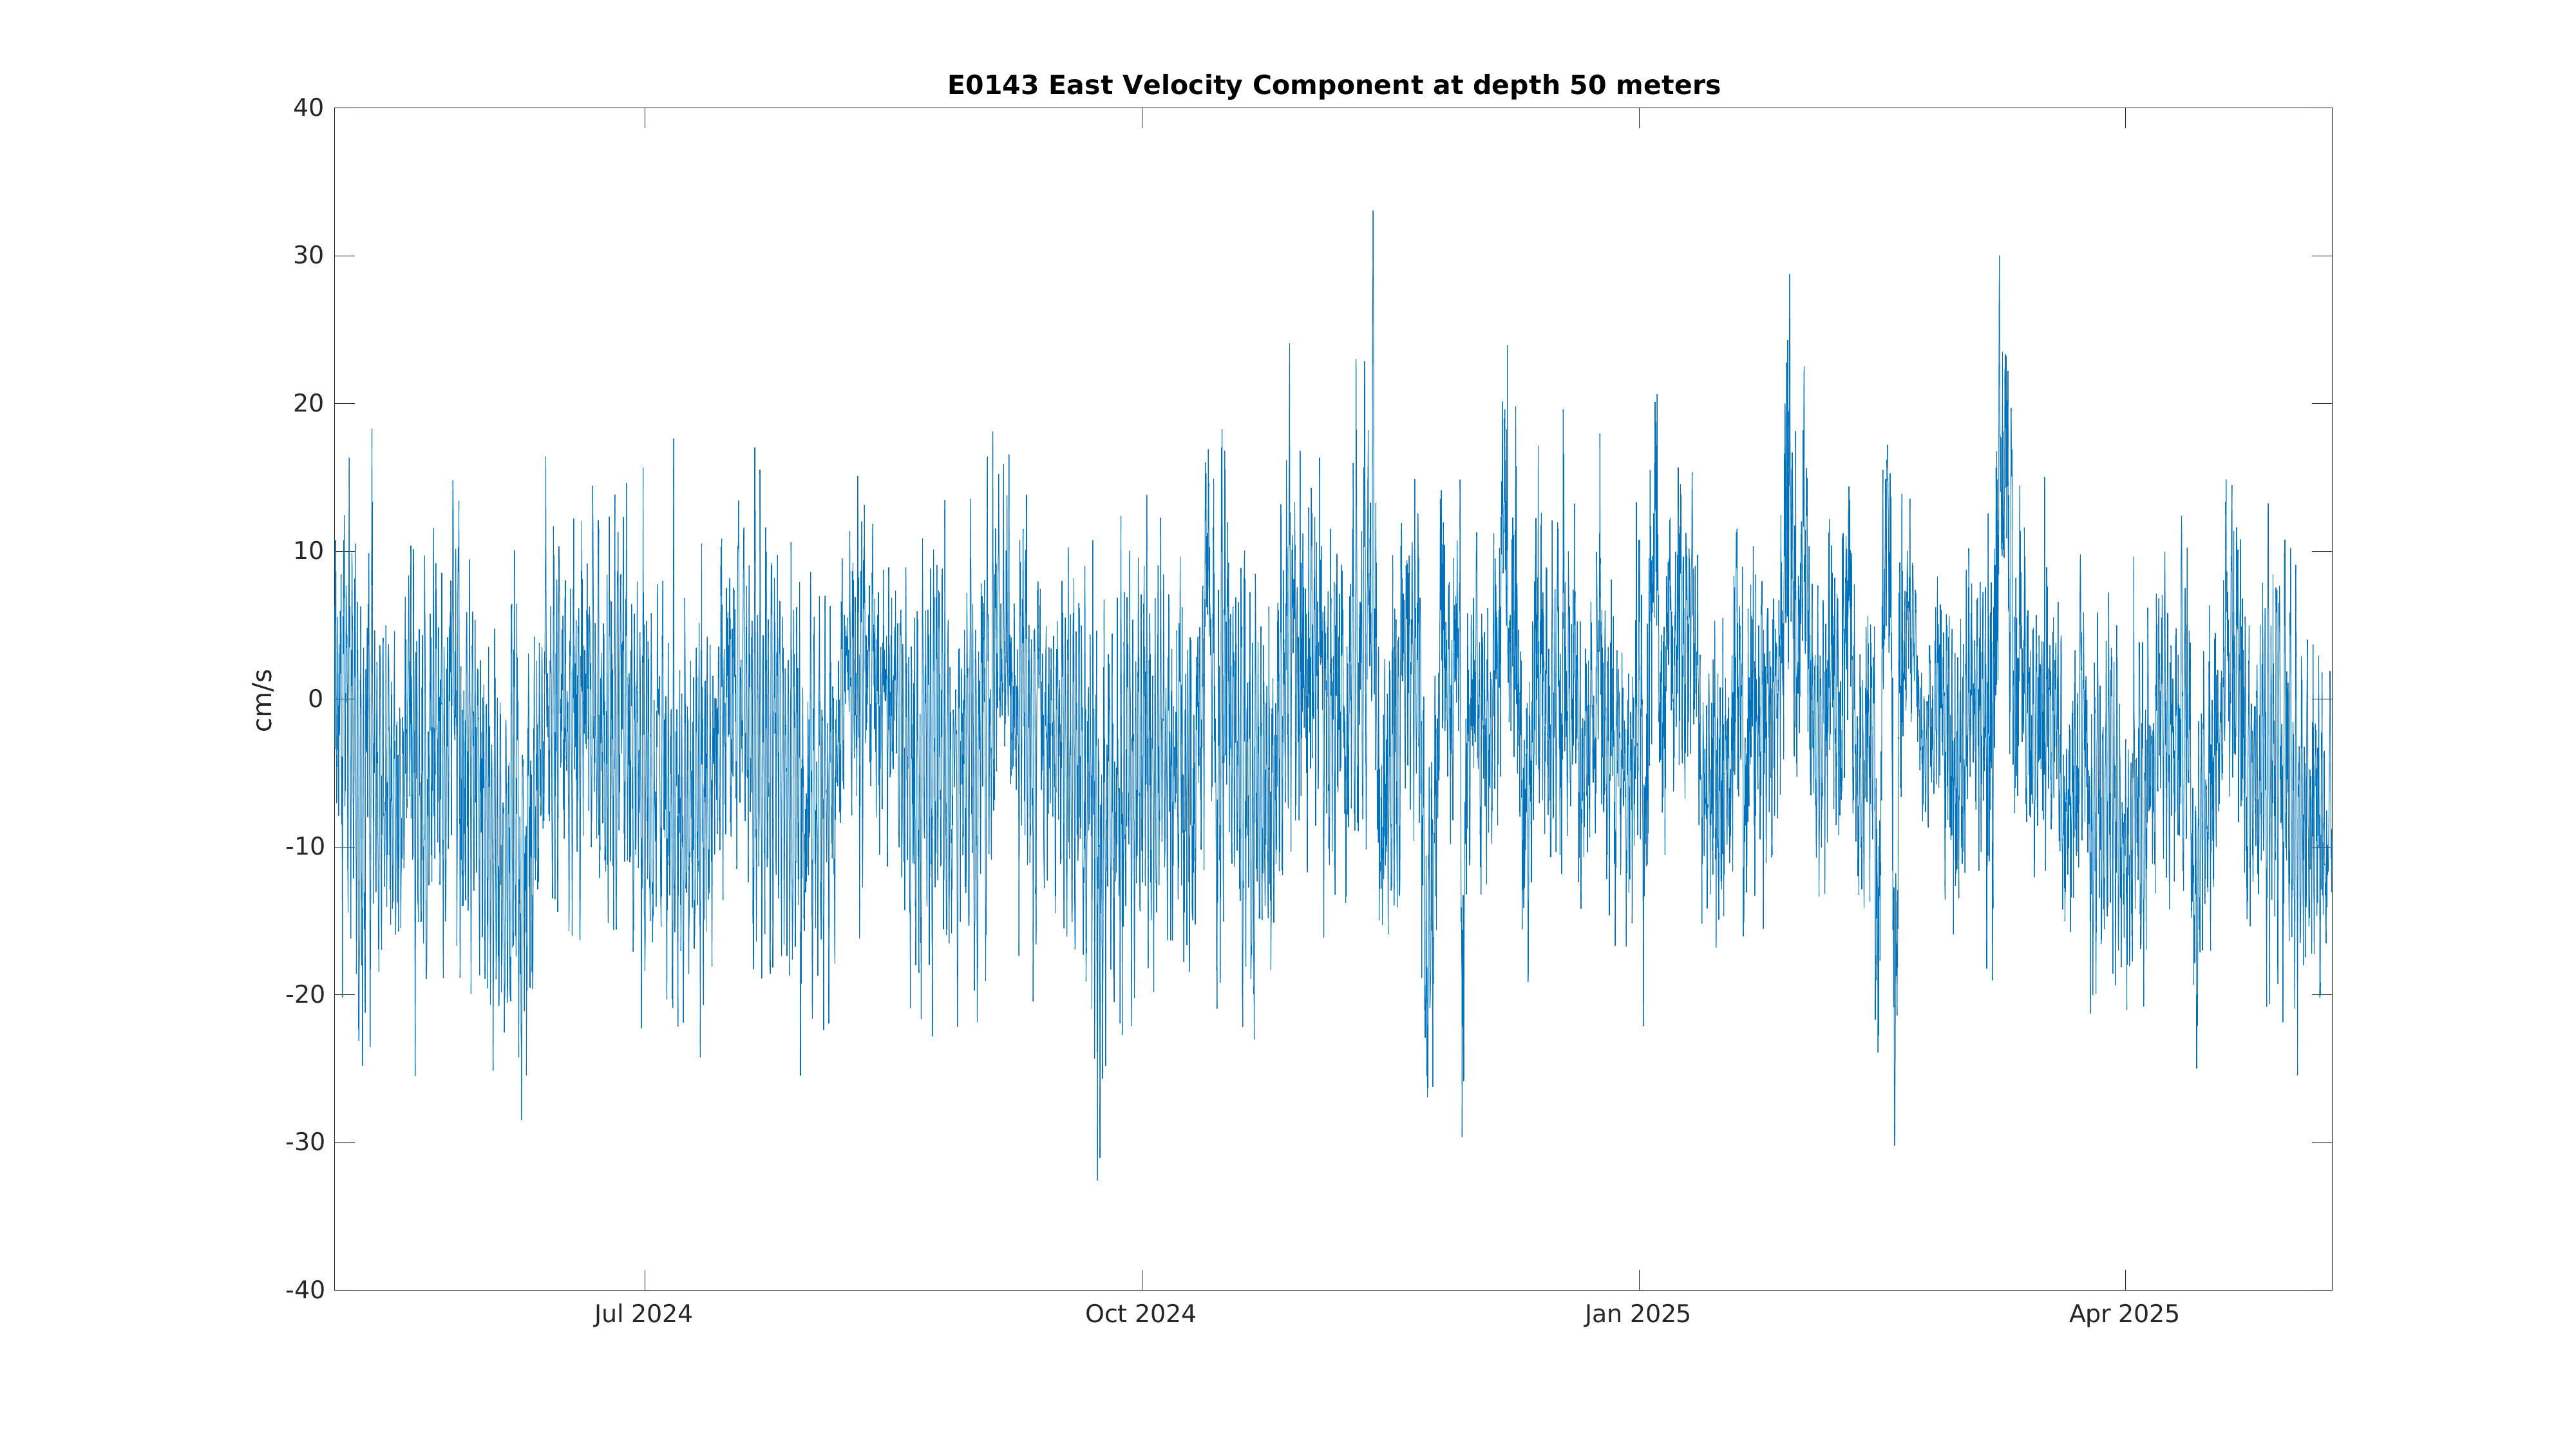
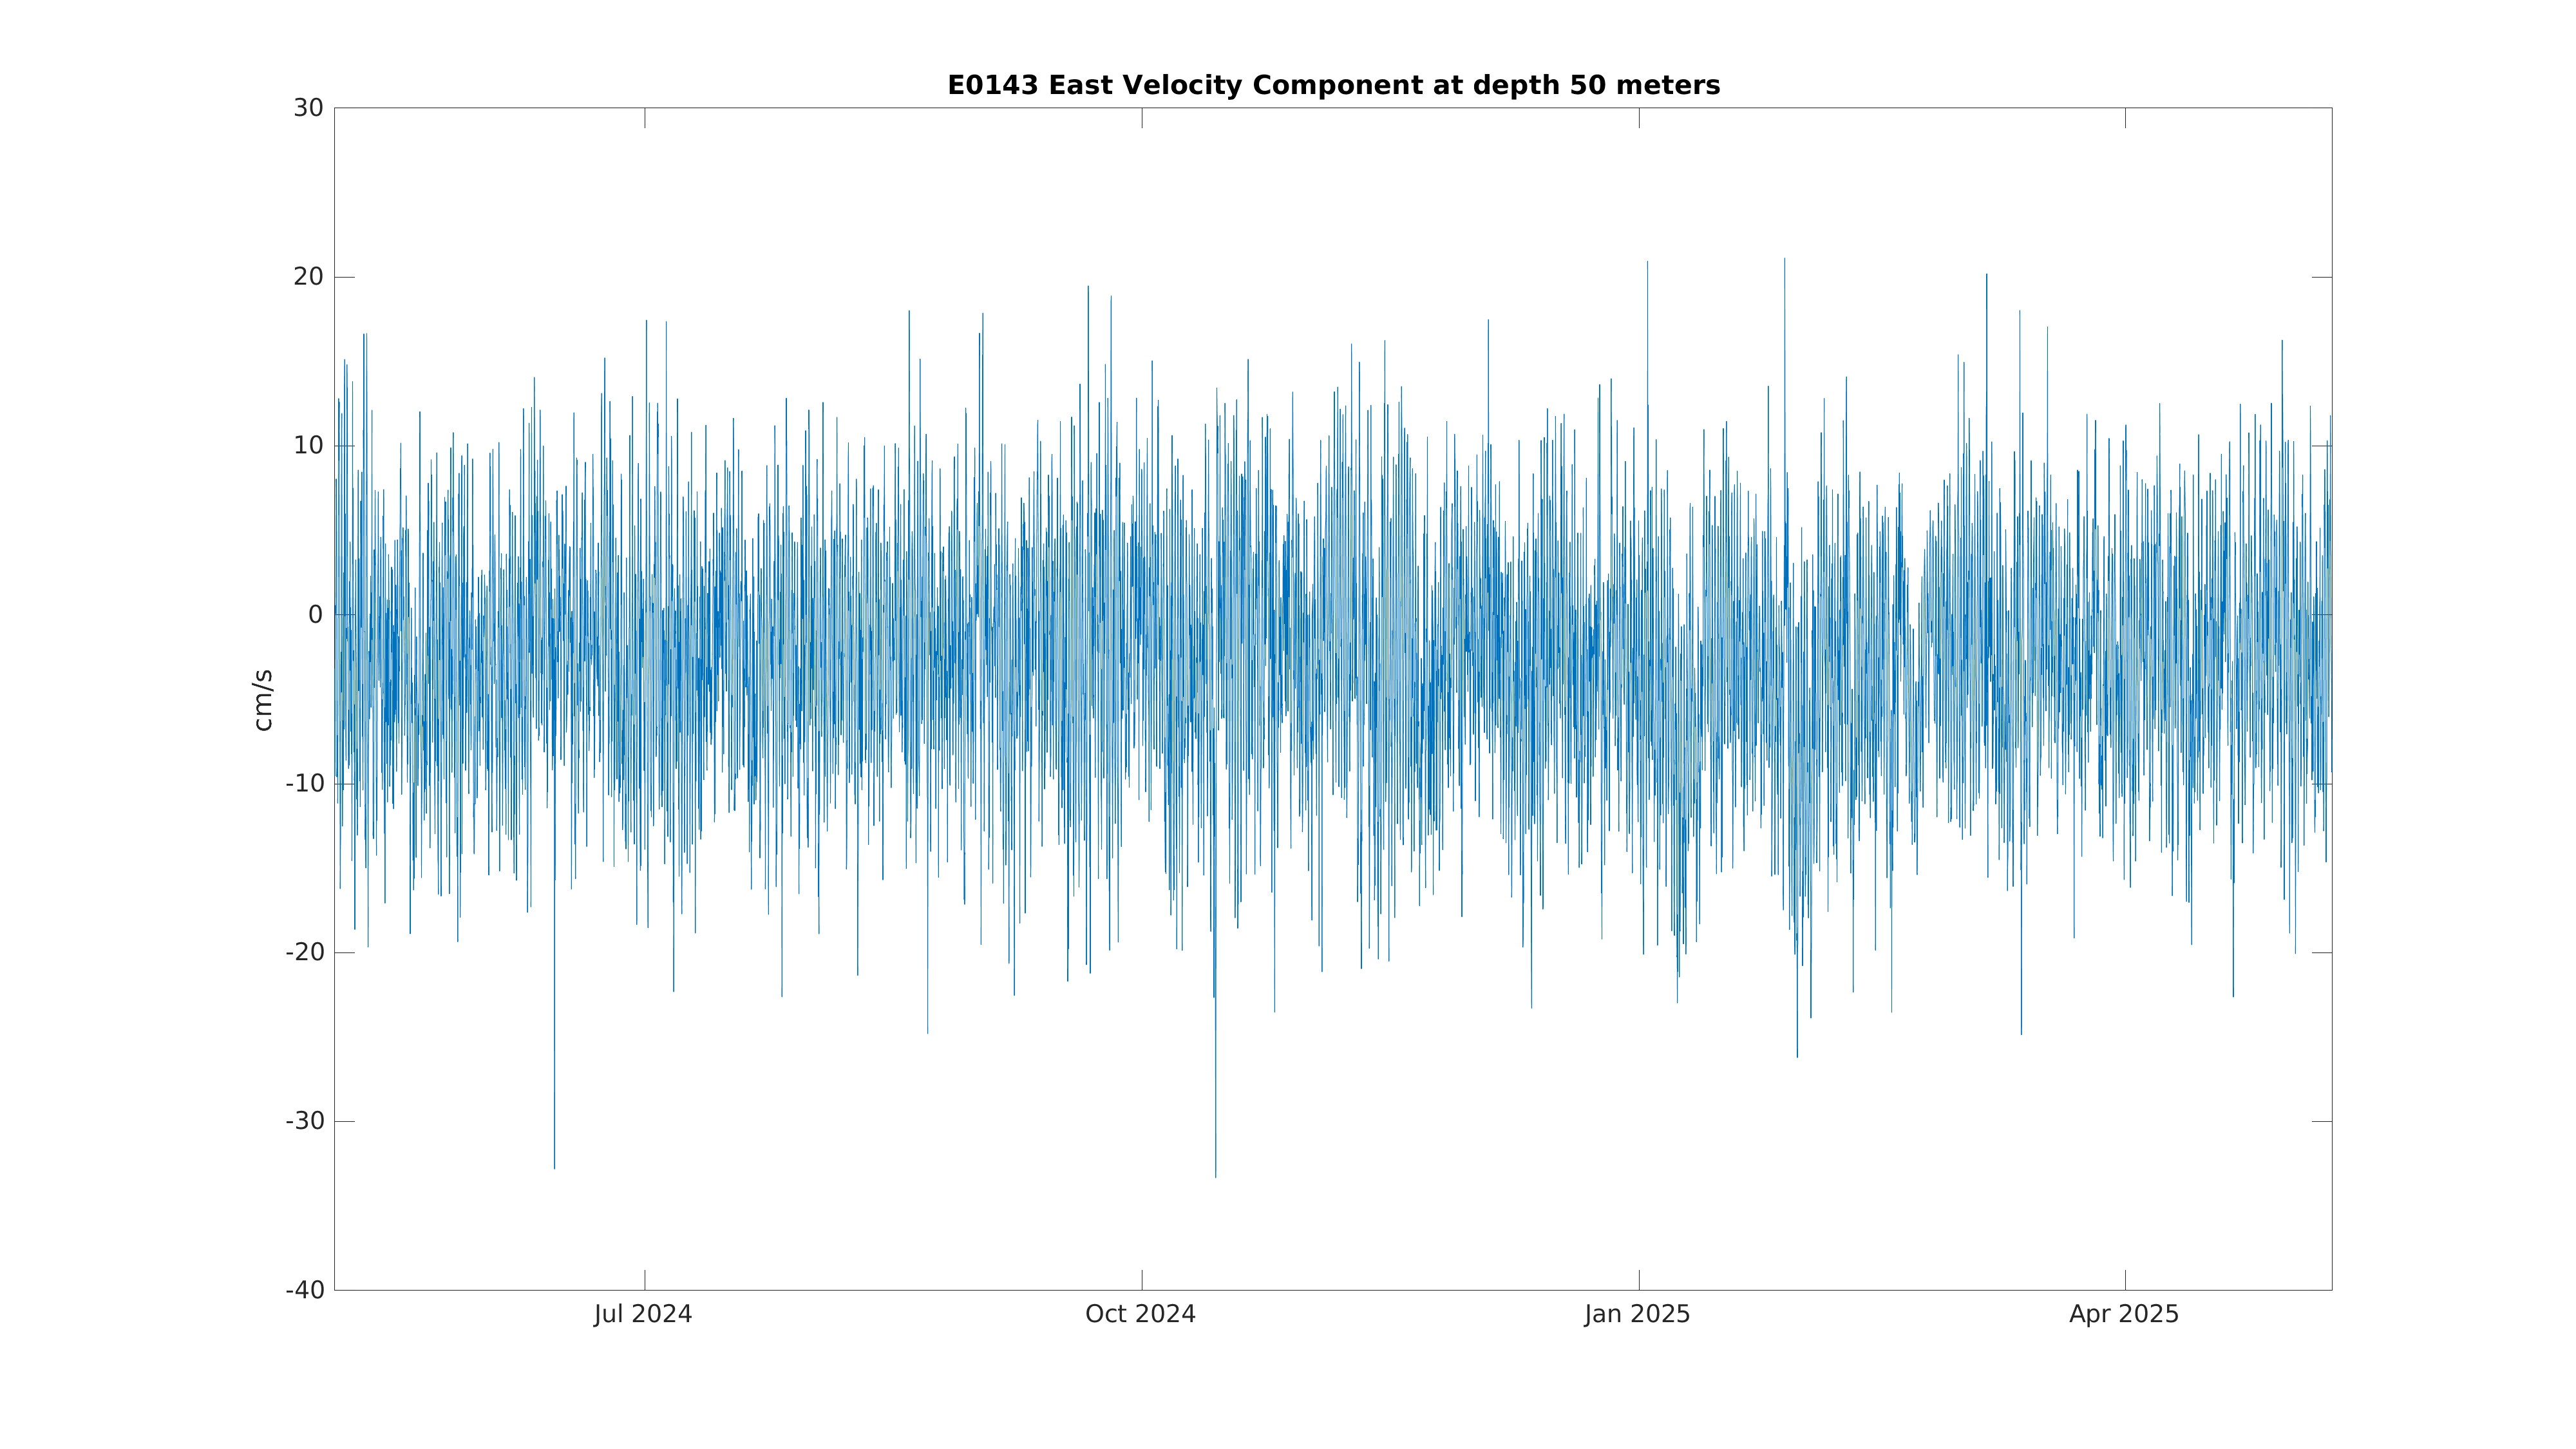
| East Current Velocity (50m) | Sensor Failure | Dec 21 9:00 PM |
|
|
|
|
| North Current Velocity (2m) | Sensor Failure | Oct 08 12:00 PM |
|
|

|
|
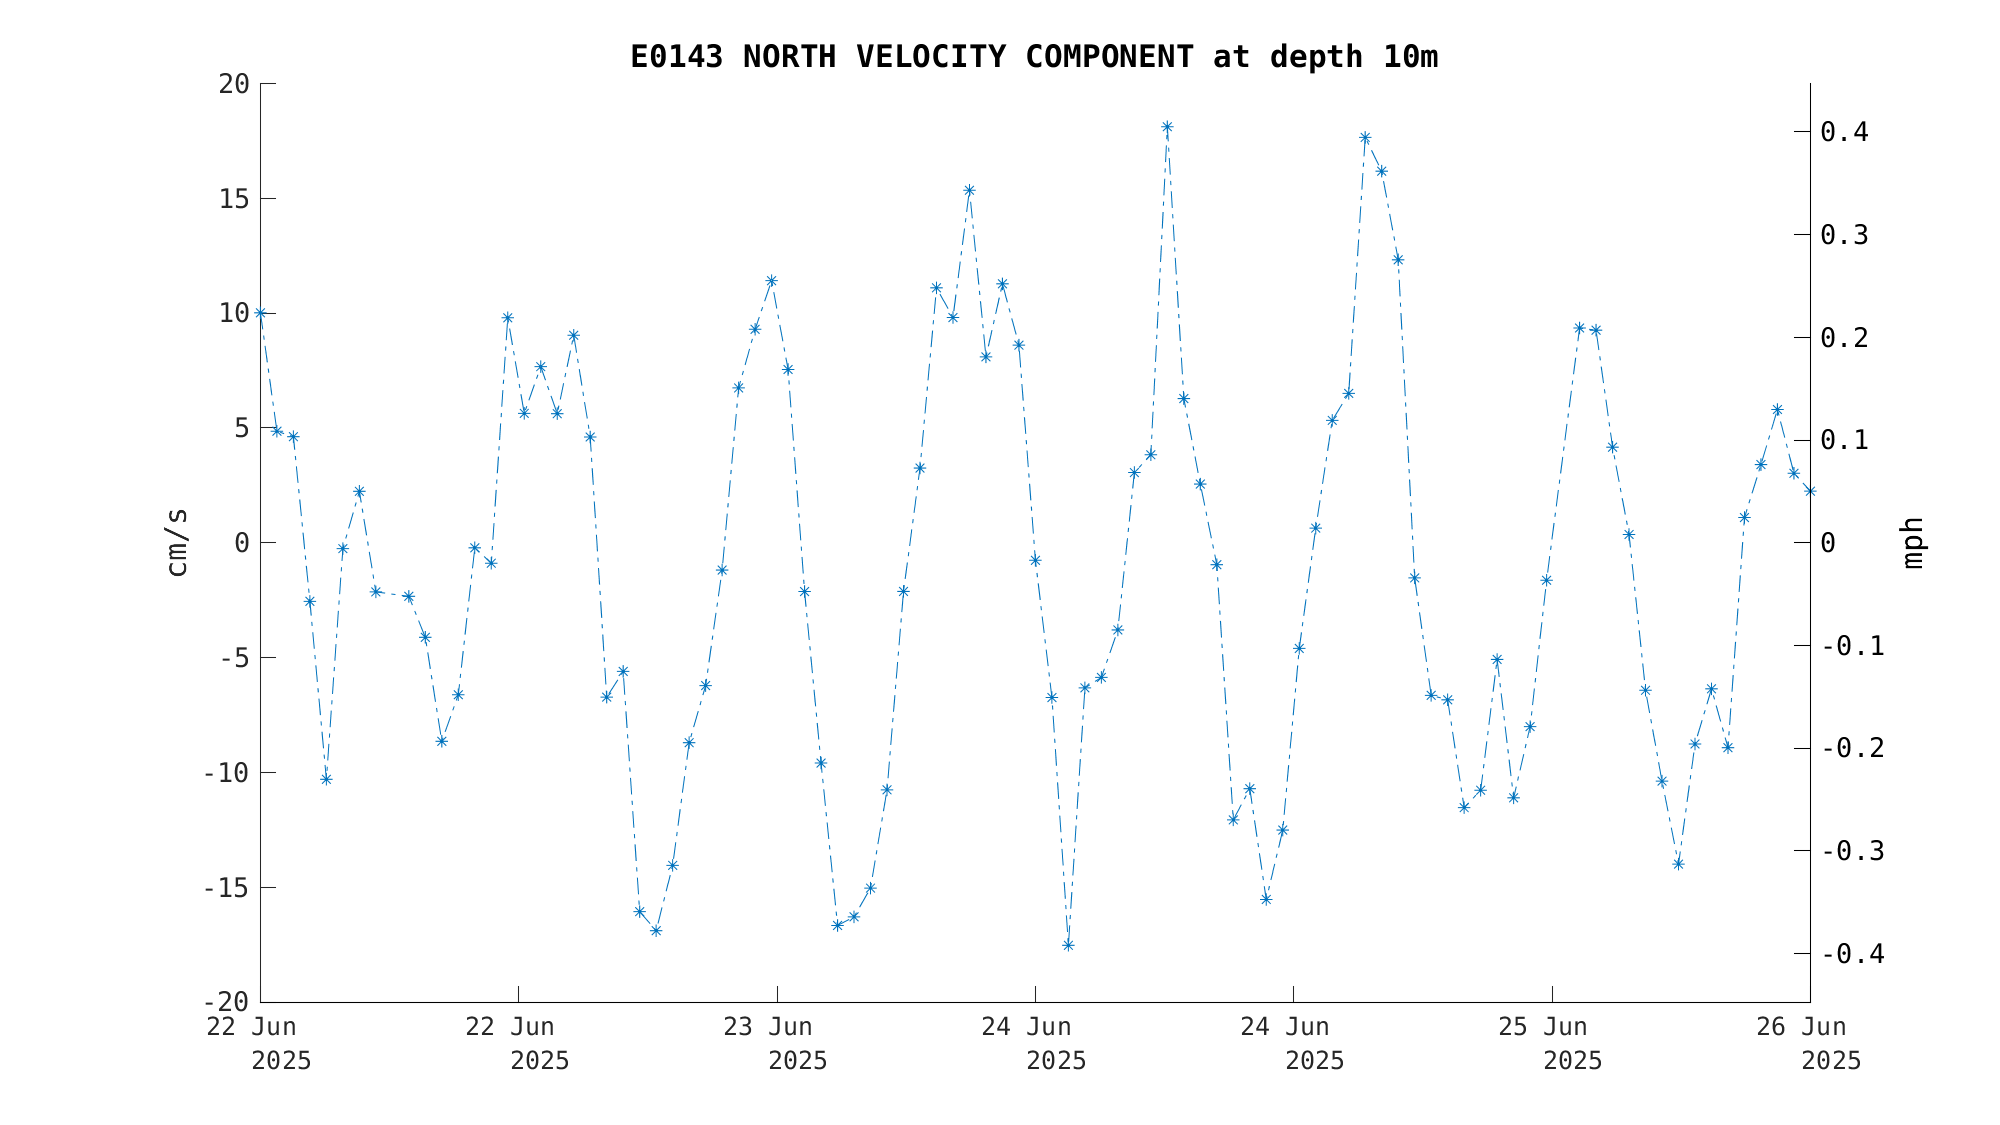
| North Current Velocity (10m) | Sensor Failure | Dec 21 9:00 PM |
|
|
|
|
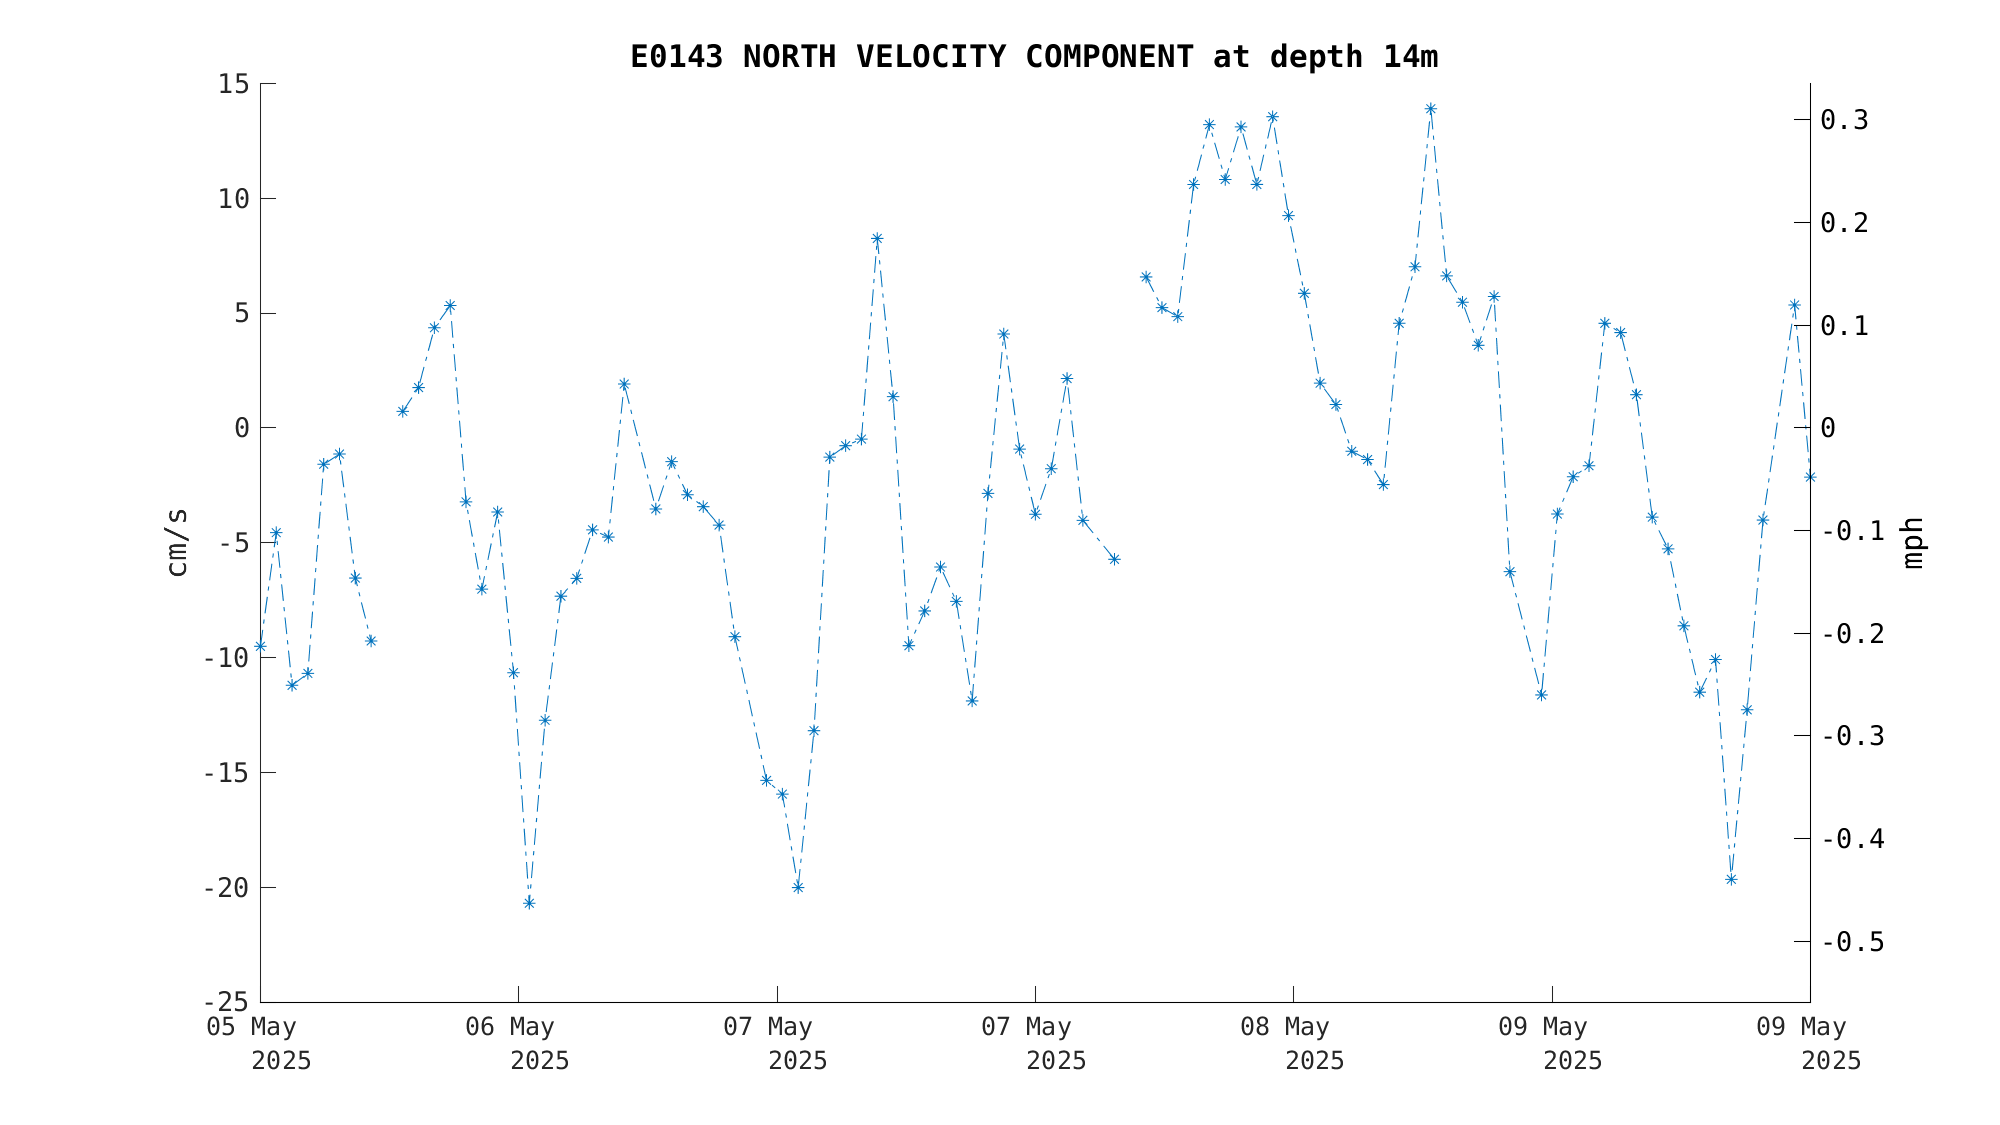
| North Current Velocity (14m) | Sensor Failure | Dec 21 9:00 PM |
|
|
|
|
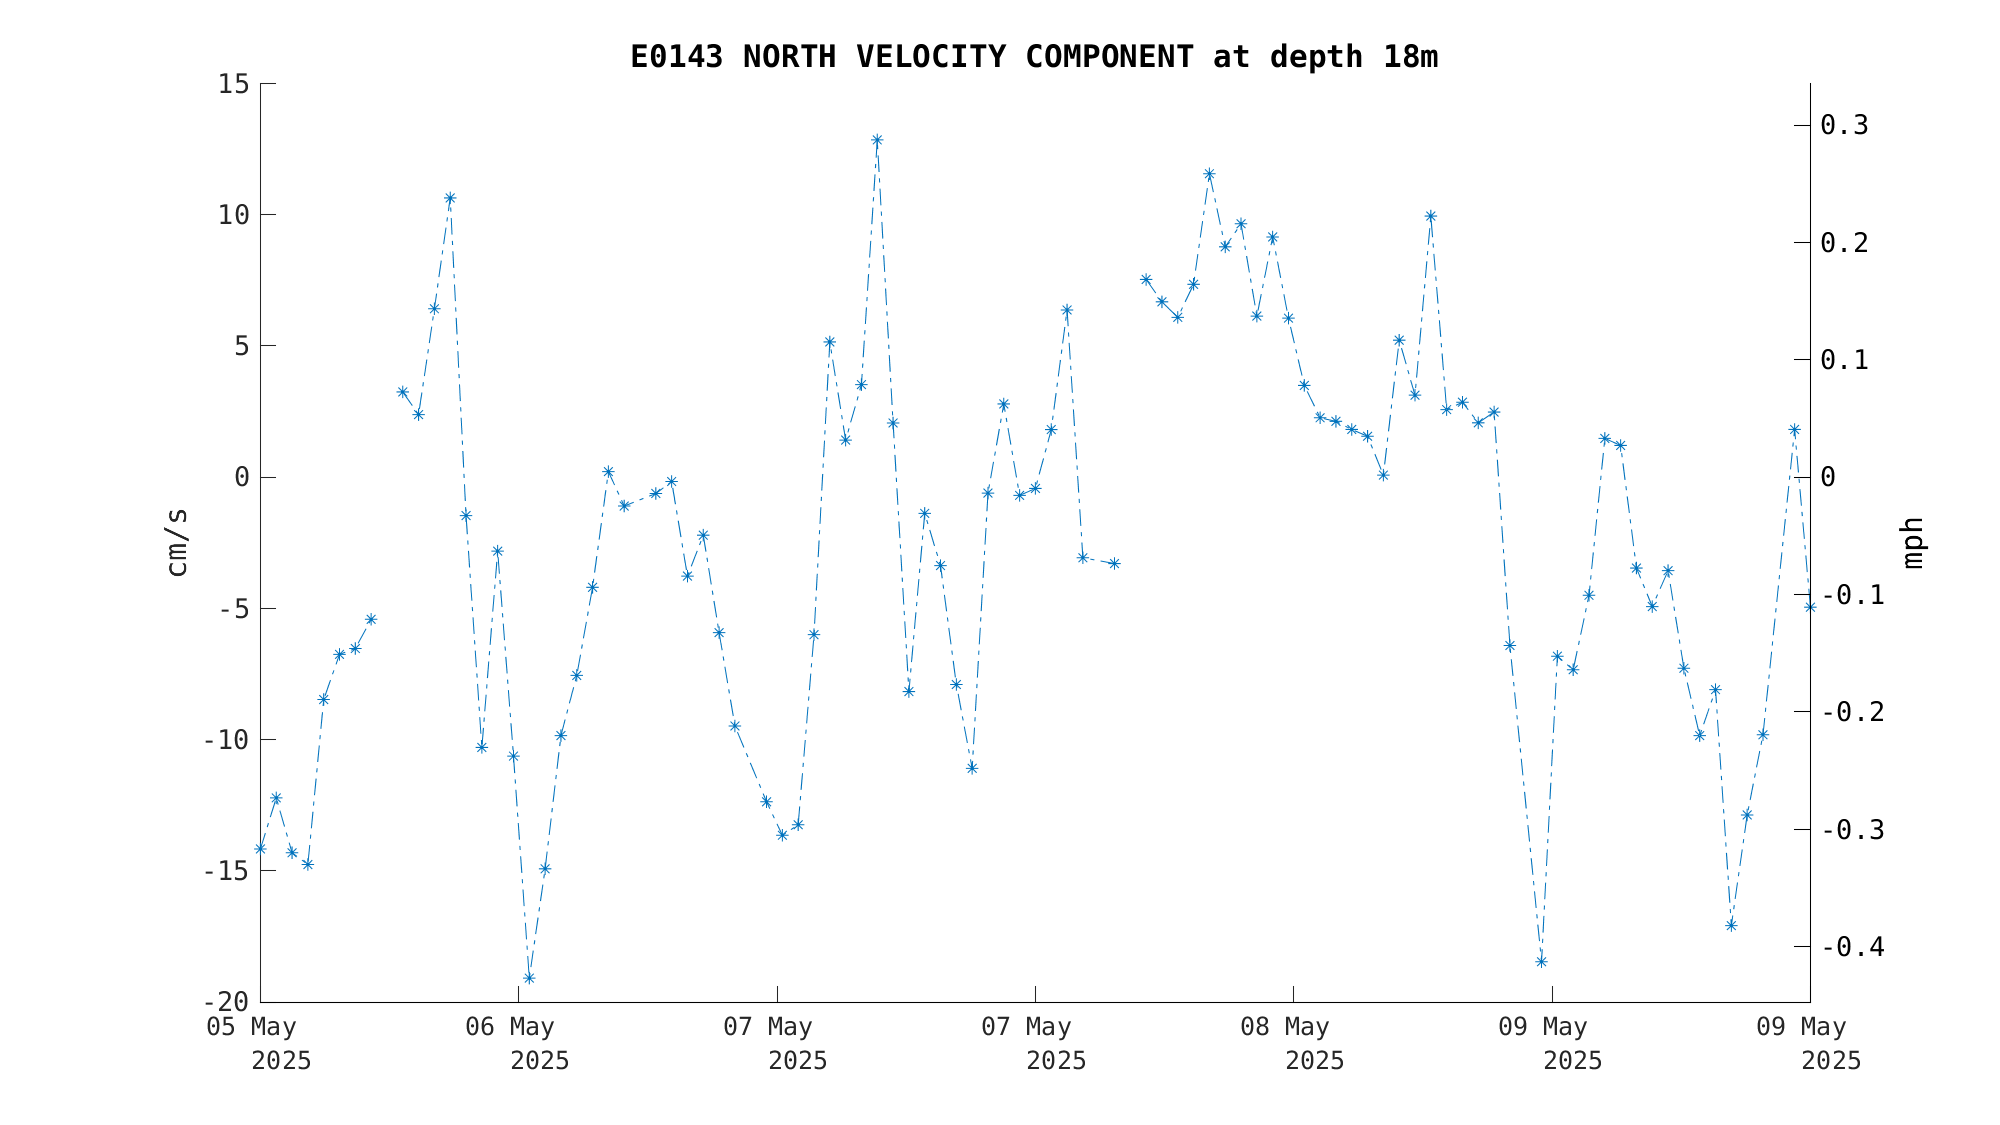
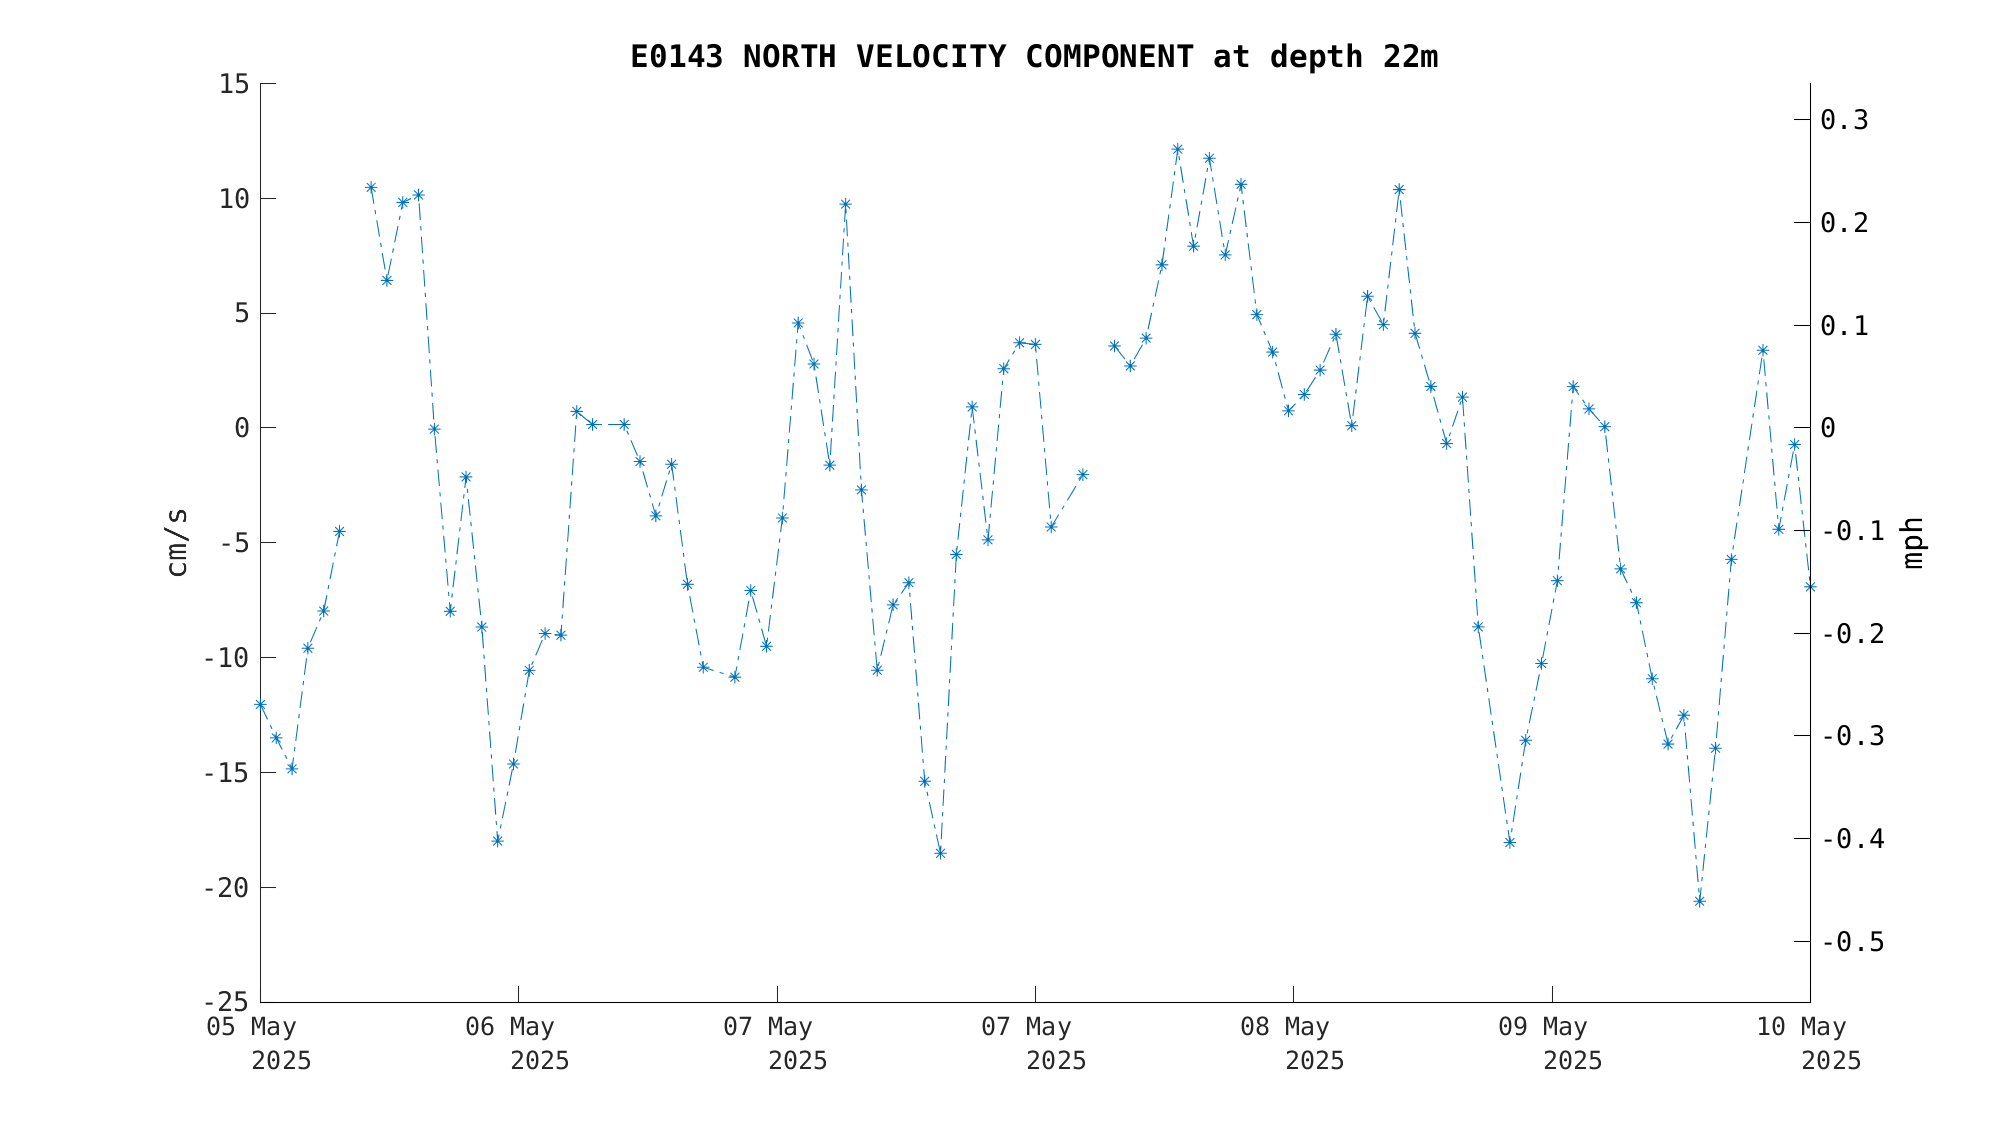
| North Current Velocity (18m) | Sensor Failure | Dec 21 9:00 PM |
|
|
|
|
| North Current Velocity (22m) | Sensor Failure | Dec 21 9:00 PM |
|
|
|
|
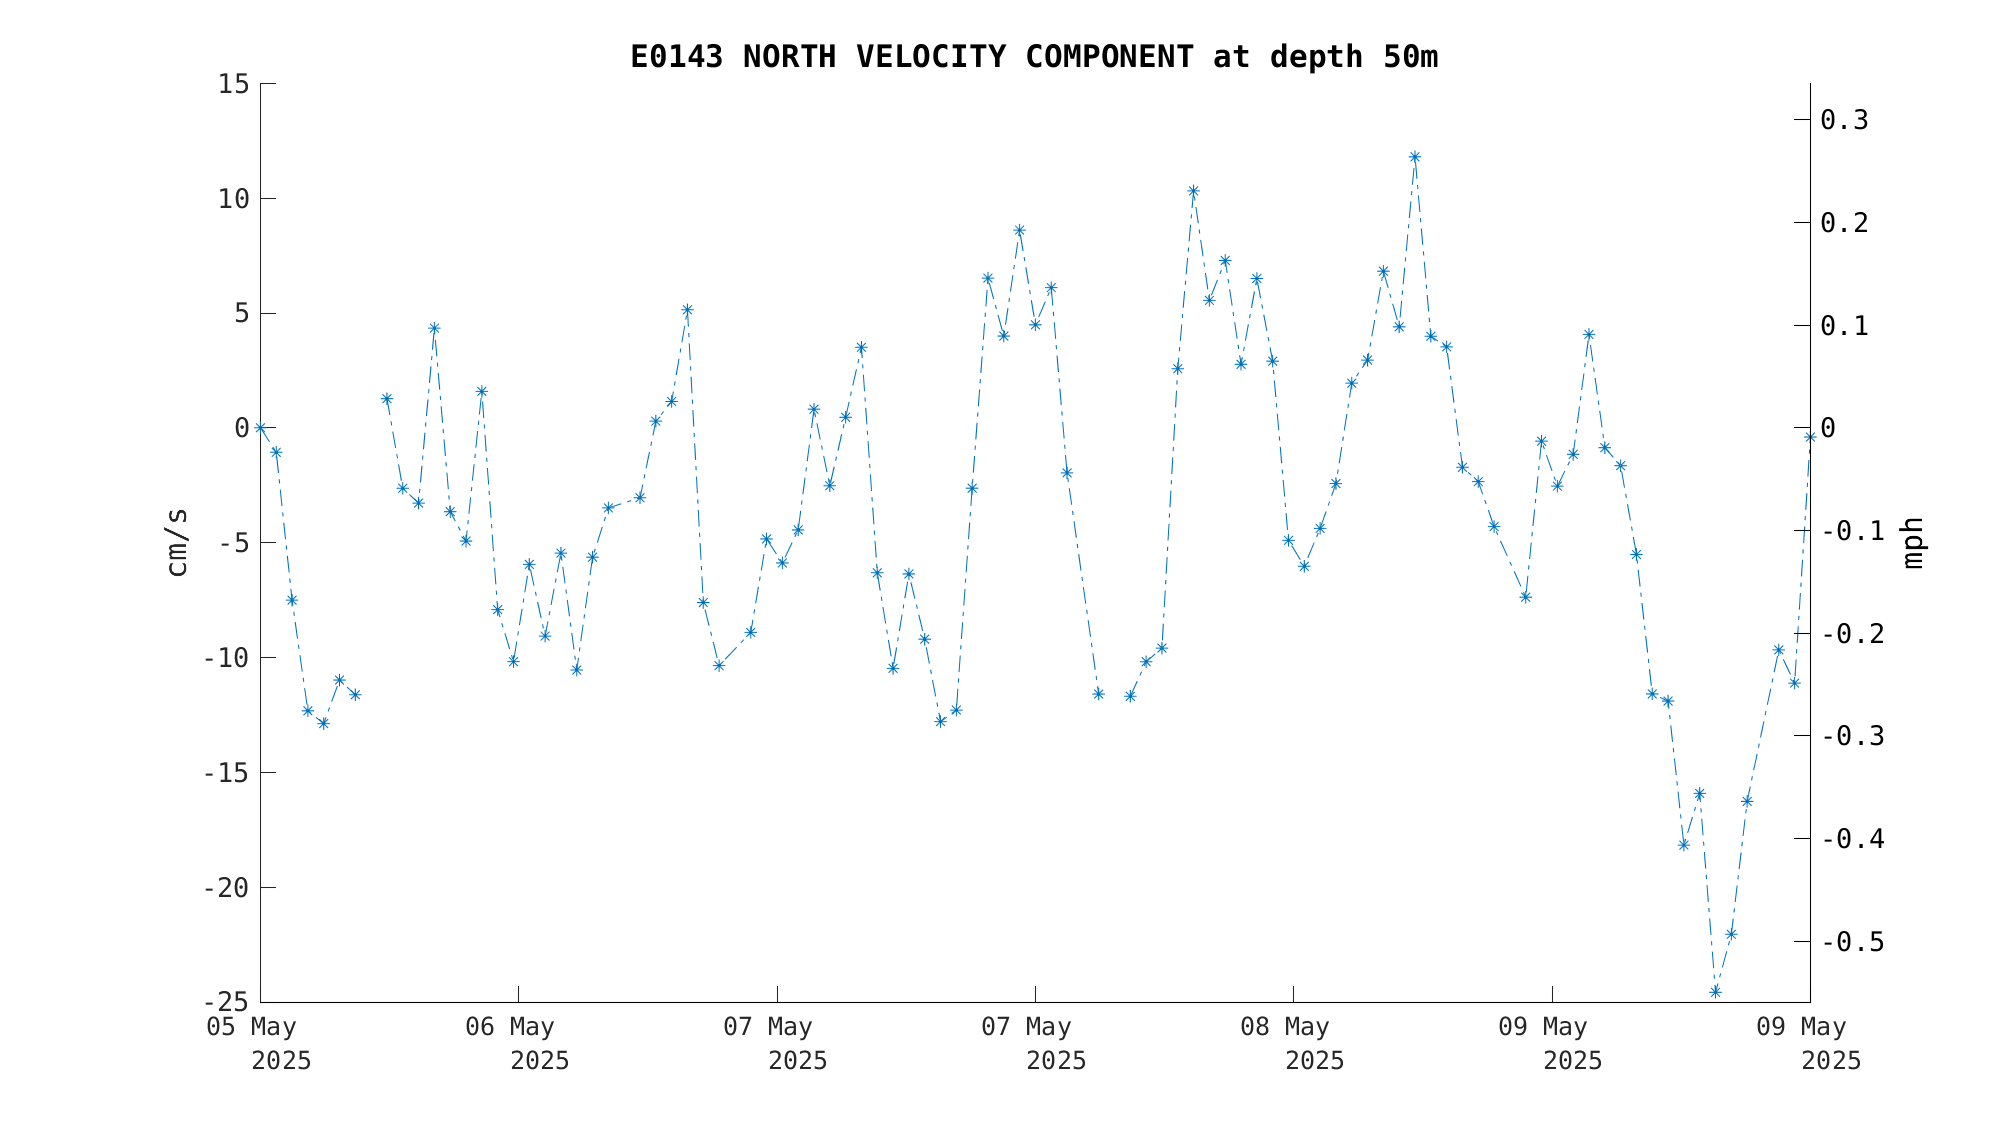
| North Current Velocity (50m) | Sensor Failure | Dec 21 9:00 PM |
|
|
|
 Latest Month's:
|
 This Deployment:
|
 Entire Position History:
|
 Latest Month's:
|
 This Deployment:
|
 Entire Position History:
|
| NERACOOS Home | Latest Buoy Data | U.Maine Buoys | U.Maine CODAR | GOM Weather | GOM Wave Modeling | Related Links | Software | Mooring Group | PhOG home |