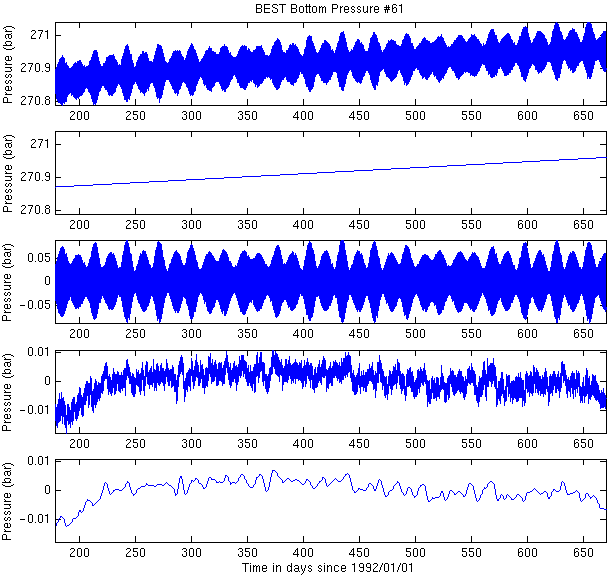

a) Raw bottom pressure timeseries data for SN 61. Processed data samples are once per hour.
b) A linear trend is modeled and removed.
c) The barotropic tide (diurnal and semi-diurnal) is modeled and removed. Tides in the Cape Basin have a peak-to-trough amplitude of roughly 2 m, which translates to an amplitude of about 0.2 bar in bottom pressure. Note the change in scale on the y-axis.
d) The de-trended, de-tided bottom pressure data.
e) A lowpass filter is applied: in this case a second-order Butterworth filter with a cutoff at 40 hours (see Fig. 7b).