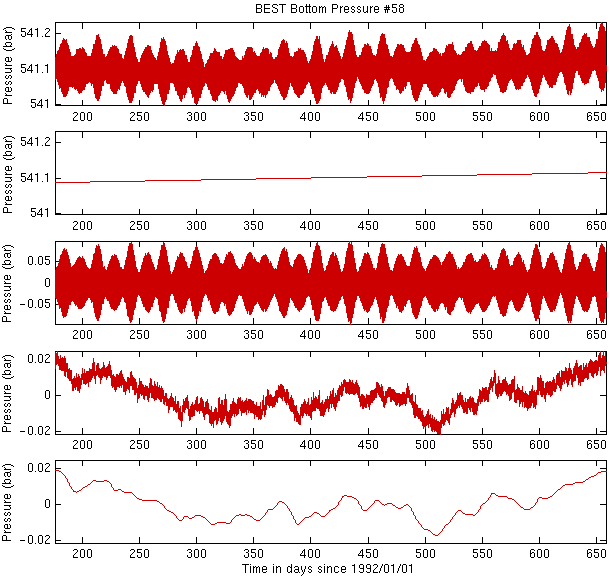

a) Raw bottom pressure timeseries data for SN 58. Processed data samples are once per hour. These data provide information about the tide and also about the barotropic component of sea level.
b) A linear trend is modeled and removed.
c) The barotropic tide (diurnal and semi-diurnal) is modeled and removed. Tides in the Cape Basin have a peak-to-trough amplitude of roughly 2 m, which translates to an amplitude of about 0.2 bar in bottom pressure. Note the change in scale on the y-axis.
d) The de-trended, de-tided bottom pressure data.
e) A lowpass filter is applied: in this case a second-order Butterworth filter with a cutoff at 72 hours (see Fig. 7b).