Exercise 2: Graphic display methods for ocean currents.
Page 2
 The basis of any display of vector data is a system of coordinates. This exercise uses a rectangular
("Cartesian", after the French mathematician Descartes) coordinate system, which is appropriate for processes occurring on
space scales of up to 1000 km. (Beyond that scale the curvature of the earth has to be taken into account,
which requires a spherical coordinate system.)
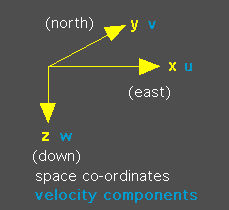
The conventional notation in oceanography is that the triple (x, y, z) denotes direction and distance in space, positive in (east, north, down) direction, and that the triple (u, v, w) denotes the current components in the corresponding directions. Note that oceanographers use what is called a "left-handed"
coordinate system, in which the vertical coordinate z is counted positive downward. Meteorologists use a
"right-handed" coordinate system, in which the vertical coordinate z is counted positive upward. The choice
of the coordinate system has no influence on any of the following exercises.
The Eulerian way of describing ocean currents is based on observations at a fixed point, such as obtained,
for example, from a moored current meter. As the water flows past the instrument, the current is recorded at
the instrument's location as a function of time.
The Lagrangian way of describing currents is based on observations of the trajectory of a water parcel, such
as obtained from a drifting buoy, drogue or float. As the drogue moves with the flow, its position is recorded
as a function of time.
Both methods give an accurate and complete description of the movement of the water but represent it in
very different ways.
This exercise gives examples of both methods, using a very simple model of tidal movement. The model data describe a sequence of simple flow fields, including
- steady state circulation in a rectangular basin,
- time-variable circulation in a rectangular basin,
- time-variable horizontally uniform flow, and
- time-variable flow with random disturbances.
|
 © 2000 M. Tomczak
contact address:
home page: http://www.es.flinders.edu.au/~mattom
web address of Exercises in Oceanography: http://www.es.flinders.edu.au/~mattom/IntExerc
This page last updated 1 February 2000
 The basis of any display of vector data is a system of coordinates. This exercise uses a rectangular
("Cartesian", after the French mathematician Descartes) coordinate system, which is appropriate for processes occurring on
space scales of up to 1000 km. (Beyond that scale the curvature of the earth has to be taken into account,
which requires a spherical coordinate system.)