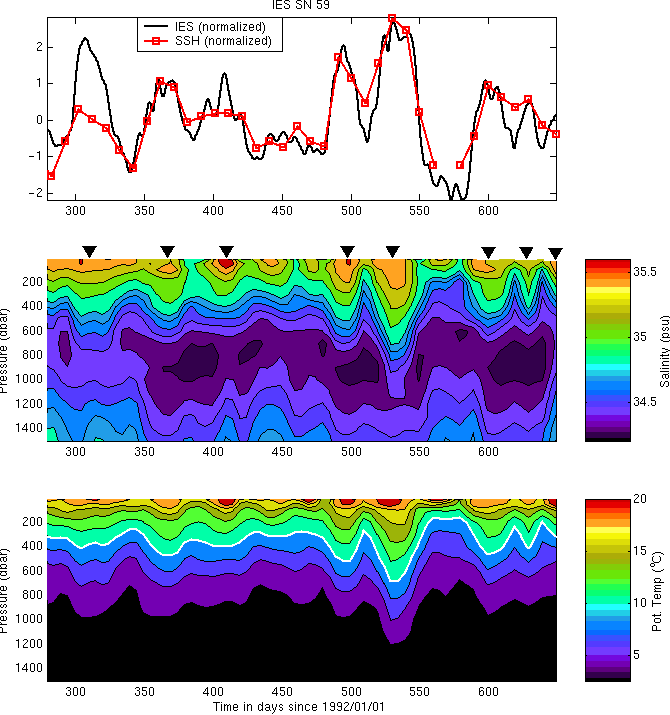
Figure 21 a,b,c. Normalized timeseries for SSH and tau(1500) from
the mooring are shown as a reference. Note that the sign of tau(1500)
has been reversed, so that higher numbers
indicate lower travel times (and a warmer water column).
The depth of the 10C isotherm has been picked out in white.
Black triangles mark major mesoscale events in the IES record identified
in Byrne, [2000] (Table 4-1). Note the very prominent eddy passing
over the mooring around day 540; it was within this feature that
recorded parameter pairs of SSH and tau strayed from the range
of those calculated using hydrographic data (Fig. 18).
A second interesting feature is the apparent increase in the salinity of the
intermediate water (~800-1000 dbar) around day 325.
An increase in the mean salt content of the water column is visible
when tau(1500) decreases (a warming, visible as a peak in this
figure), but SSH remains
relatively depressed. This type of event is visible at several
places in the record, most notably the intermediate water event mentioned
above and again near day 400; in the latter case it is the near-surface
salinity that appears to be enhanced. This would correspond with
an injection of South Indian Ocean Surface and Central waters. However,
interpretation of the near-surface data record should be viewed with mild
suspicion until the seasonal decomposition is incorporated into
the GEM-ETTA parameterizations above 150 dbar.

