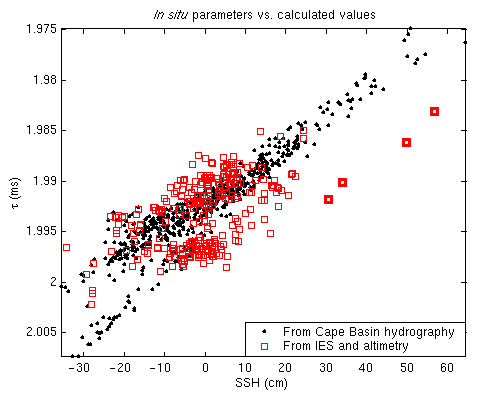

Figure 18. Tau and SSH calculated from the ASTTEX Cape Basin hydrographic database (black dots), overlain by the same quantities as measured by BEST IES and PIES moorings and altimetry (red squares). The large anomalous excursion of the BEST data (heavy squares, upper right) comes from measurements made at IES SN 59, where SSH was not able to be corrected for the barotropic component of sea level. A number of studies of Agulhas rings indicate they may have an extremely strong barotropic signal near this close to the Agulhas Retroflection [e.g., Kamenkovich et al., 1996; Beismann et al., 1999, Schouten et al., 2001]. The anomalous measurements were taken during most intense part of the passing of an extremely strong mesoscale ring between days 490 and 540 (Figs. 10a and 16c). Hence we believe it possible that the lack of bottom pressure measurements may have contributed significantly to the observed excursion from parameter pair values observed in the hydrographic database and in the other mooring/altimeter timeseries.