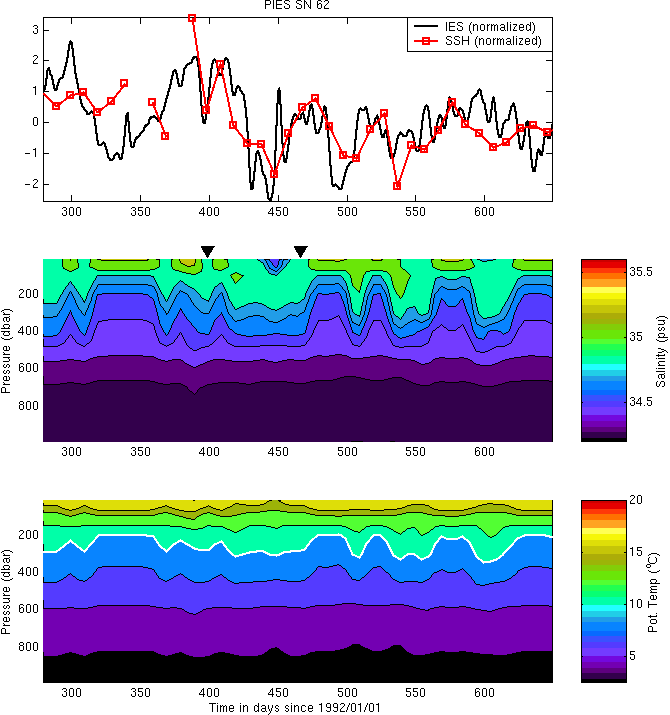
Normalized timeseries for SSH and tau(1500) are shown as a reference. Note that the sign of tau(1500) in a) (top) has been reversed, so that higher numbers indicate lower travel times (and a warmer water column). As strong thermohaline anomalies pass between the satellite and the mooring, the two curves may diverge, indicating that the mean temperature and salinity of the water column are no longer changing in concert. This effect is particularly noticeable around day 450 when a feature with a relatively fresh surface layer appears to pass over the mooring.
It should be noted that the highest rms error in the CSR 4.0 tide model was observed at this location, with amplitudes of ~4 cm aliased to a 50-60 day periodicity [Byrne, 2000]. A future improvement planned for this analysis will use the tides measured in situ wherever possible.