Utility to calculate and graph co-oscillation tides
The co-oscillation tide in Spencer Gulf, South Australia.
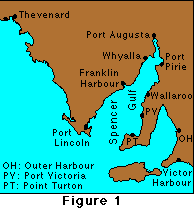
Spencer Gulf is one of two gulfs that extend northward from the south Australian coast (Figure 1). Tides along the south coast of Australia are relatively moderate in size, with amplitudes of the four major constituents of 0.15 - 0.30 m. Tides in the gulfs are generally larger and increase towards the heads. The following table gives tidal constants for ports around Spencer Gulf and some other locations.
| port |
M2 |
S2 |
K1 |
O1 |
 |
| | H (m) | phase (°) | H (m) | phase (°) | H (m) | phase (°) | H (m) | phase (°) |
| Spencer Gulf |
| Port Augusta | 0.68 | 212 | 0.74 | 273 | 0.45 | 82 | 0.29 | 54 |
| Port Pirie | 0.49 | 200 | 0.54 | 263 | 0.41 | 80 | 0.28 | 52 |
| Whyalla | 0.42 | 185 | 0.45 | 245 | 0.40 | 73 | 0.26 | 45 |
| Wallaroo | 0.17 | 130 | 0.17 | 187 | 0.32 | 62 | 0.22 | 34 |
| Franklin Harbour | 0.22 | 114 | 0.23 | 173 | 0.30 | 61 | 0.20 | 24 |
| Port Victoria | 0.18 | 70 | 0.18 | 127 | 0.23 | 52 | 0.20 | 24 |
| Point Turton | 0.18 | 67 | 0.21 | 117 | 0.26 | 53 | 0.17 | 22 |
| Port Lincoln | 0.23 | 35 | 0.26 | 87 | 0.23 | 29 | 0.16 | 2 |
| Other ports |
| Outer Harbour | 0.50 | 105 | 0.49 | 176 | 0.25 | 50 | 0.16 | 24 |
| Thevenard | 0.30 | 1 | 0.37 | 47 | 0.19 | 24 | 0.13 | 359 |
| Victor Harbour | 0.14 | 343 | 0.14 | 46 | 0.18 | 30 | 0.14 | 356 |
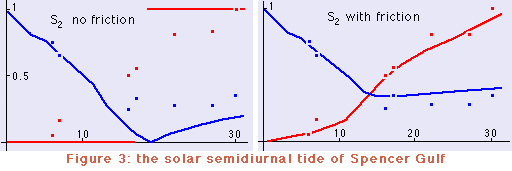
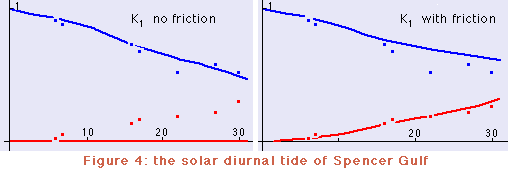
The table shows that the amplitudes of the M2 and S2 constituents have a minimum in the centre of the gulf near Wallaroo and that the phases of these constituents change from the mouth of the Gulf at Port Lincoln to the head at Port Augusta by 180°; in other words, these two constituents co-oscillate with the tides of the Southern Ocean as a second order seiche. In contrast, the amplitudes of the K1 and O1 constituents increase monotonically from the mouth to the head, and their phases are nearly constant along the gulf, indicating that these constituents form a first order seiche.
|
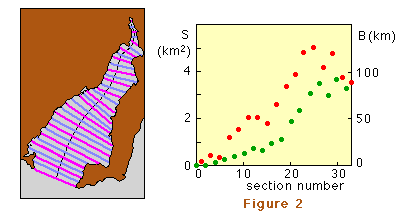
Figure 2 shows the division of the gulf into 33 compartments of 10 km length (the Δx of the finite difference model) and the associated width B (red dots) and cross-sectional area S (green dots). Values for B have to be provided for odd locations (magenta lines), values for S for even locations (dark grey lines).
Figure 3 compares the result of the model for the S2 constituent with the observed amplitudes and phases. The amplitude, normalised to unity at the head of the gulf, is shown in blue; the phase, normalised to (ie divided by) 180°, is shown in red. Observations are shown by squares. (Note that without friction the phase can only be equal to 0° or 180°.) Figure 4 gives the same comparison for the K1 constituent.
|

|


This utility is based on A. K. Easton (1978) A reappraisal of the tides in Spencer Gulf, South Australia. Australian Journal of Marine and Freshwater Research 29, 467 - 477.
 © 2000 M. Tomczak
Last updated 6 September 2000. Contact address:


