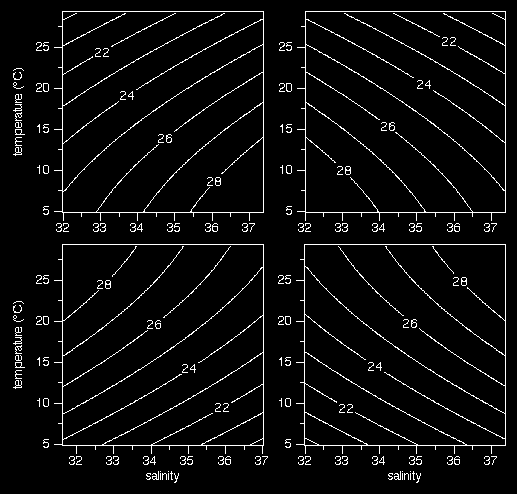
The next step is to investigate the variation of density when temperature and salinity change at the same time. This is best done in a diagram which displays density against salinity on the x-axis and temperature on the y-axis. Such a diagram is called a temperature-salinity diagram or TS-diagram.
Points in the TS-diagram which share the same density values are connected by contours of equal density, known as isopycnals. In the diagrams, the isopycnals are labelled in σt values.
Of the four diagrams shown, only one shows the correct density dependence on temperature and salinity. Which one is it? Click on the diagram which in your view is correct.
