Latitude: 17° 52.20´N
Longitude: 66° 32.22´W
Location Description: South of Caja de Muertos Island
Deployed: Jul 31 2024
Coast Guard Light List Letter: A
Coast Guard Light List Number 31941
Water Depth: 17 meters (56 feet)
Watch Circle Radius: 60 meters (197 feet)
Last Cell Phone Transmission: May 22, 06 AM AST
Last GOES Transmission: Nov 13, 04 PM AST
Latest Event:
Jul 31, 07 AM AST
deployed by F/V Blackbeard
deployed by F/V Blackbeard

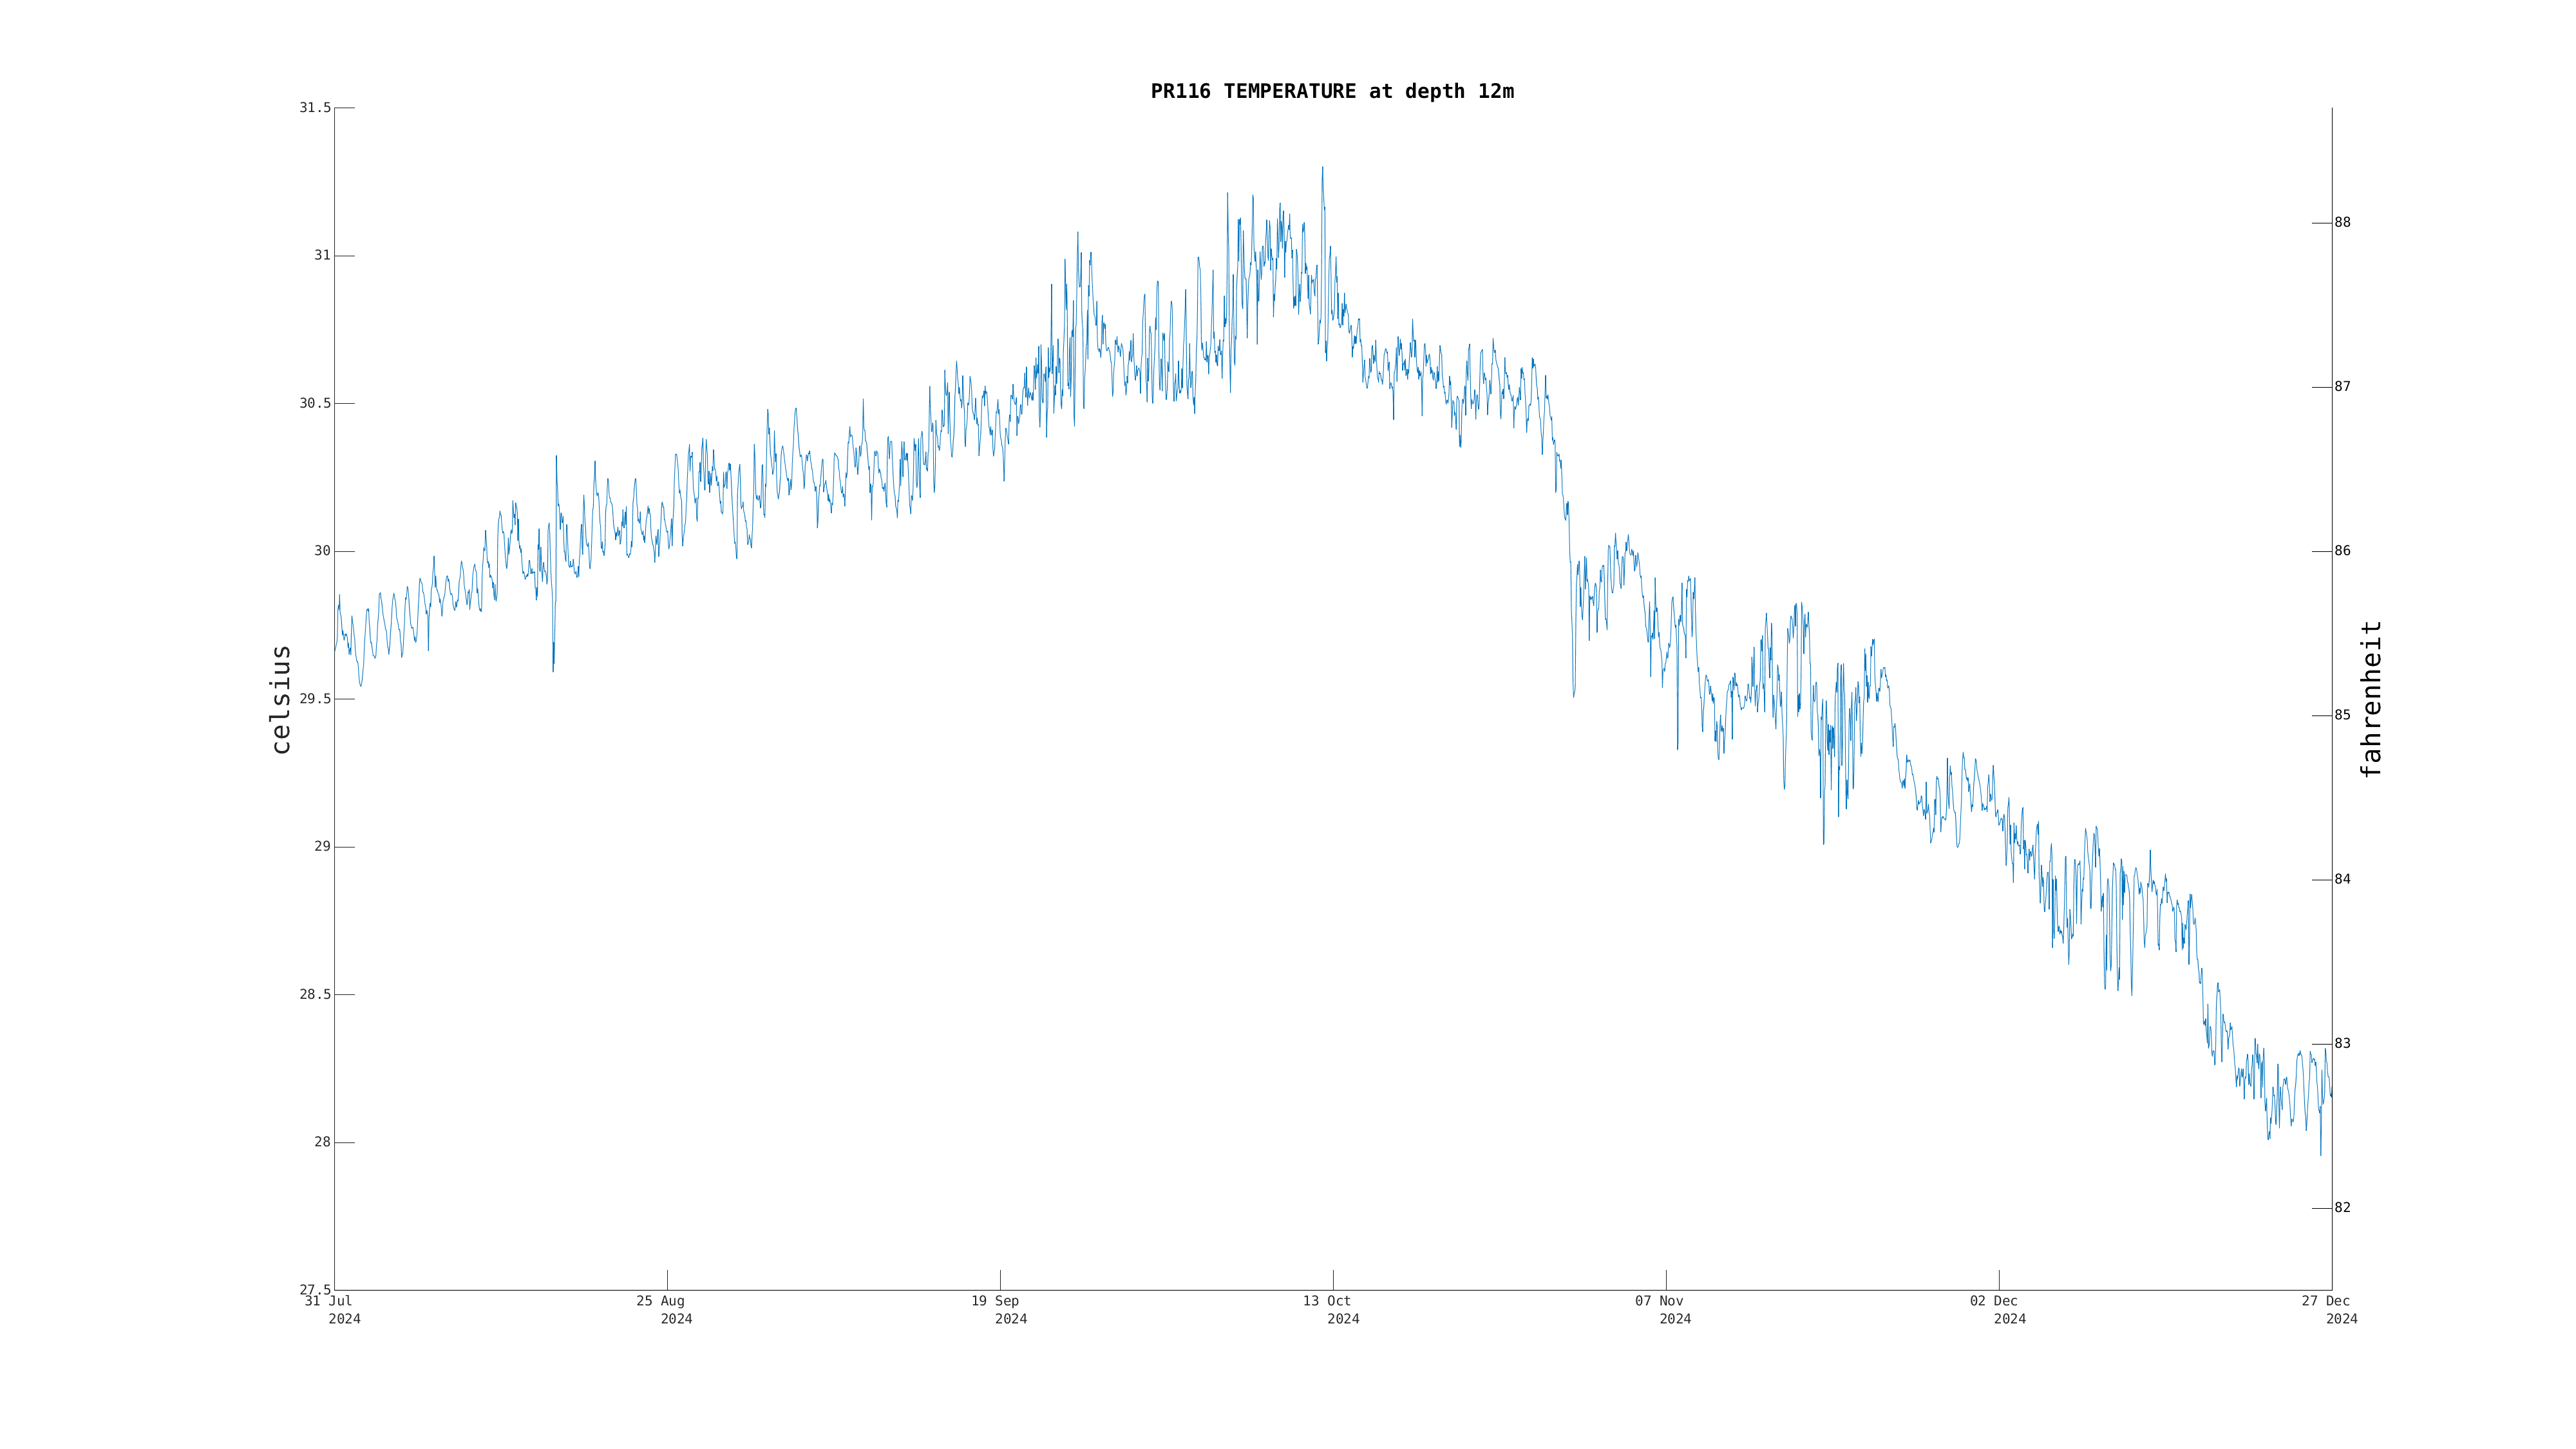
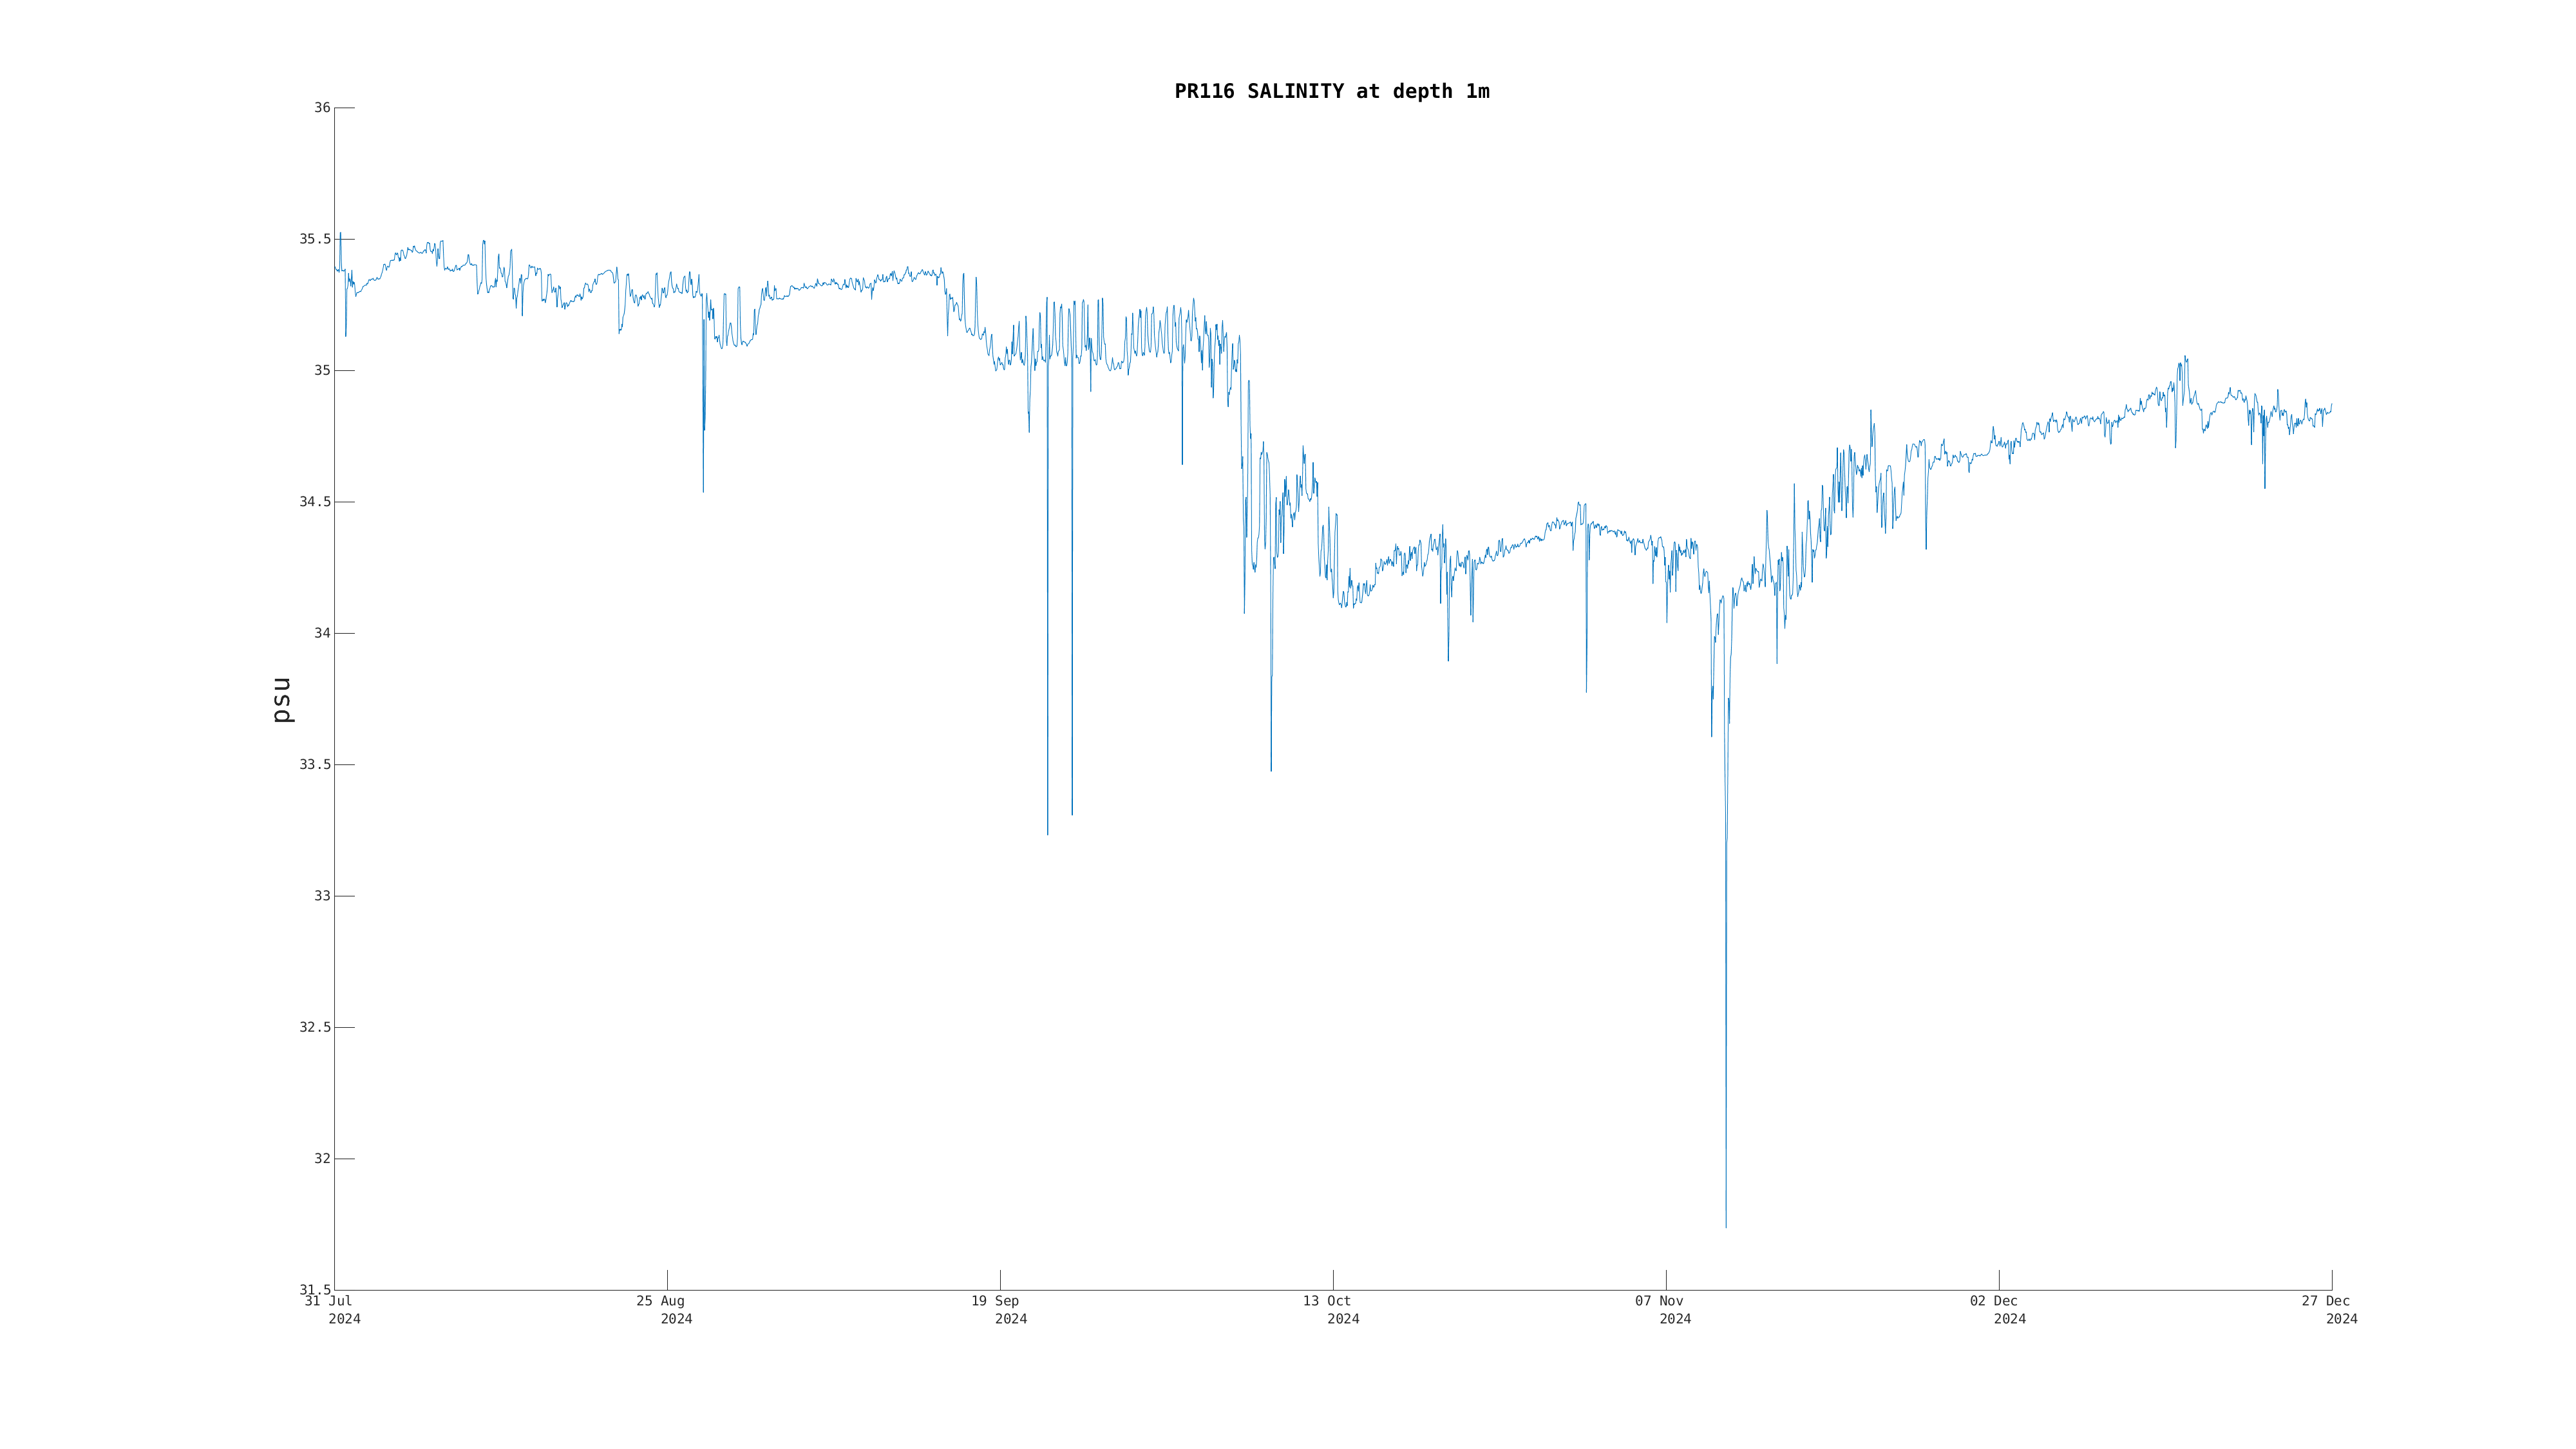
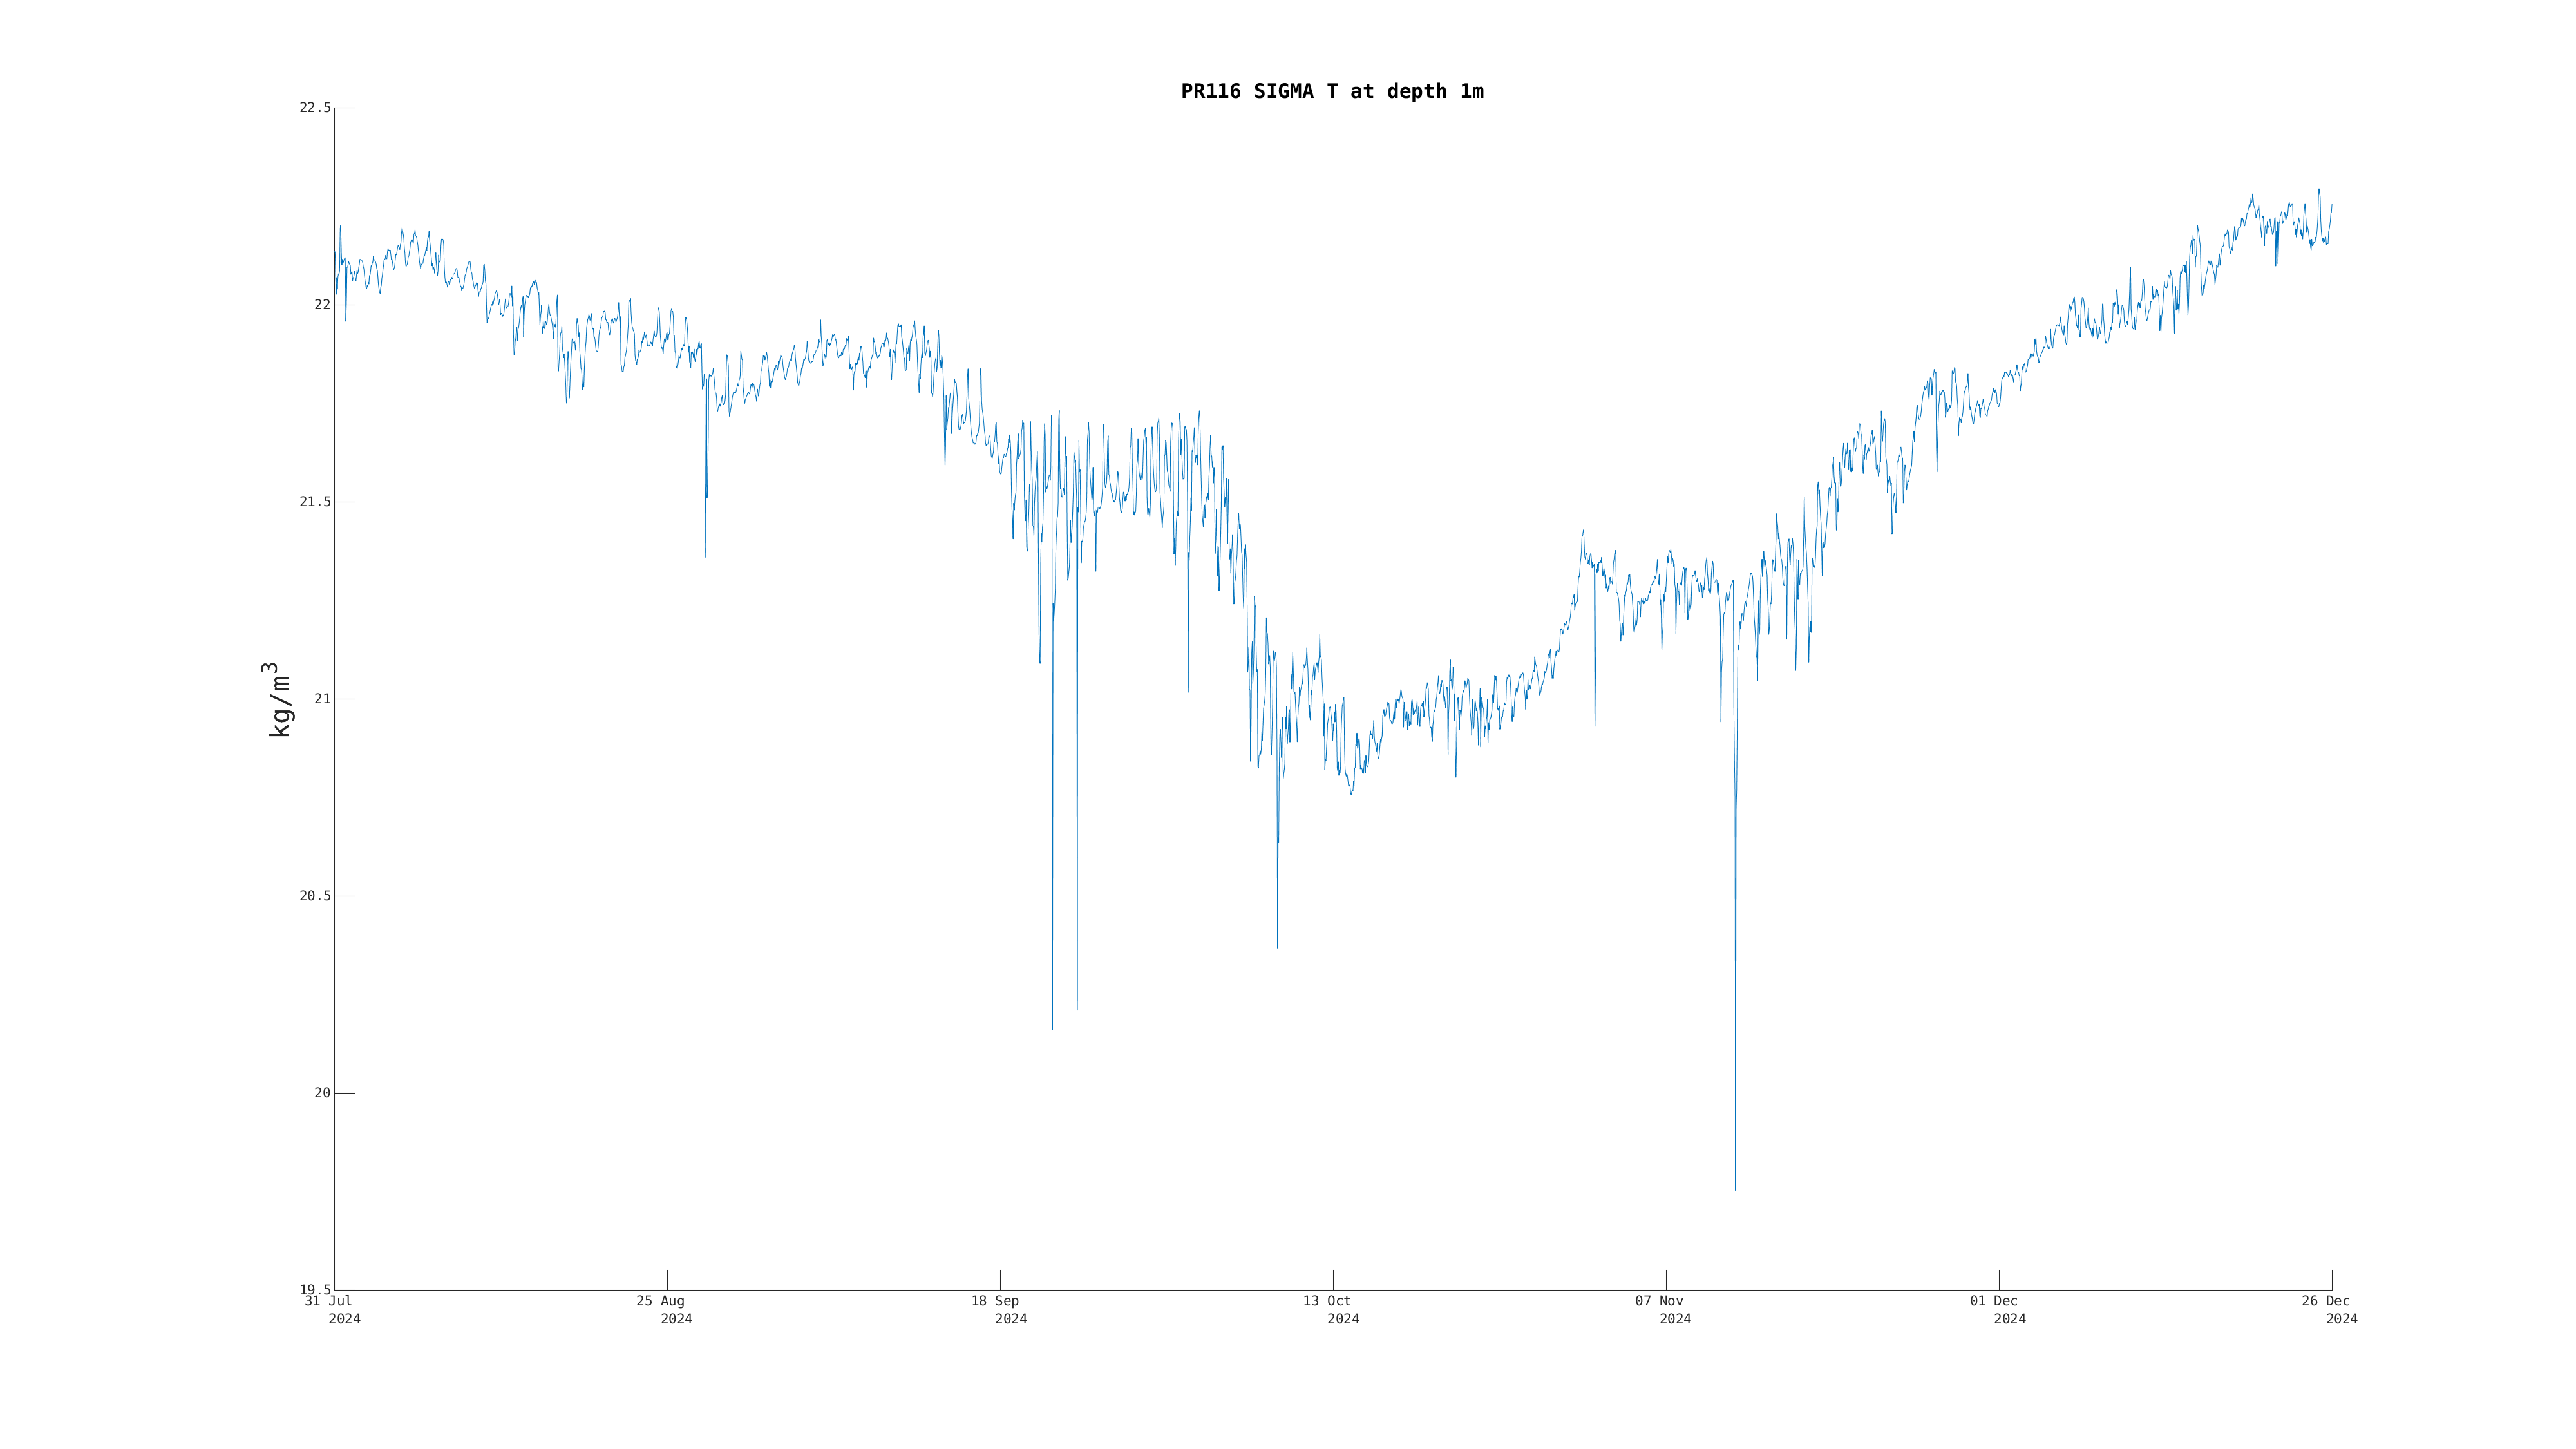
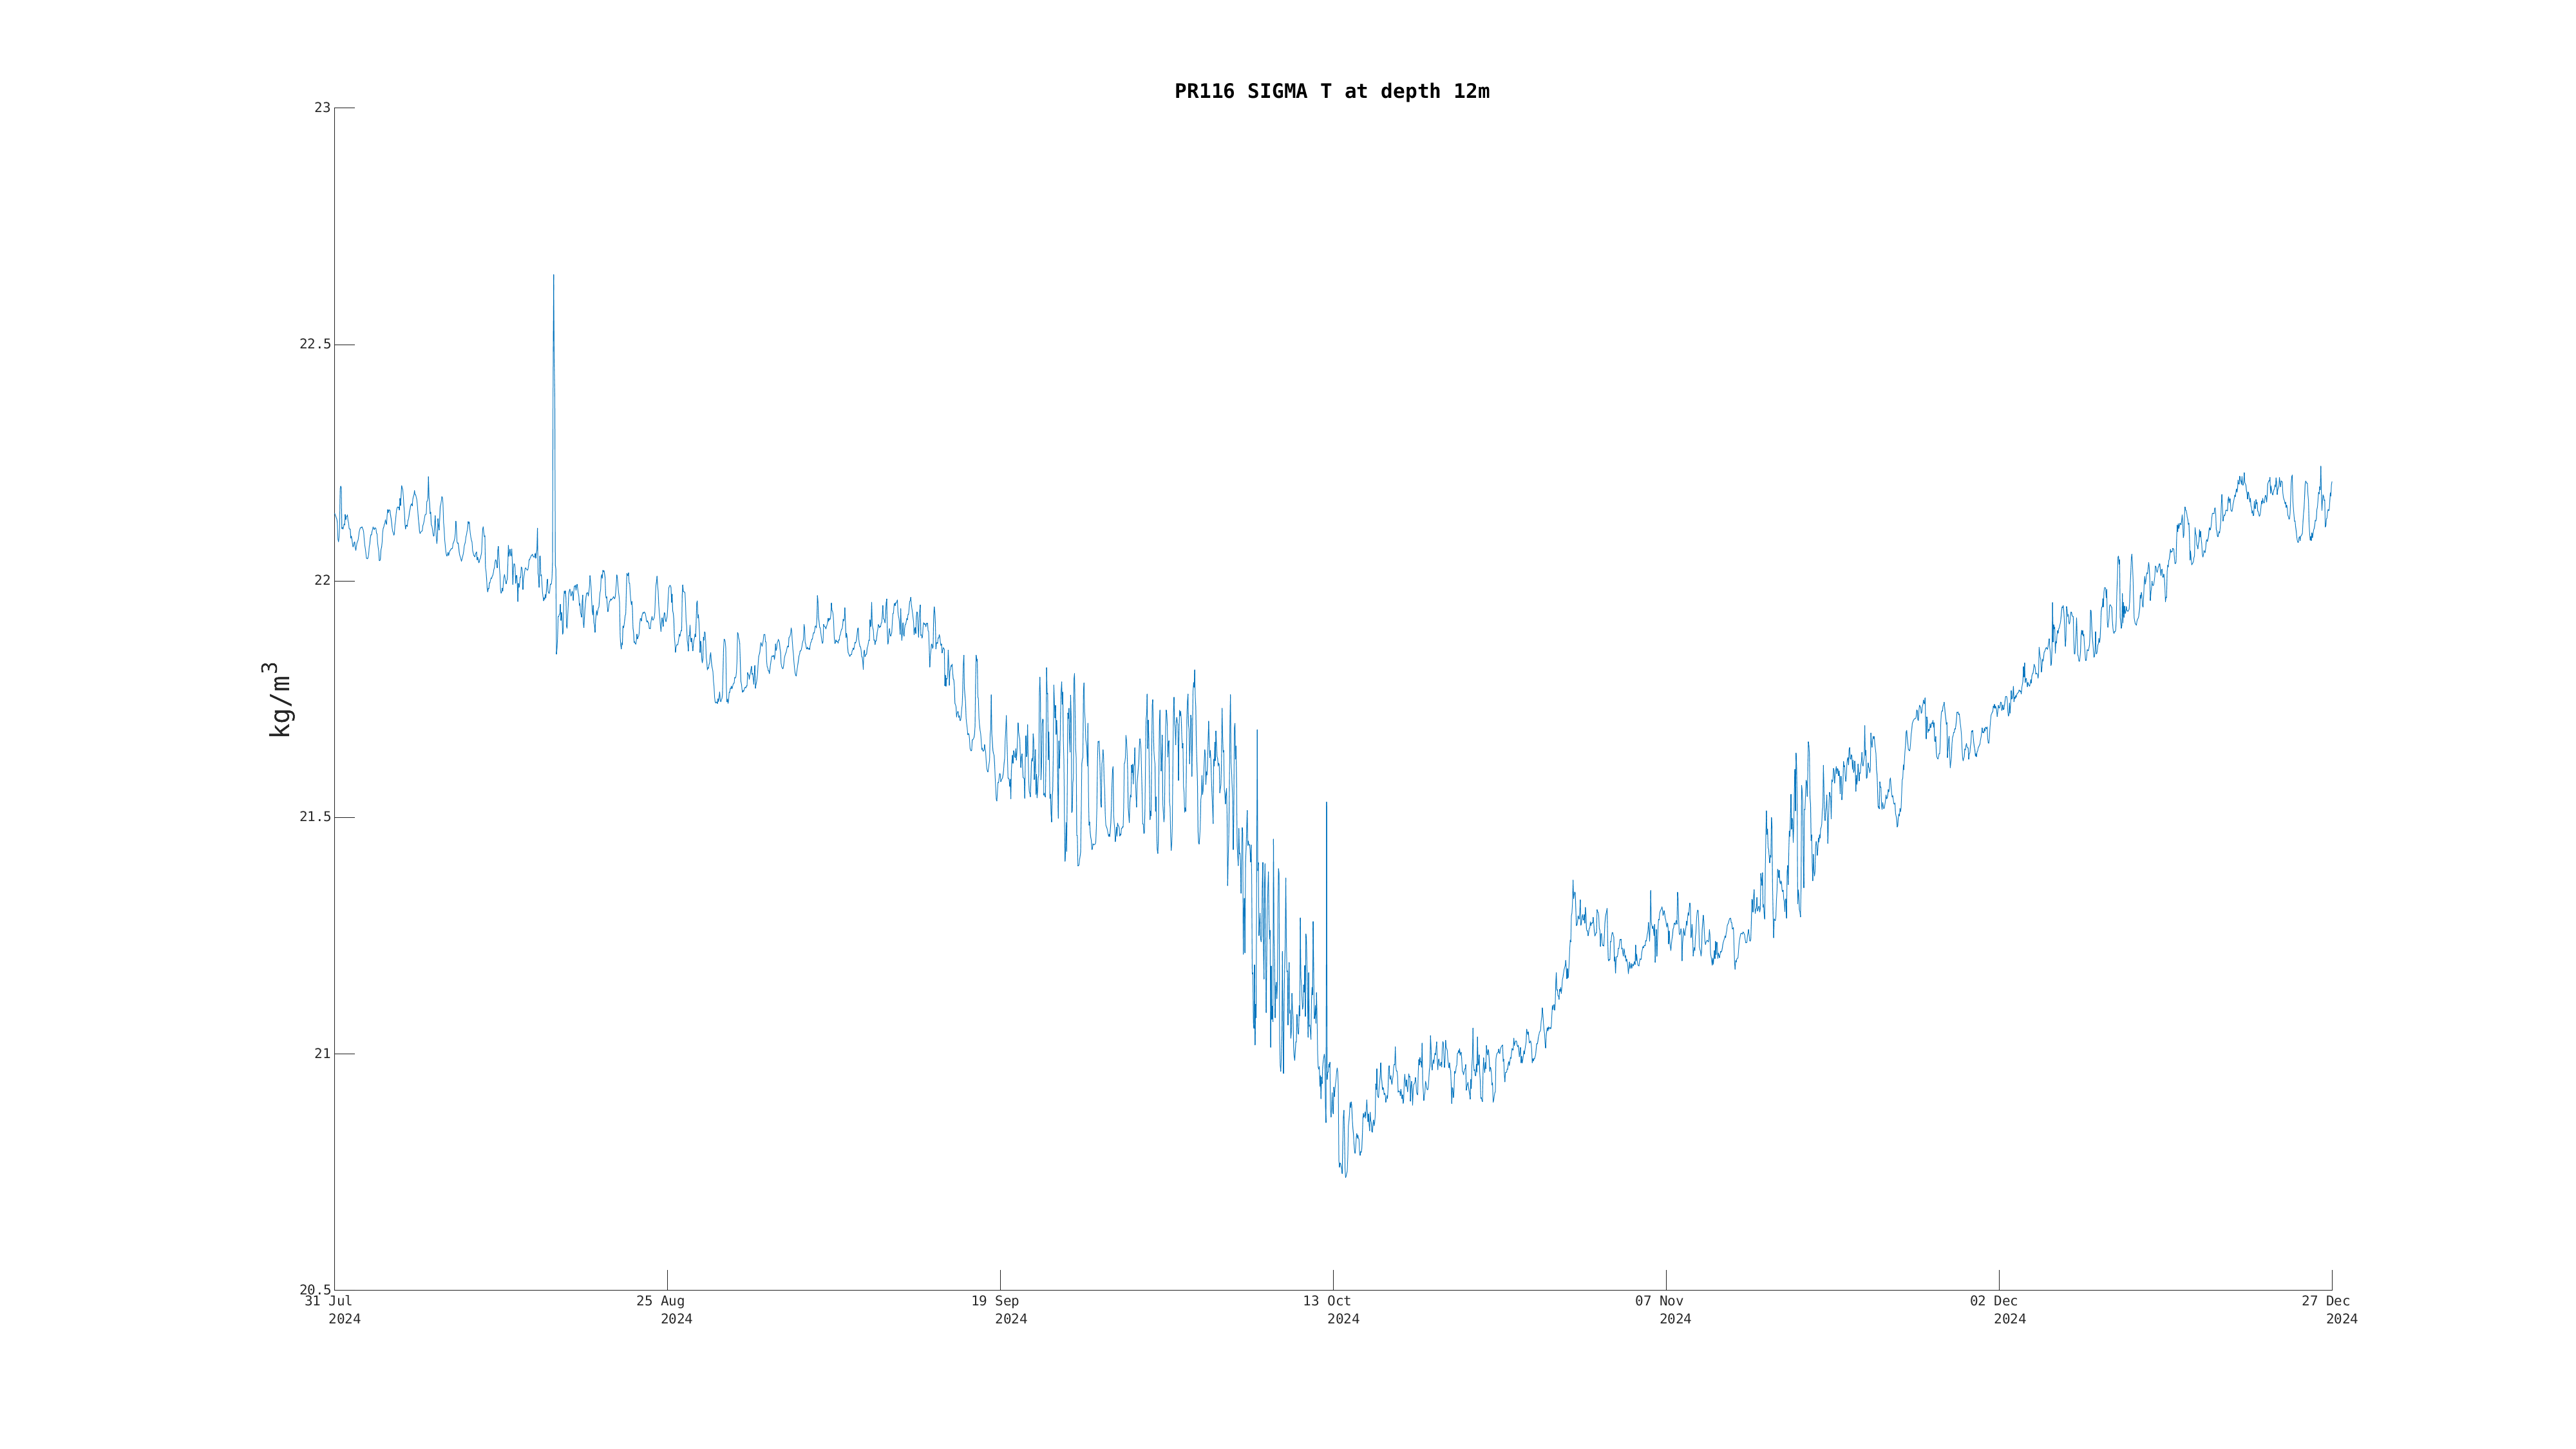
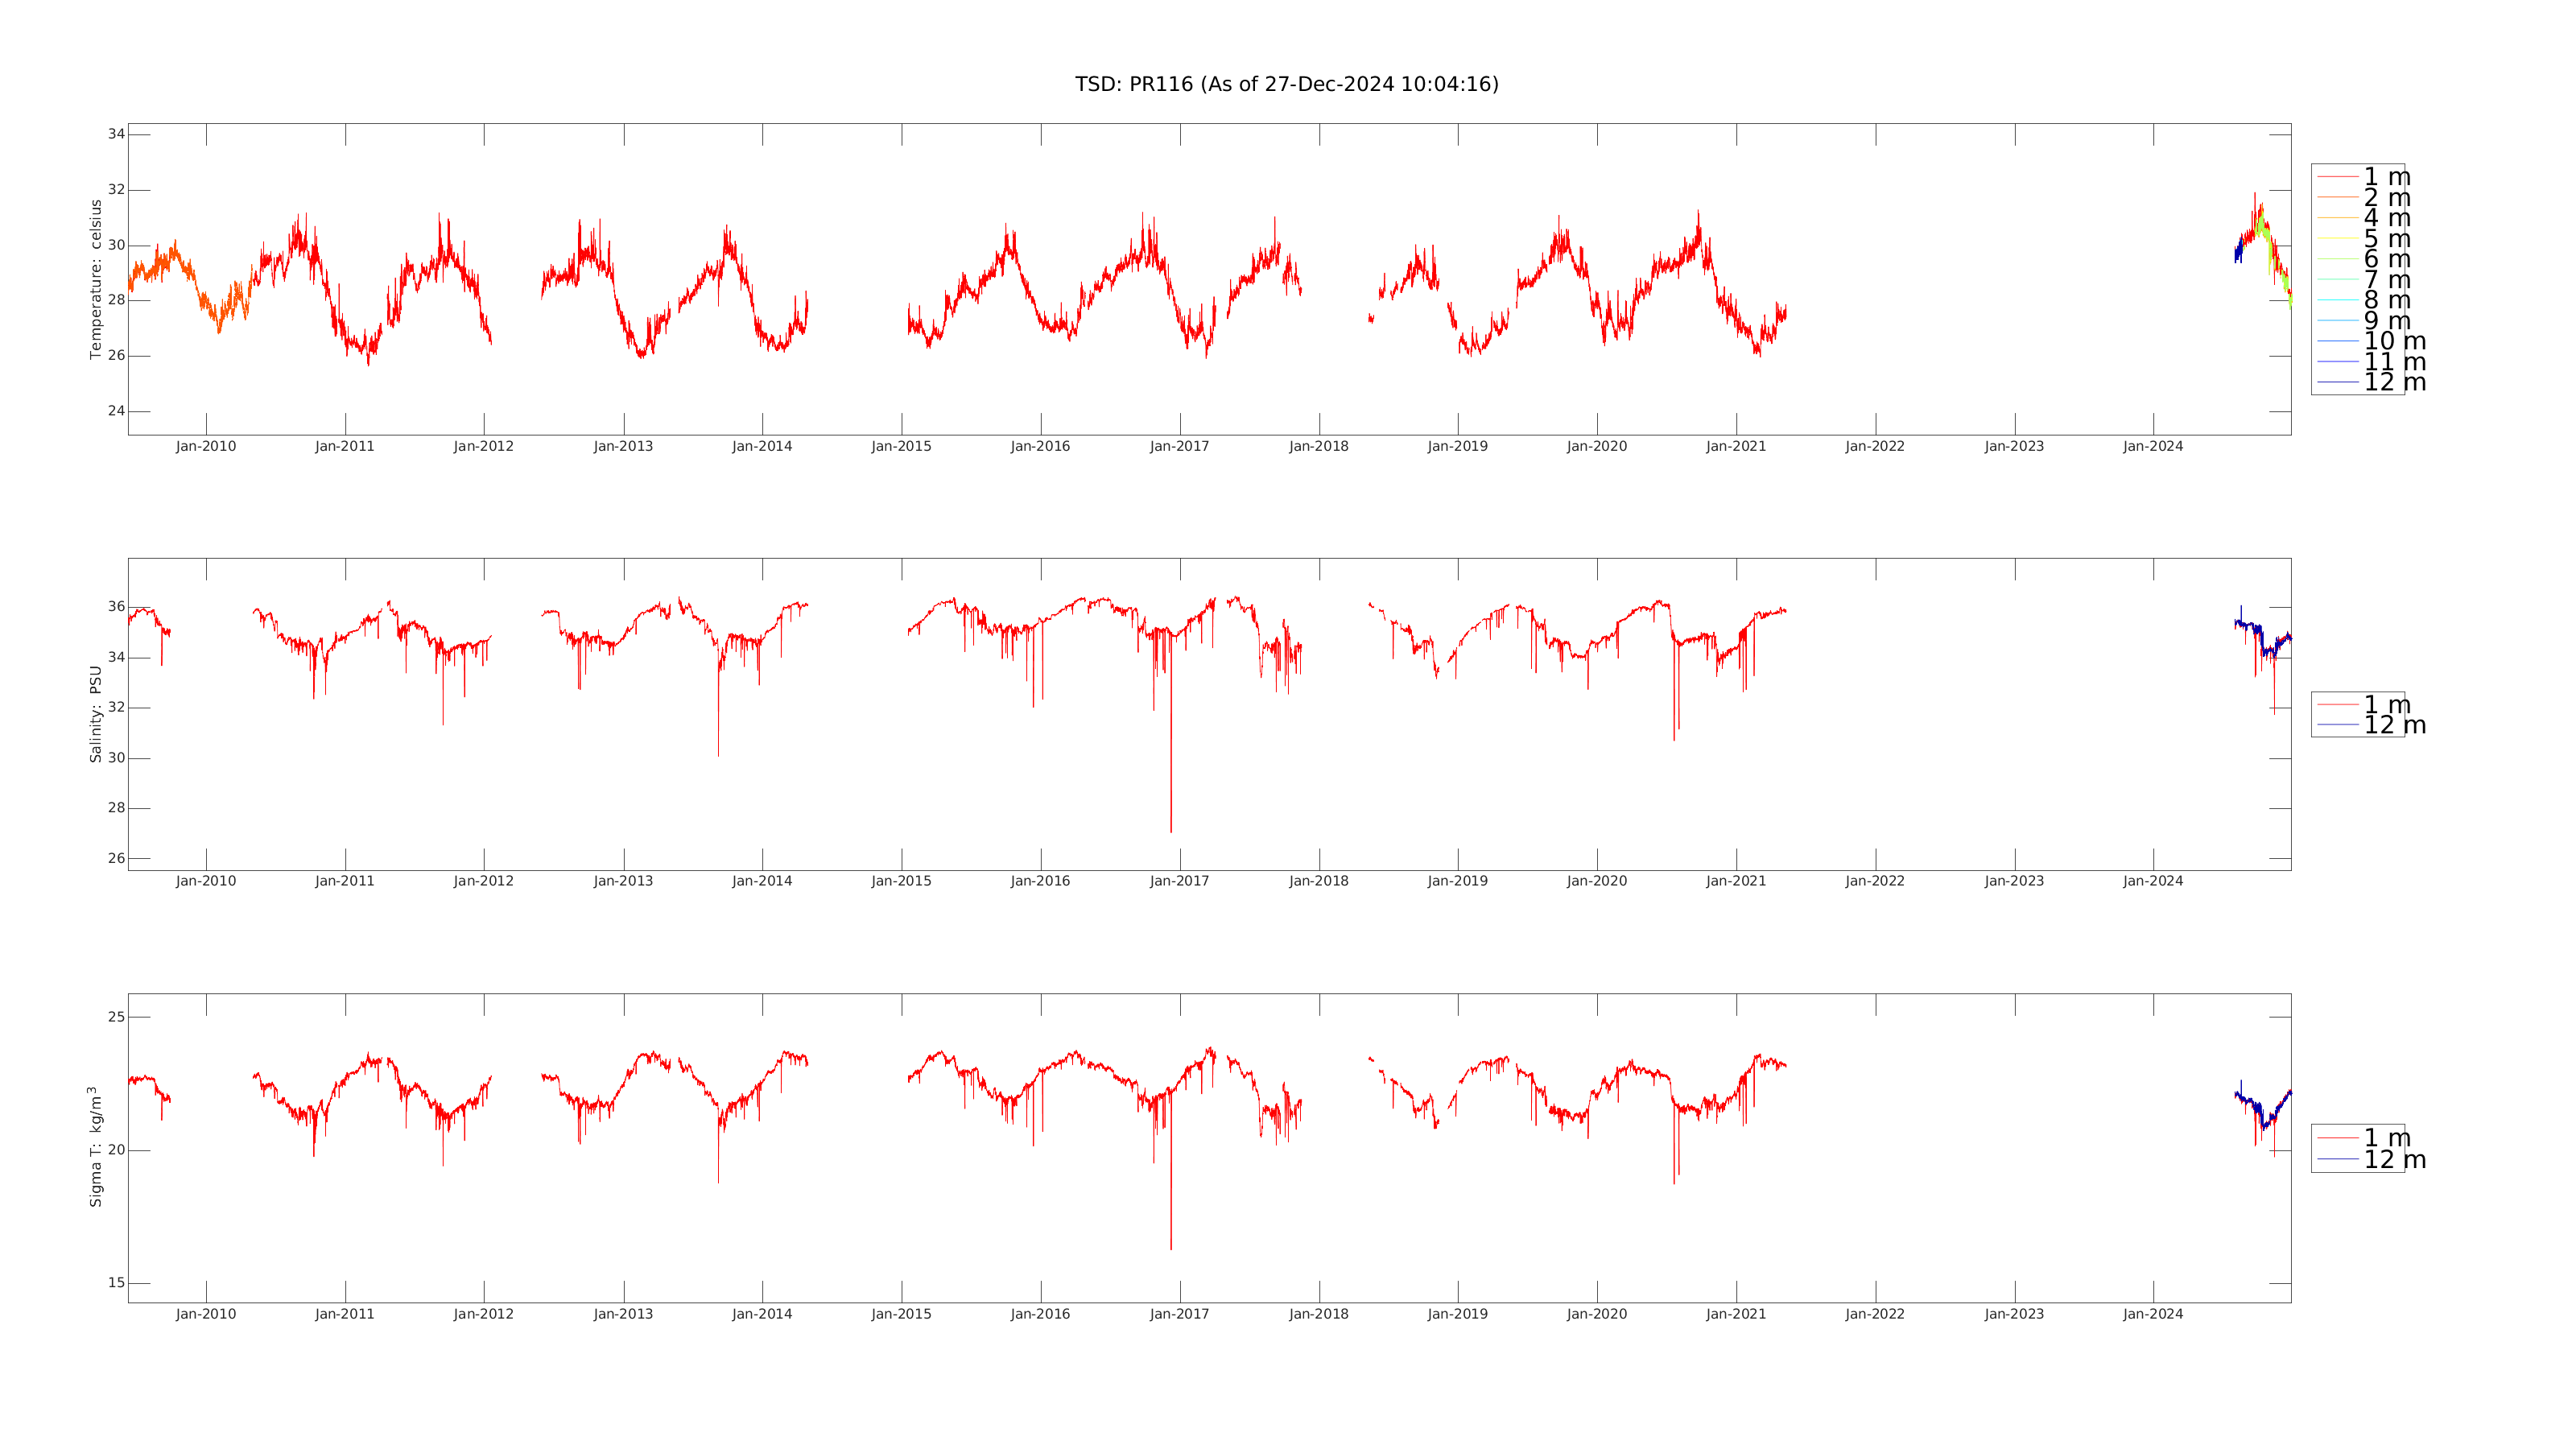 Temperature, Salinity, Density:
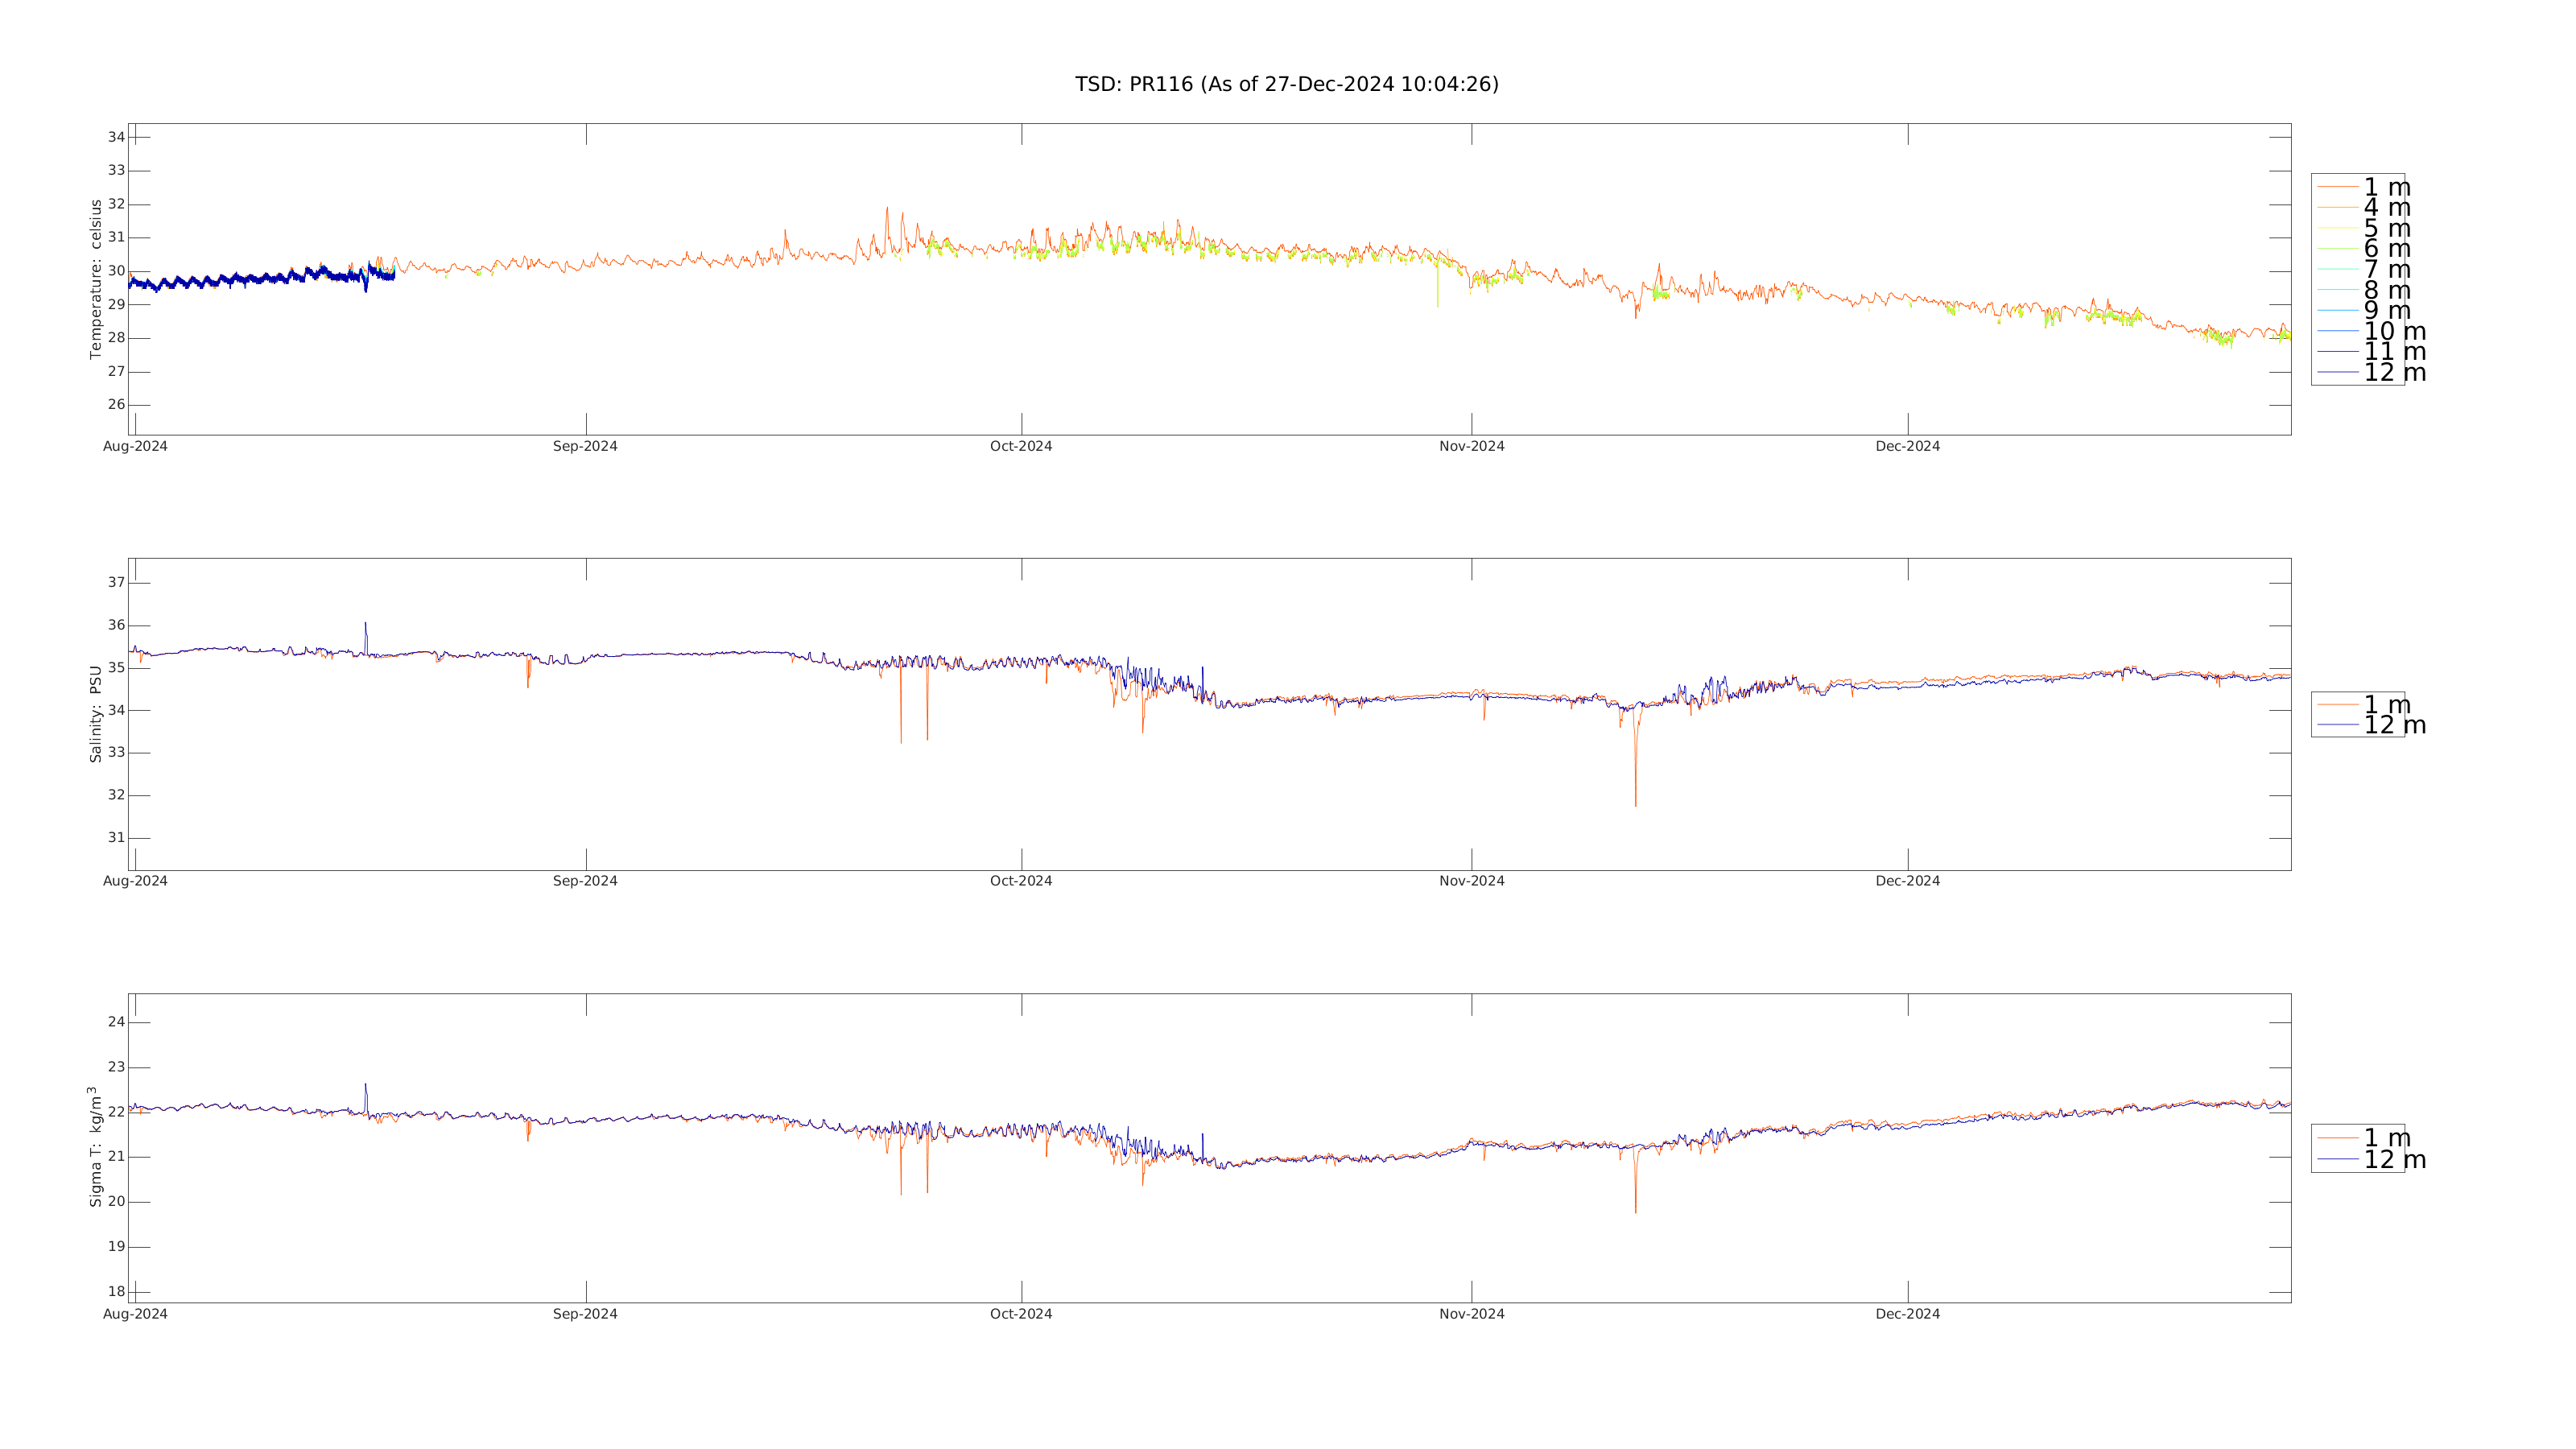 Temperature, Salinity, Density (Deployment Only):
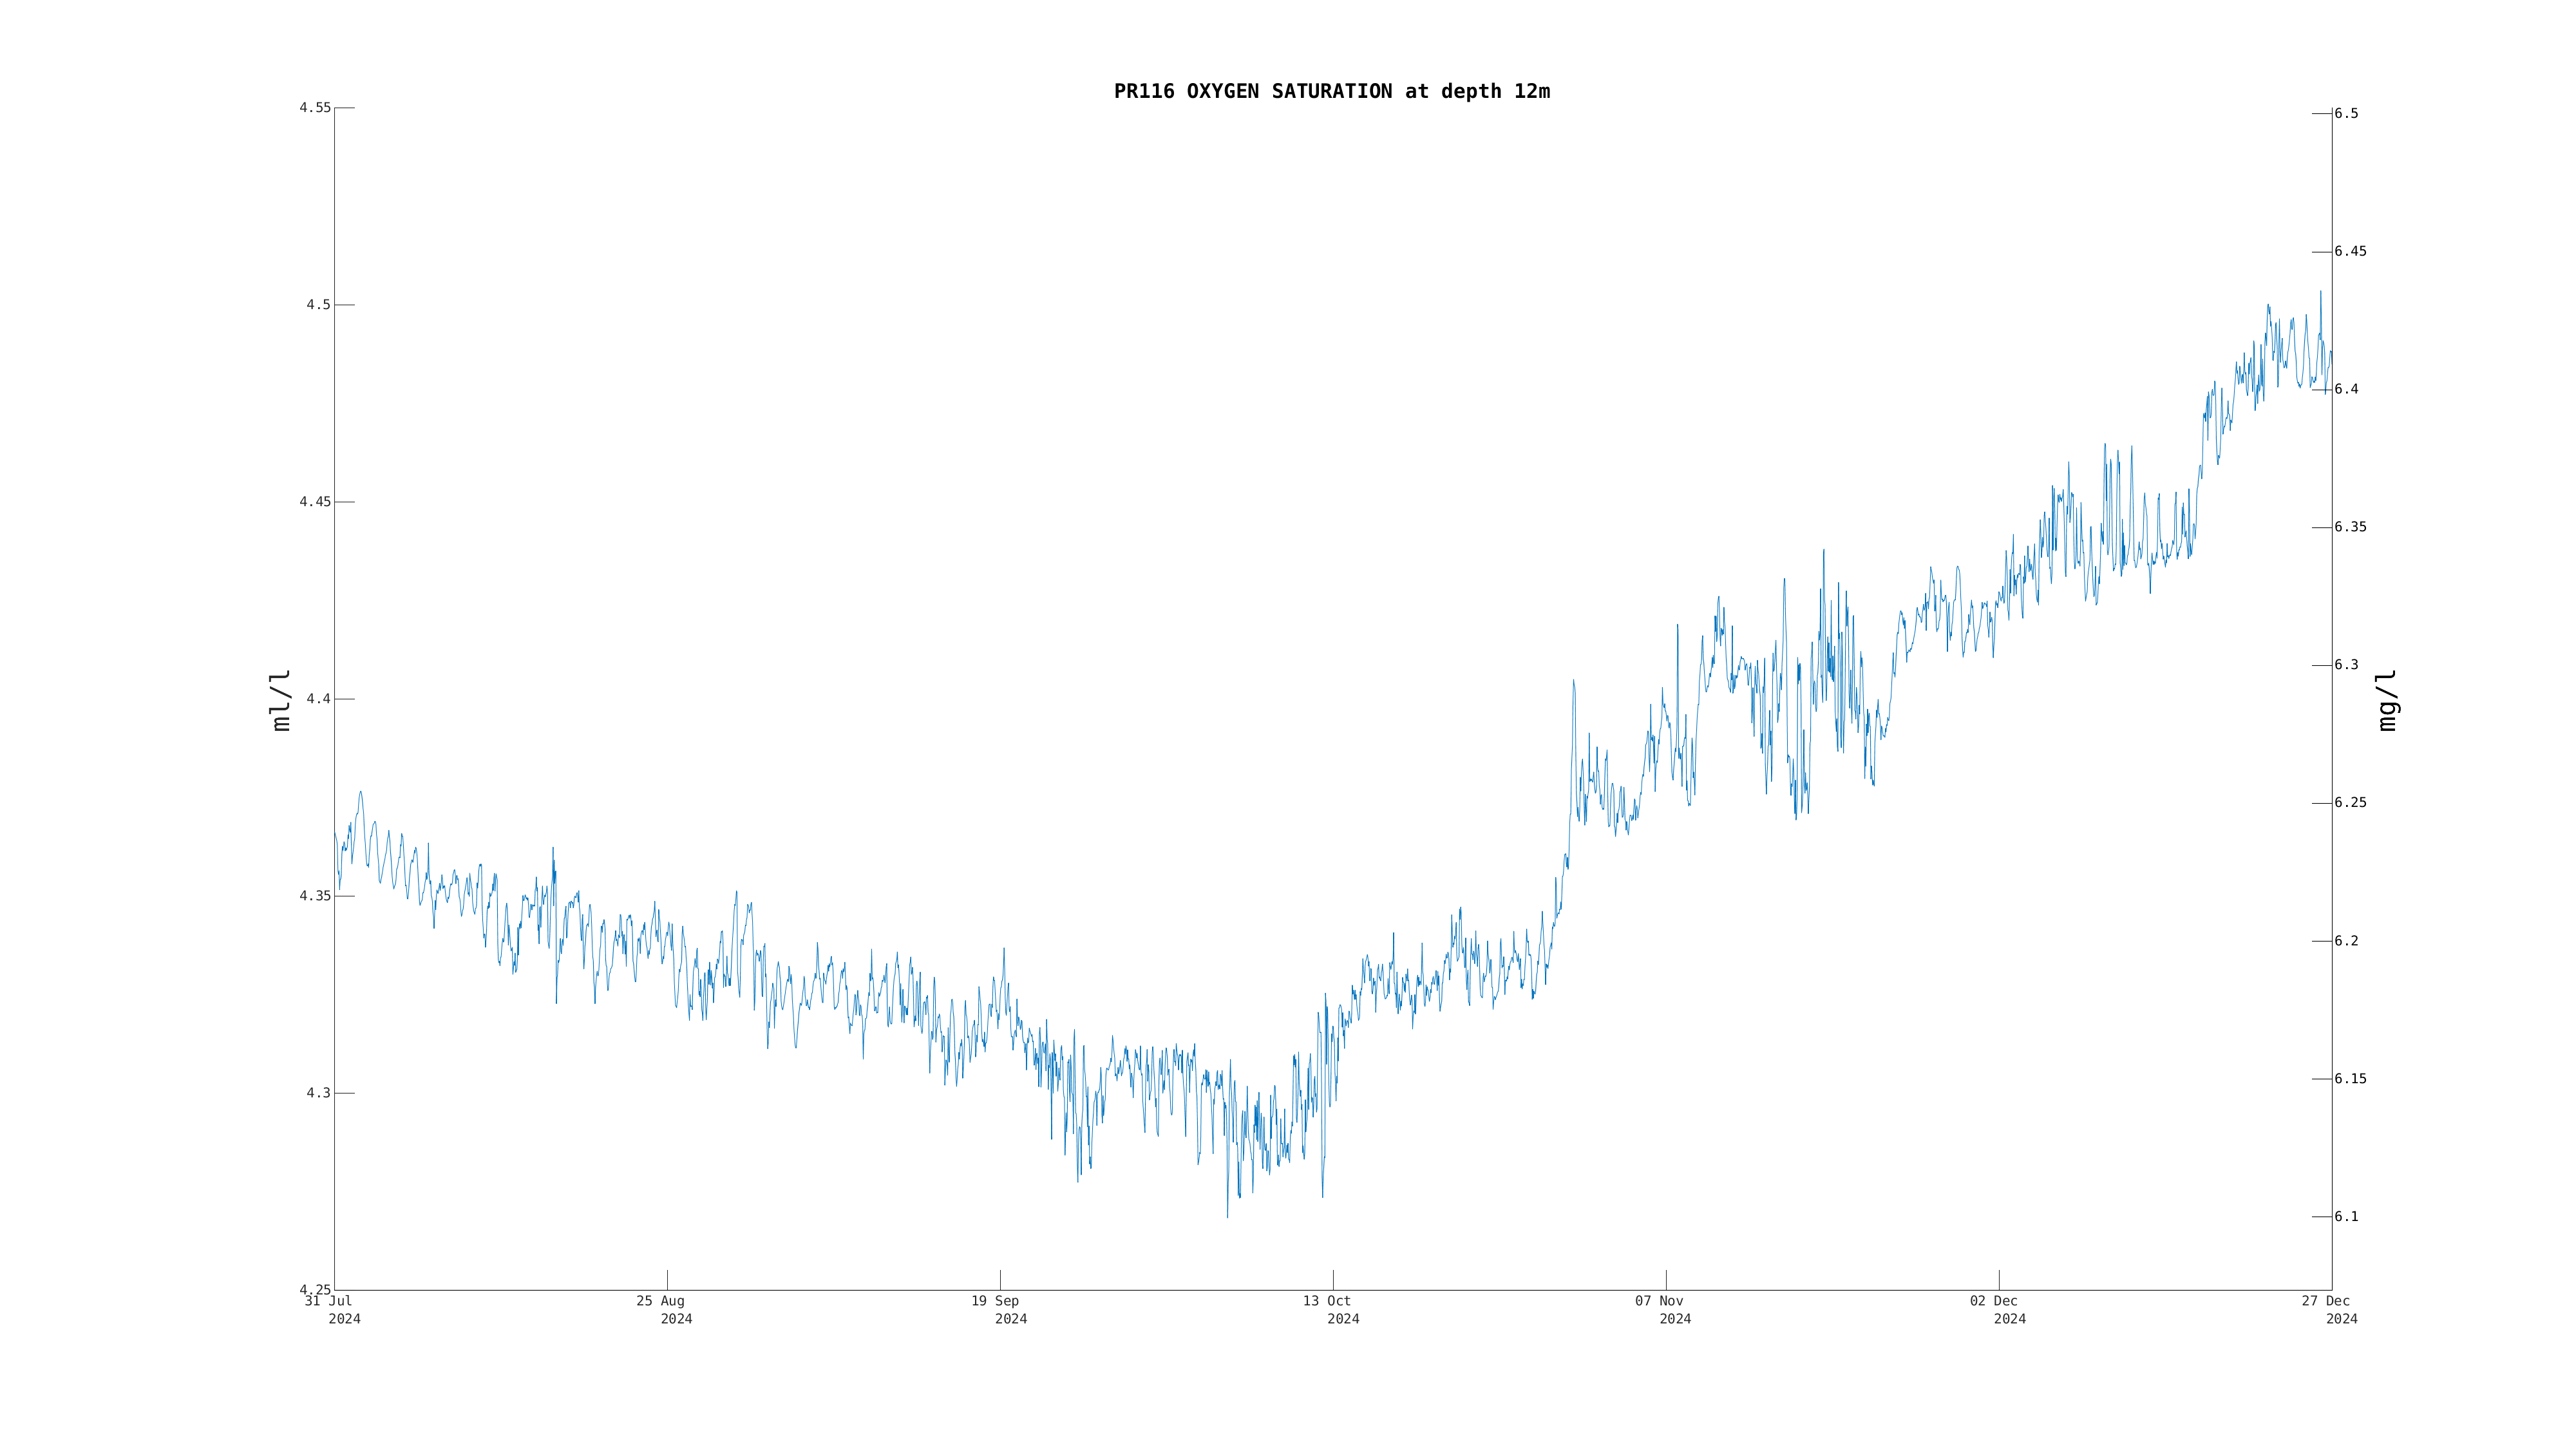
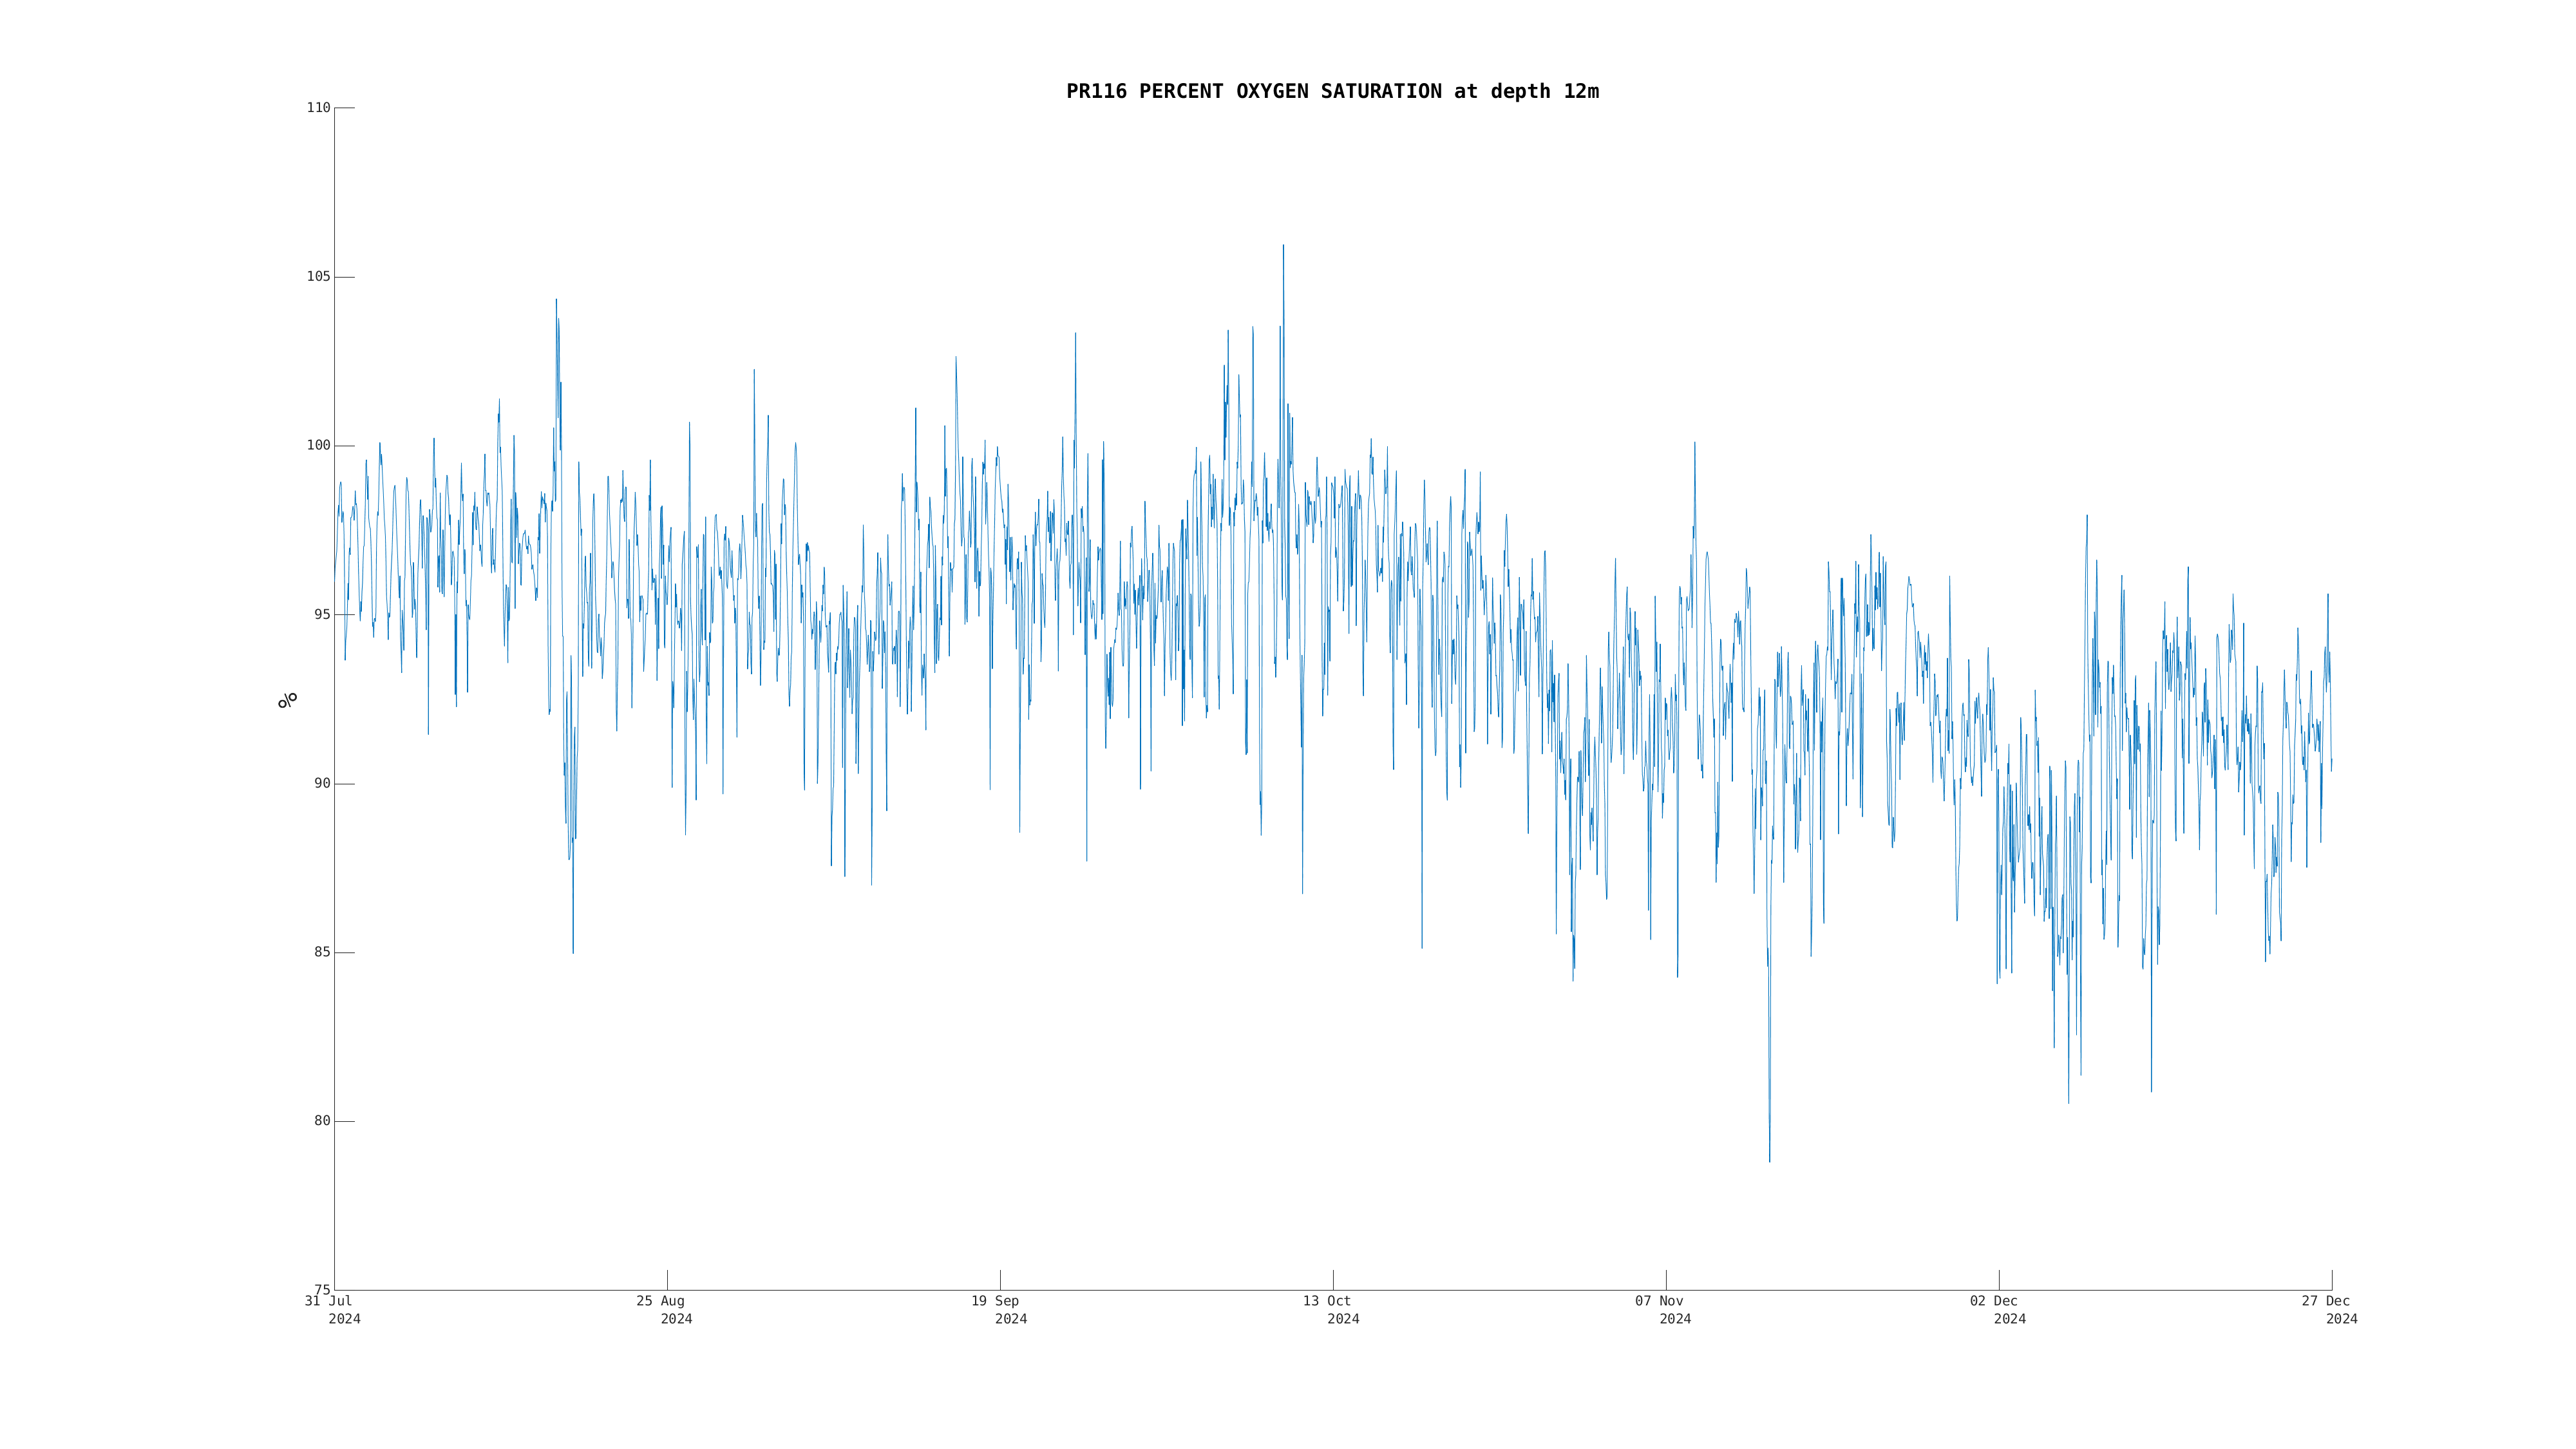
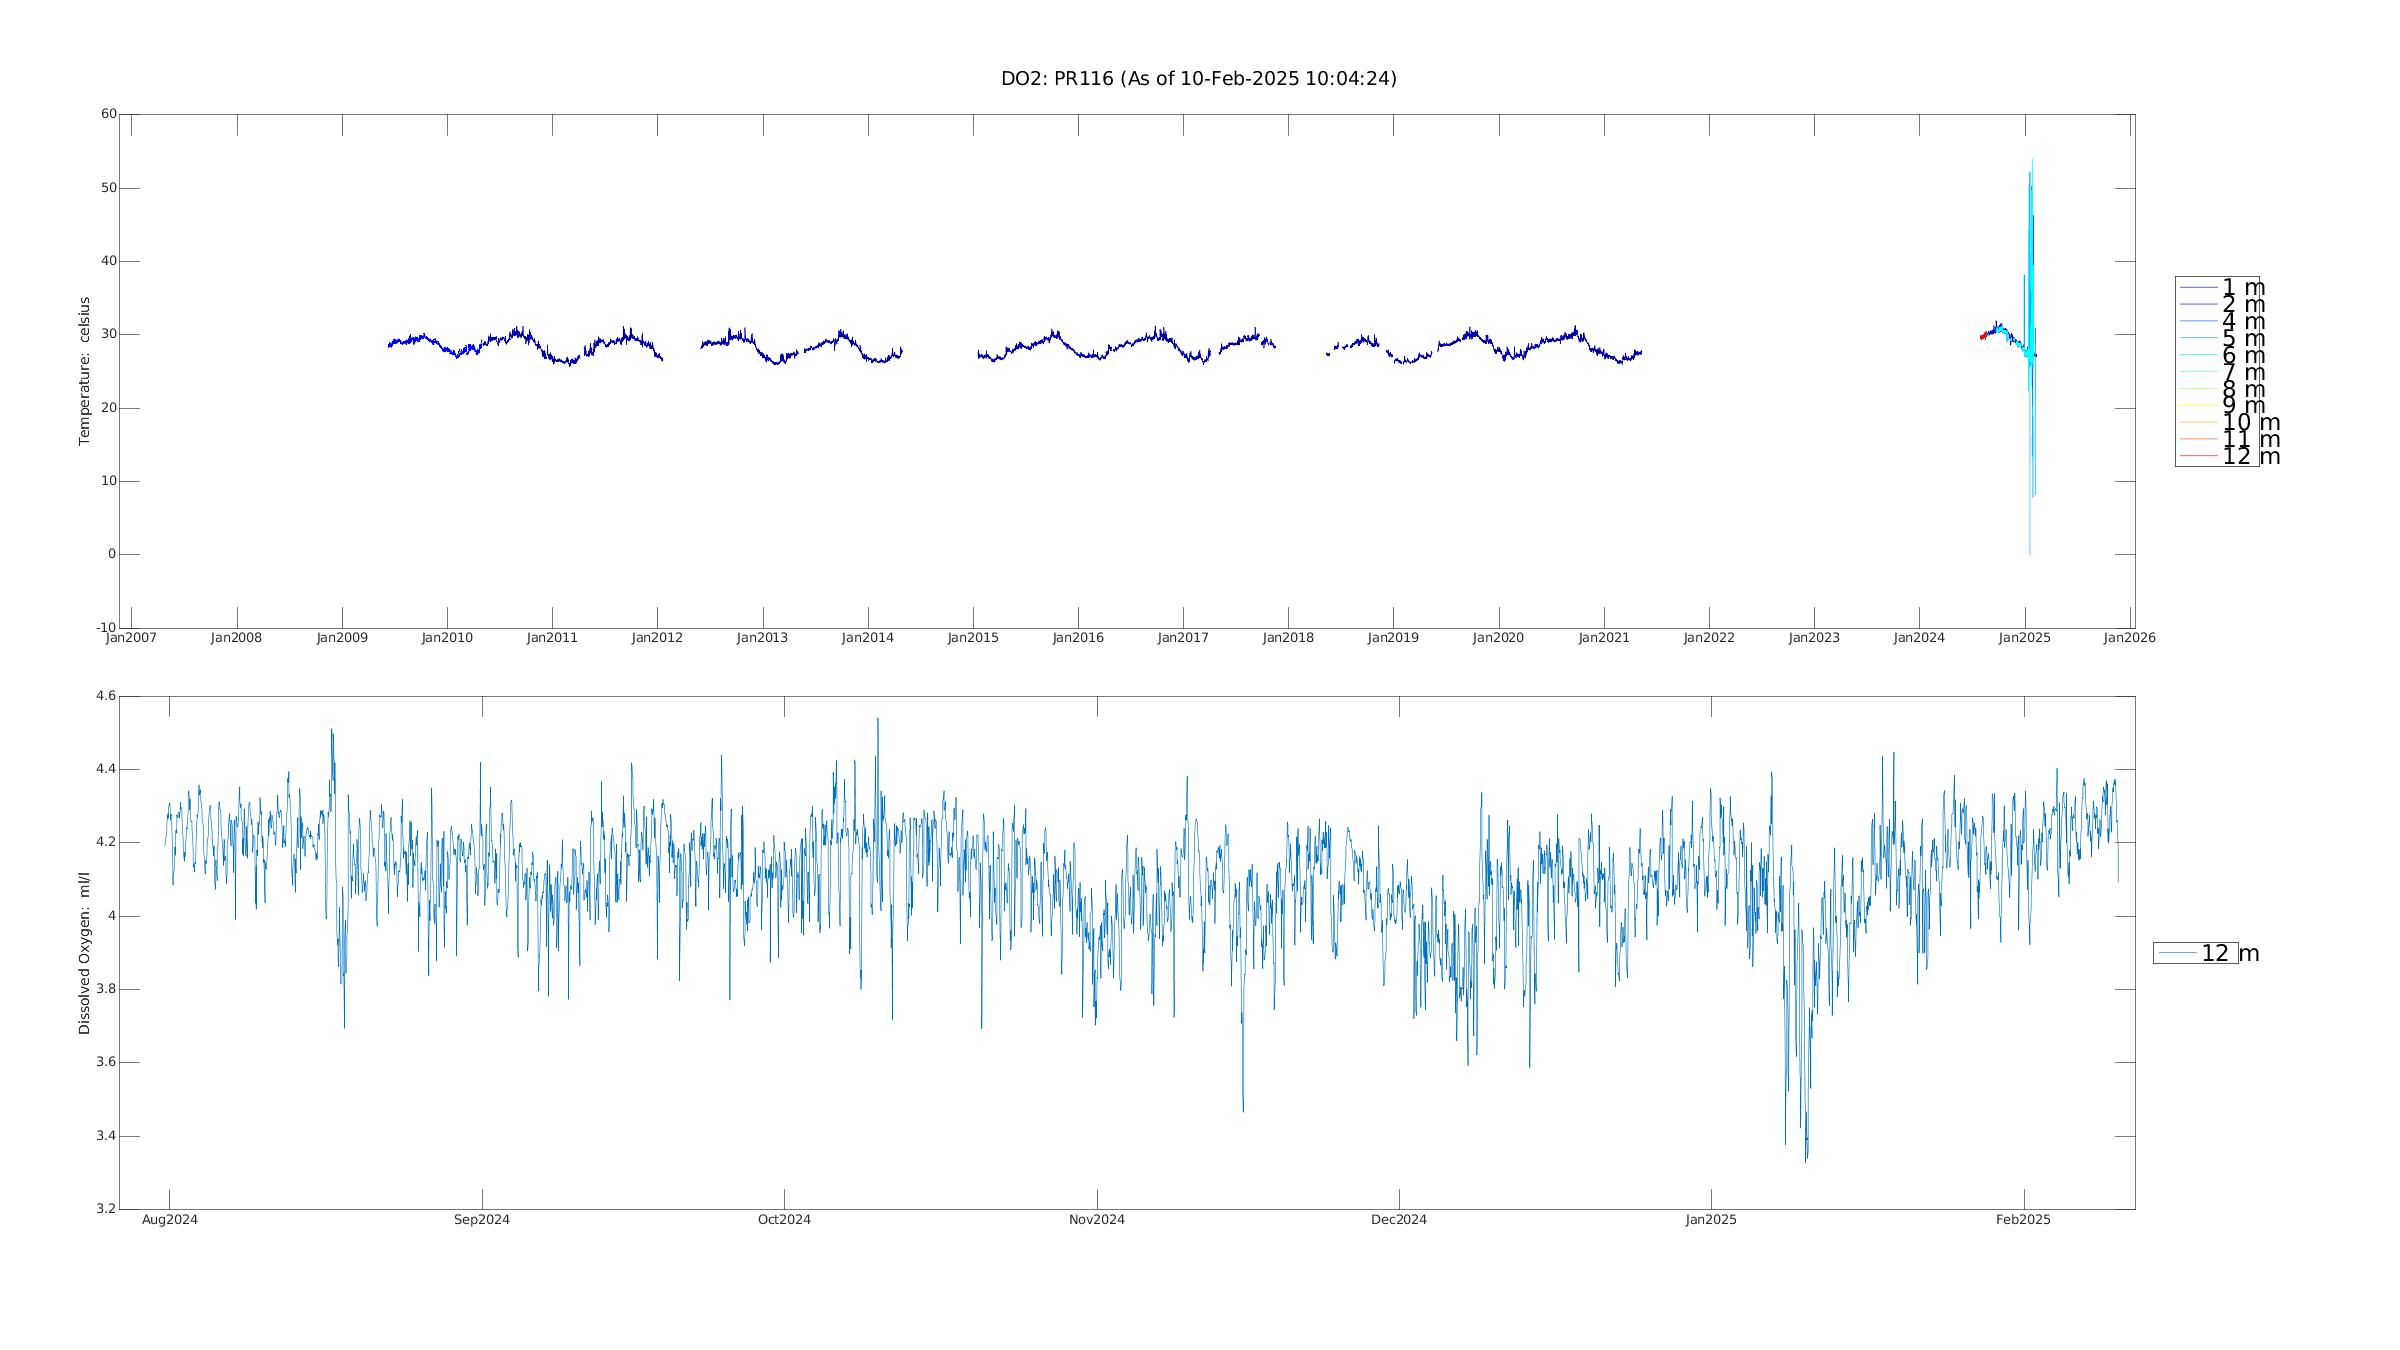 Temperature and Dissolved Oxygen:


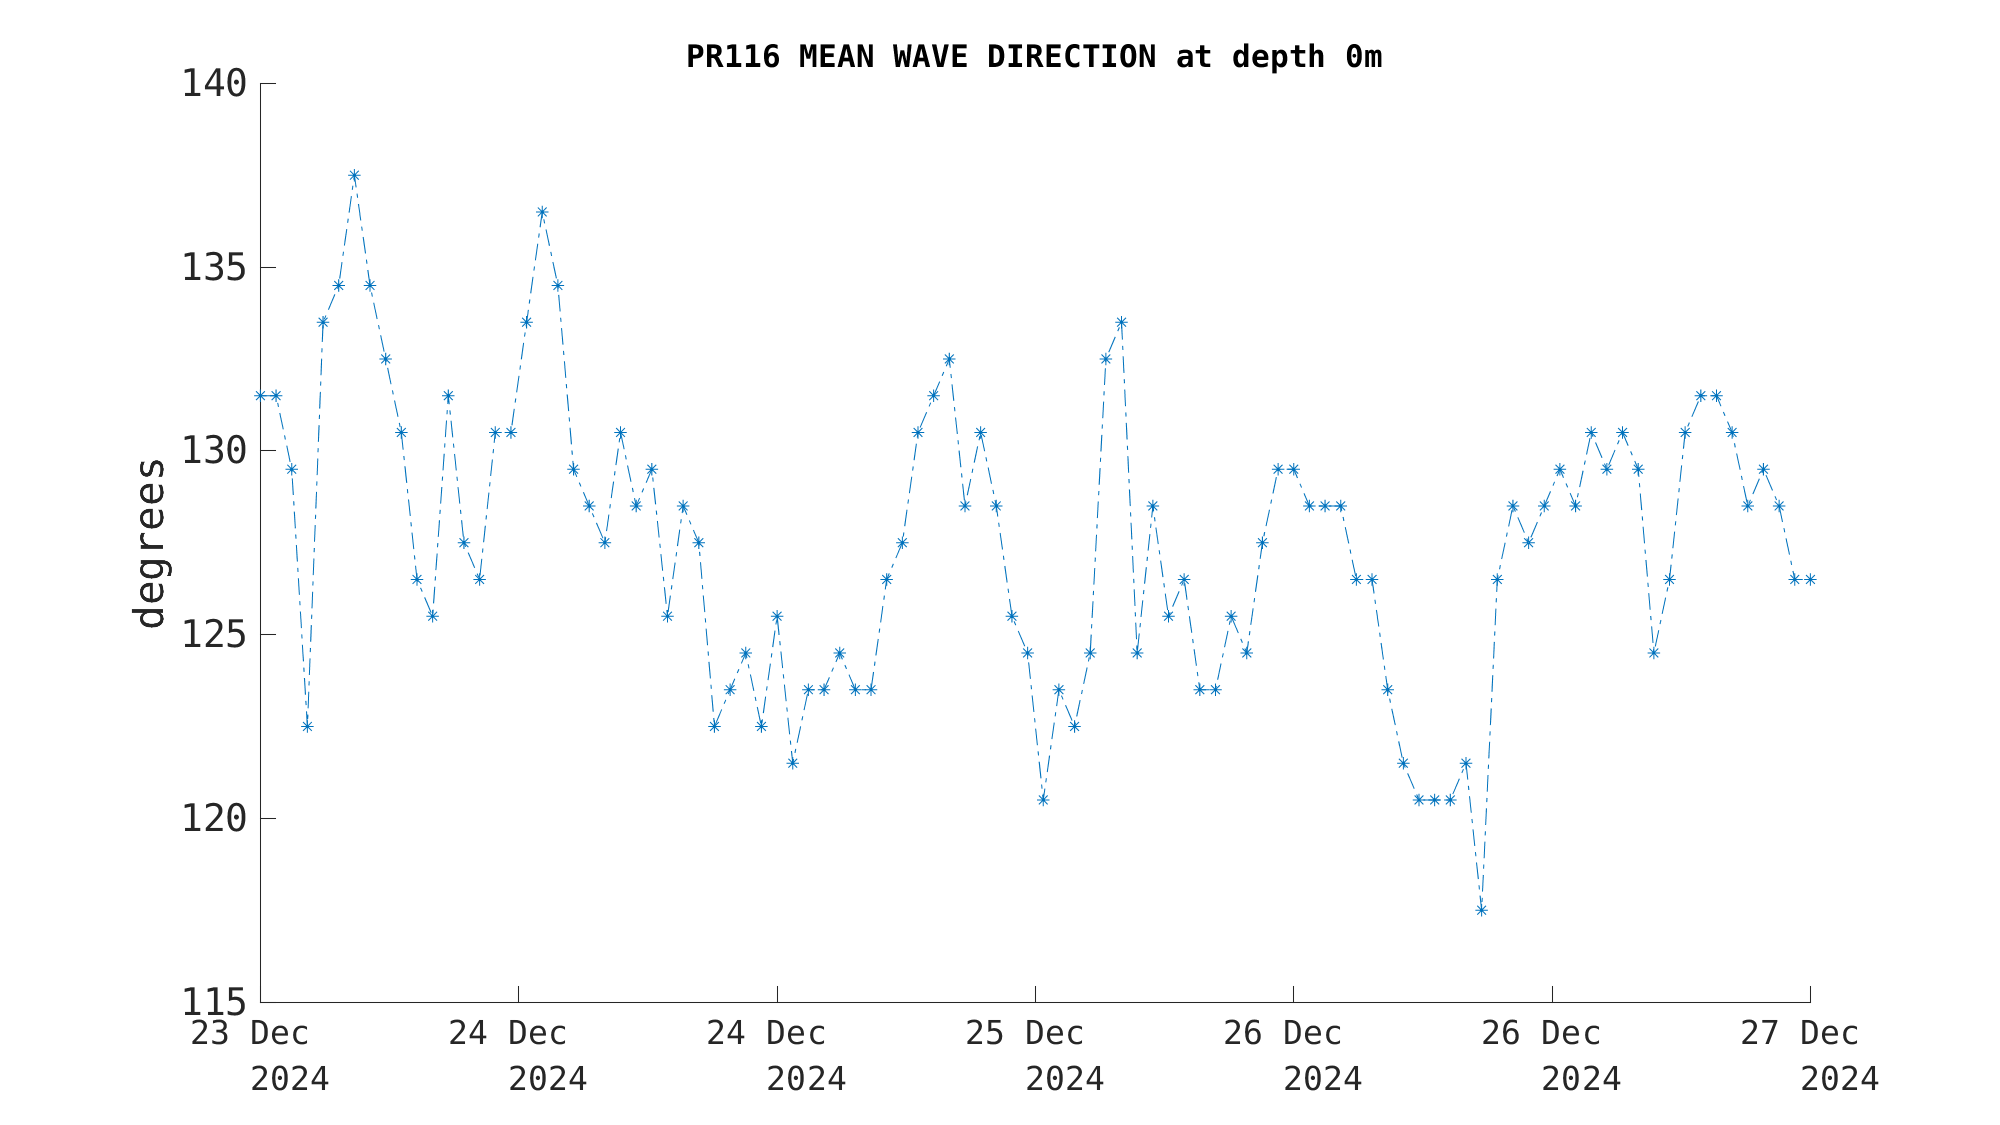
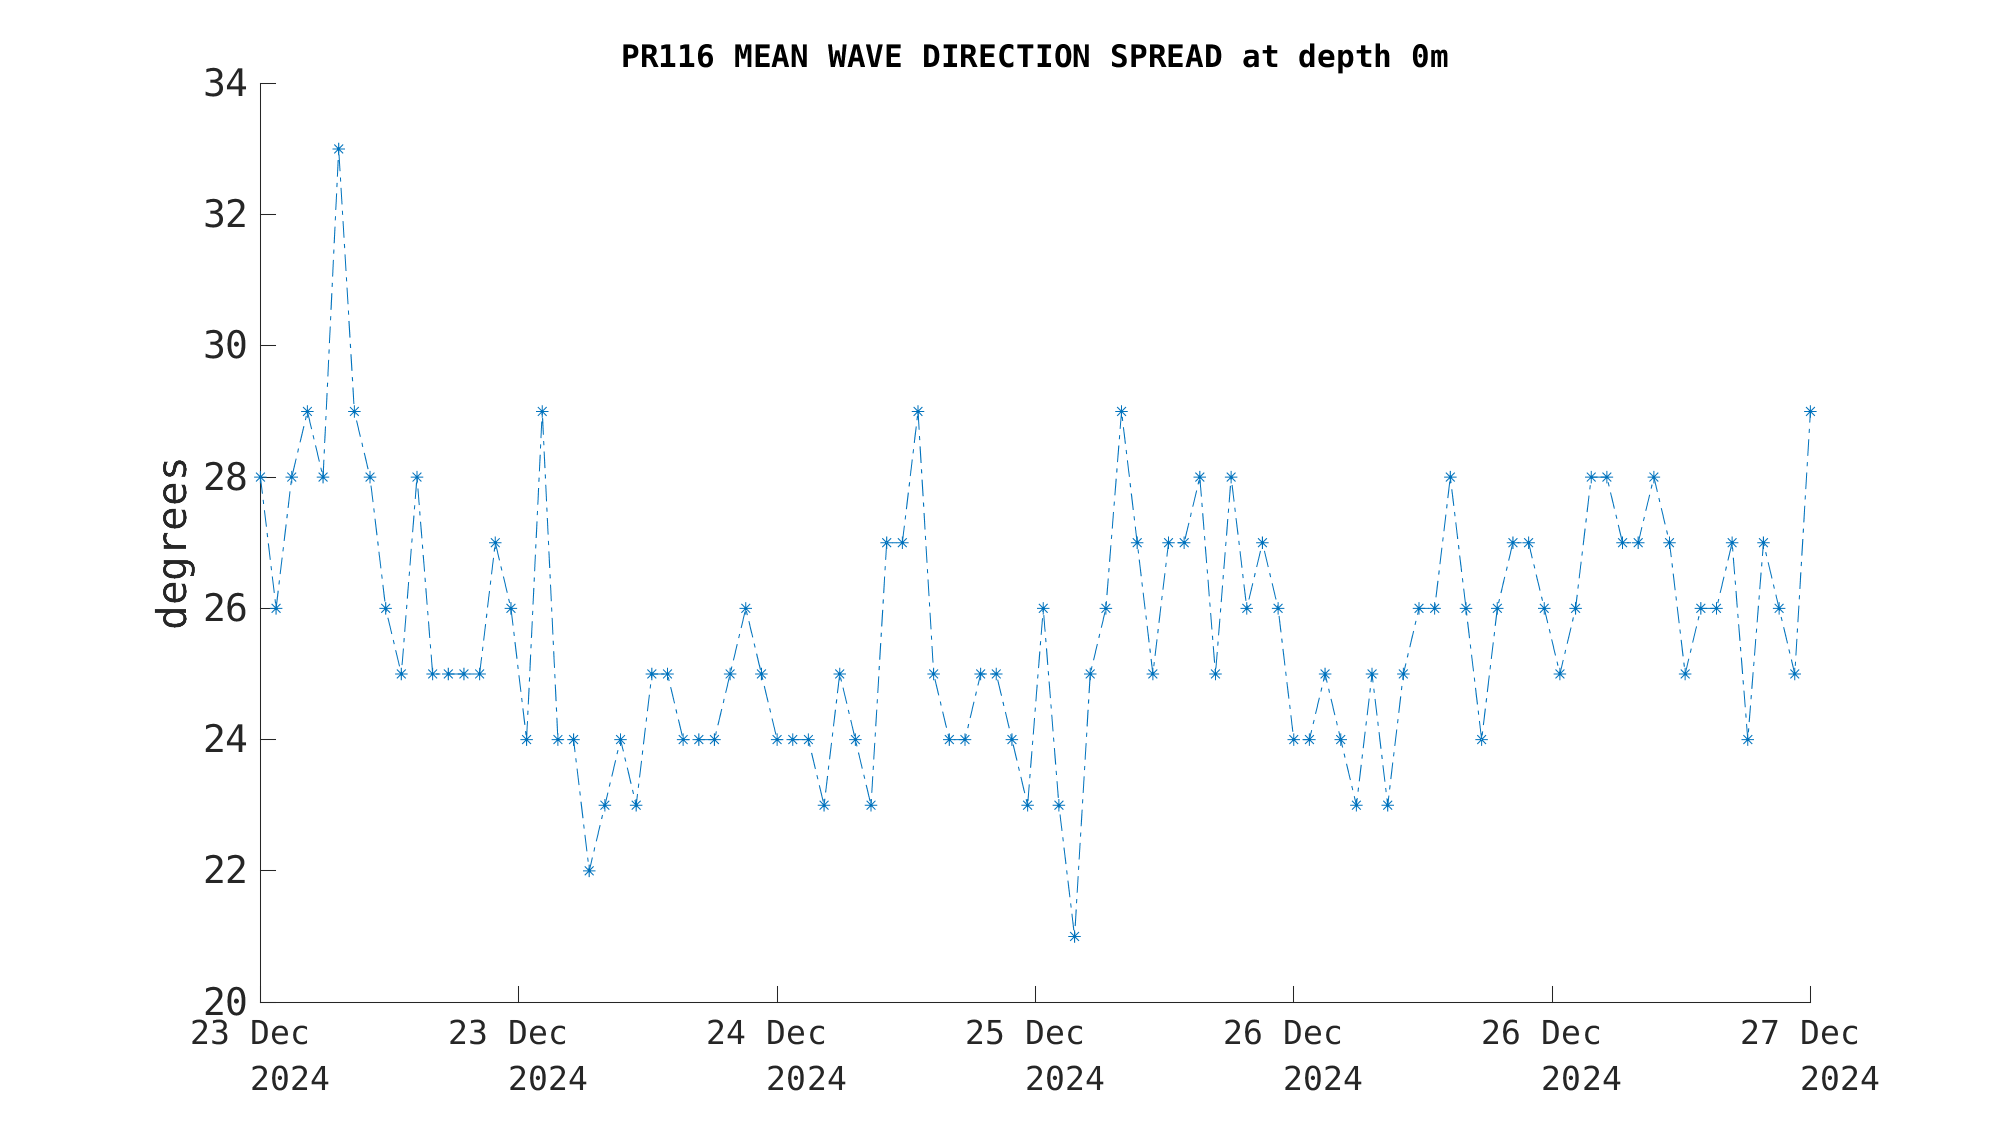
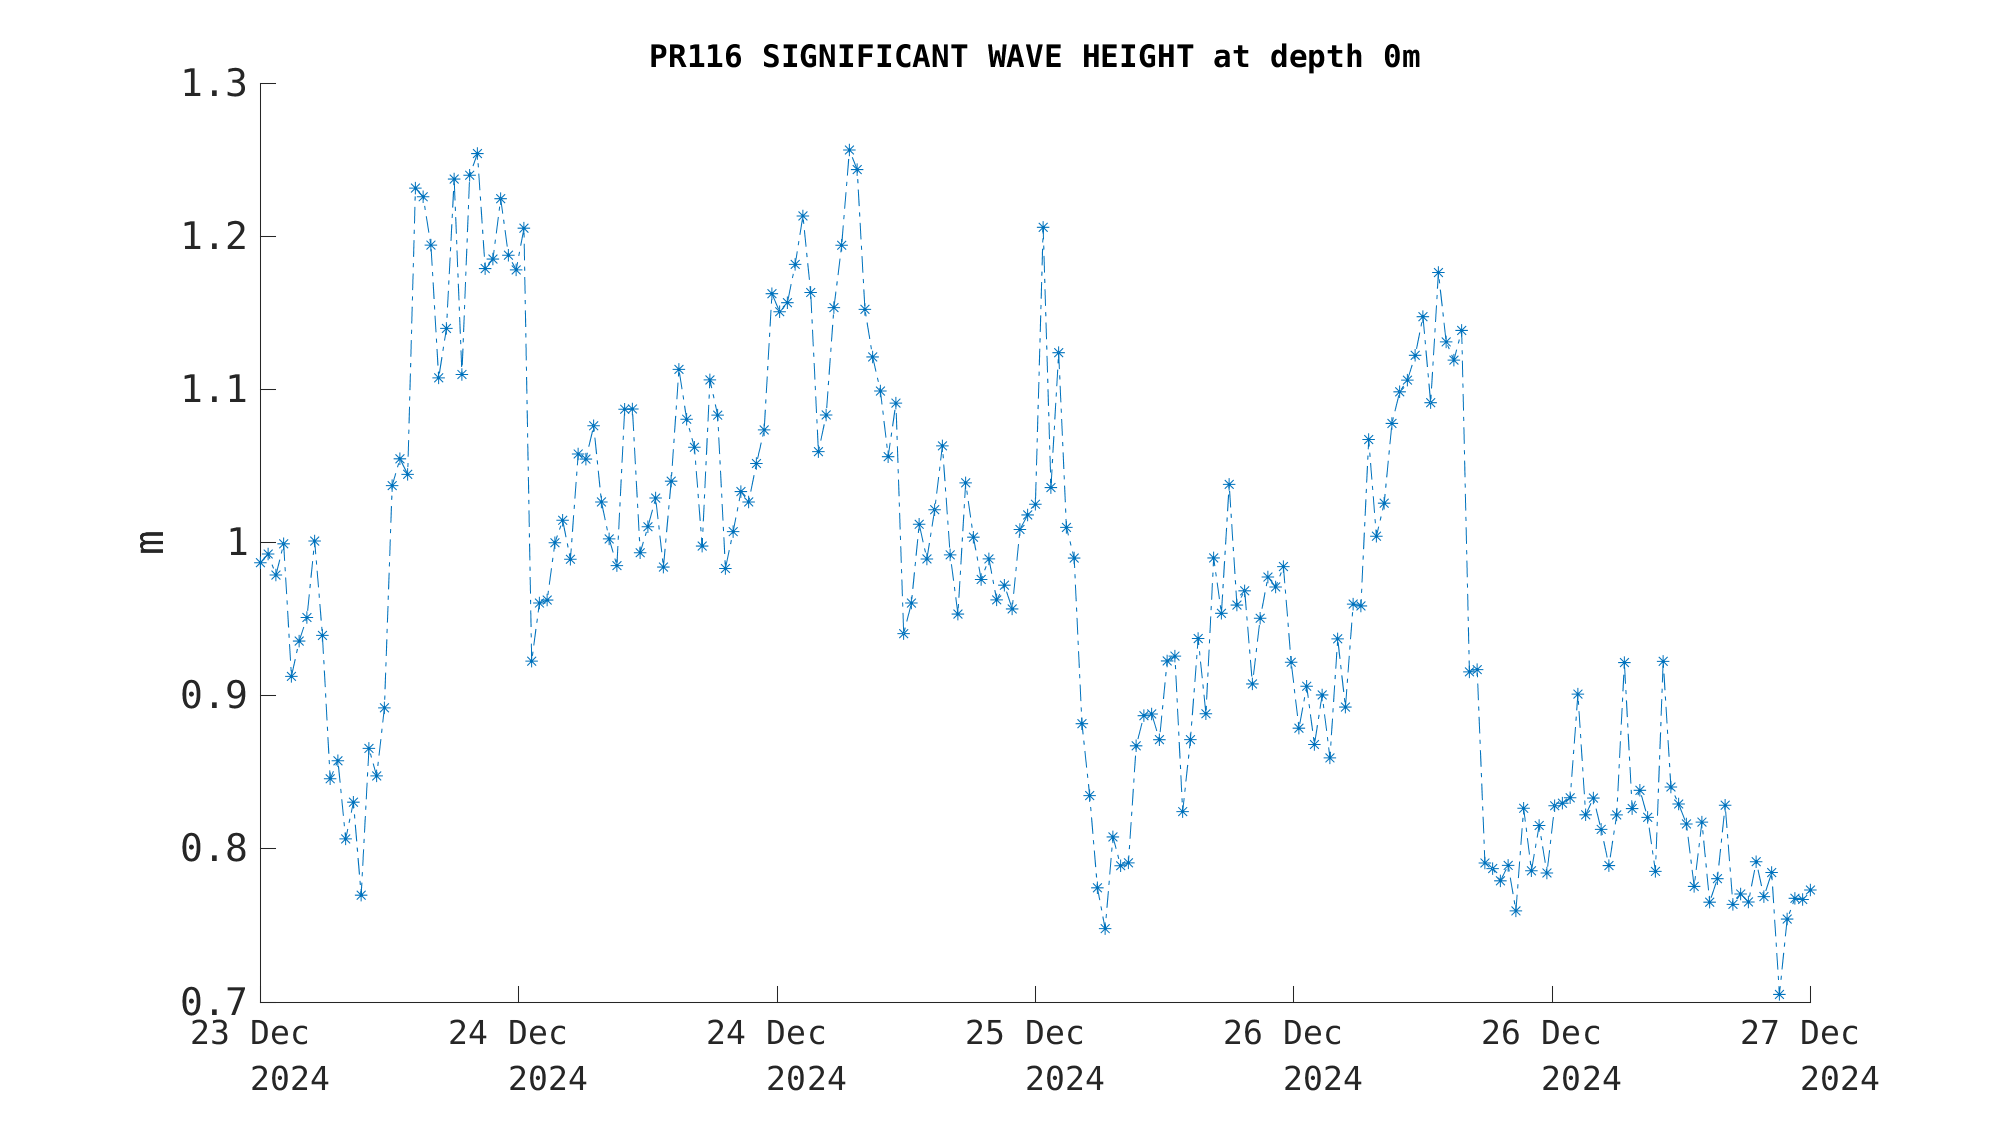

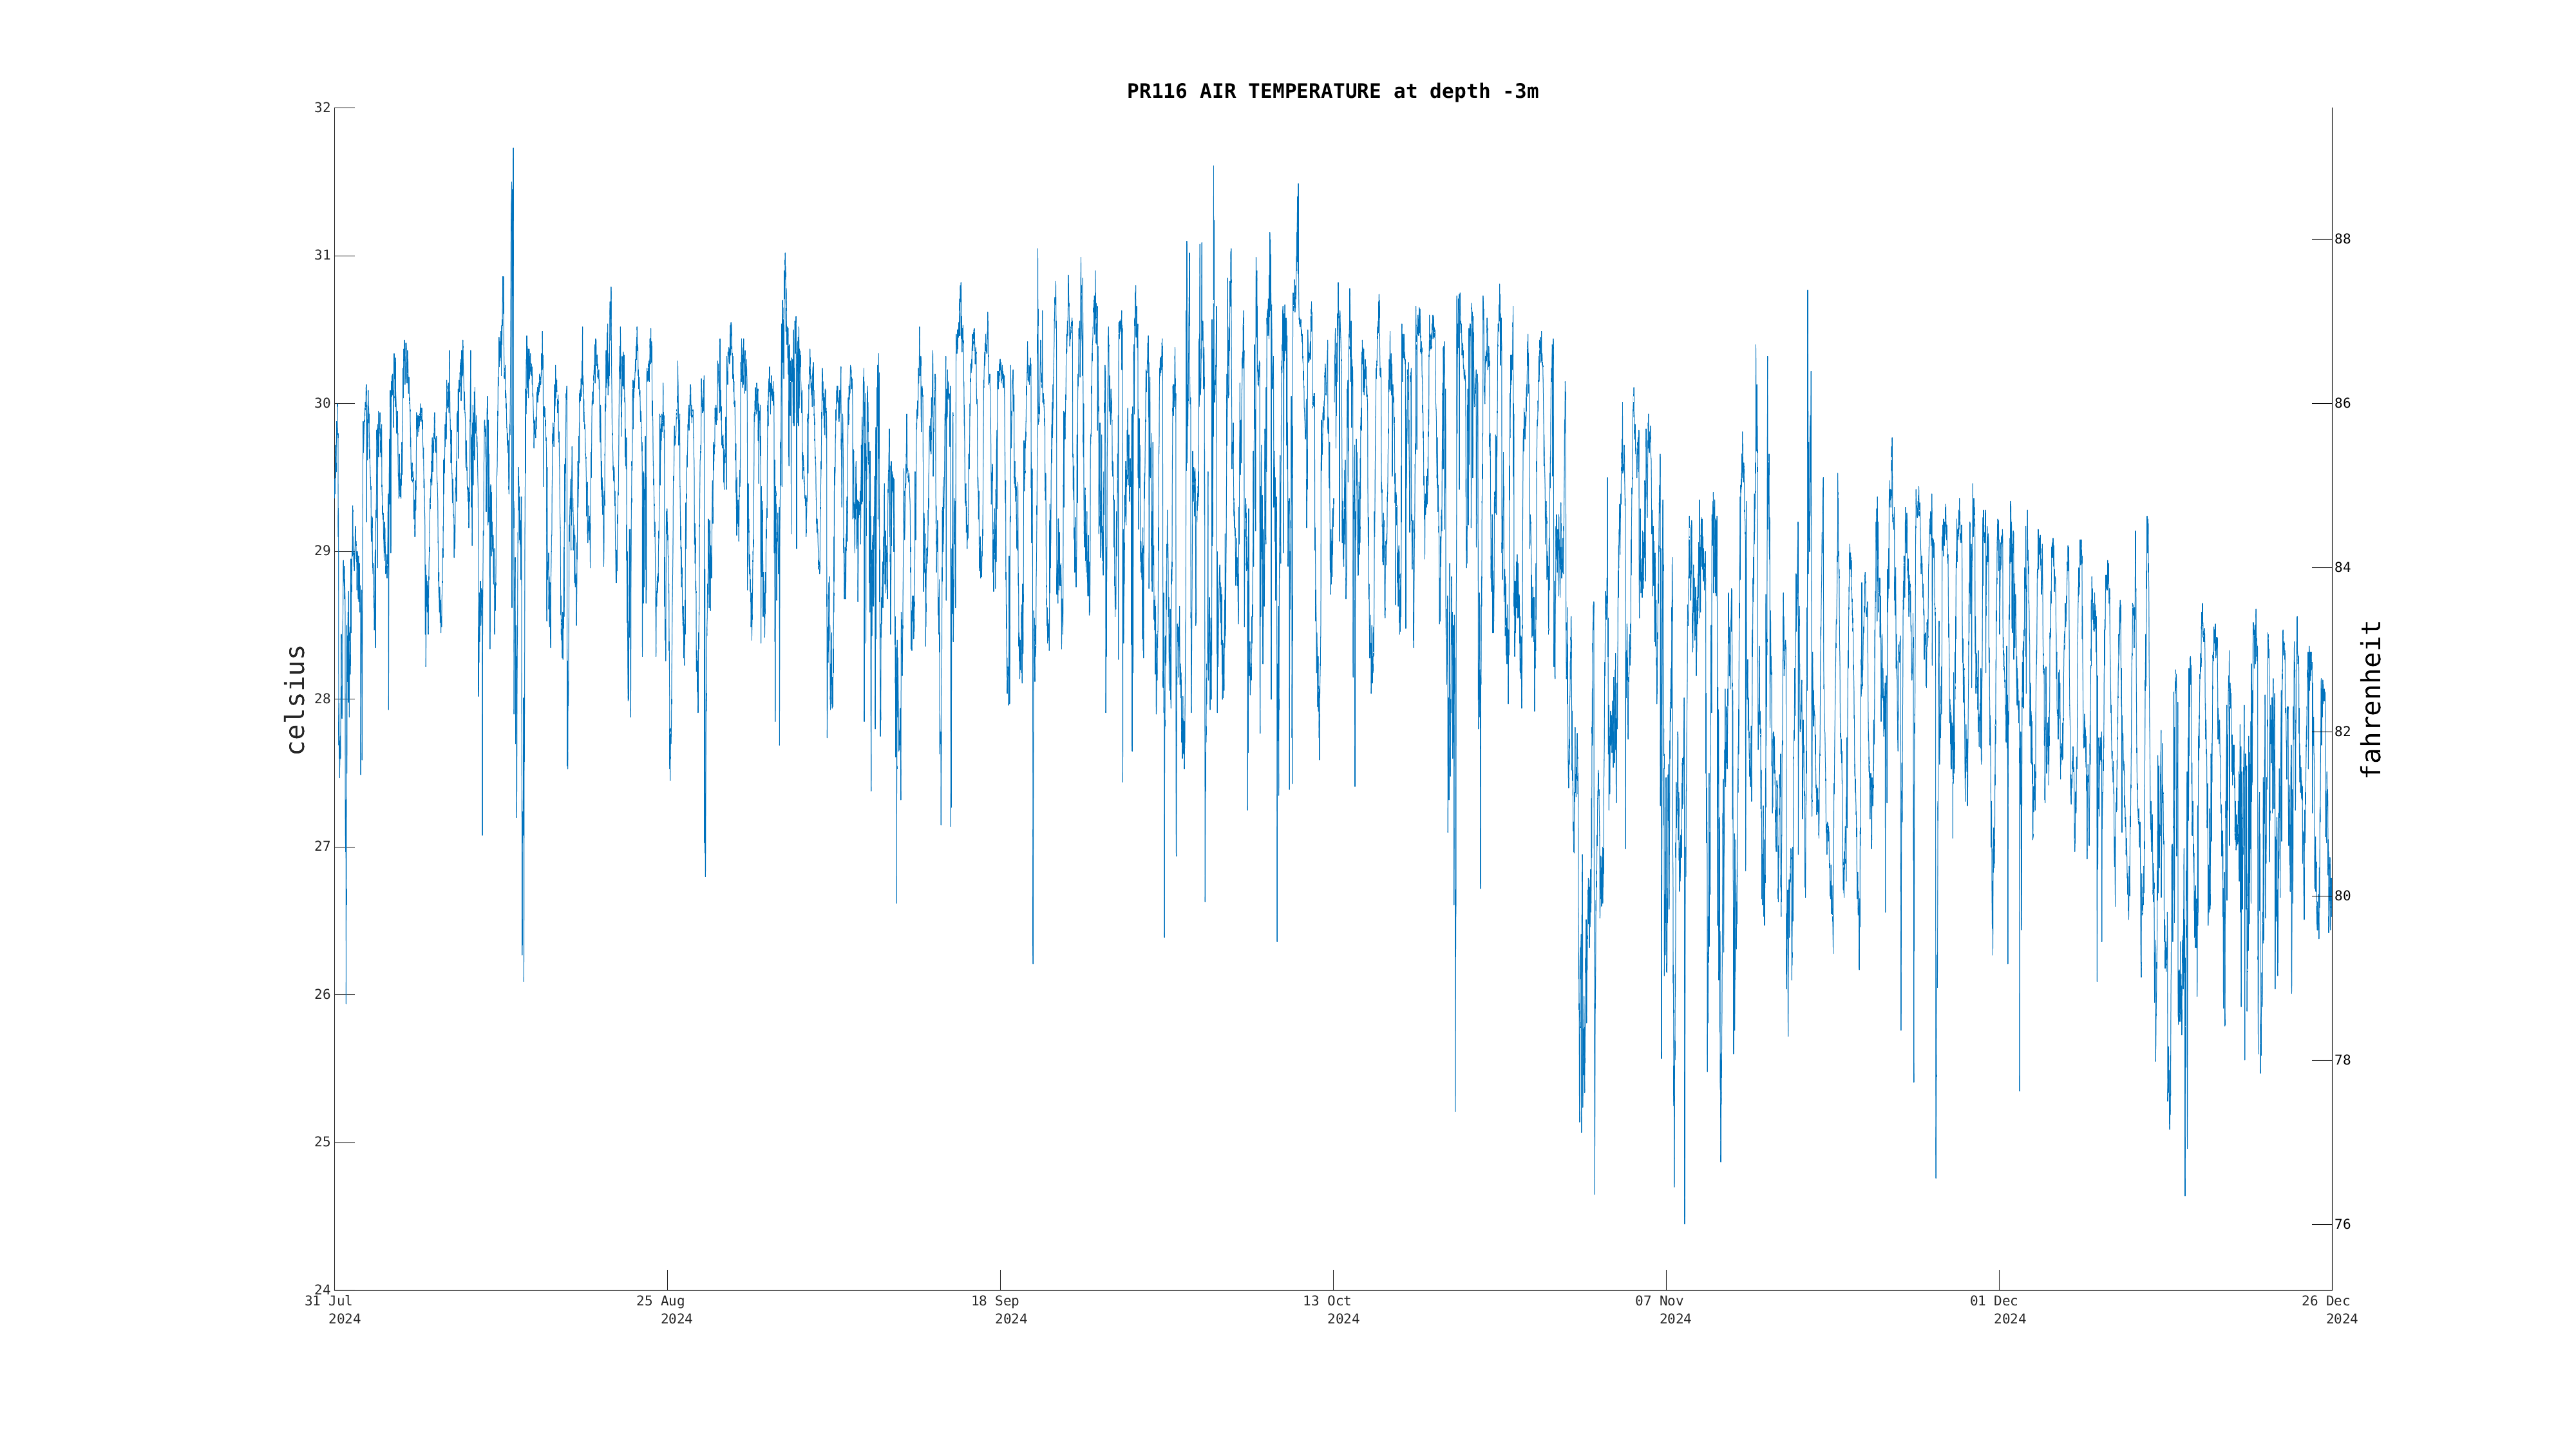
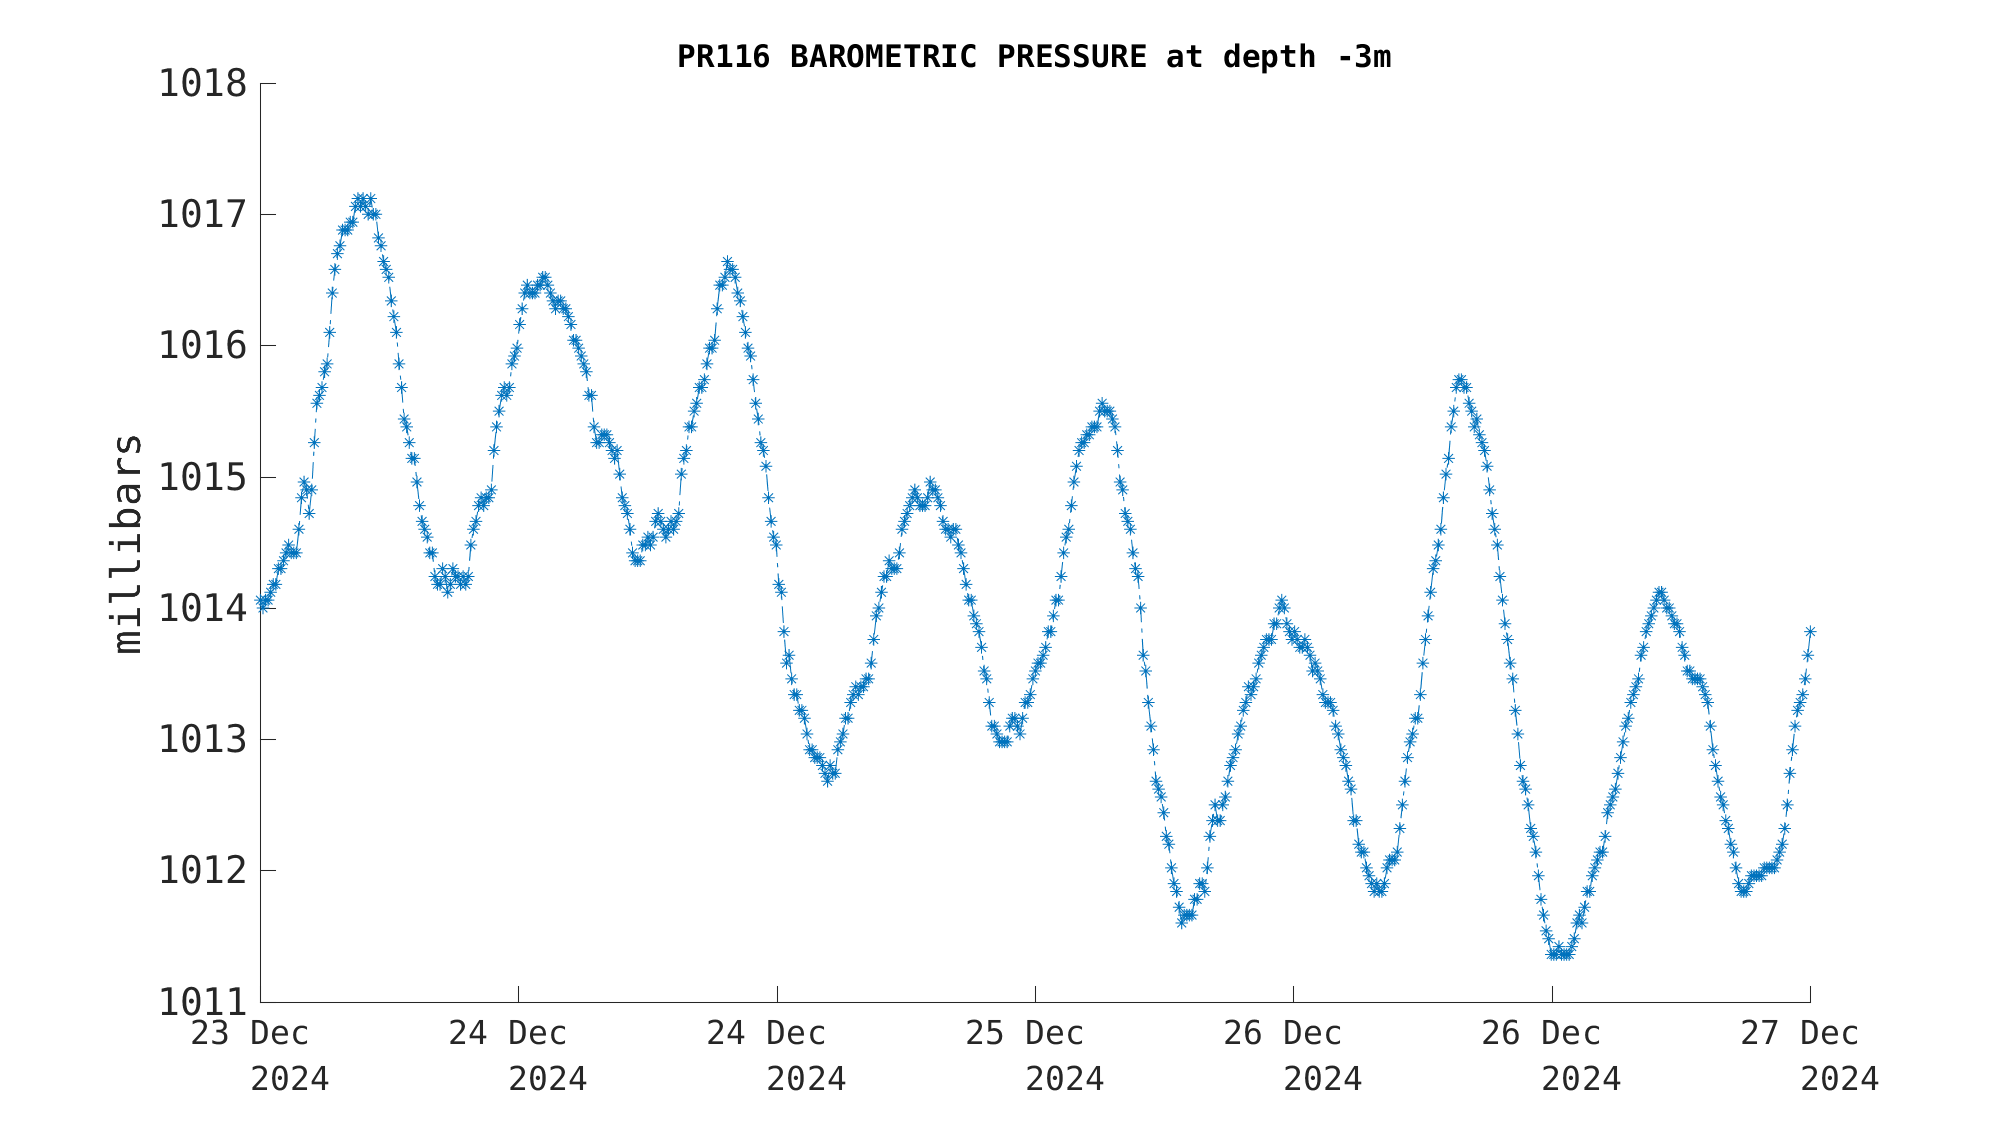


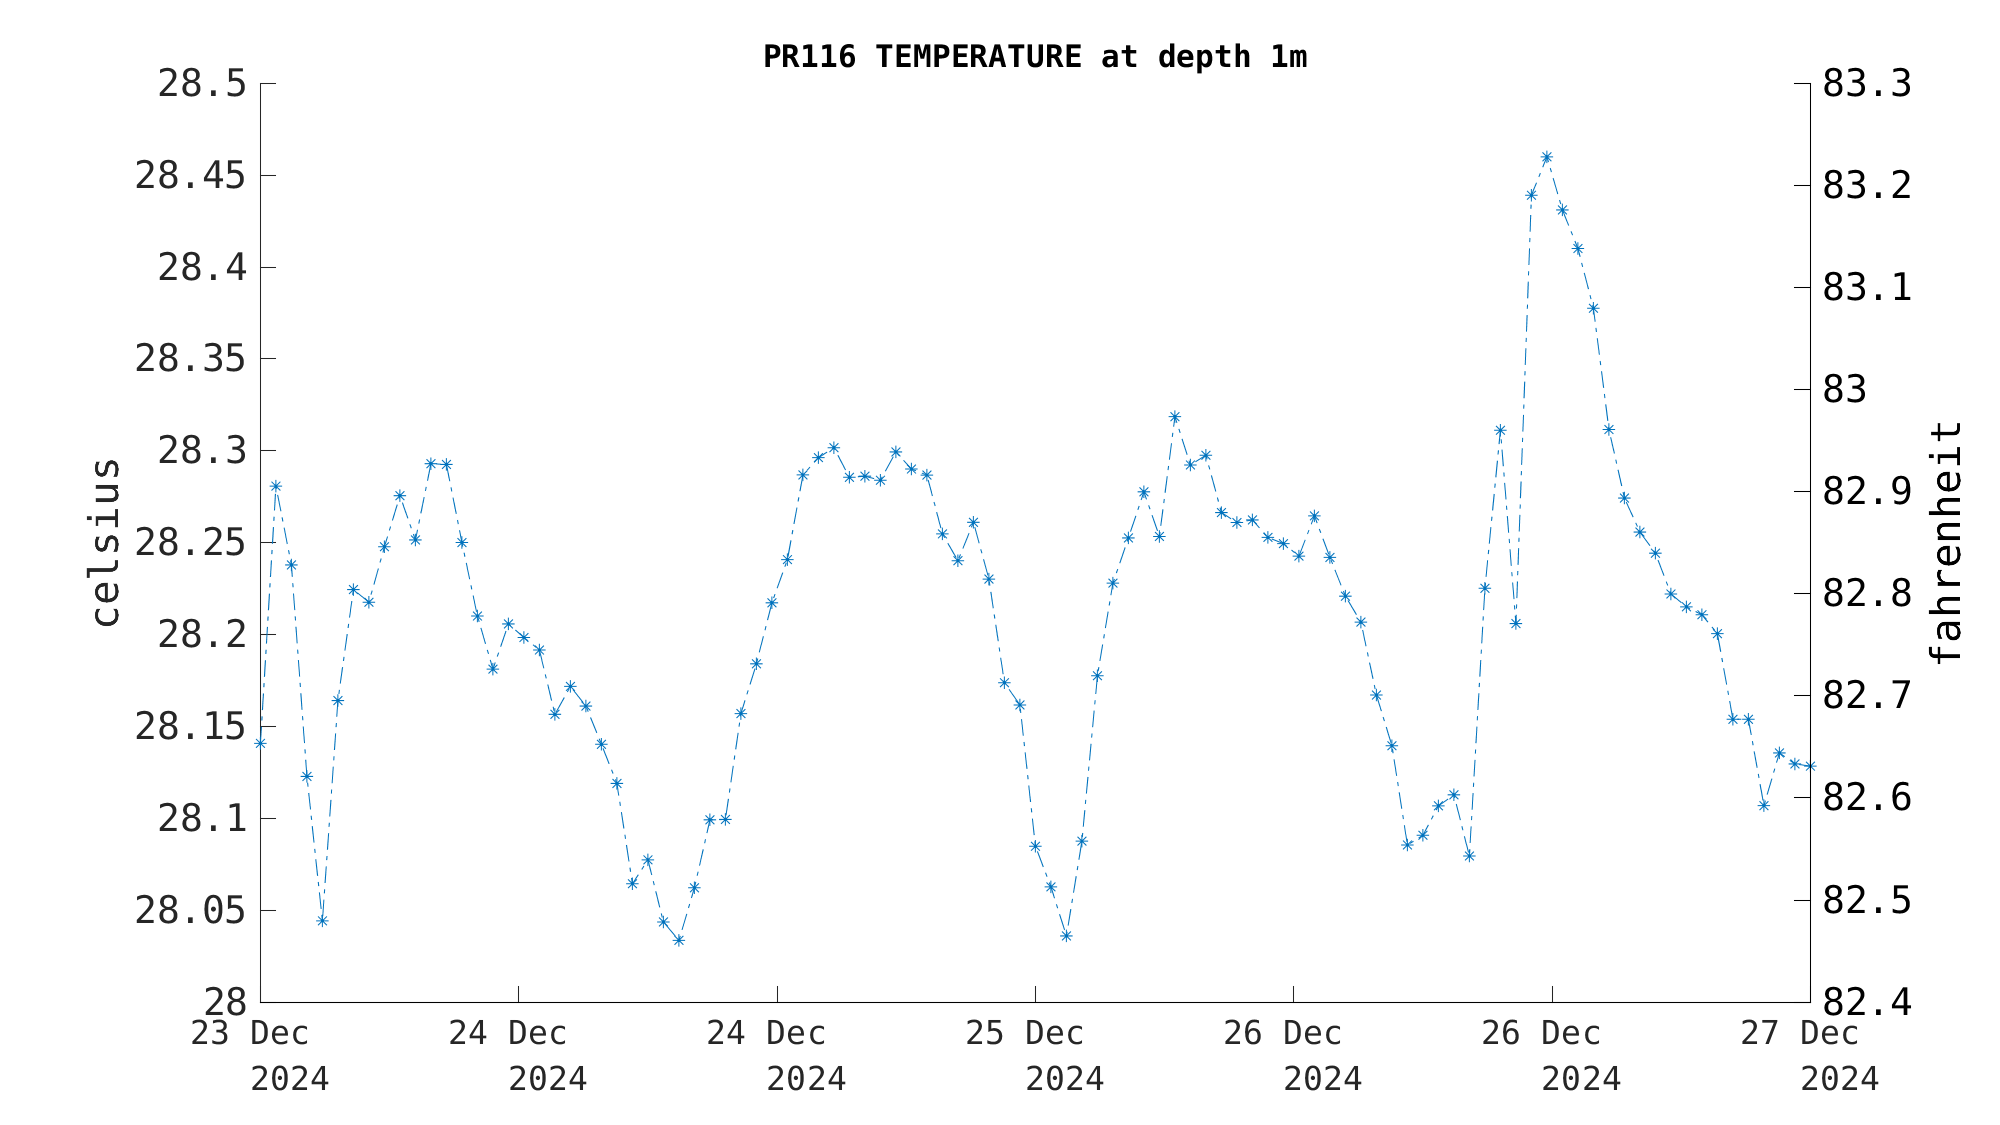
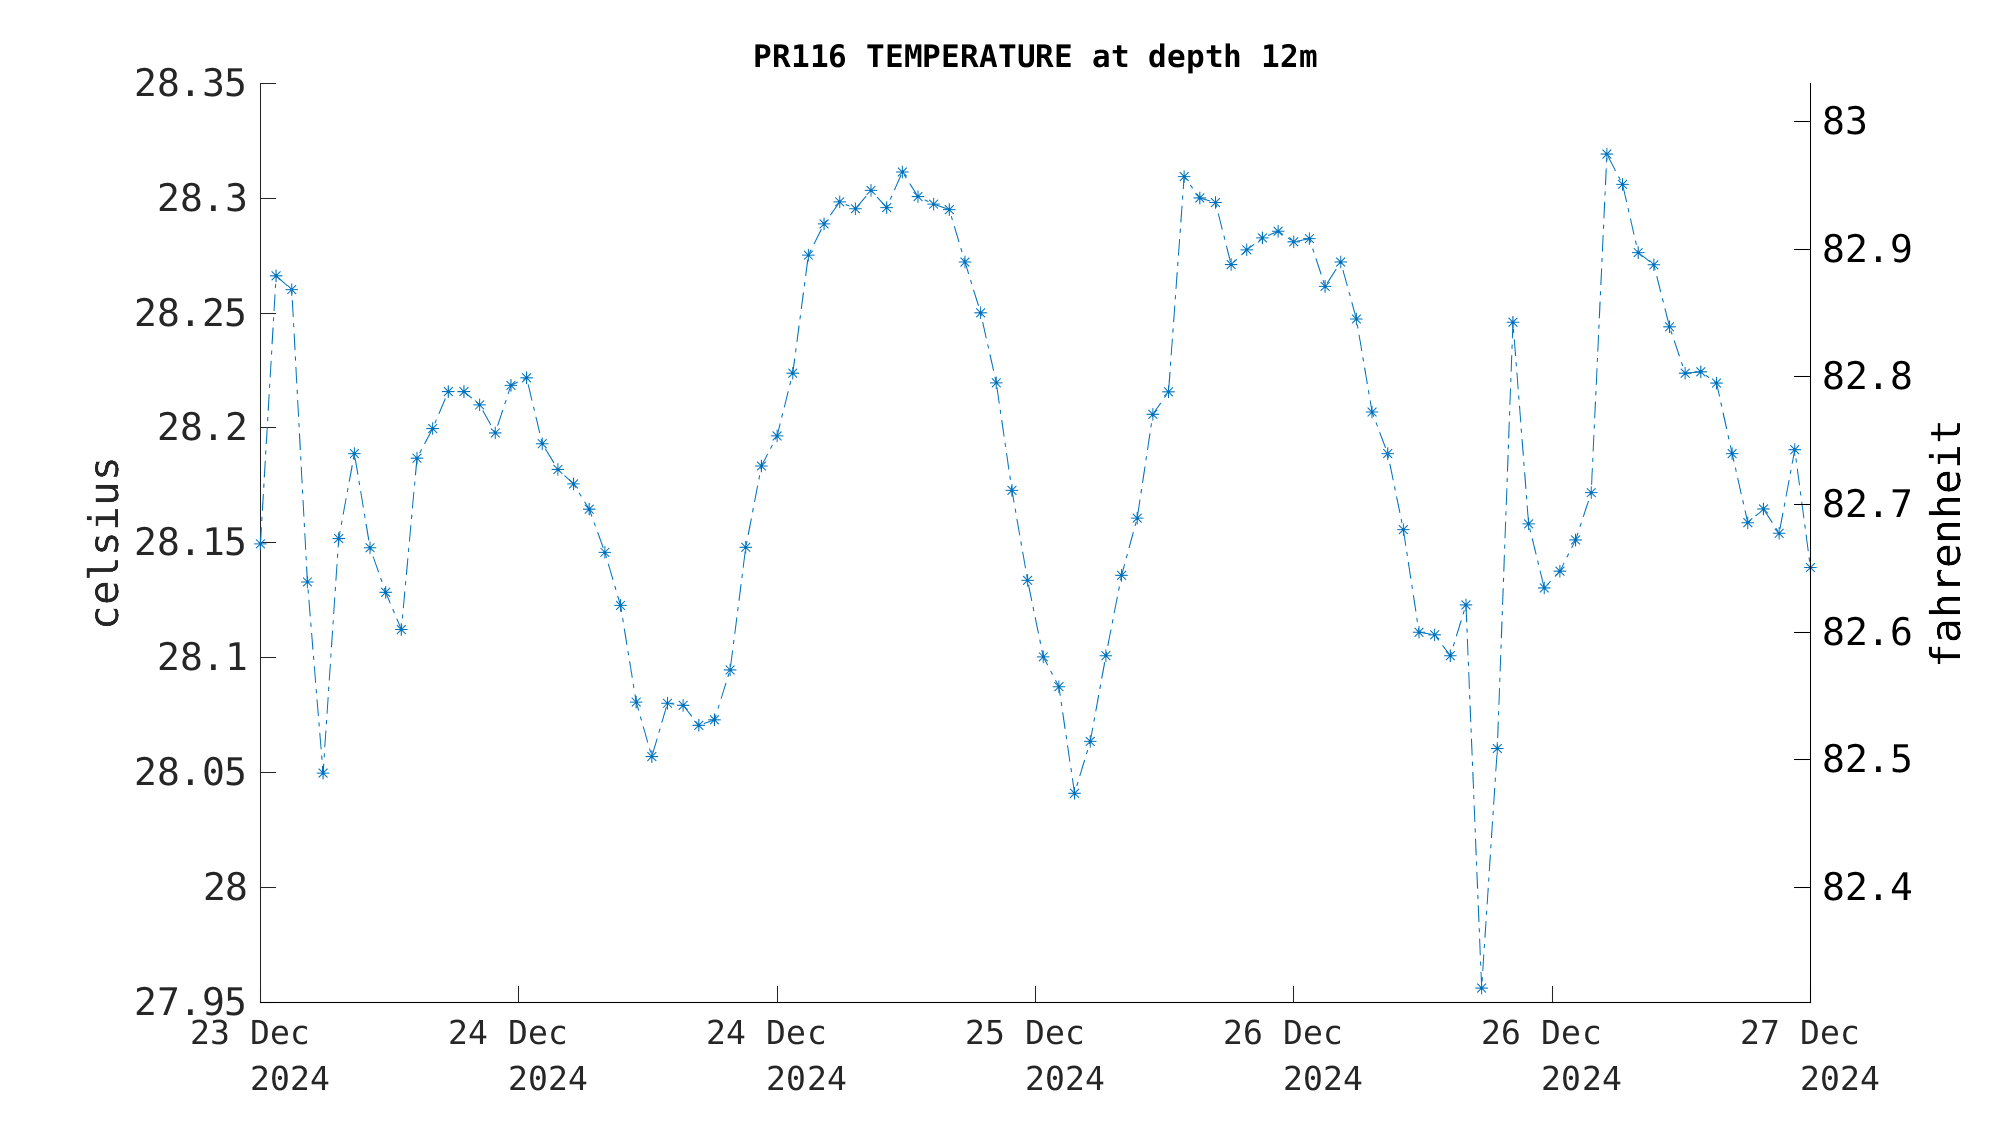
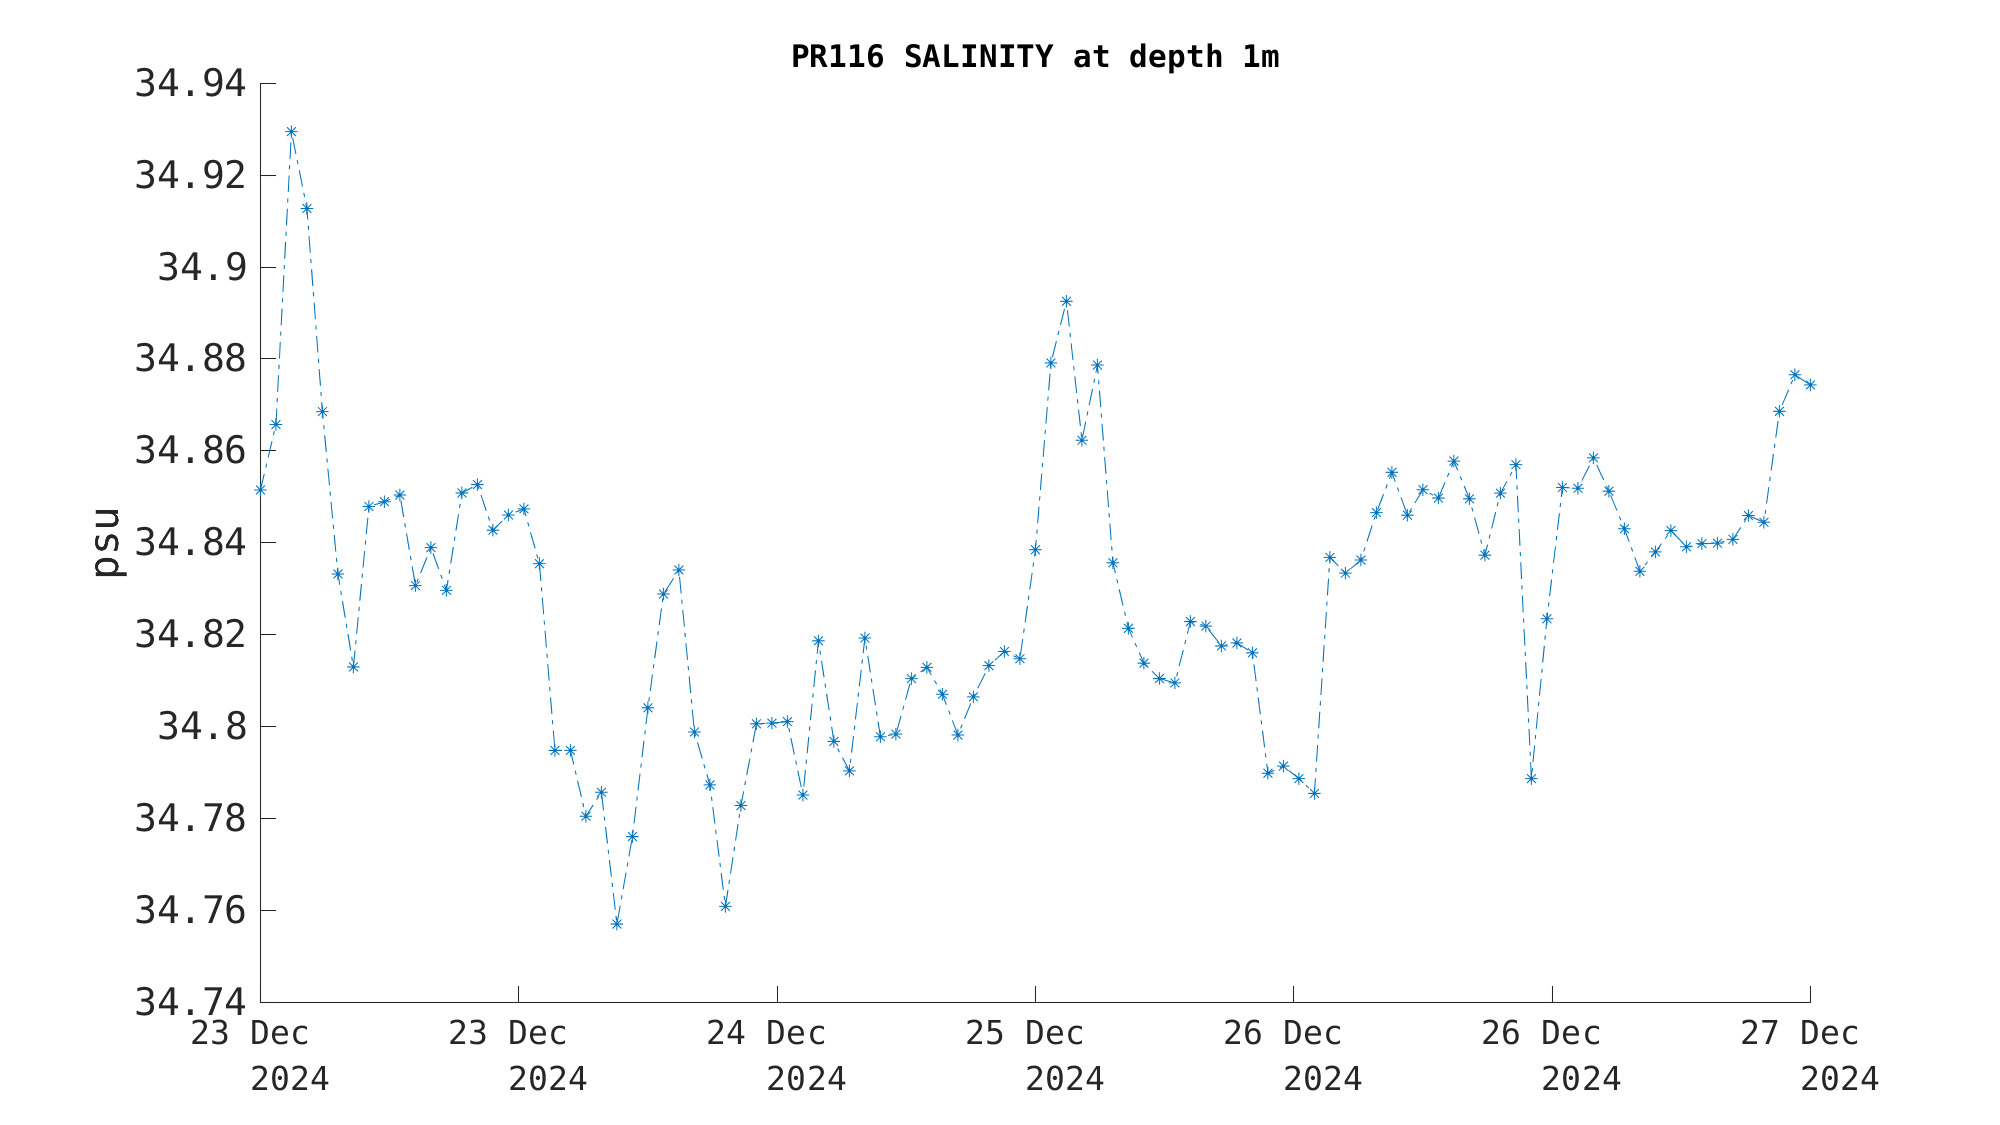
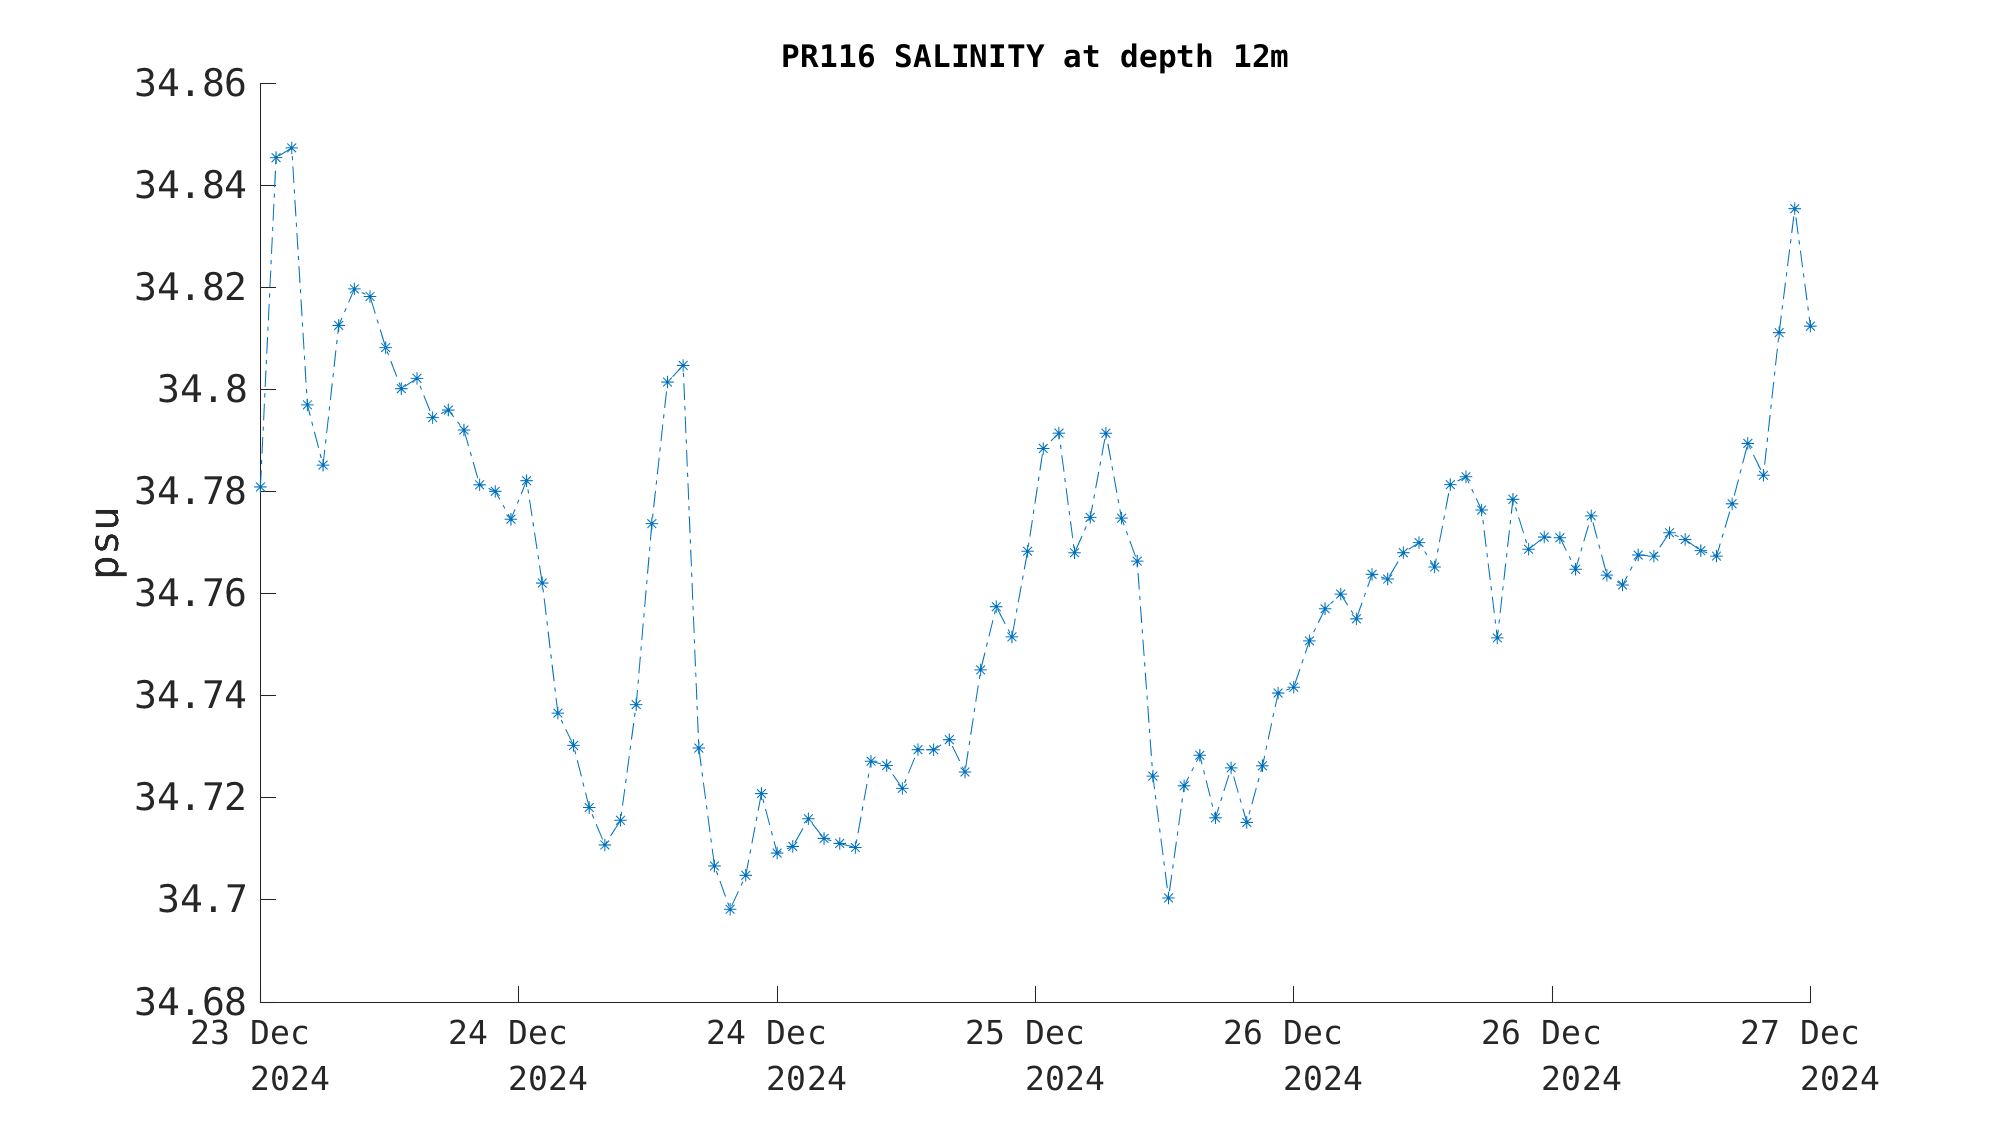
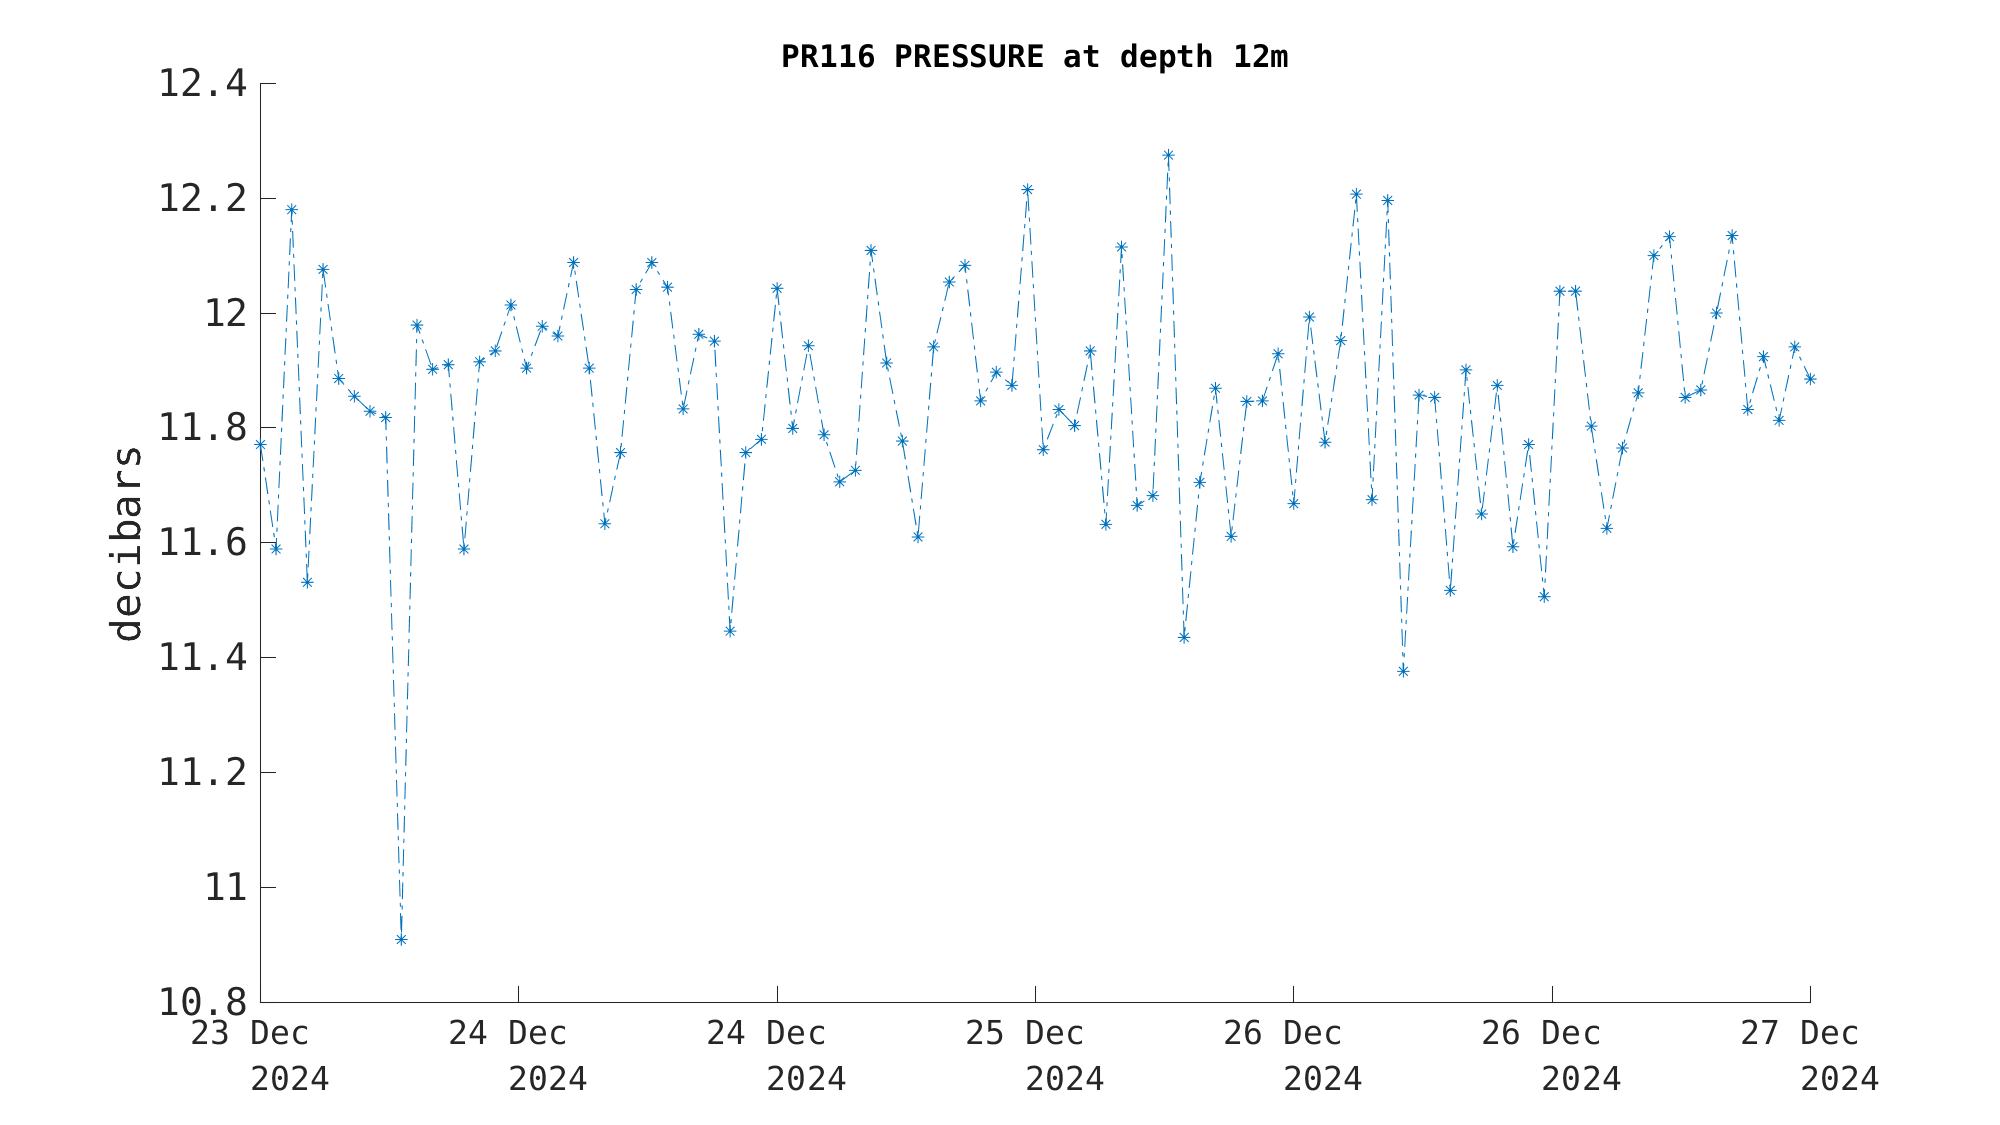
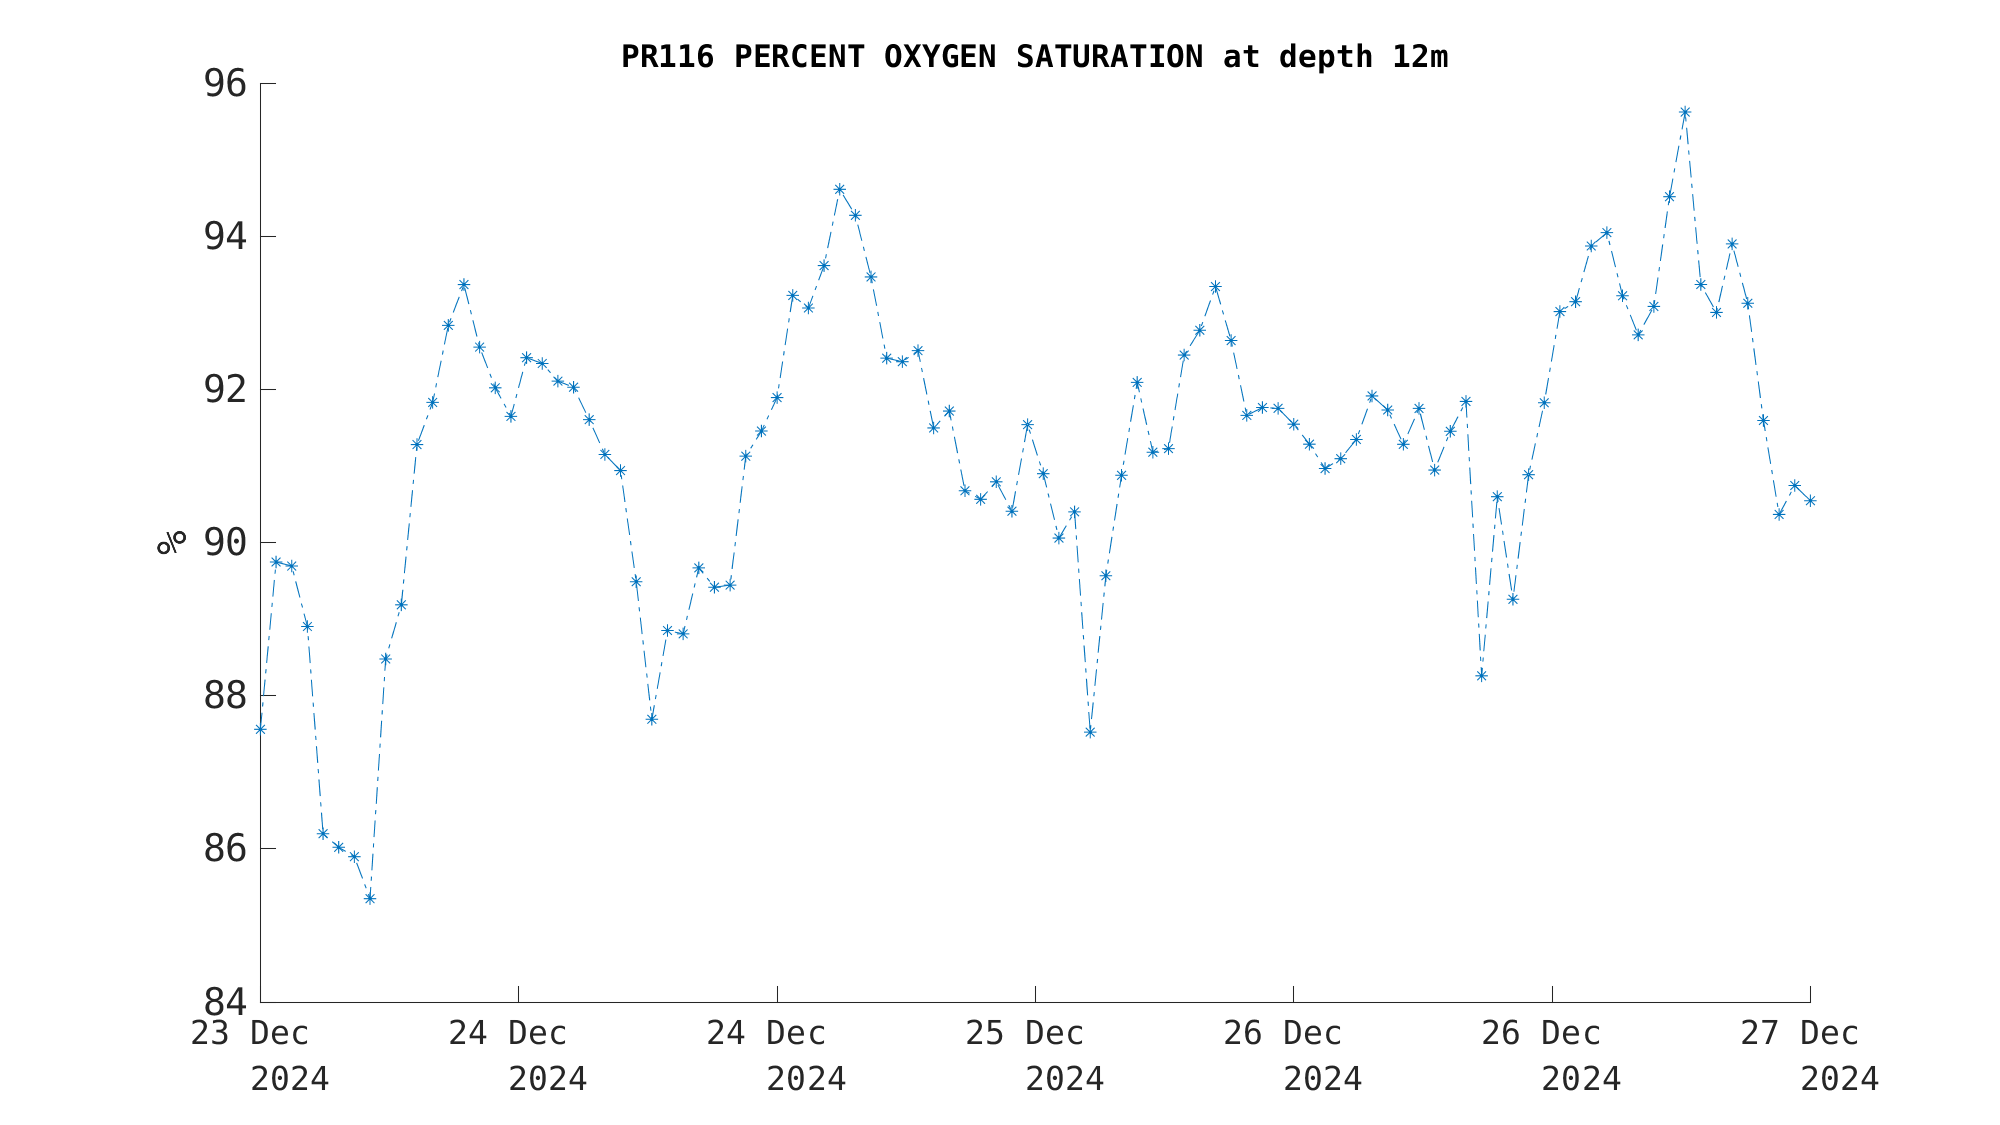
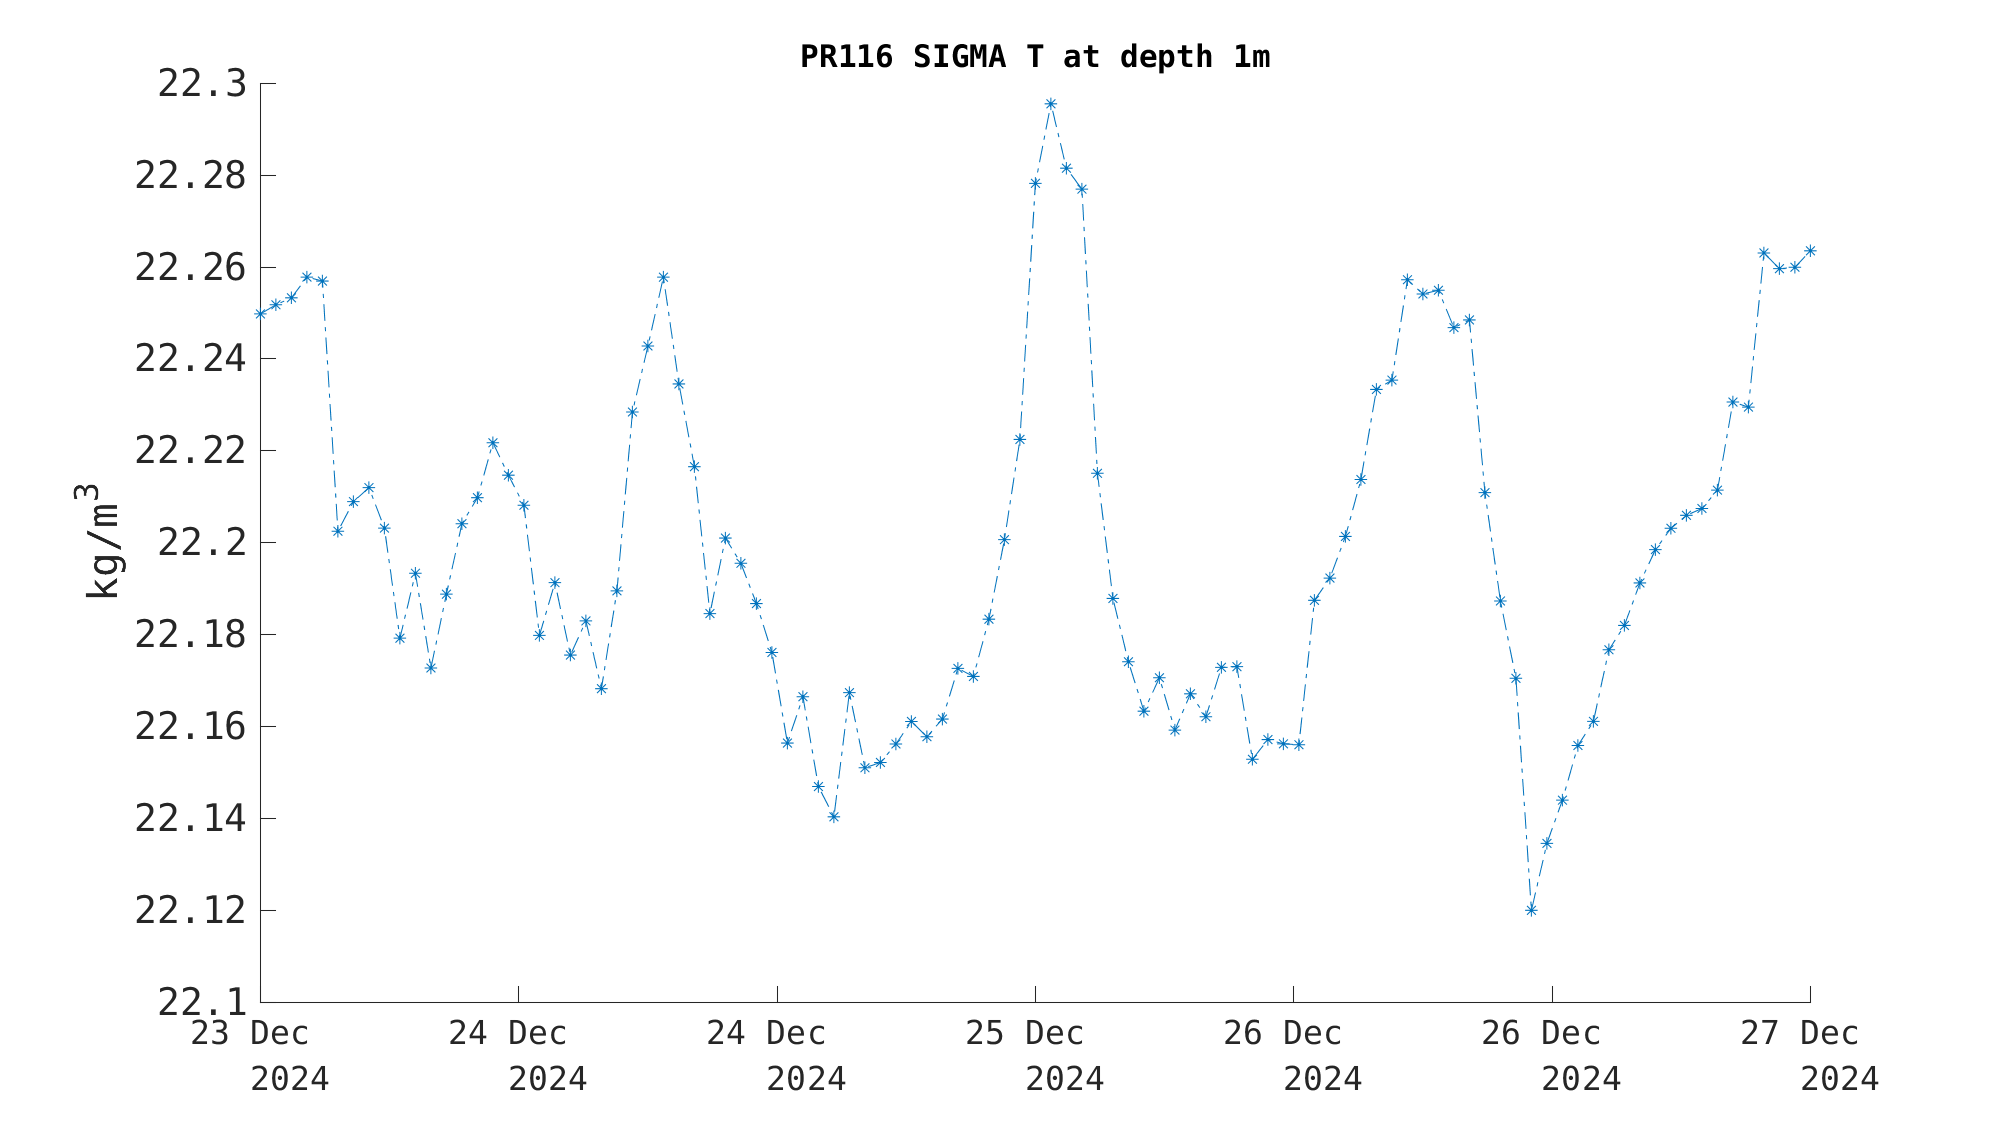

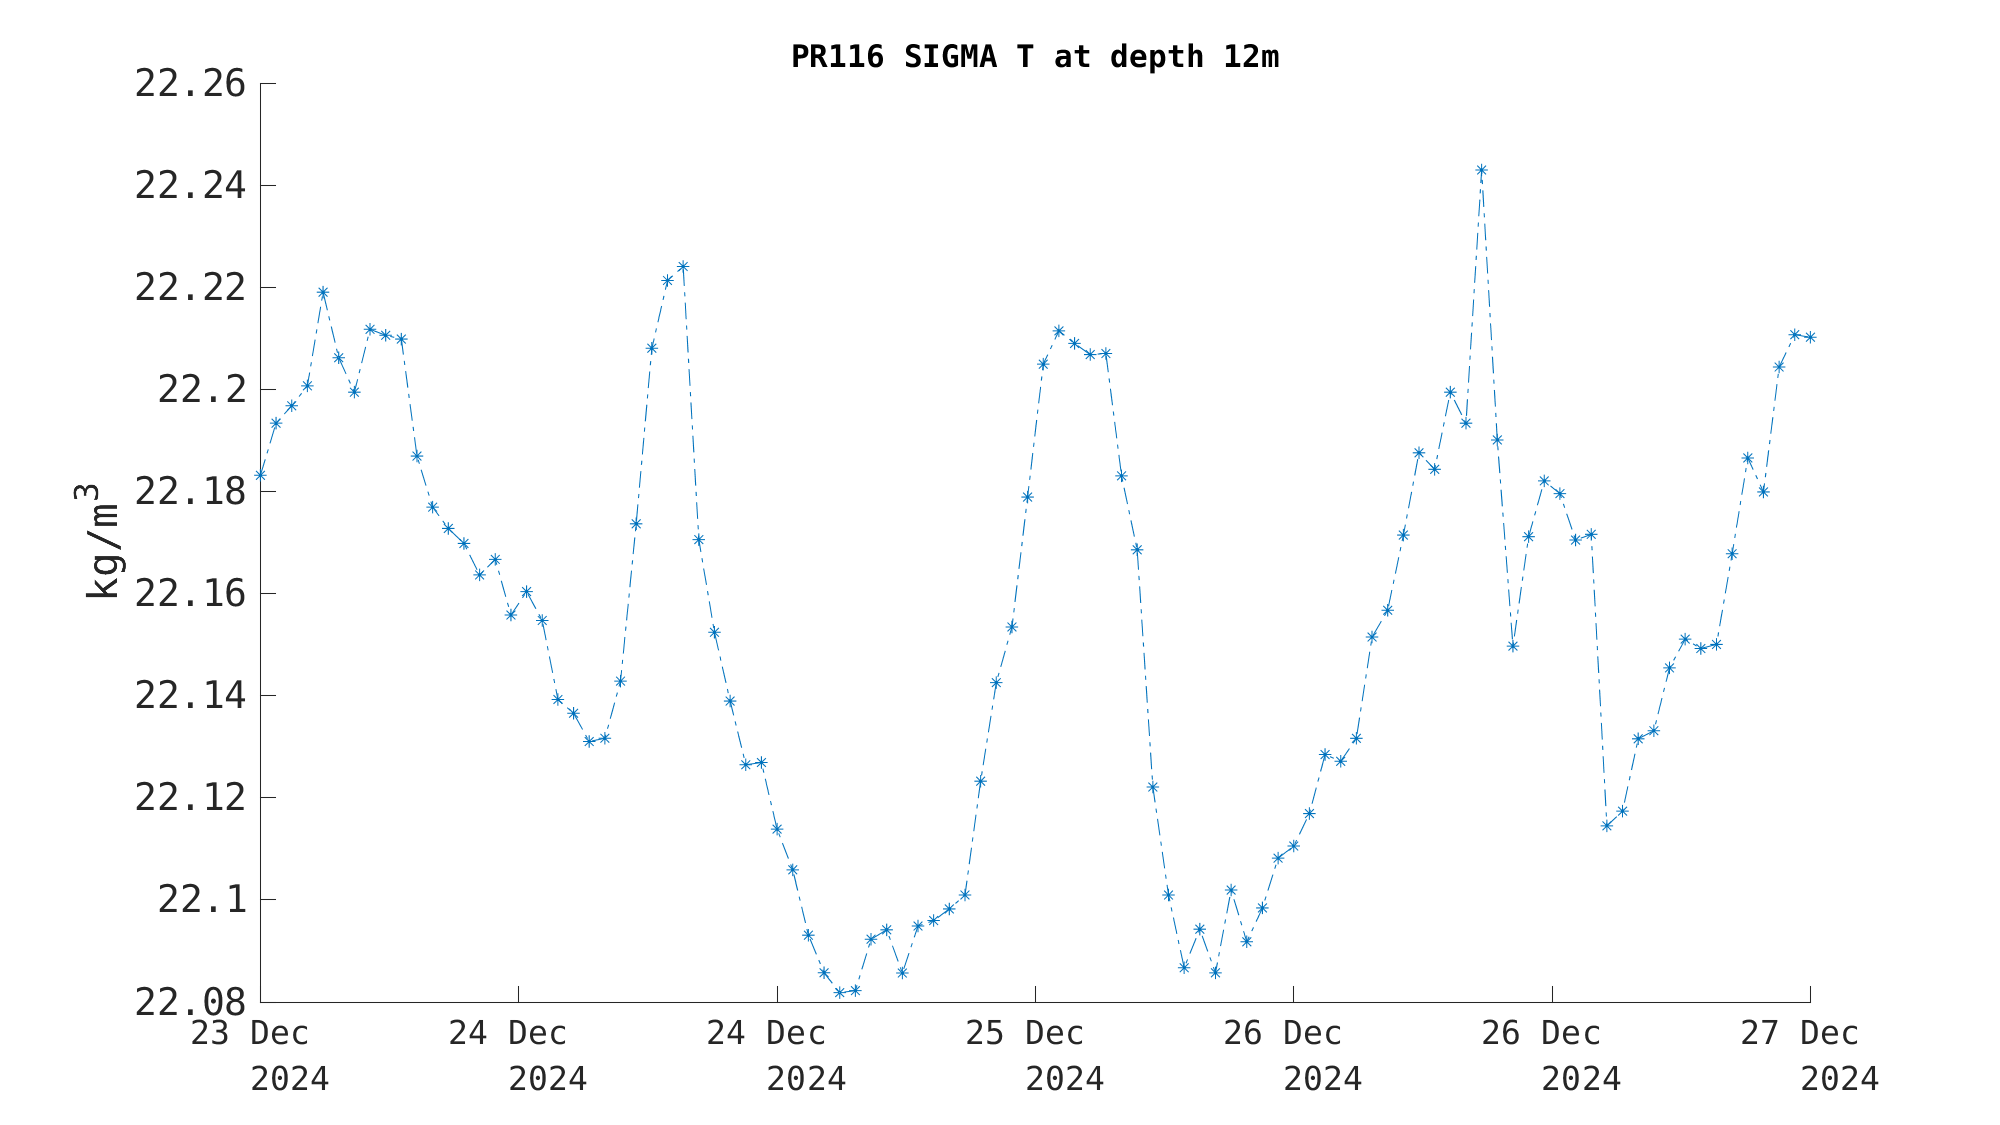


 Latest Month's:
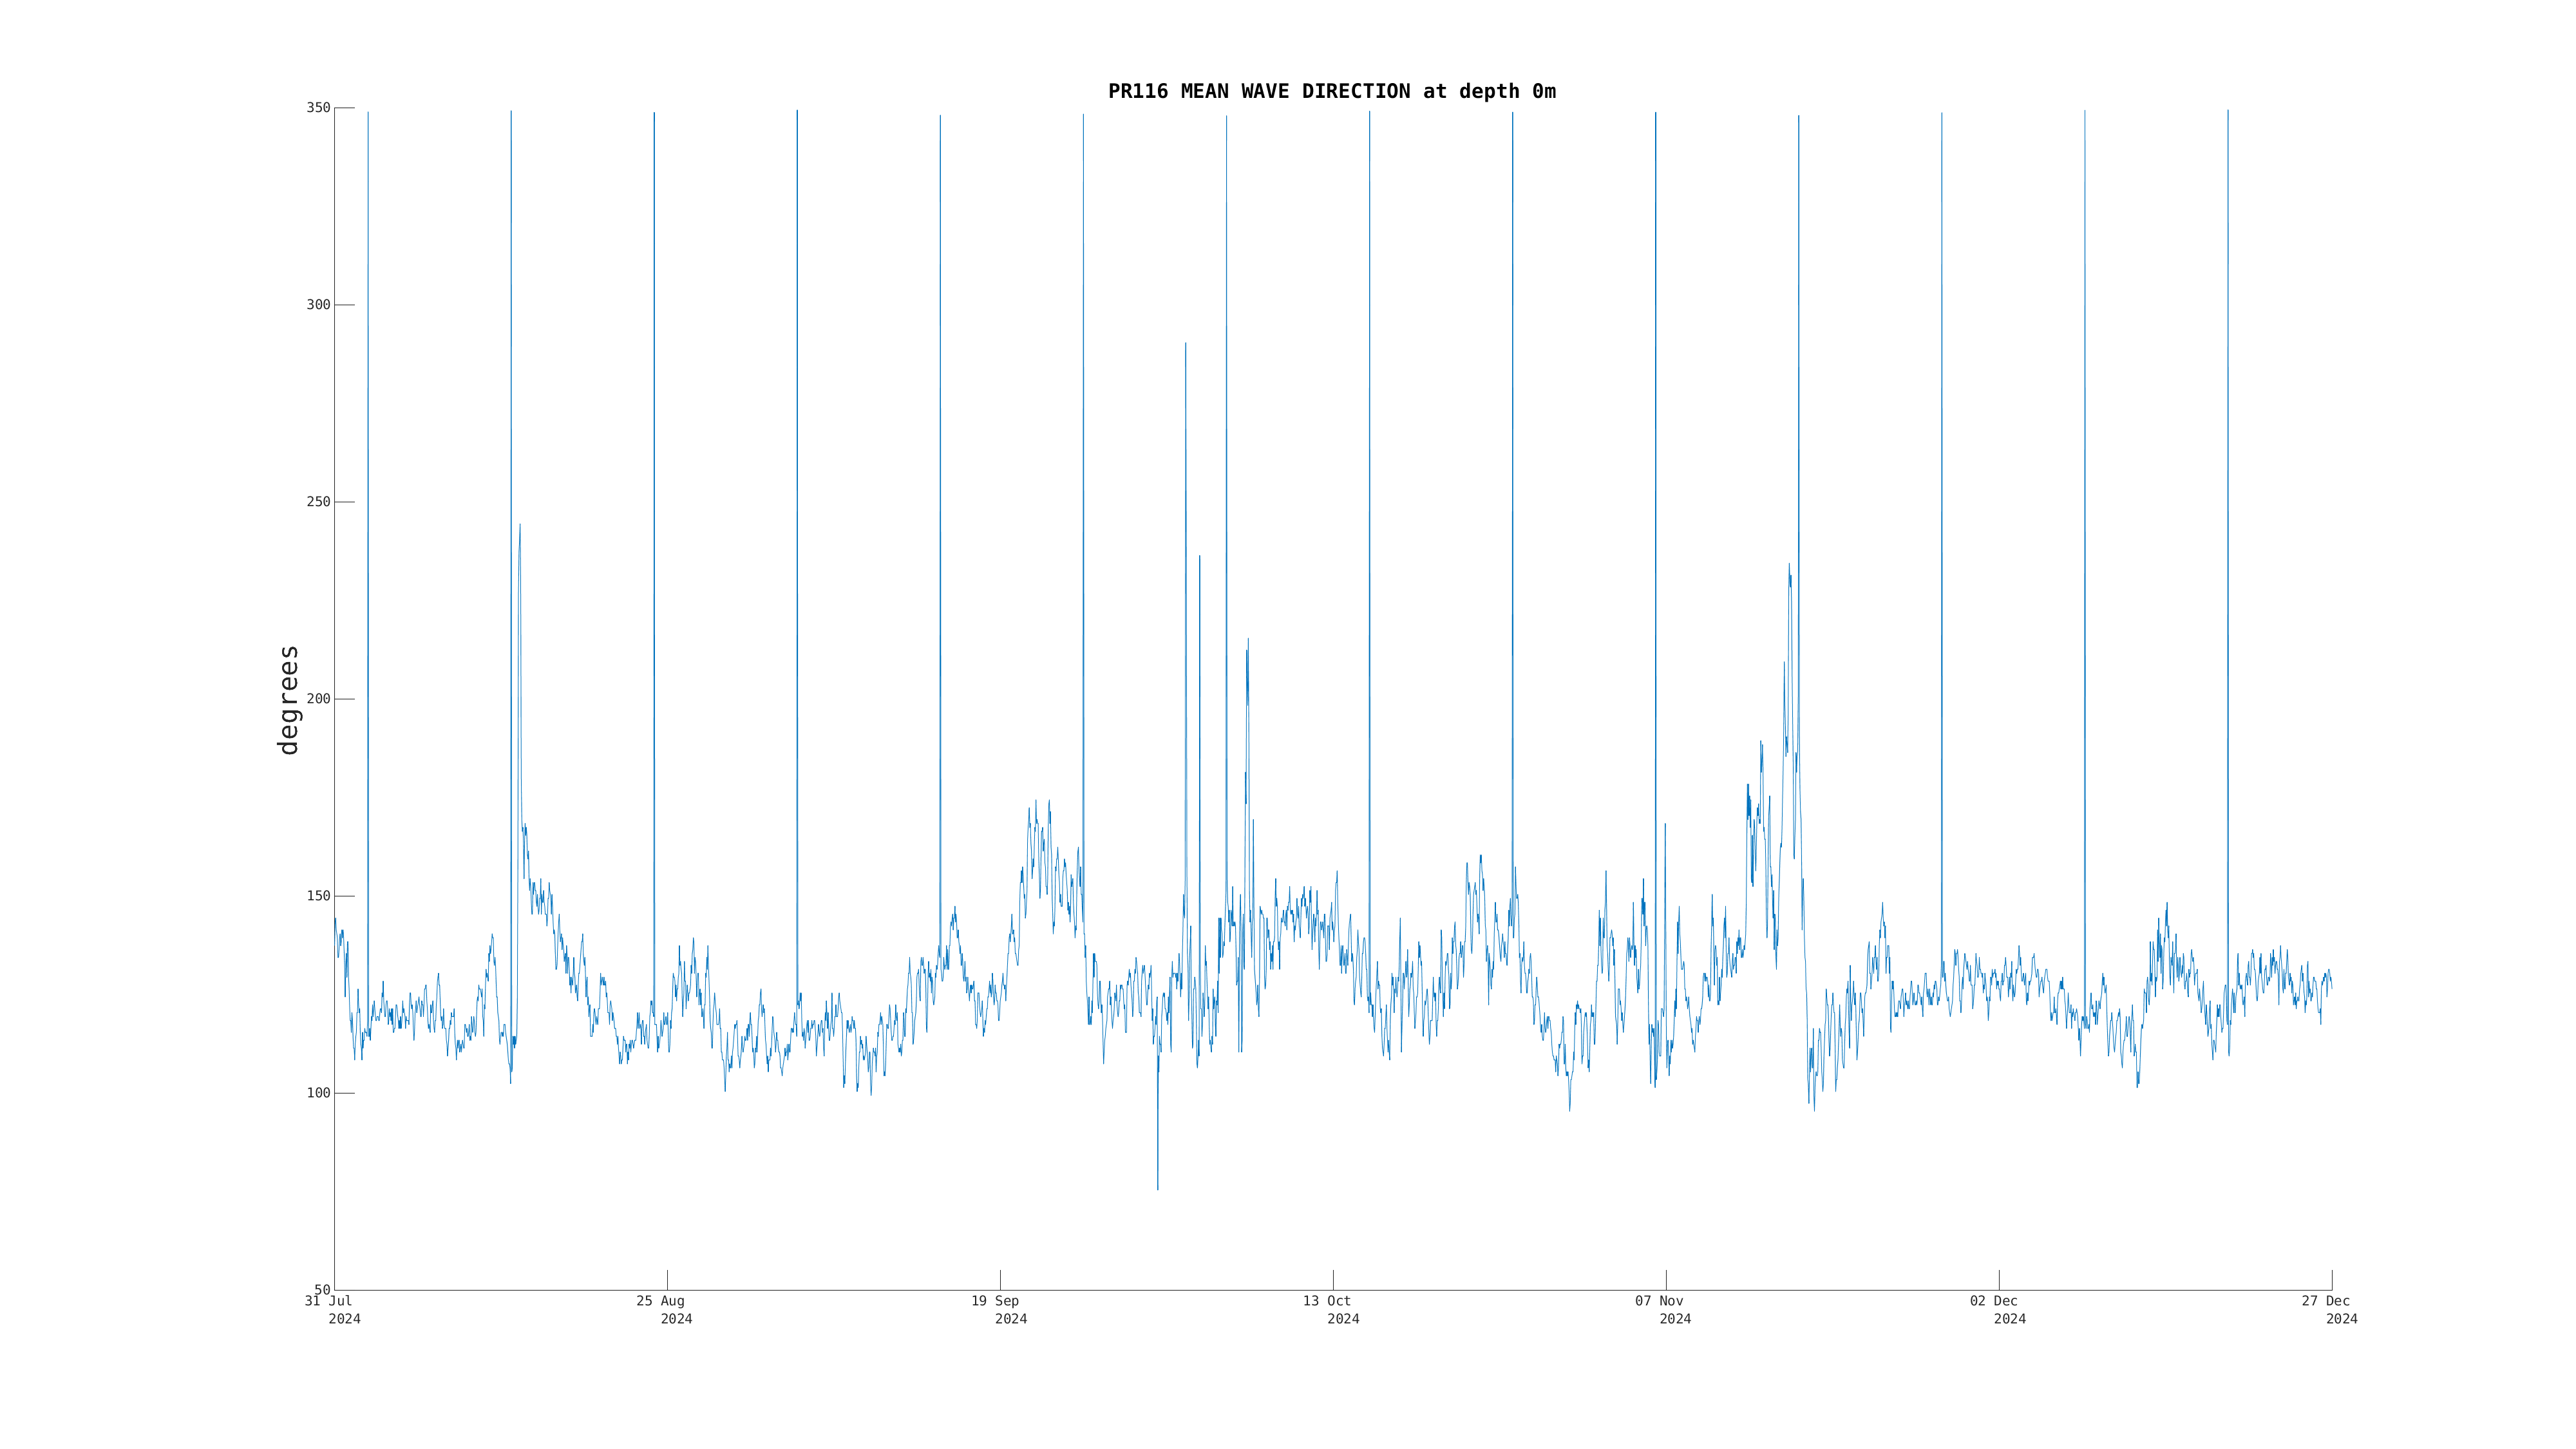
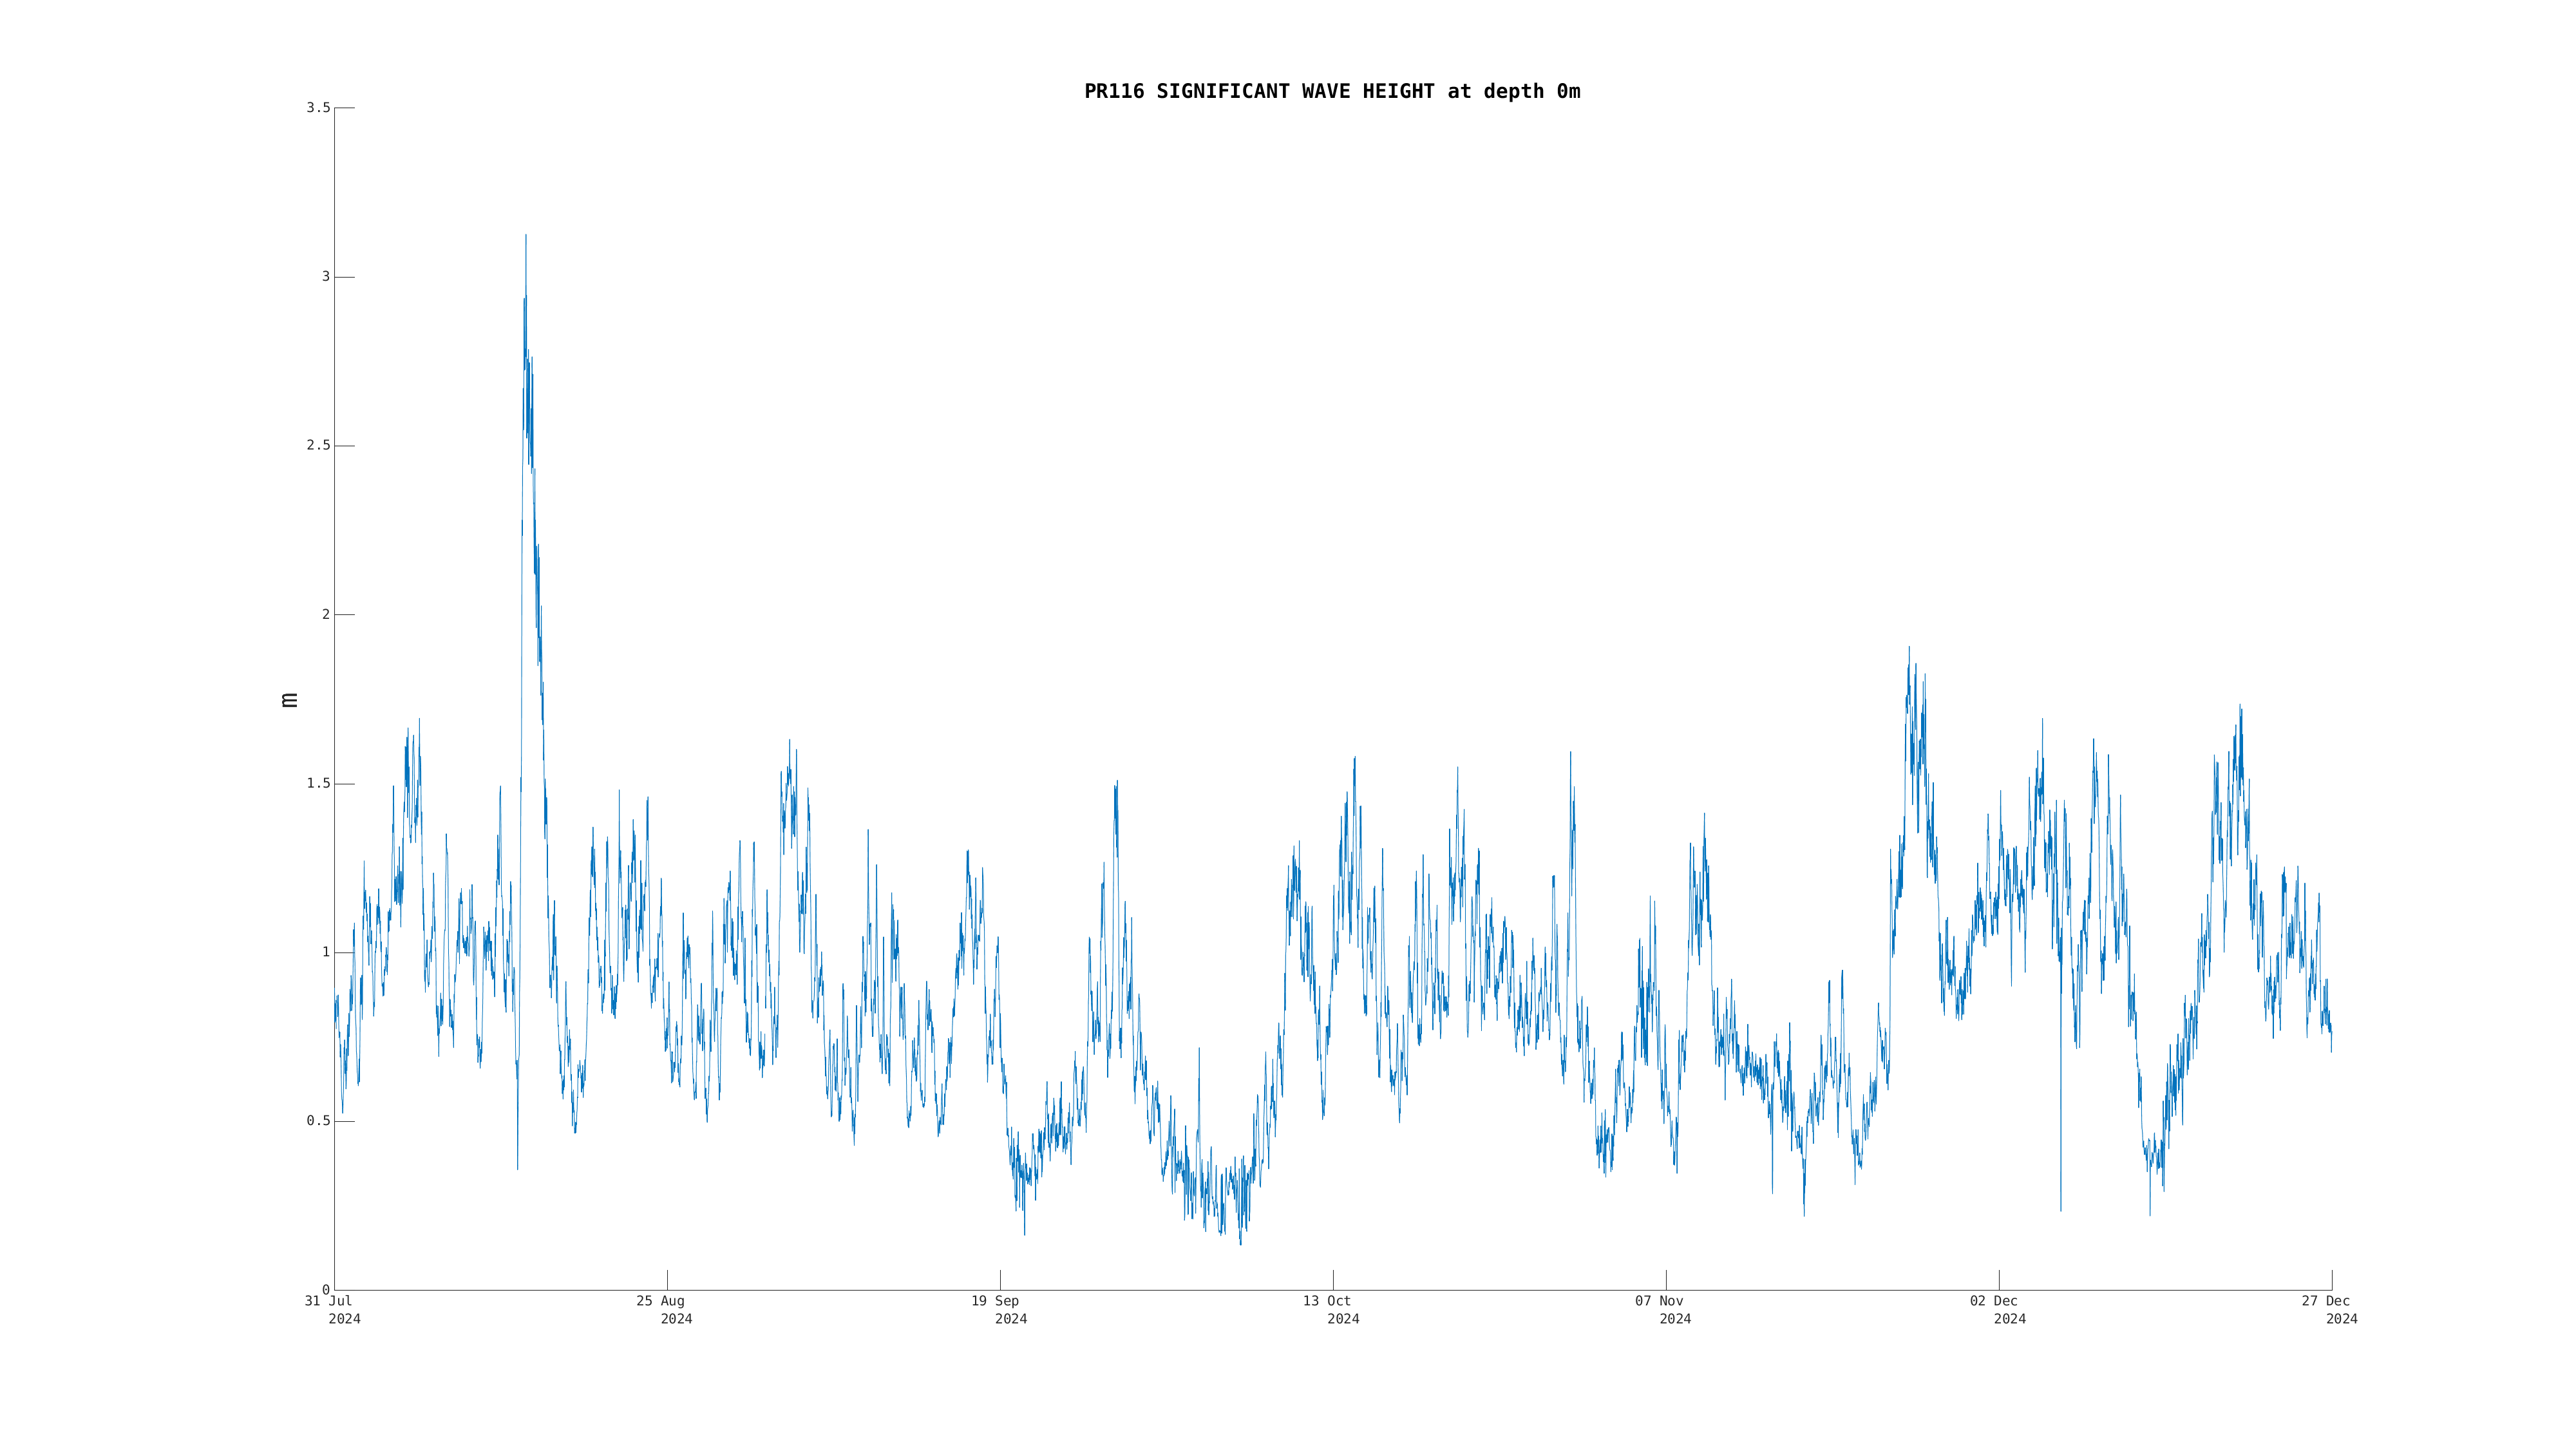
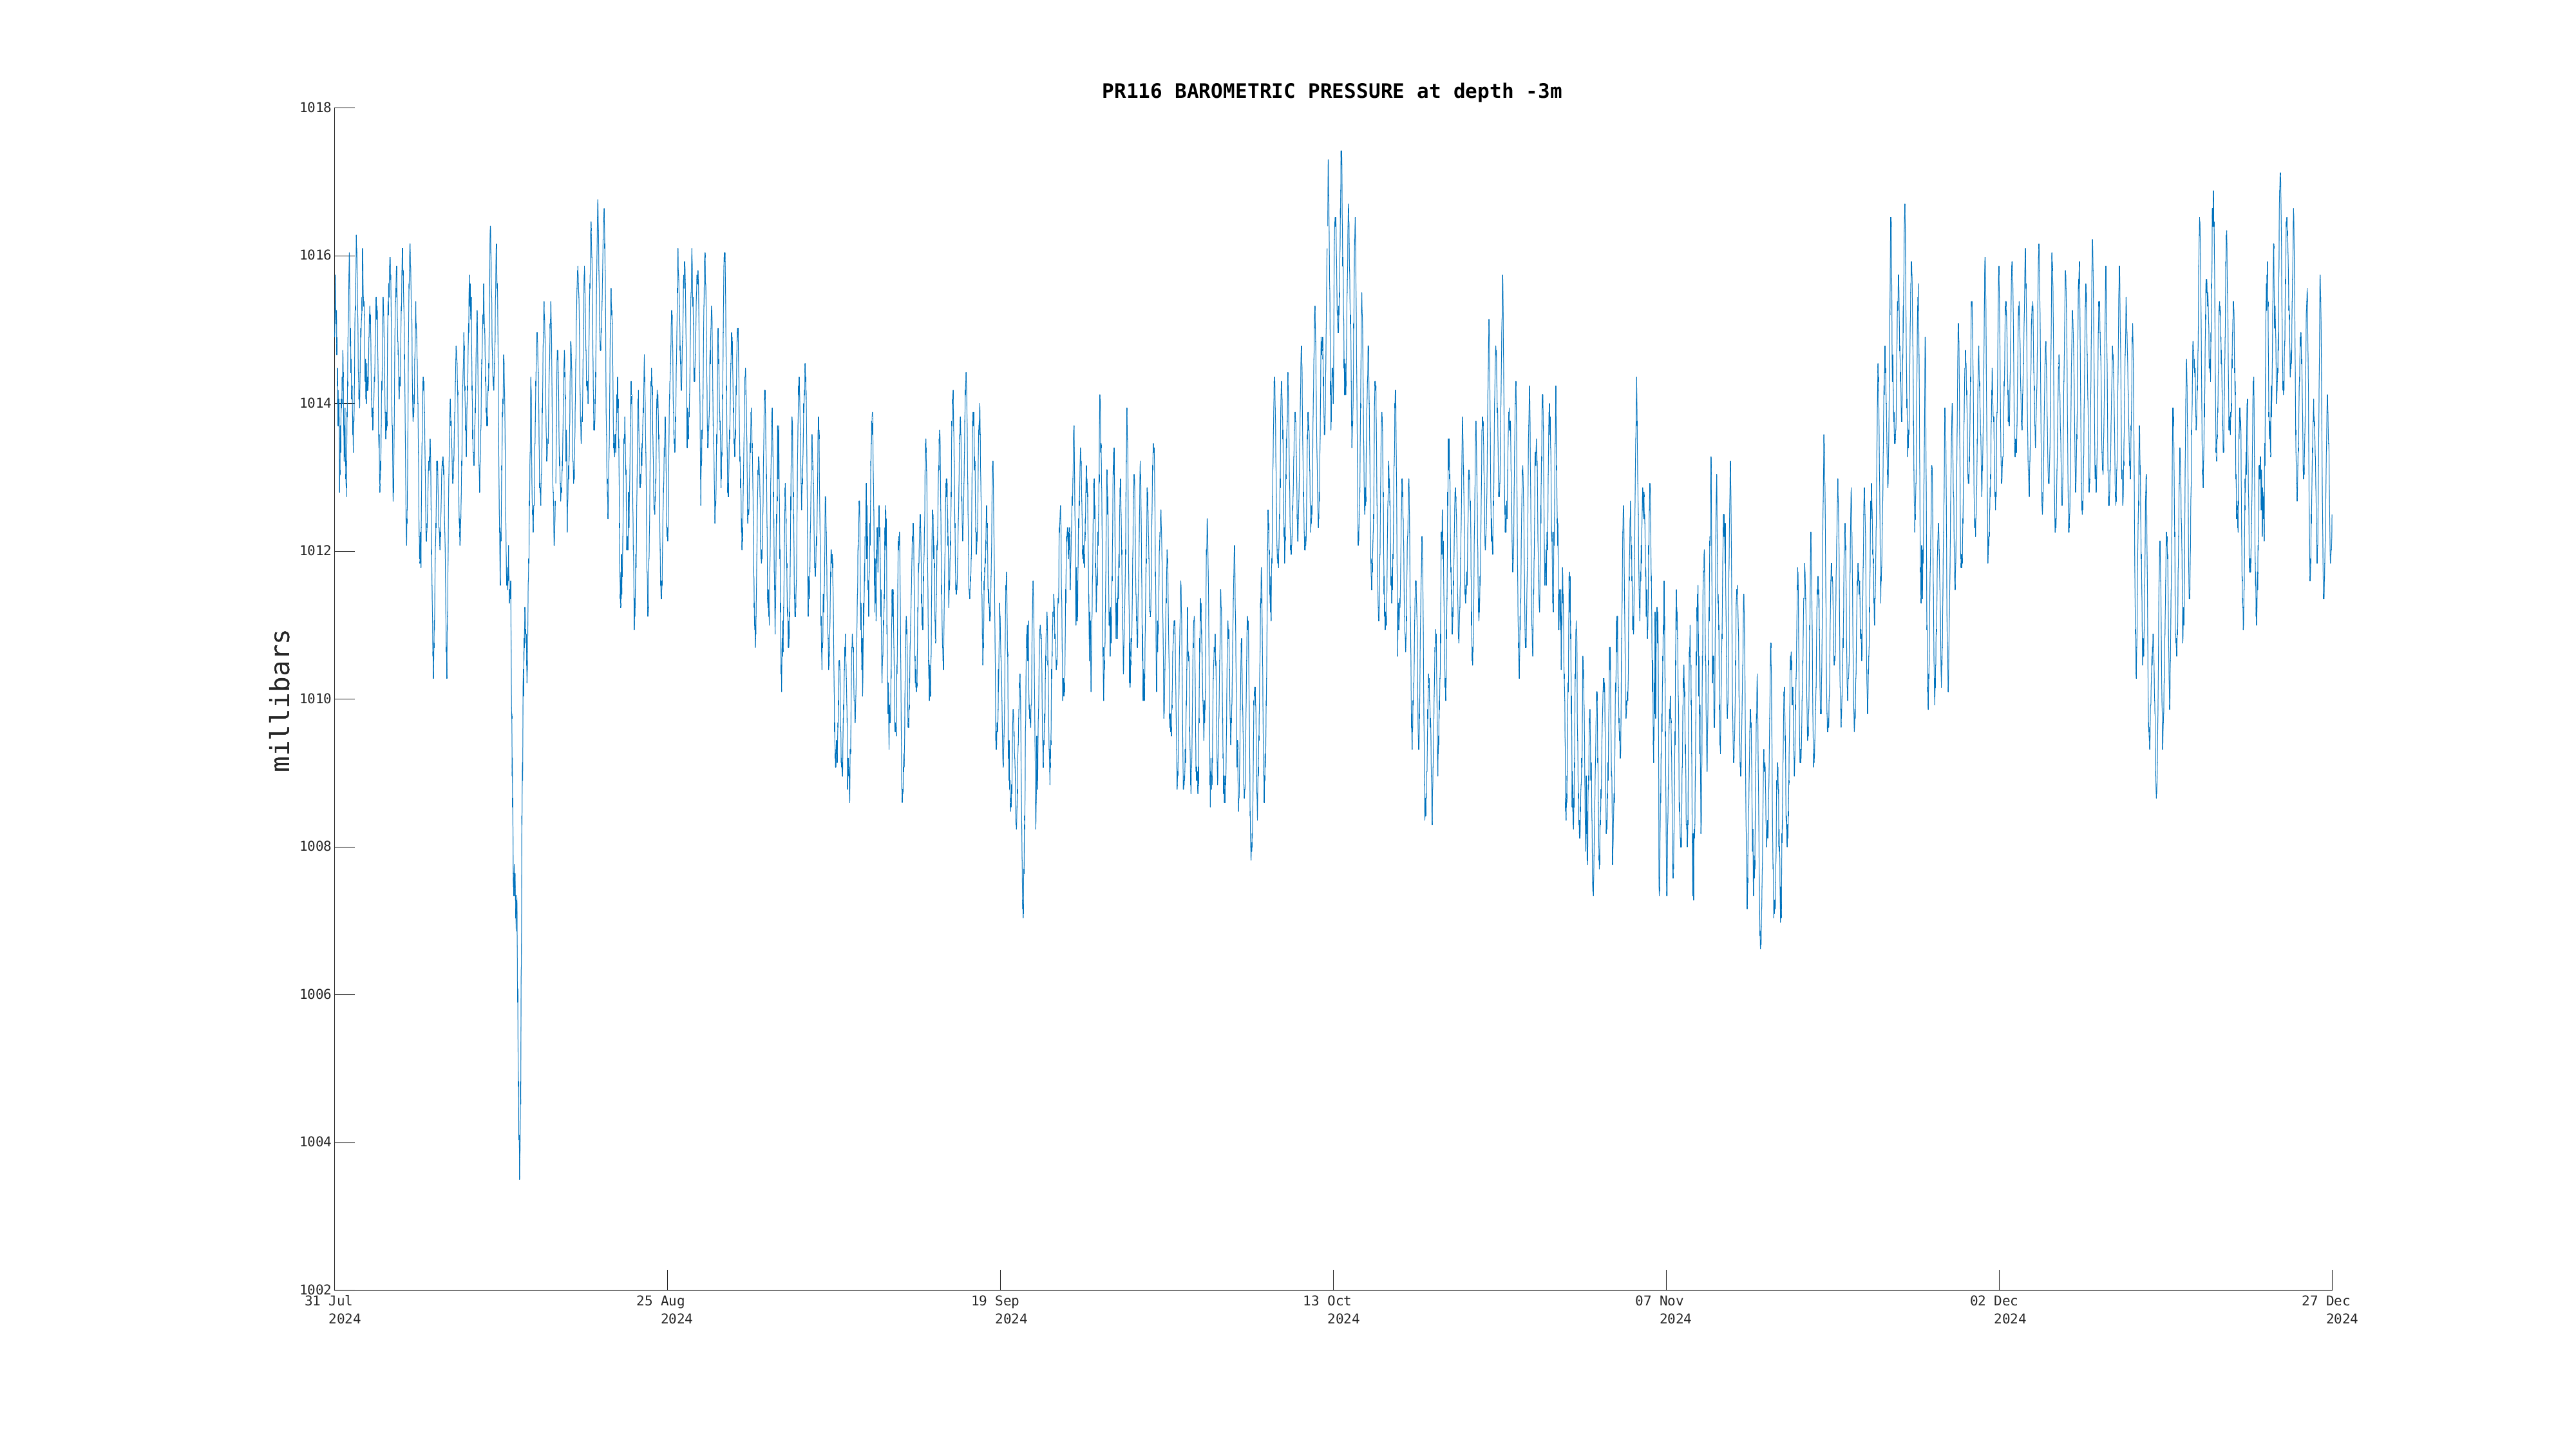
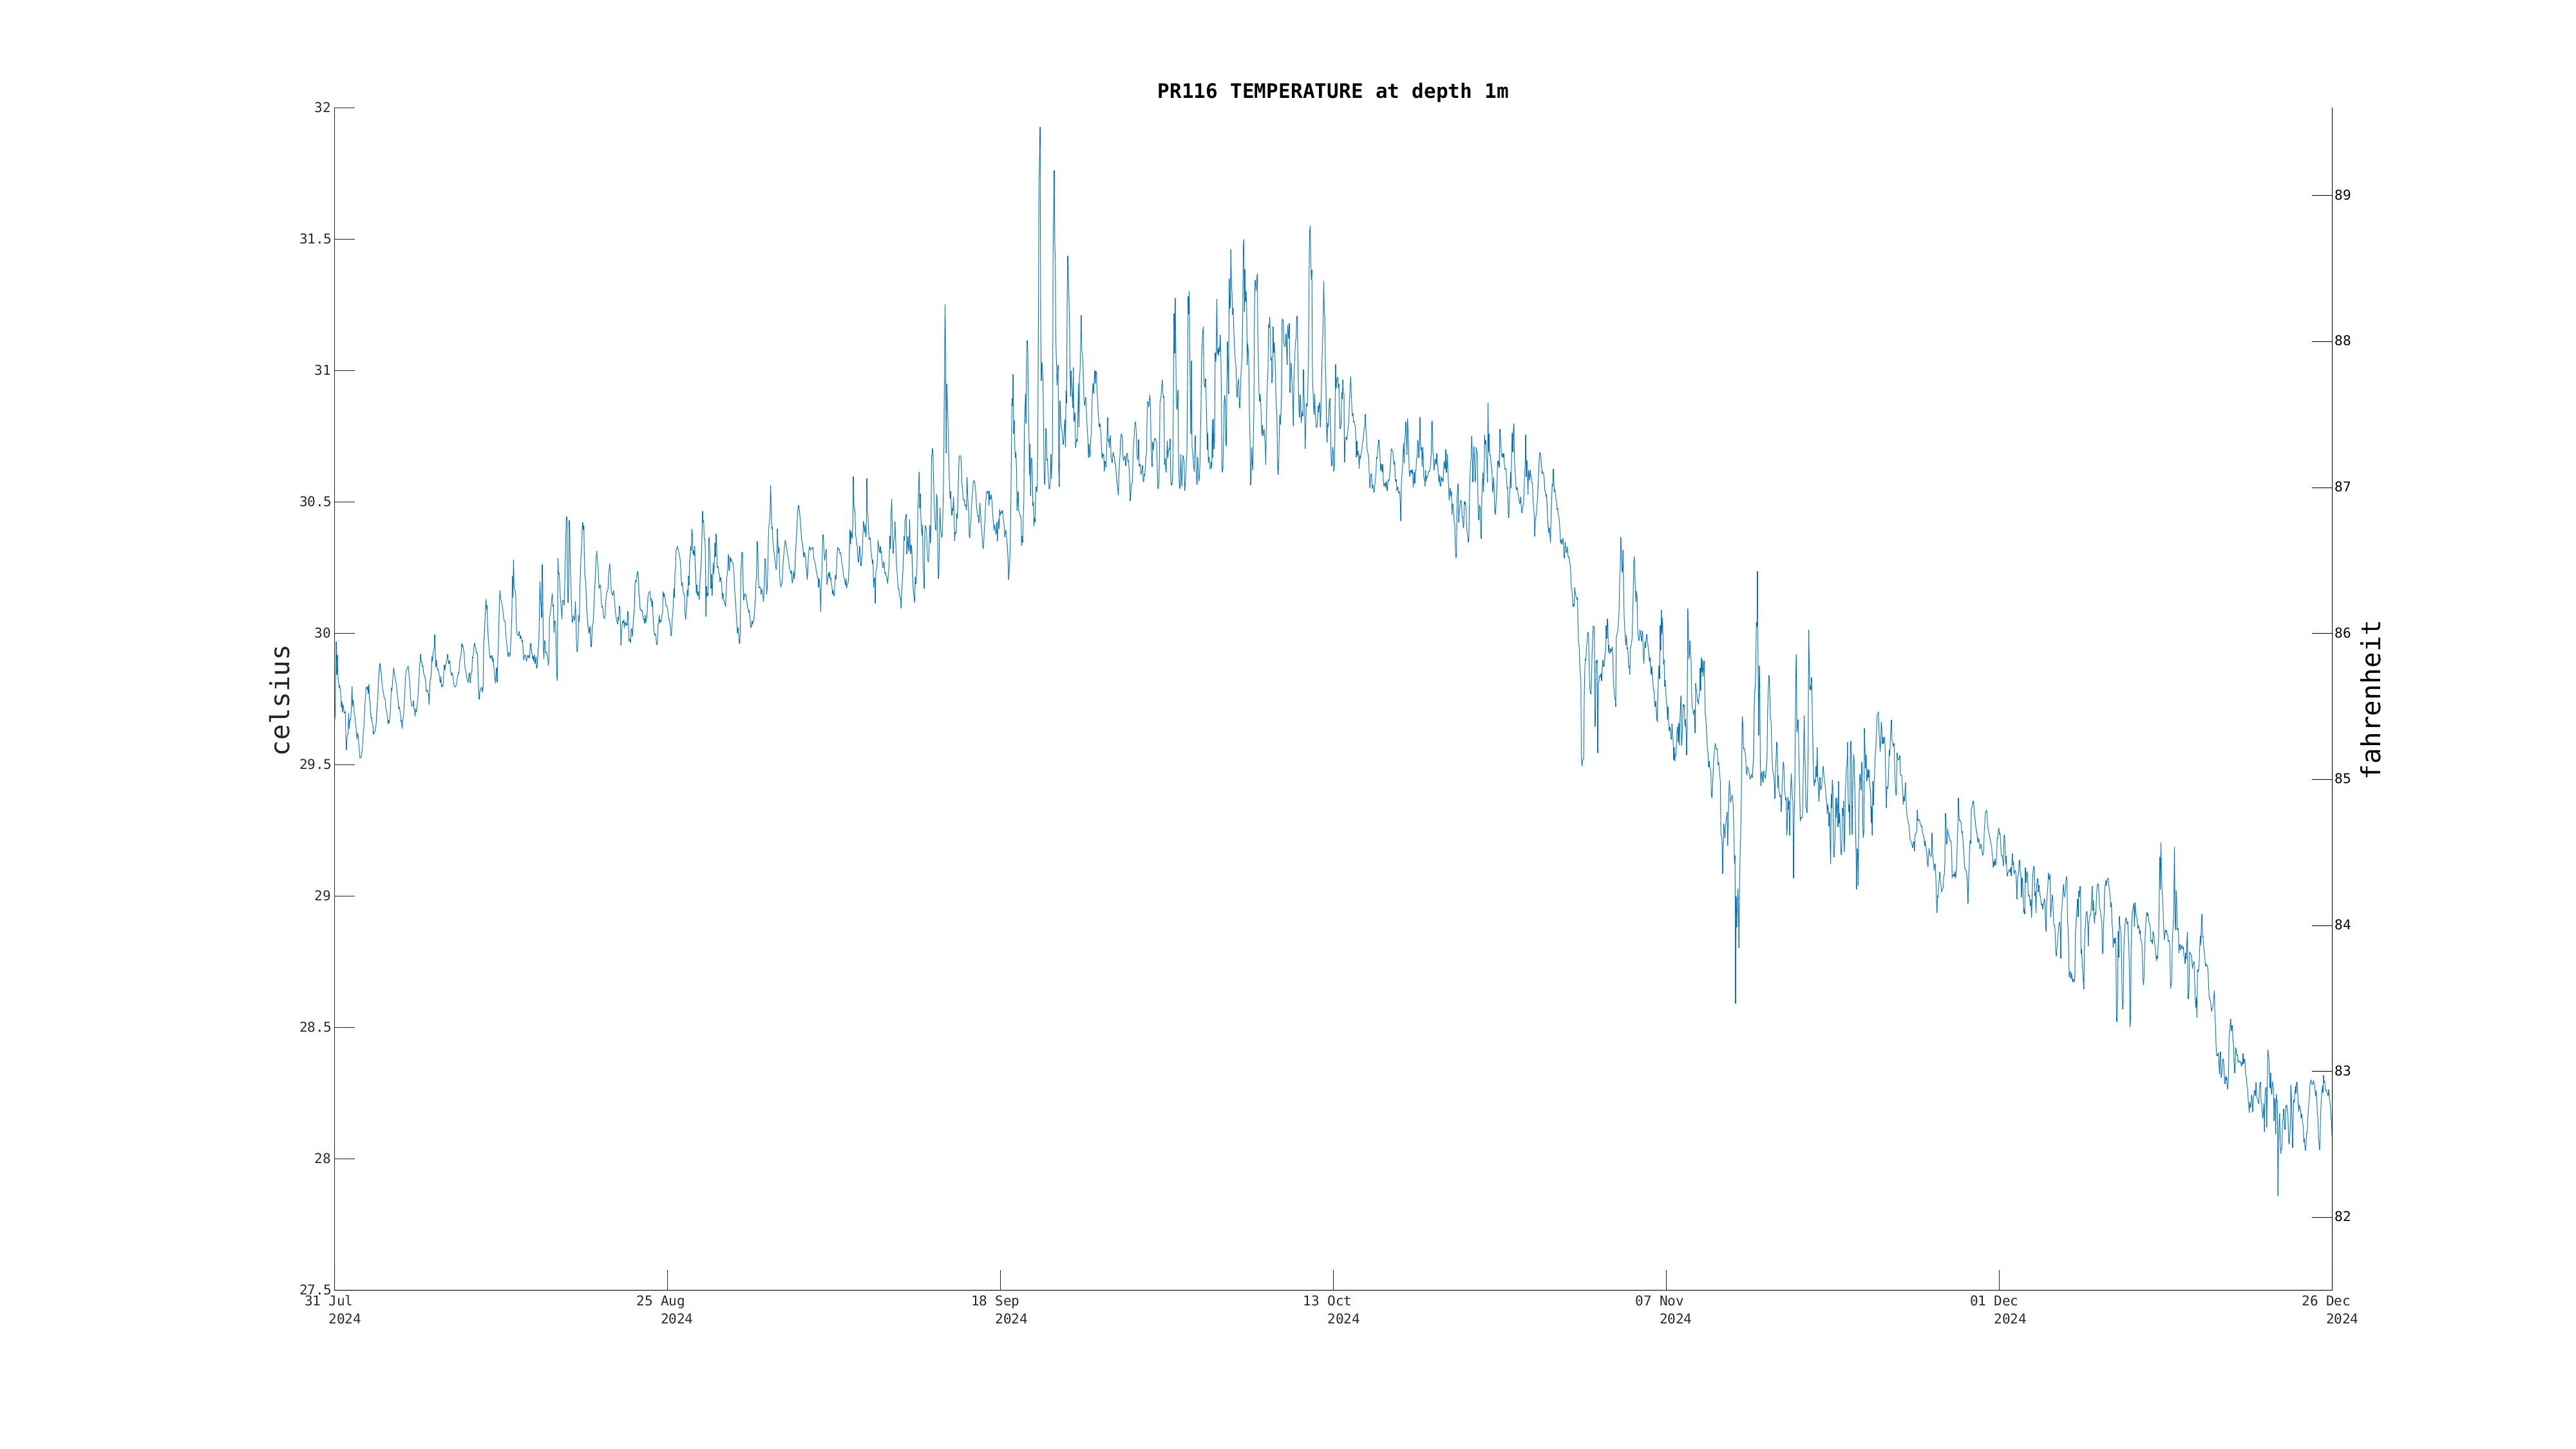
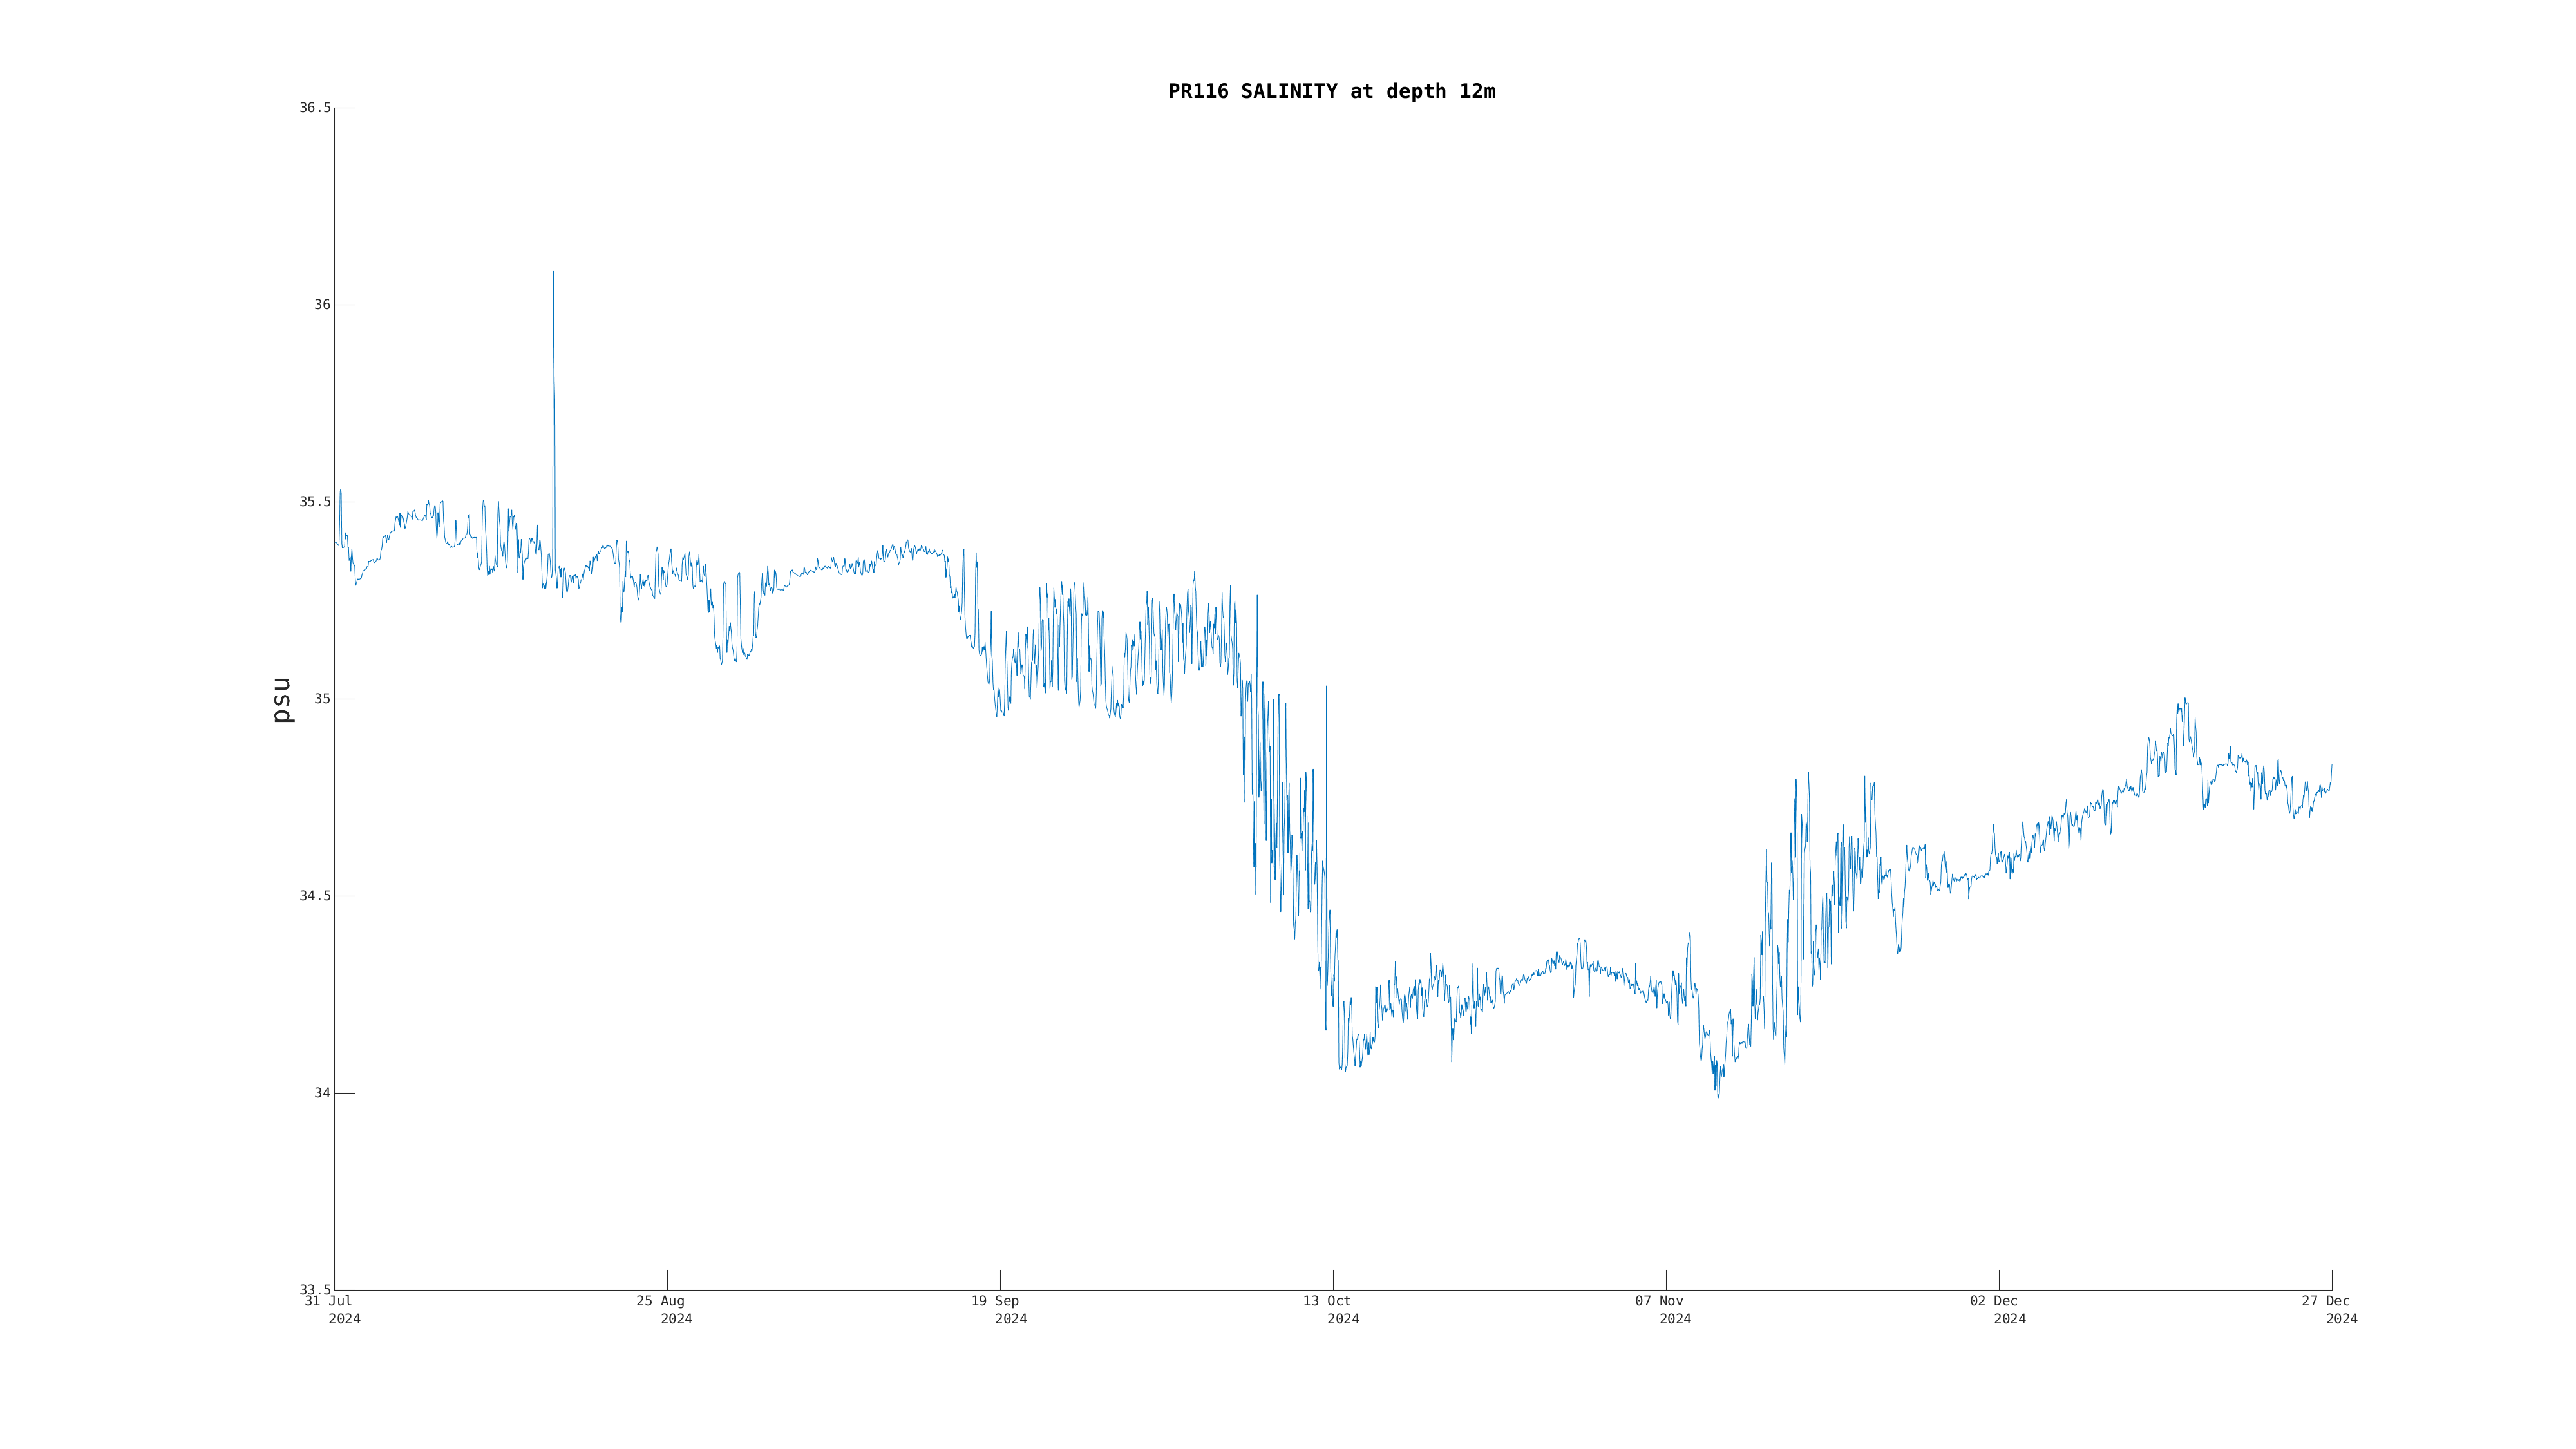
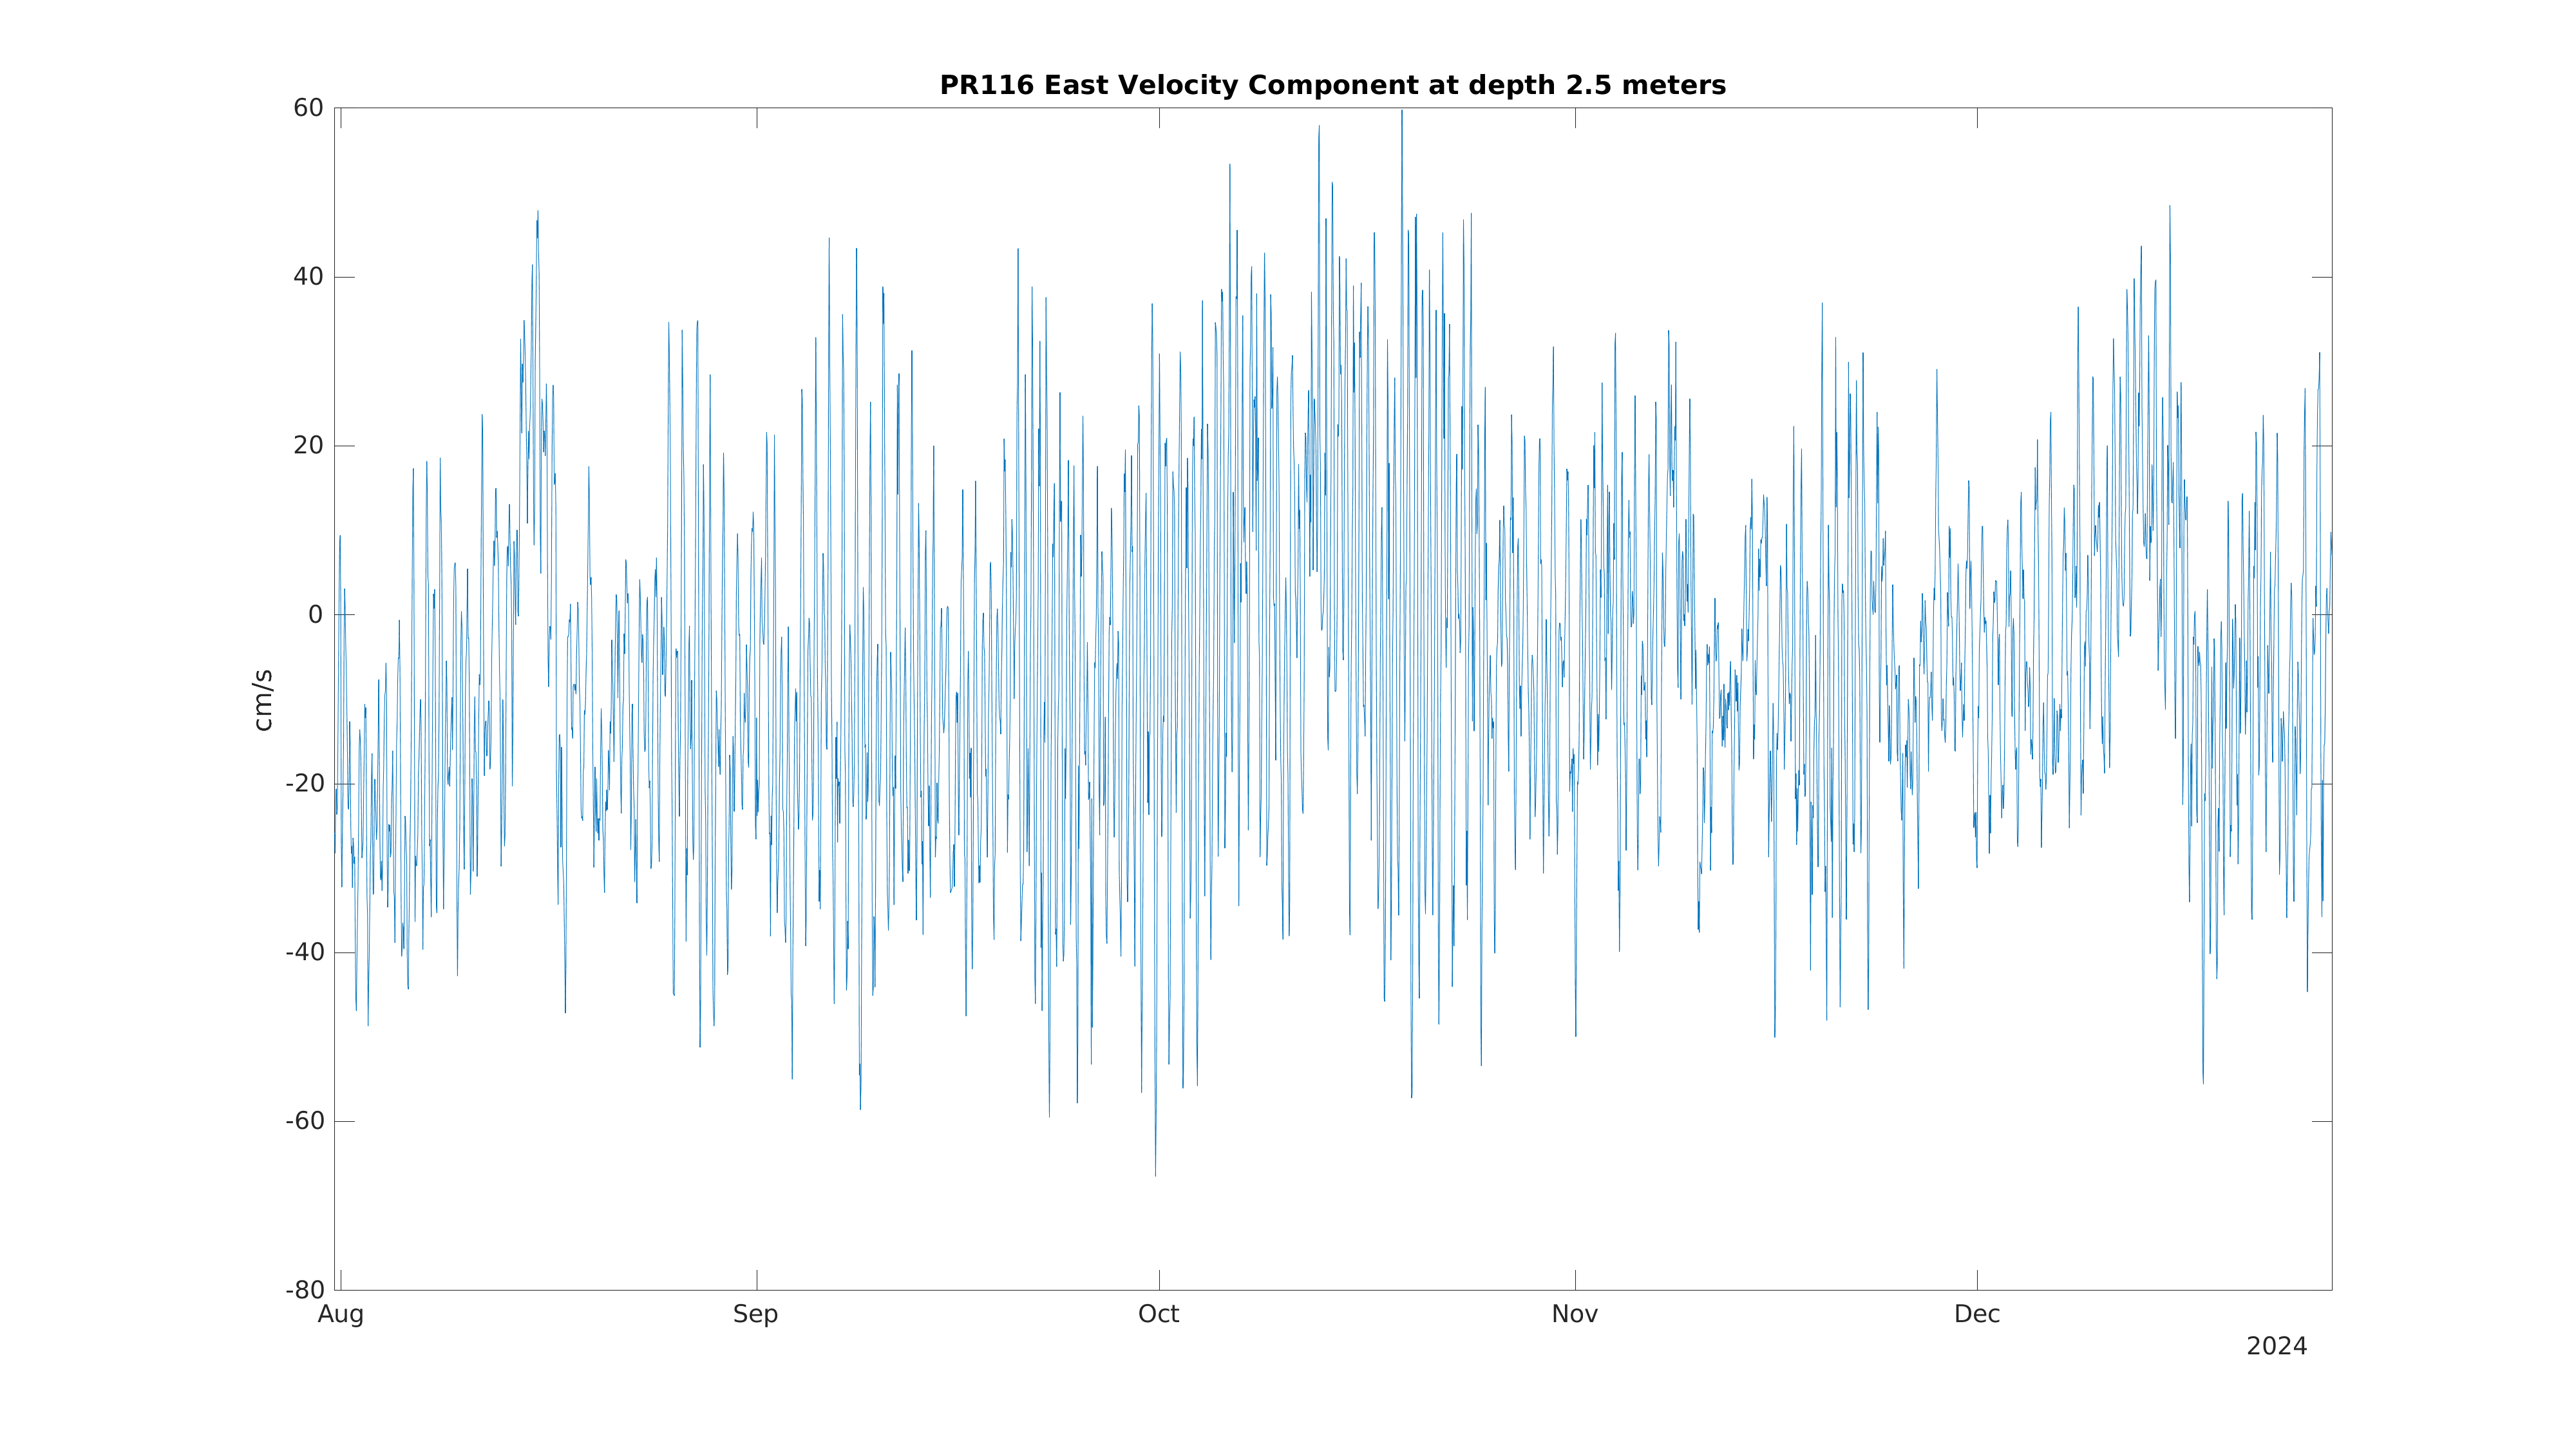
 This Deployment:
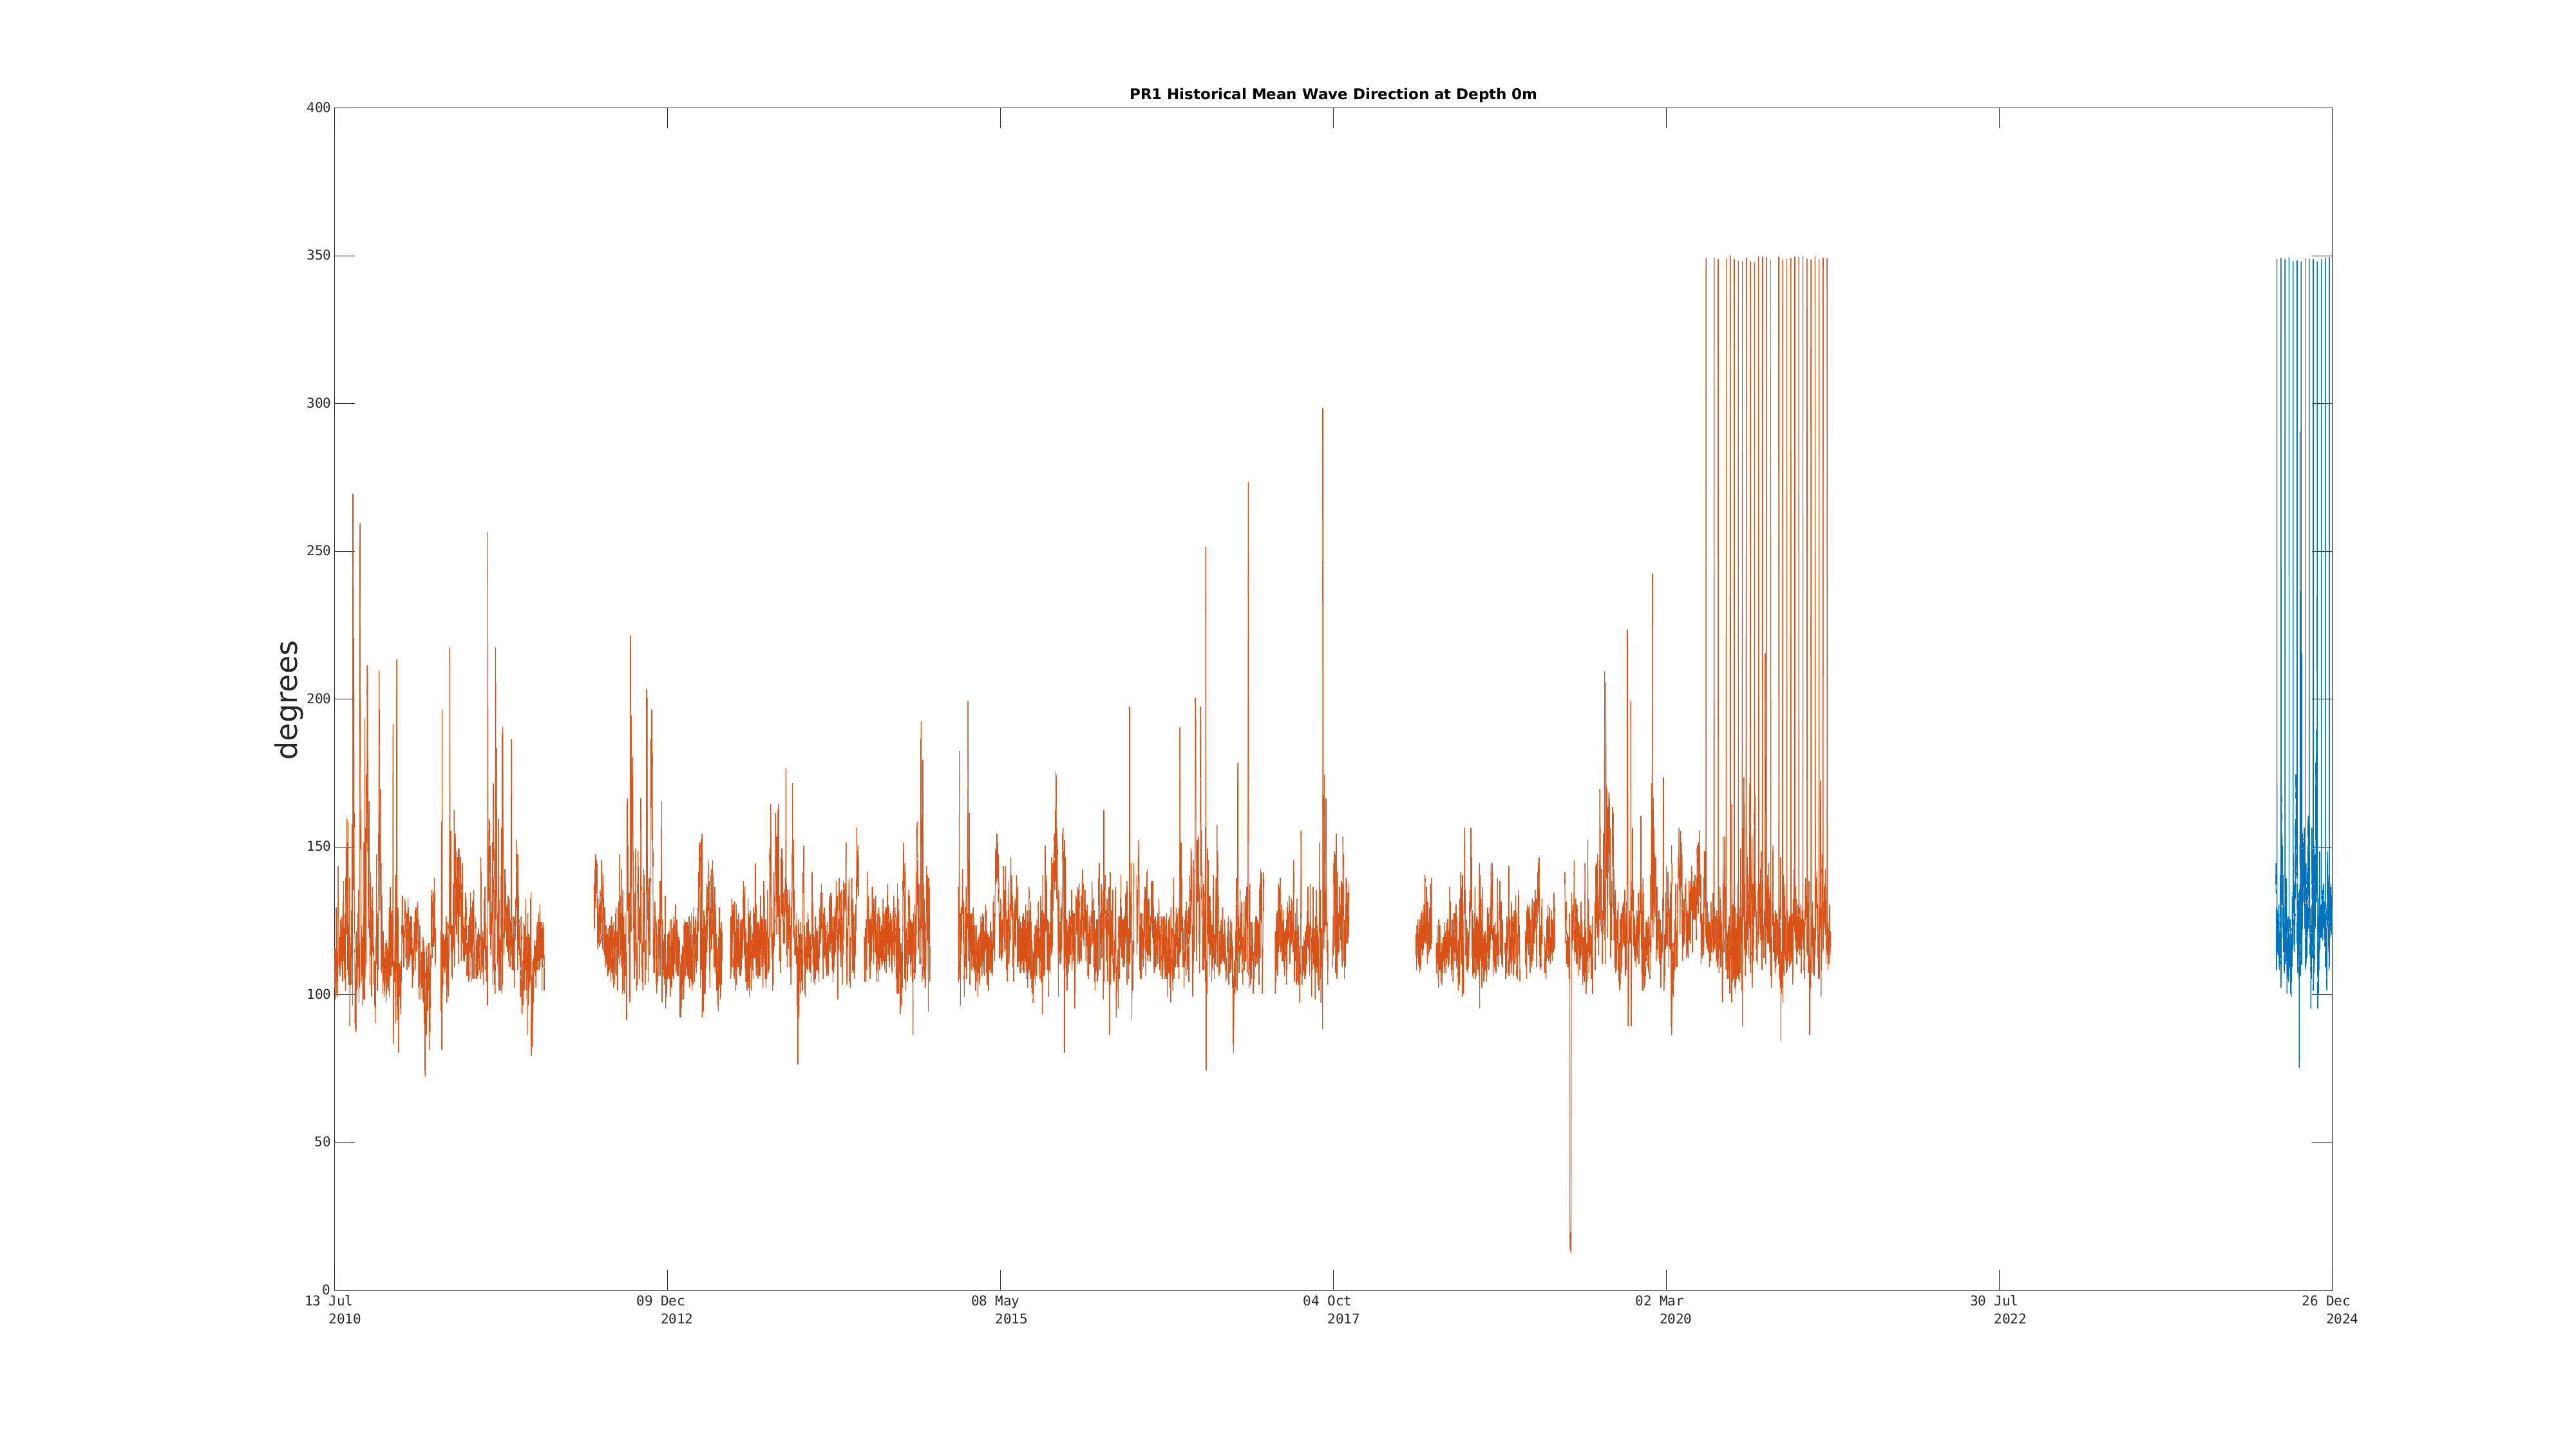
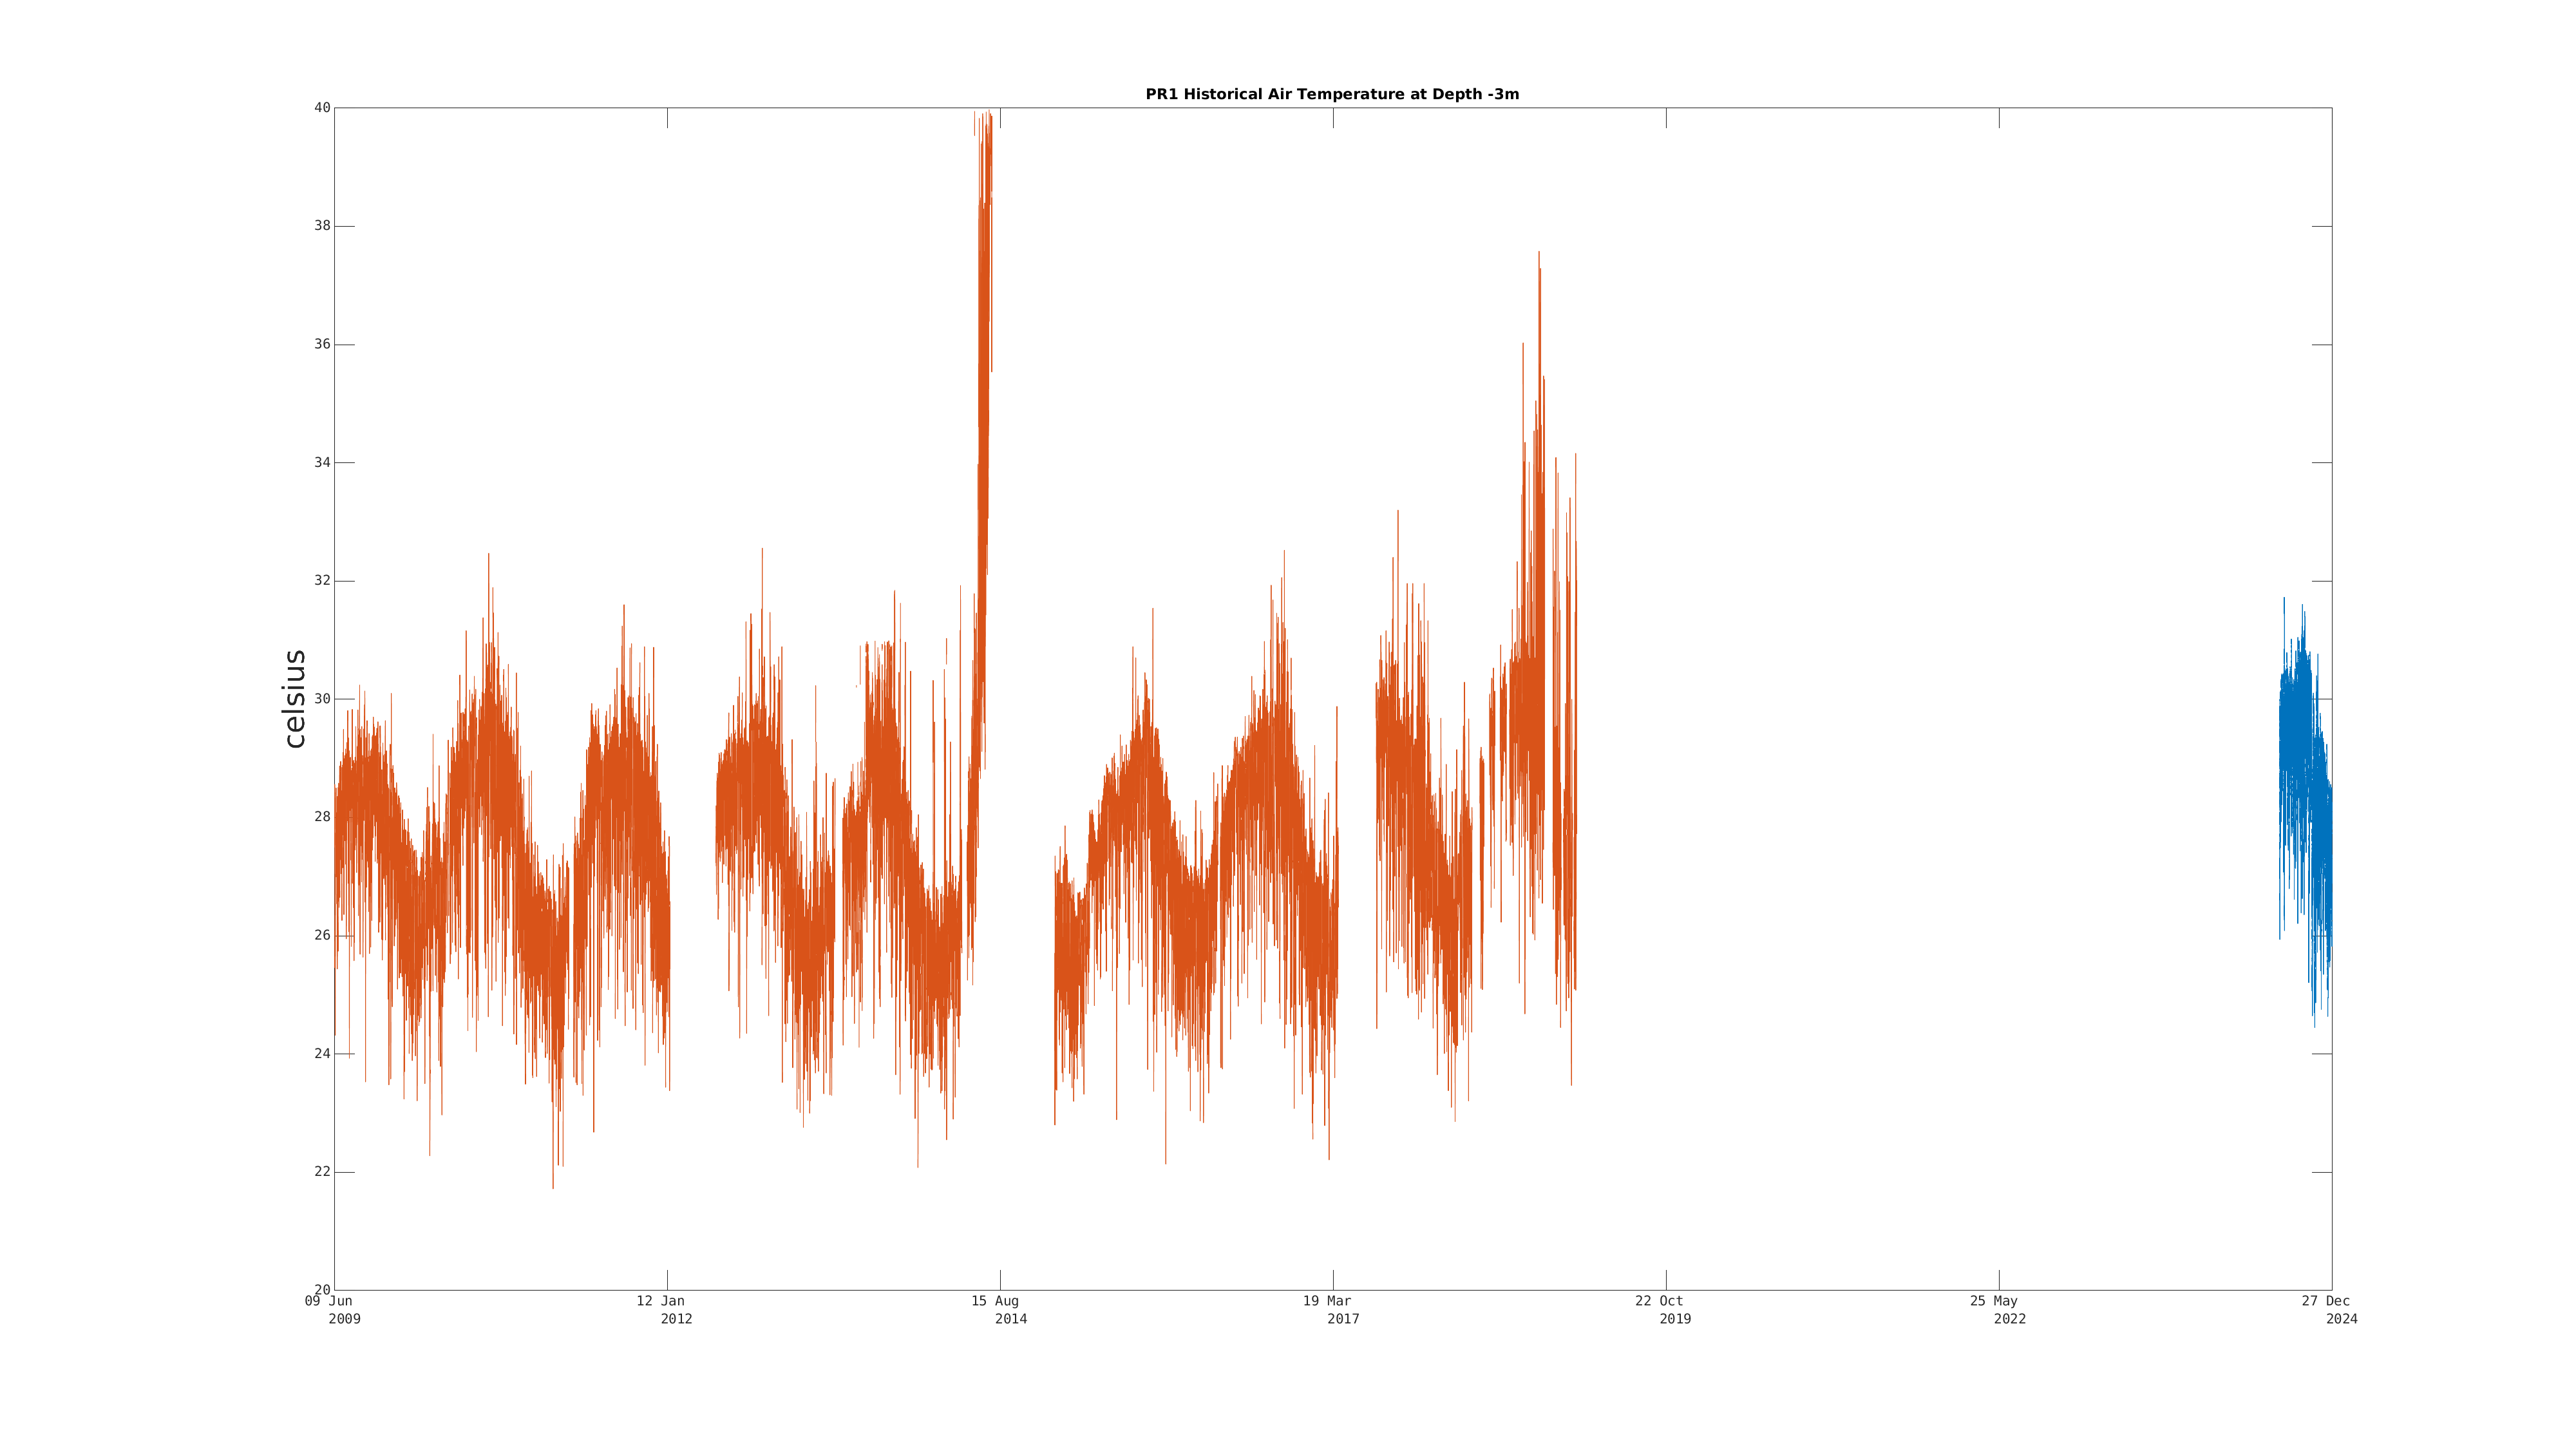
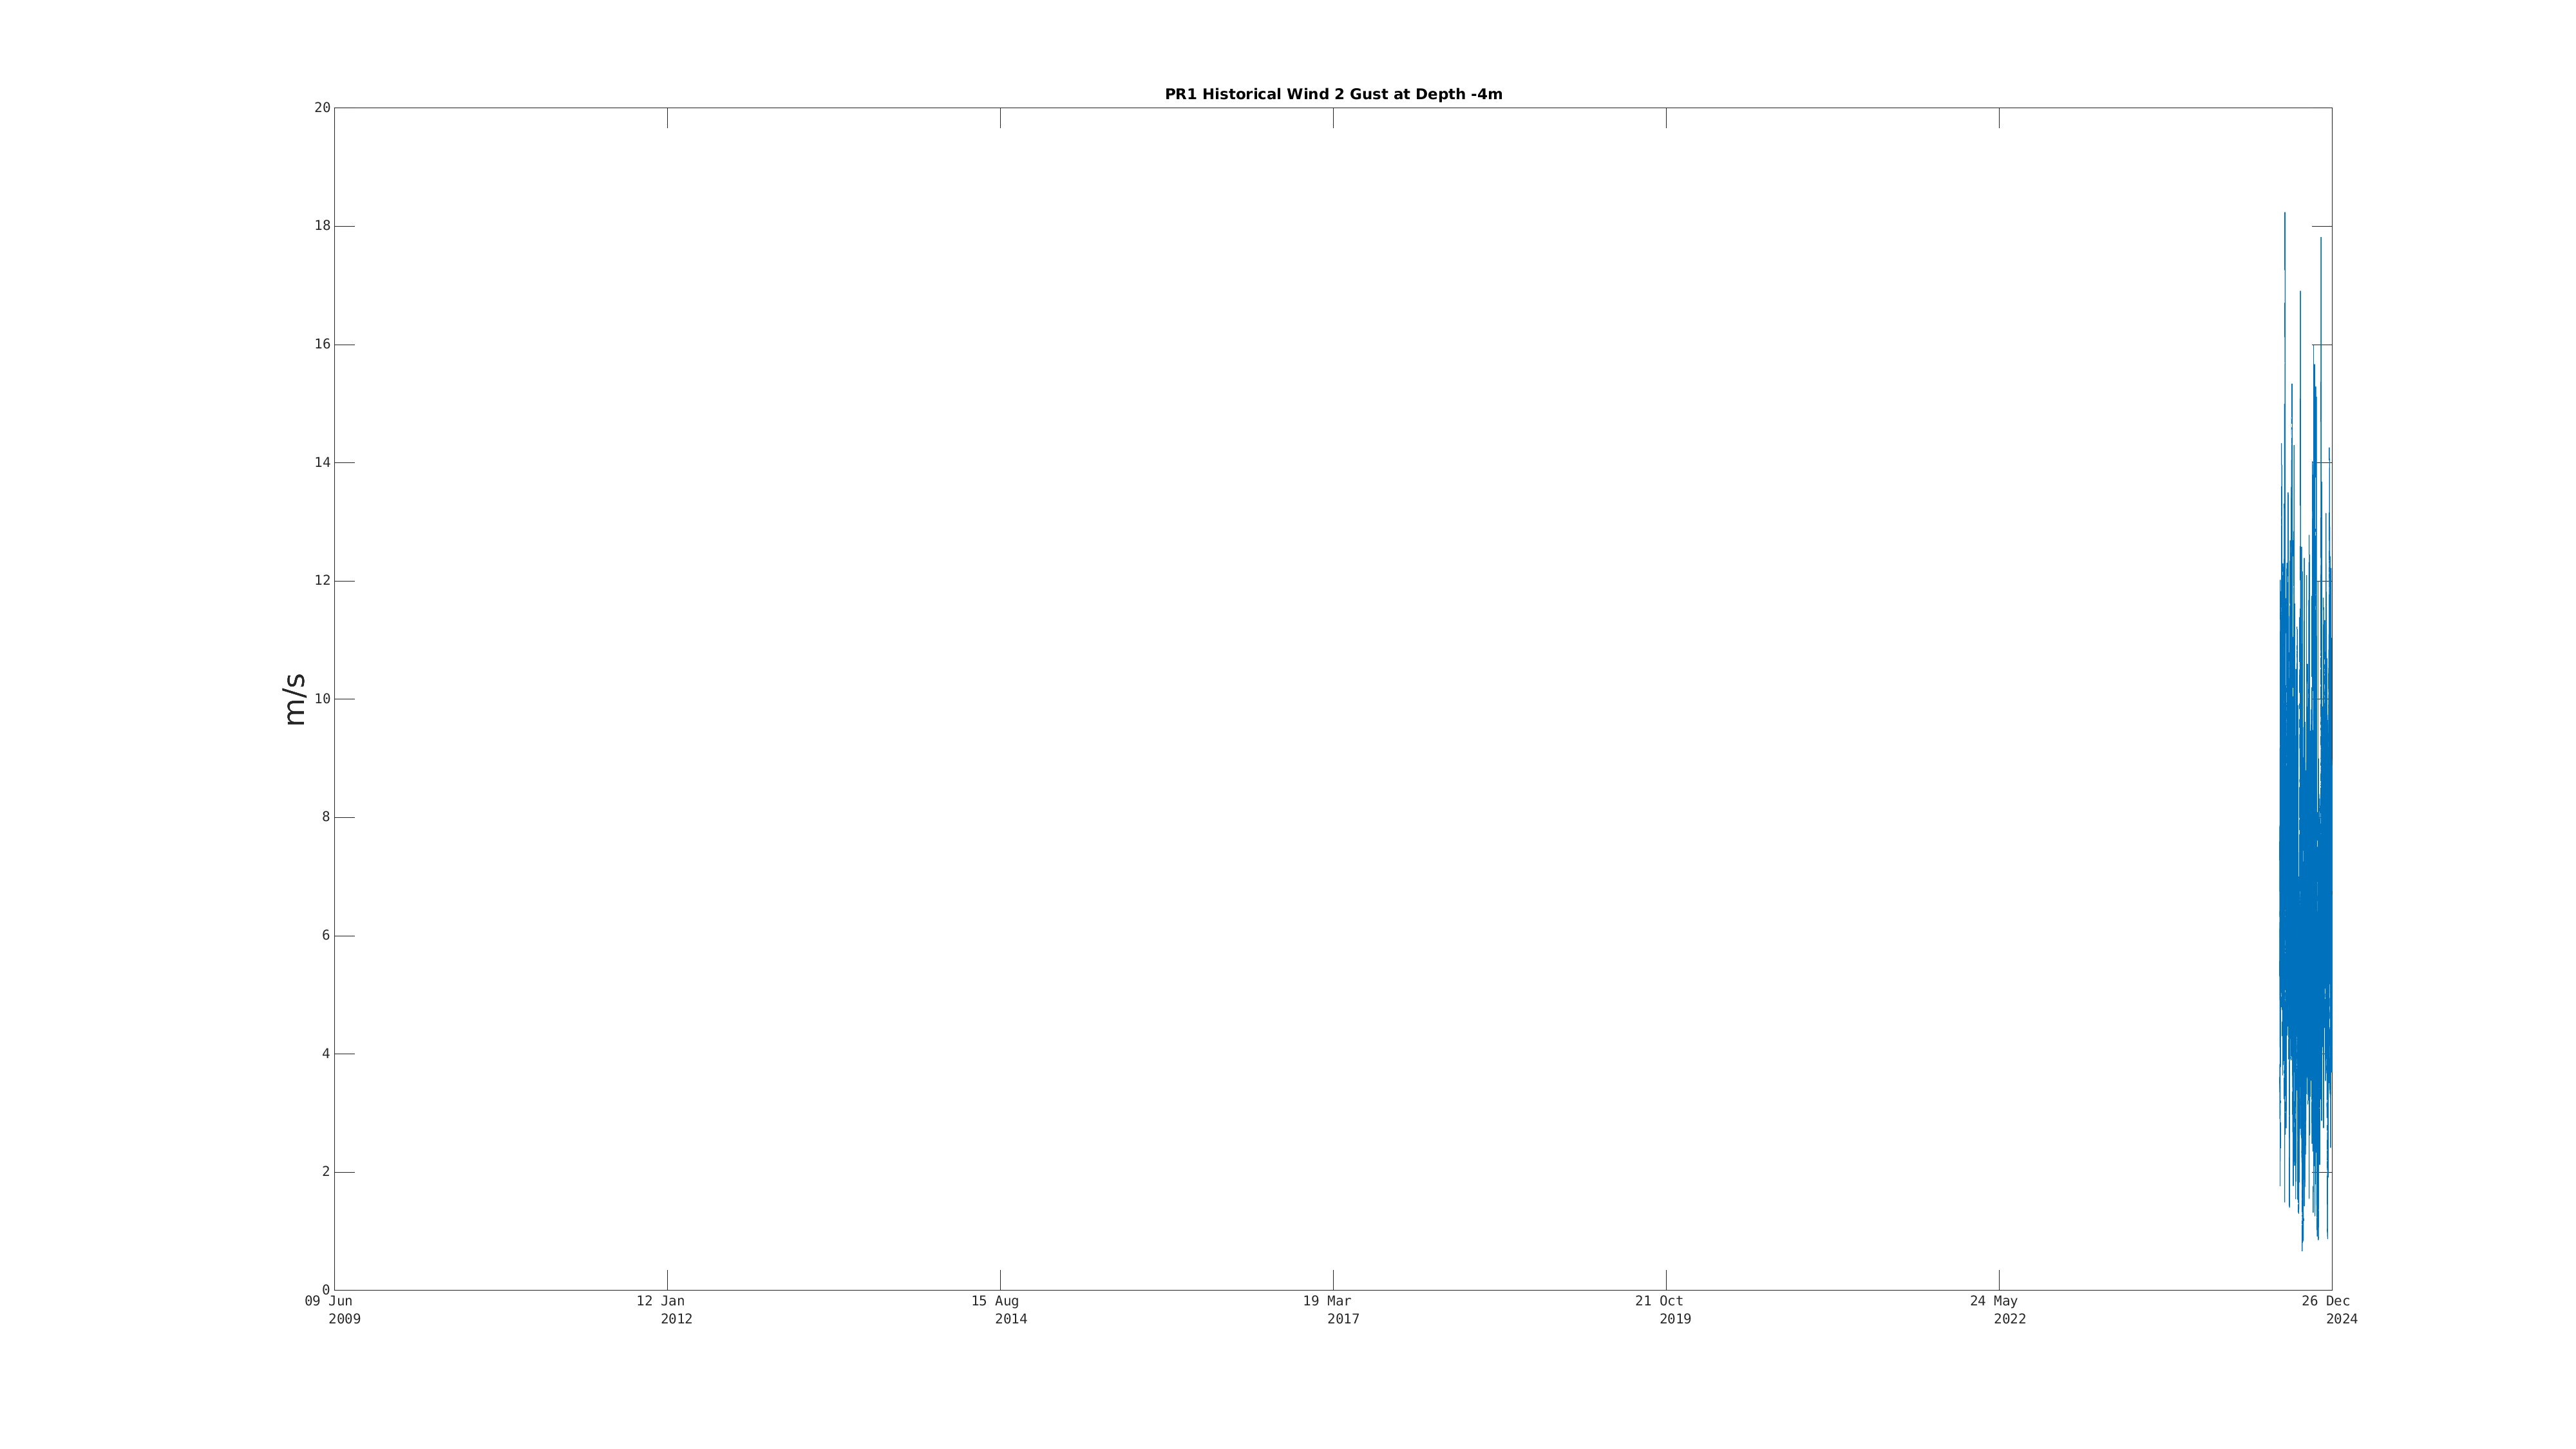
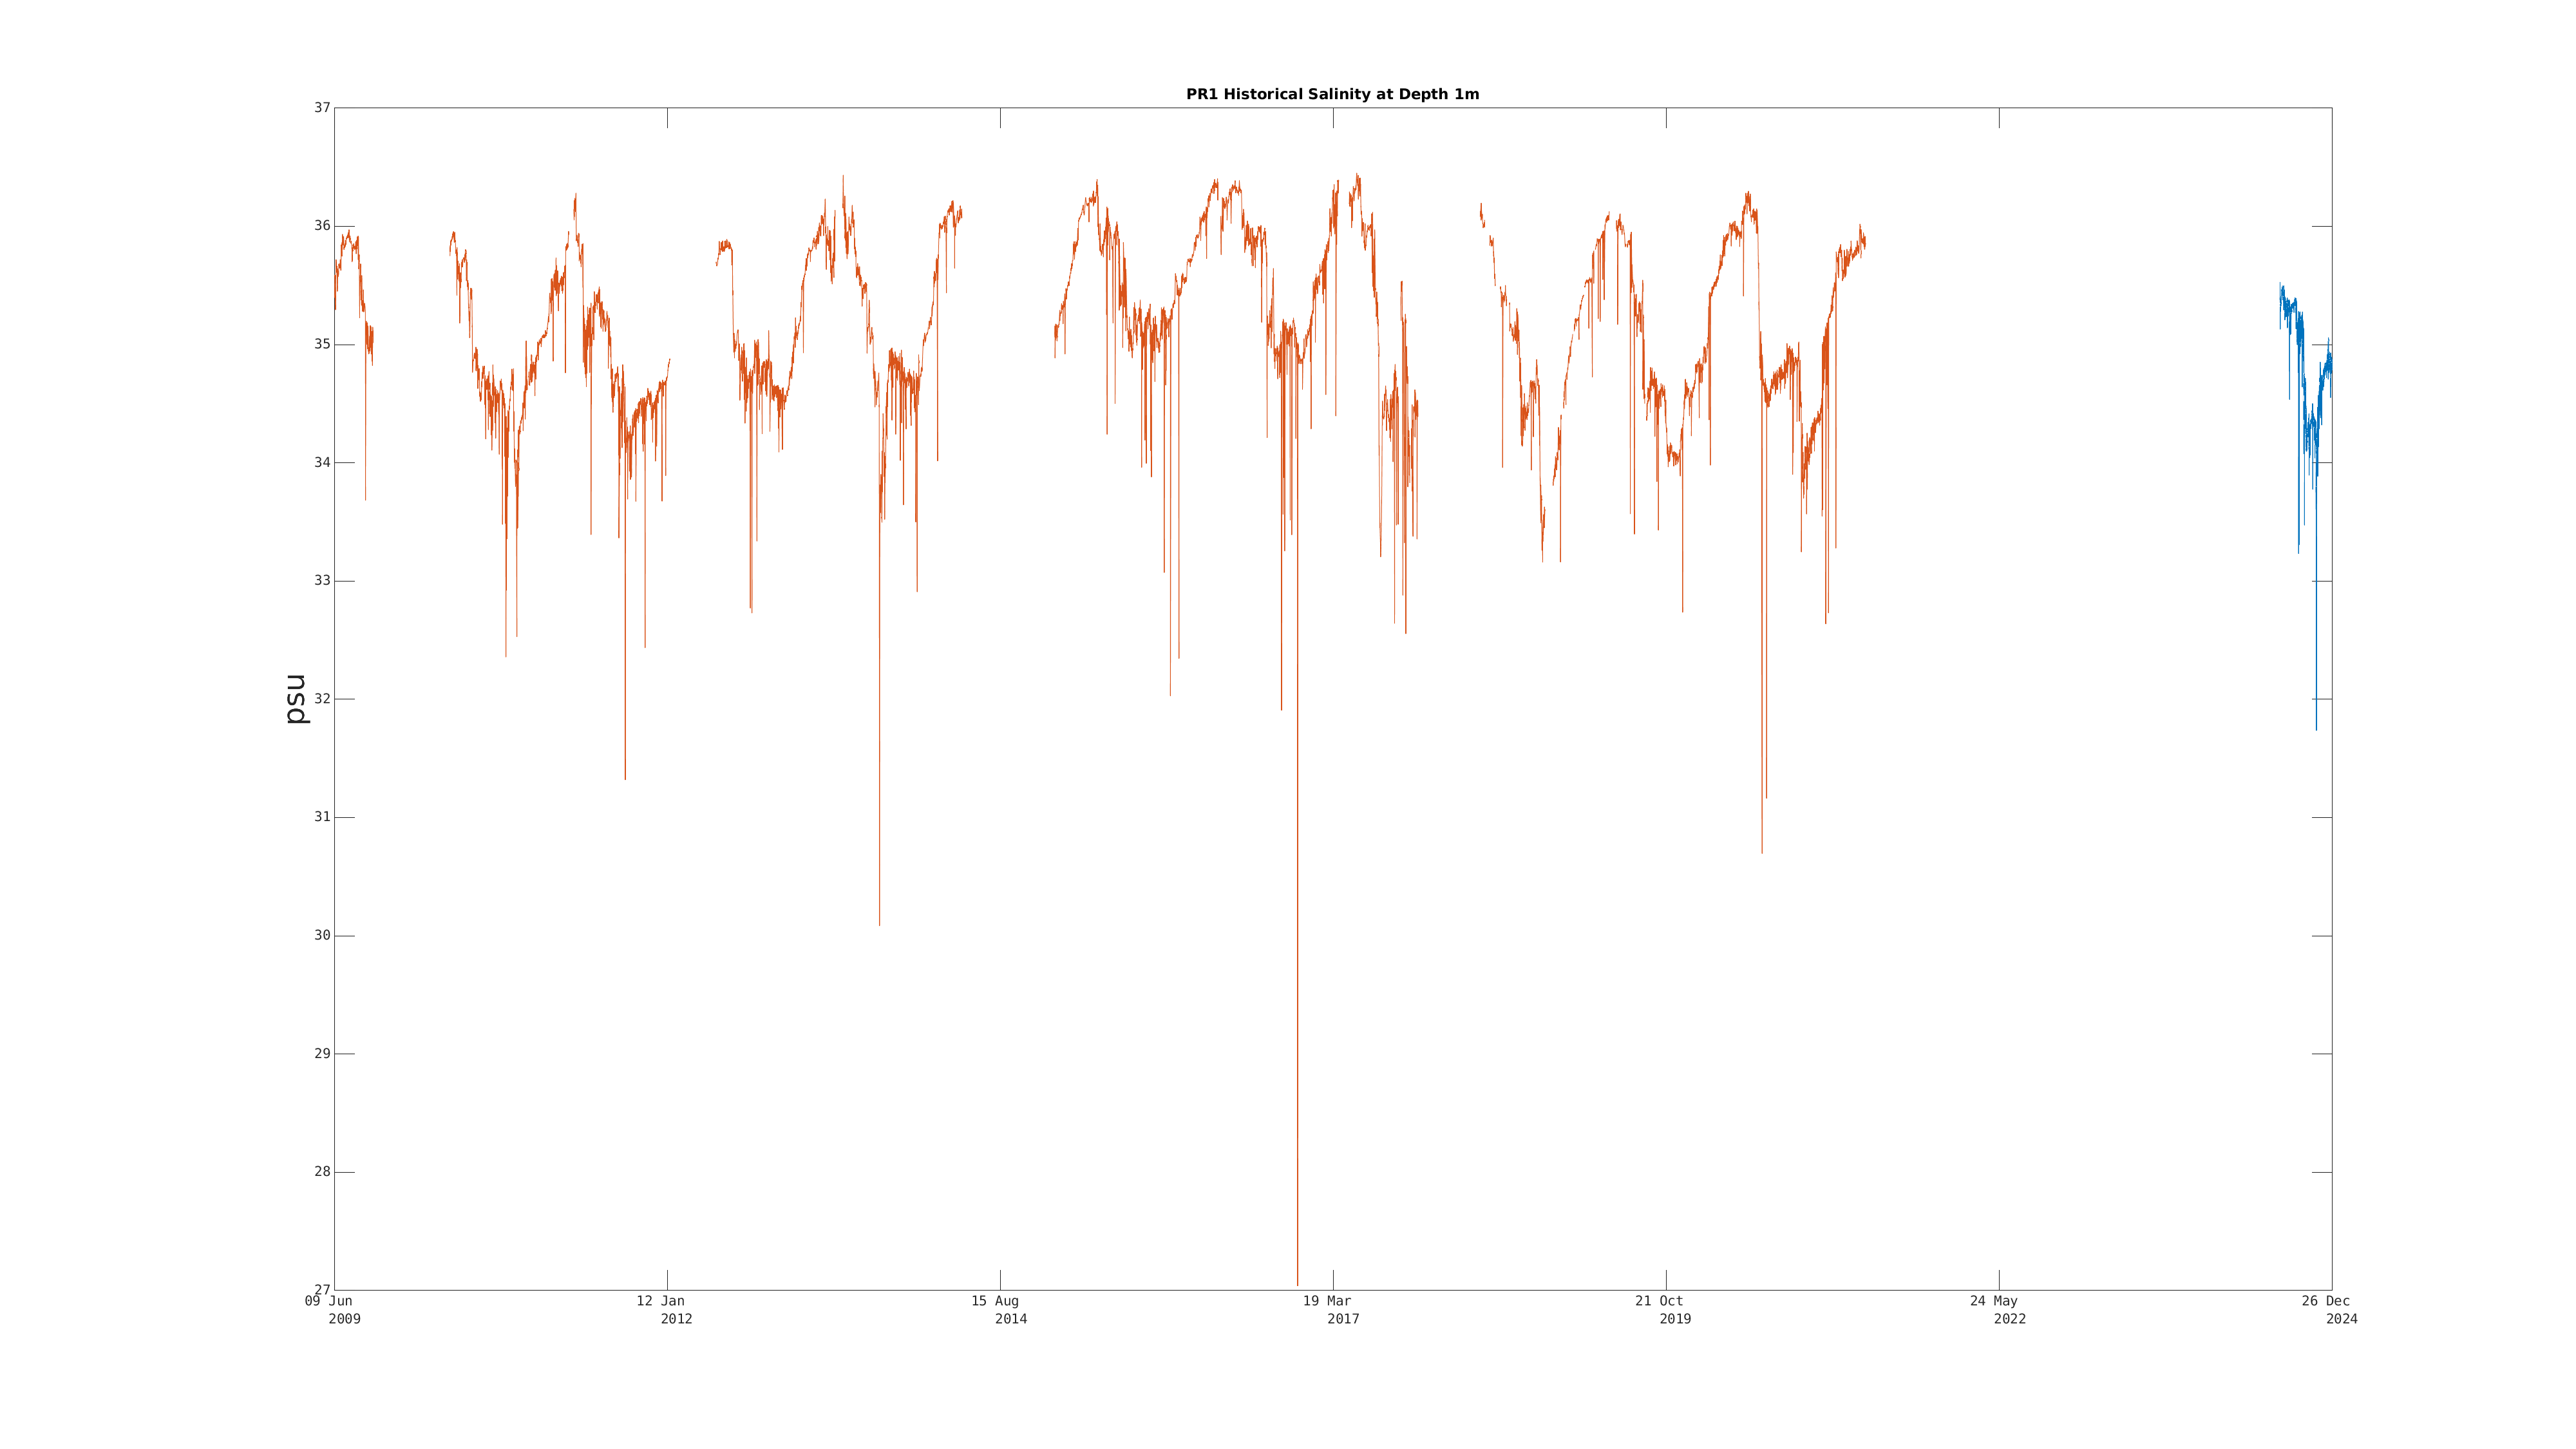
 Entire Position History:
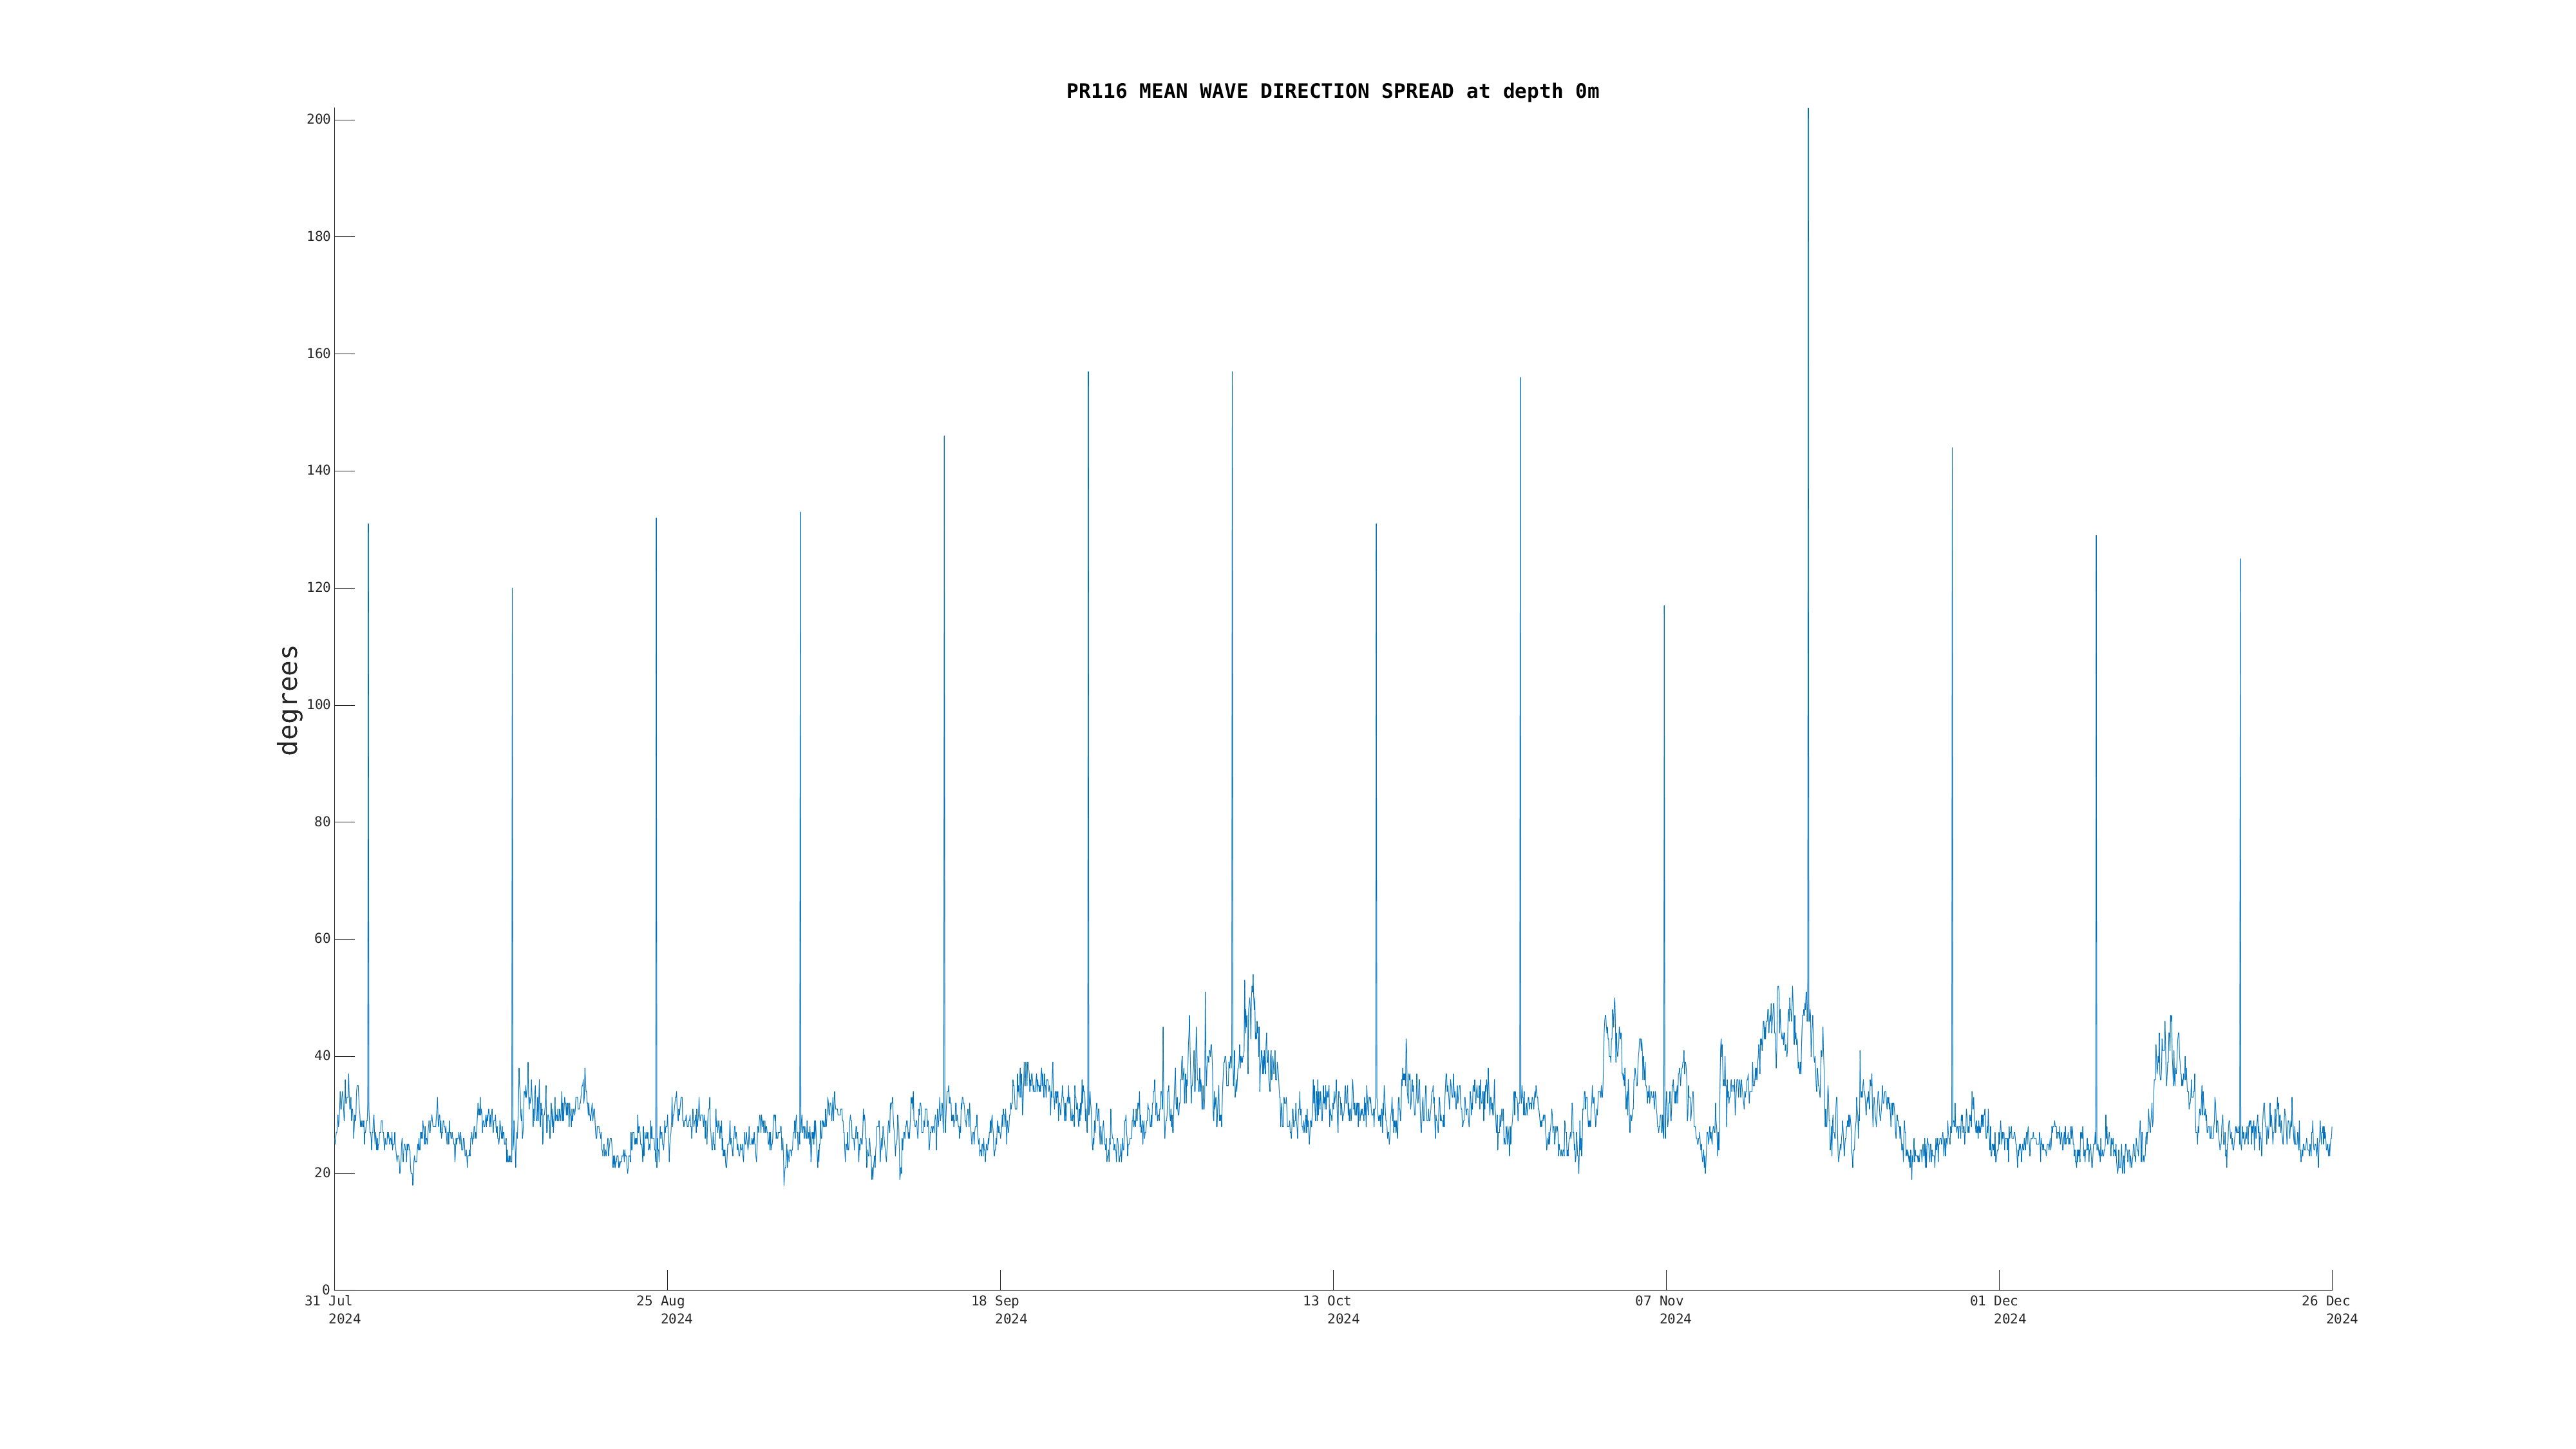
 Latest Month's:
 This Deployment:
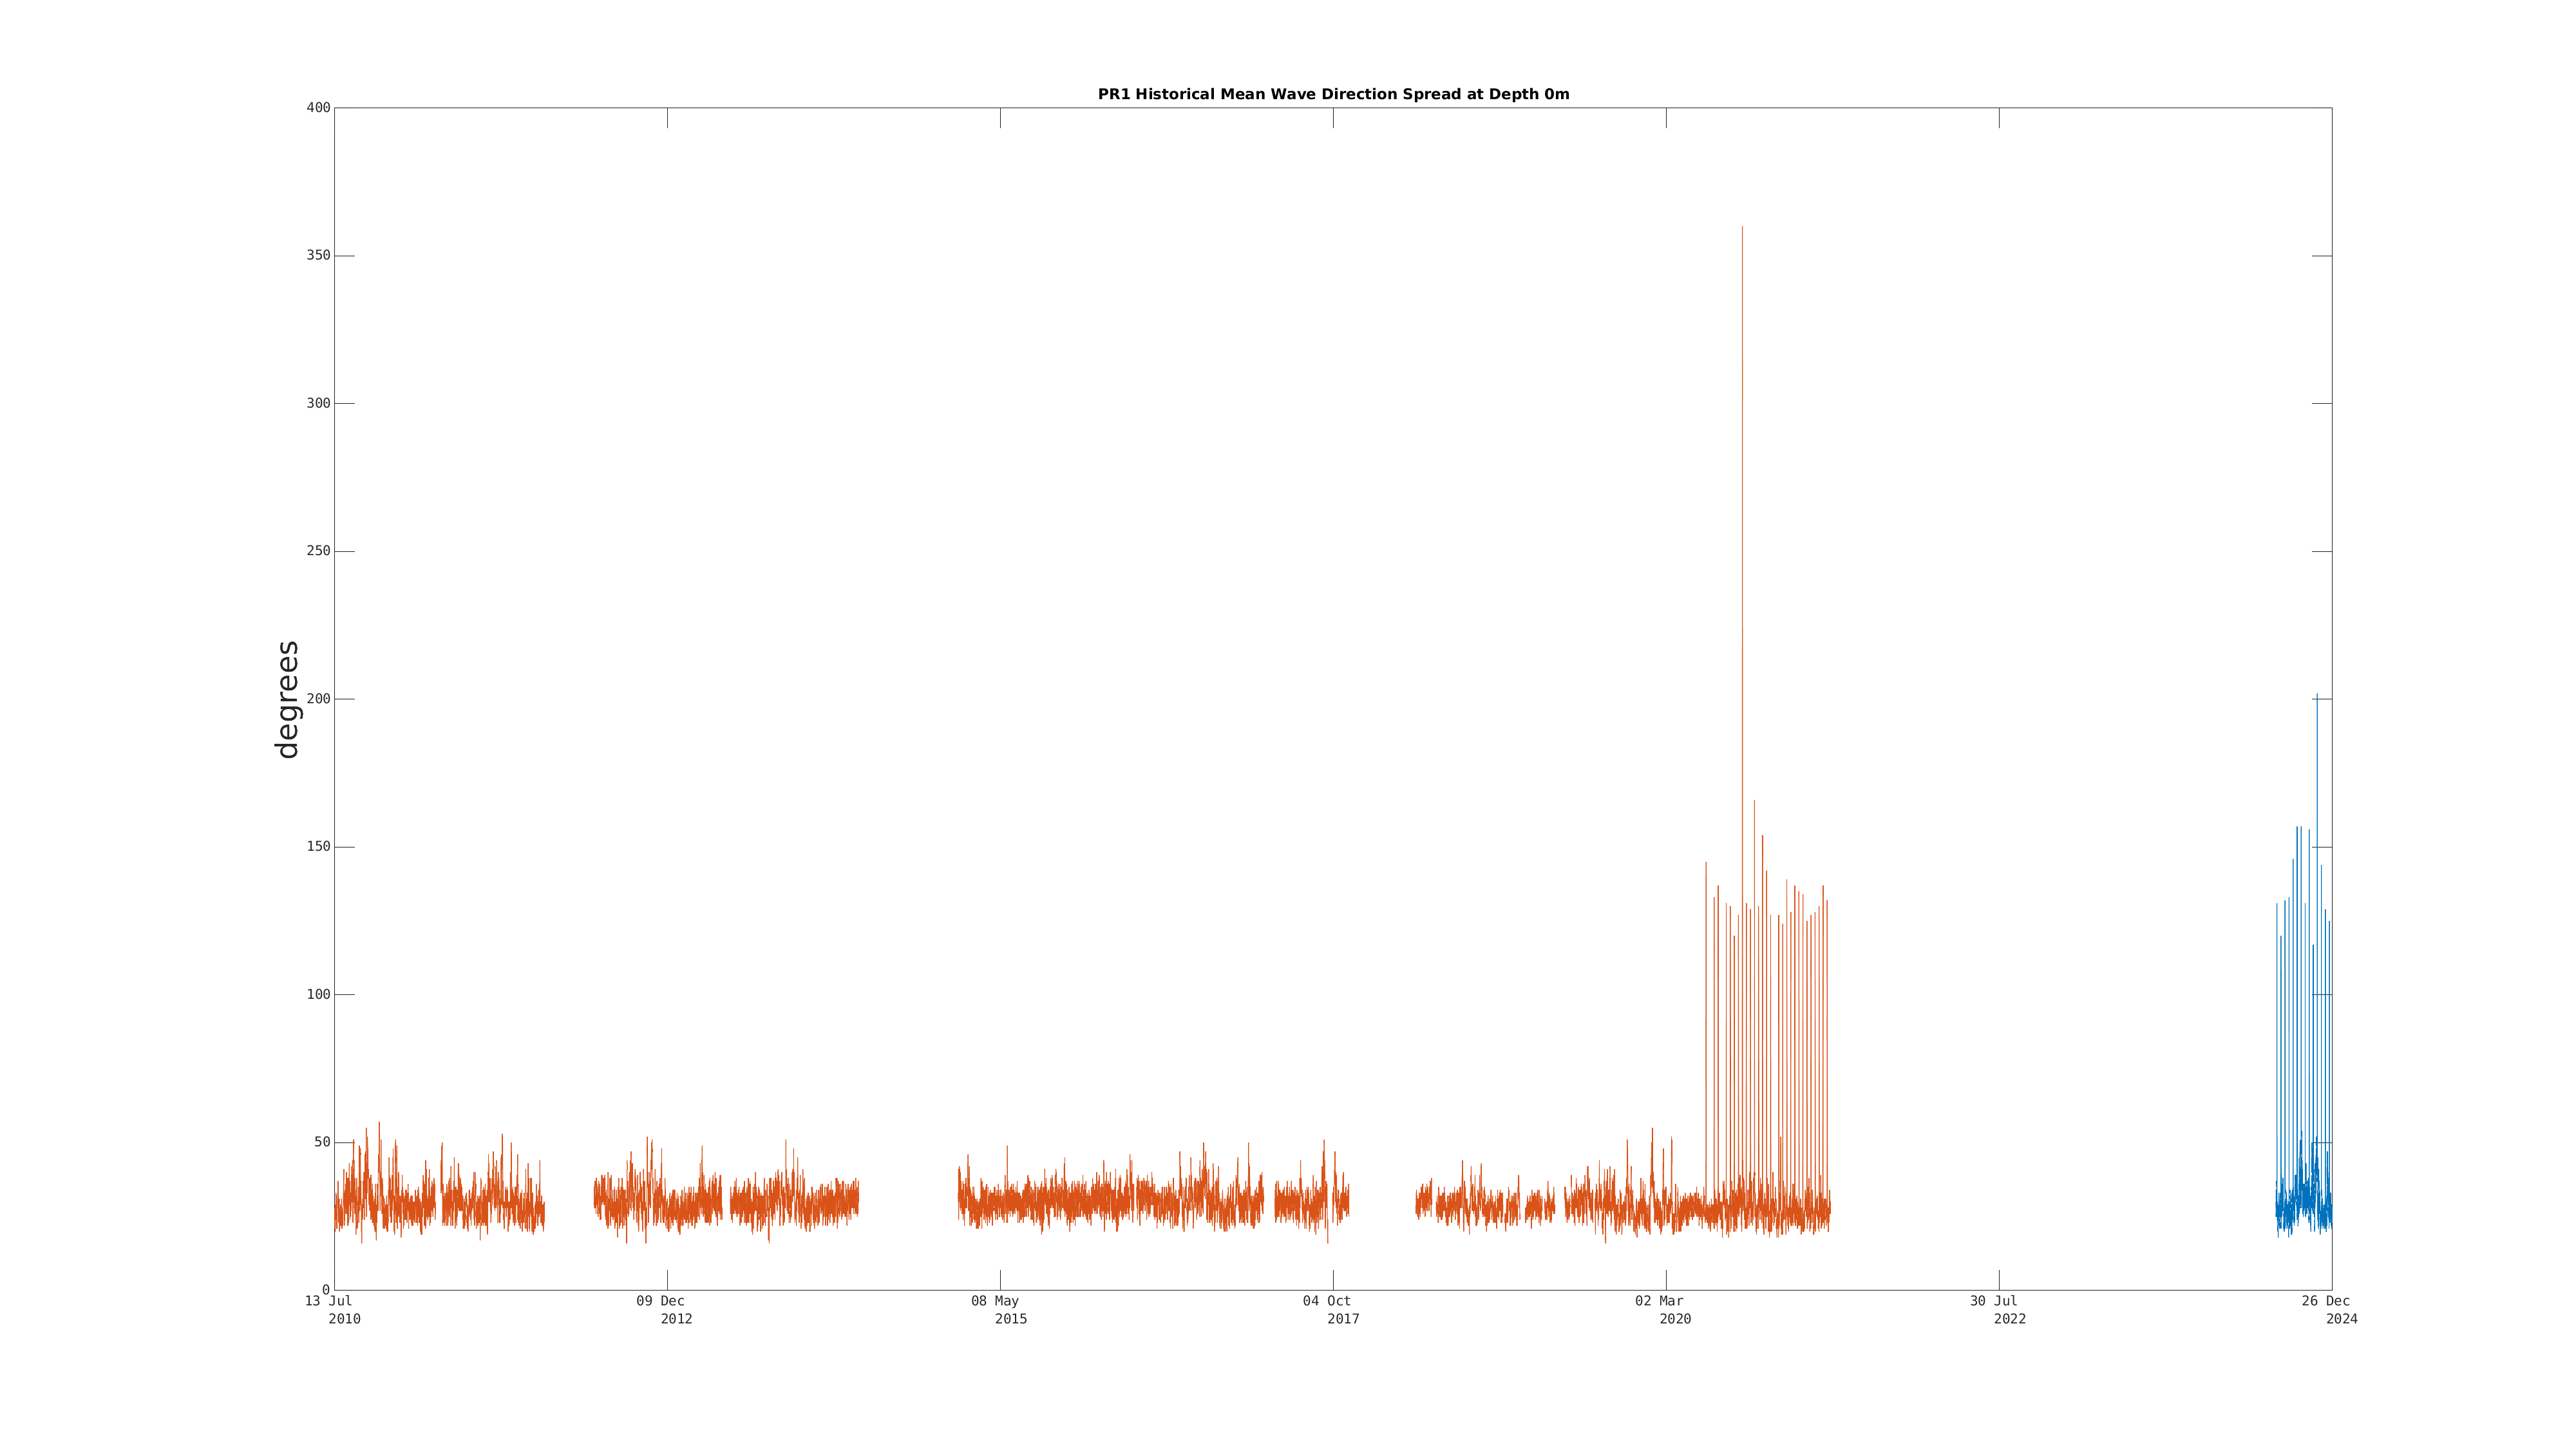
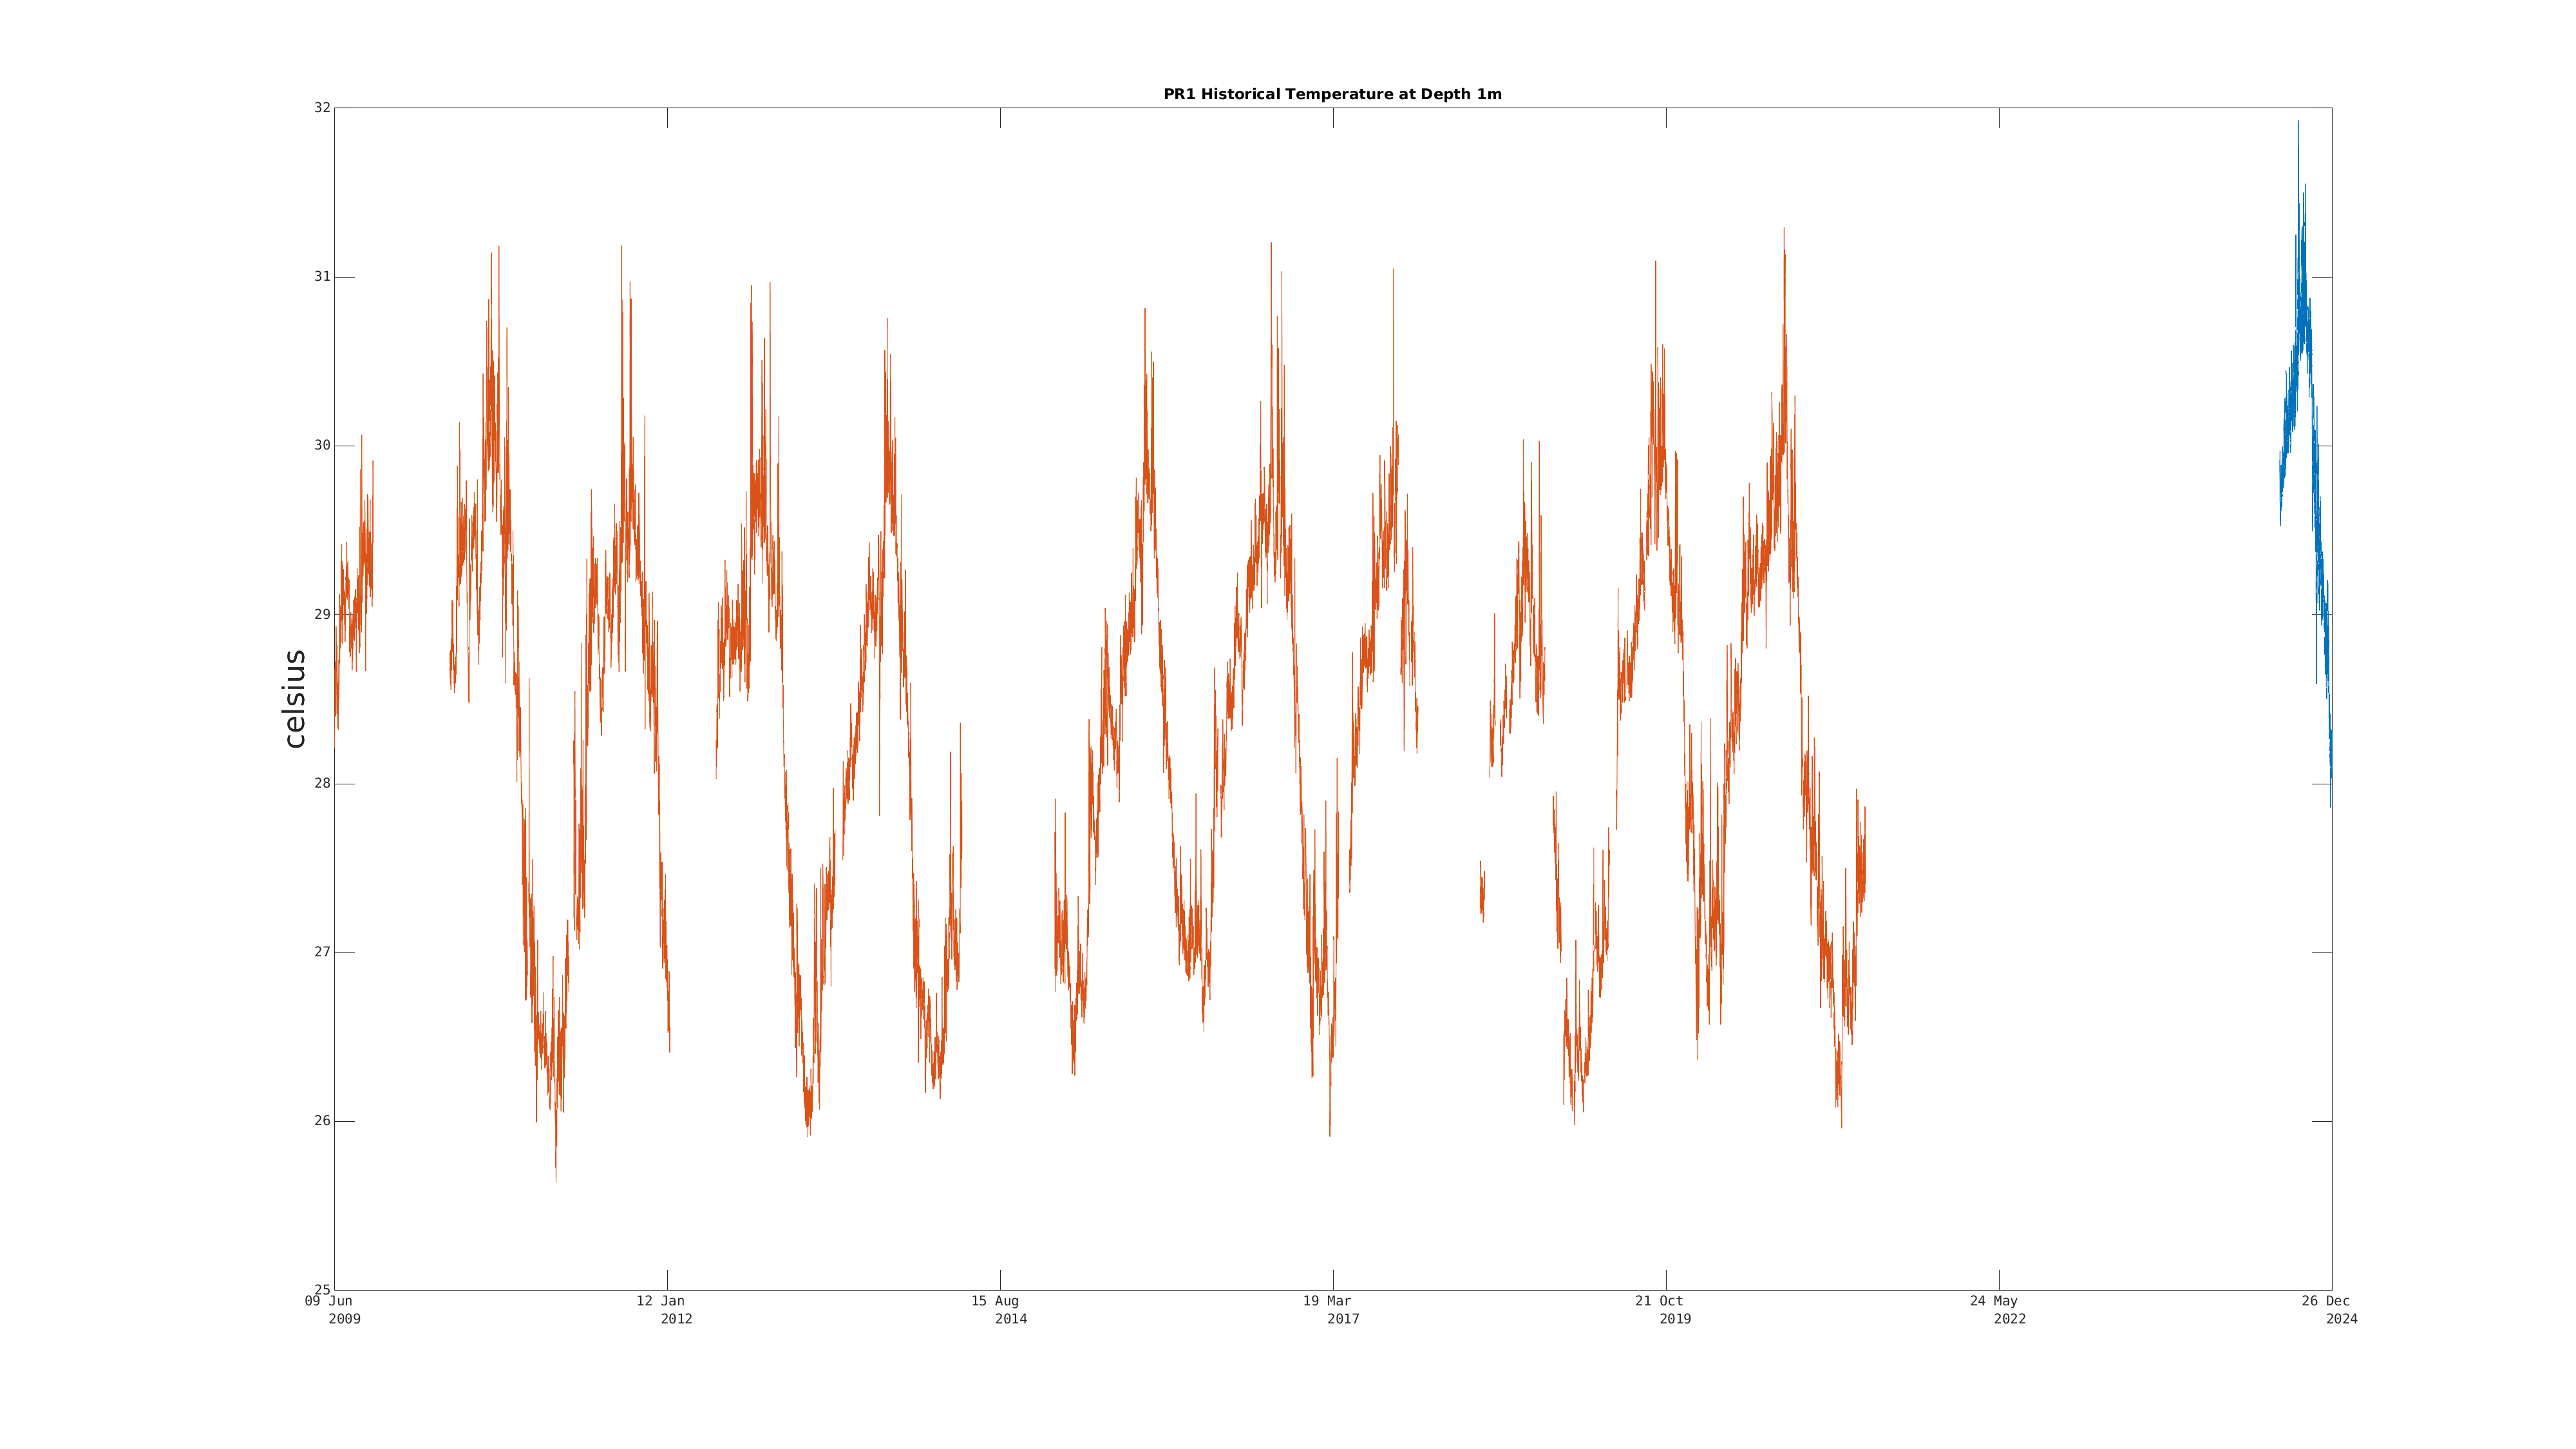
 Entire Position History: