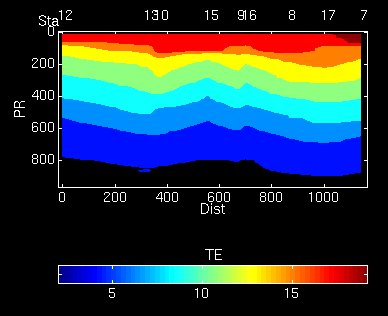

More Figures produced with Staplot

 Are your data geographically coded?
 Do you find yourself frustrated by Matlab's inability
to properly handle irregularly sampled (spaced) data?
 Do you find yourself making thousands of
property-property plots, trying to 'see' into a multi-dimensional space
and keep track of your insights?
 Do you work in polar regions?
If so, STAPLOT may be just that for which you look. ,-)
STAPLOT is freeware. It is a graphical user interface (GUI) built to run under Matlab (to learn more about Matlab, go here ). It is a simple, point-and-click interface (comparable to OceanAtlas, in some ways), designed to make during- and post-cruise data analysis a snap. Some handy features are:
 Just try it. You'll like it.

First, make a directory or folder called STAPLOT .
Next, go into that and make a directory/folder called BATHYMETRY .
Click on the diskette below, or ftp directly using 'mget *'. Make sure you use 'binary' transfer mode!
Check to make sure you got the isobath files (in the BATHYMETRY folder/subdirectory).
Make sure these locations are in your Matlabpath. (Type ' help path' at the matlab prompt for ideas on how to do this.)
cd to STAPLOT at the matlab prompt. Type ' staplot '.
You can use your web browser to follow along a sample session (contained in staplot.htm ), or print out the text of same (in staplot.txt).
Now, :-) Read the ' readme.1st ' file and do what it says to install STAPLOT properly.
 Get Staplot (individual files) (~13 Mb)
or, for those handy with tar and gzip, staplot.tgz (~6.7Mb)
The sea-mat site, where you can pick up, among a number of other useful items, the CSIRO Seawater package, a very handy companion to STAPLOT.
