Graphing applet © 2000 Mariusz Bajger
This utility plots the cruise track for a research voyage and calculates the time it takes to complete the track. You enter the ship's speed, the location of the port of departure and the port of return, and station details (latitude, longitude, time at each station).
This is the instruction page; all information is entered in the plotting page. You get to the plotting page by selecting an ocean area from the map. To switch between the instruction and the plotting page after plotting commenced, use the BACK and FORWARD button of your browser.
Begin with latitude and longitude of the departure port and allocate zero hours to it. Enter station positions (latitude, longitude in decimal degrees) and station duration (decimal hours). Use the latitude and longitude of the destination port as your last entry and allocate zero hours to it.

When your entries are complete, press SUBMIT TO GRAPH. This will change the layout in the text area (by aligning all data on the decimal points) and calculate the time the ship will take to complete the track. Press GRAPH to see the ship's track.
Stations can be added, changed and deleted by editing the data and pressing SUBMIT TO GRAPH again. If a typing mistake results in wrong data (visible in the layout or the map) press RESTORE DATA to return to the status before the data were submitted. Pressing RESET clears the text area. Redrawing a changed cruise track is much faster if the "plot coastline" option is disabled.
The work/cruising ratio compares the time spent on station with the total time spent during the voyage. One aim of good cruise planning is to maximize this ratio.
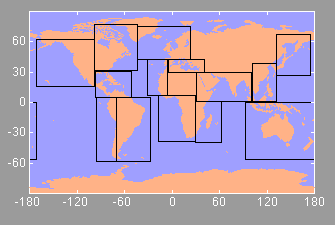
The utility includes a coarse resolution coastline. For reasons of memory management only sections of the world ocean's coastline can be plotted at any one time. Select a region from the map. (Plotting the coastline is memory-intensive. It is recommended to close all other applications before plotting.)
![]() © 2001 M. Tomczak
© 2001 M. Tomczak
Graphing applet © 2000 Mariusz Bajger
Last updated 6 June 2001. Contact address: