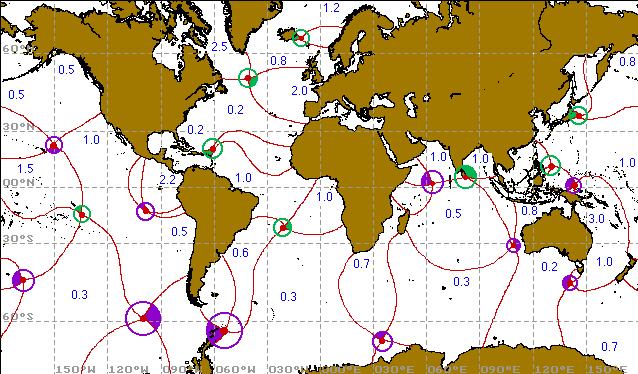

Red lines are co-phase lines indicating the crest of the tidal wave at 0, 3, 6 and 9 lunar hours after the moon's transit through the meridian of Greenwich. (The filled sector of the purple and green circles indicates the sector between 0 and 3 lunar hours; 12 lunar hours correspond to 12 hours 25 minutes.)
Blue numbers indicate the tidal range (m) due to the M2 tide. In the open ocean the tidal range is generally small (0.2 - 0.5 m; it is zero at amphidromic points). The model indicates large tidal ranges closer to the coast; but the coarse model resolution does not reproduce the known extreme tides in the Bay of Fundy or on the French coast. (These regions show up with very large tidal ranges, though.)
contact address: