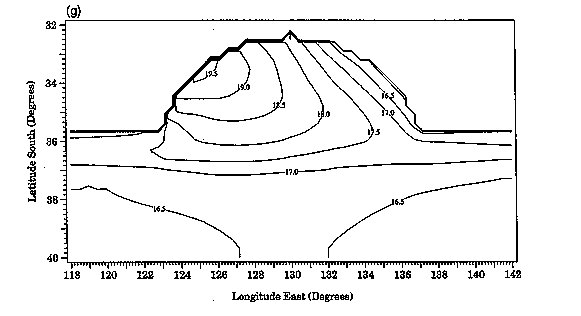
Figure 4: Sea surface temperature for April derived from the numerical model. Compare this with the observations shown in Figure 3e. Note in particular the location of the warmest water, the indication of advection across the shelf and the strip of cold water along the east coast.