
|
Physical Oceanography Group School of Marine Sciences University of Maine |
|
|
|
Physical Oceanography Group School of Marine Sciences University of Maine |
|
|
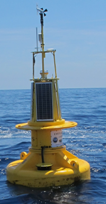
Latitude: 18° 28.57´N Longitude: 65° 9.41´W Location Description: North of St Thomas Deployed: Aug 12 2017 Recovered: Apr 01 2018 Coast Guard Light List Letter: A Coast Guard Light List Number 32628 Water Depth: 40 meters (131 feet) Watch Circle Radius: 60 meters (197 feet) Last Cell Phone Transmission: Sep 06, 01 PM AST Last GOES Transmission: NA Latest Event: Mar 31, 08 PM AST
Recovered by Lighthouse Marine (date approximate) after it was damaged during Hurrican Irma |
 |
|
Text Reports: Surface, Ocean, Currents OR Data Download (All data for this location)
Sensor Information (this deployment only)
Click on the graph icons below to see time series plots of the listed variables. The latest conditions are in local time but all plots are in GMT(Summer EDT is 4 hours behind GMT; Winter EST is 5 hours behind GMT; Atlantic AST is always 4 hours behind GMT).
We follow the convention that depth is measure positive "down". That's why parameters like wind speed have negative depths attached to them! The latest eastward and northward subsurface currents are displayed at a subset of available depths; no plots are presently available for current velocity vectors below 2m. Click here for additional Information.
| Variable (measurement depth in meters) | Last Observation |
Last Update (AST) |
Most Recent Data Plot |
Full Deployment Plot |
Full Historical Plot |
Make My Own |
|---|---|---|---|---|---|---|
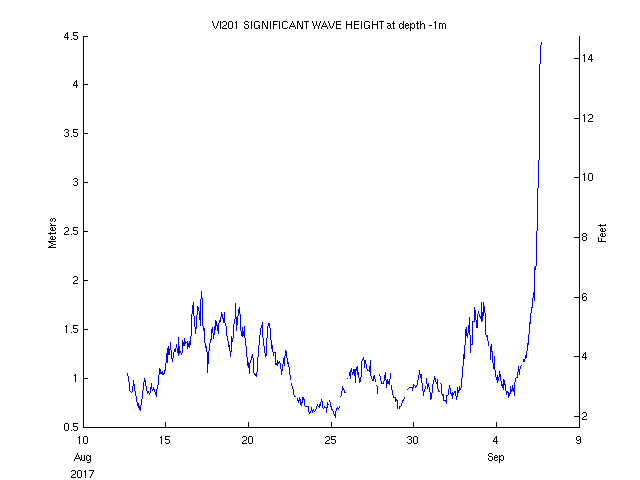
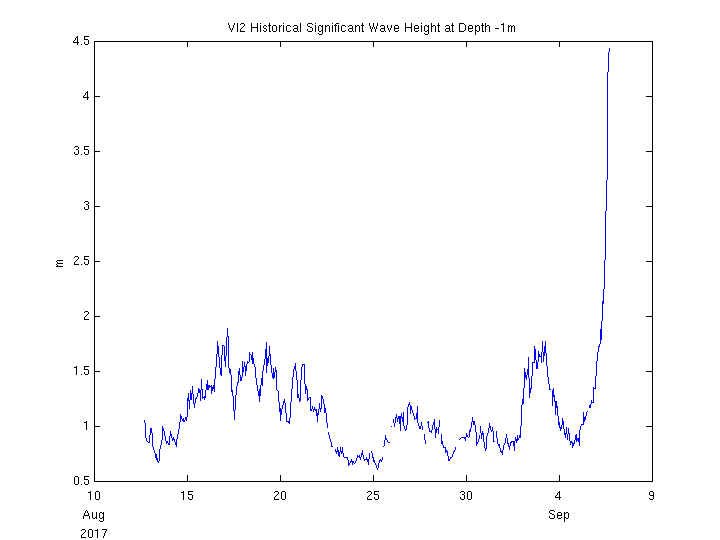
| Significant Wave Height (-1m) | 4.4 meters (14.5 ft) | 2017 Sep 06 5:00 PM |
|
|

|
|
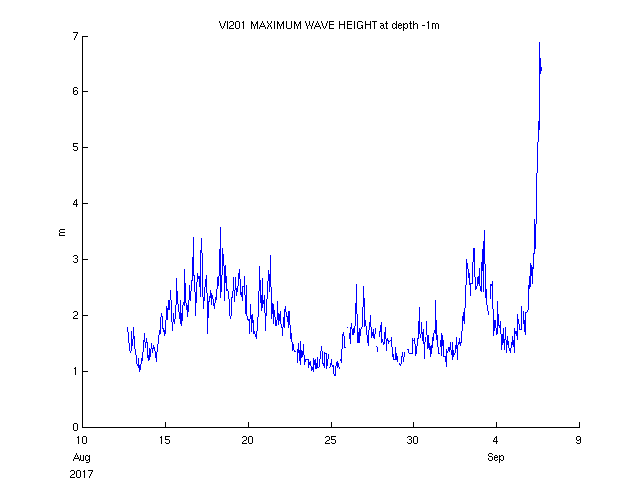
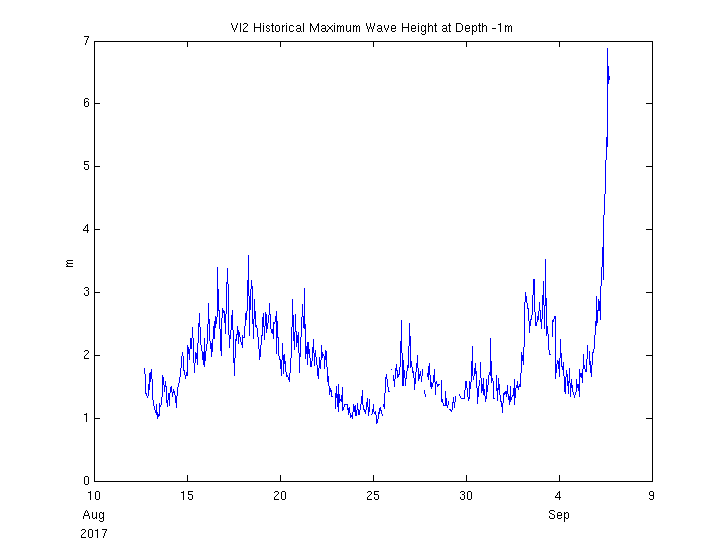
| Maximum Wave Height (-1m) | 6.4 meters (21.1 ft) | 2017 Sep 06 5:00 PM |
|
|
|
|
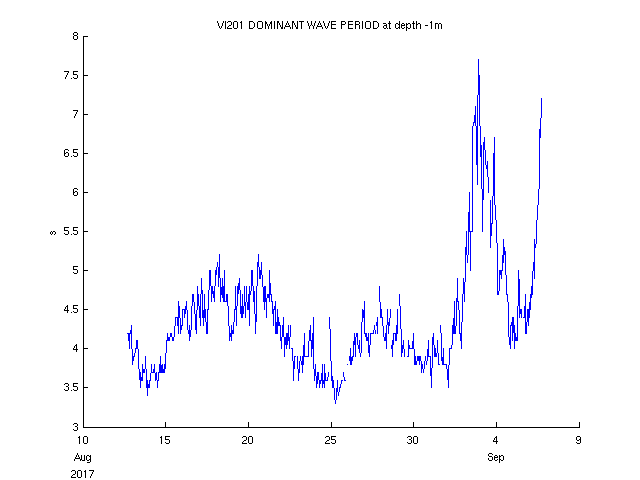
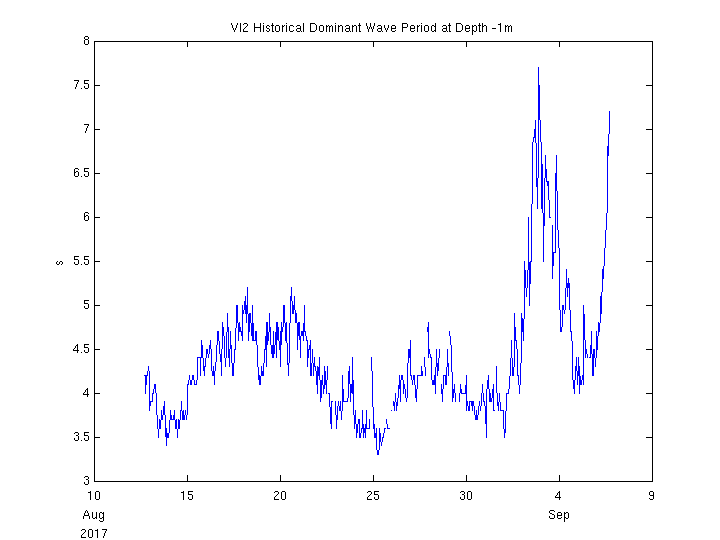
| Dominant Wave Period (-1m) | 7.2 seconds | 2017 Sep 06 5:00 PM |
|
|
|
|
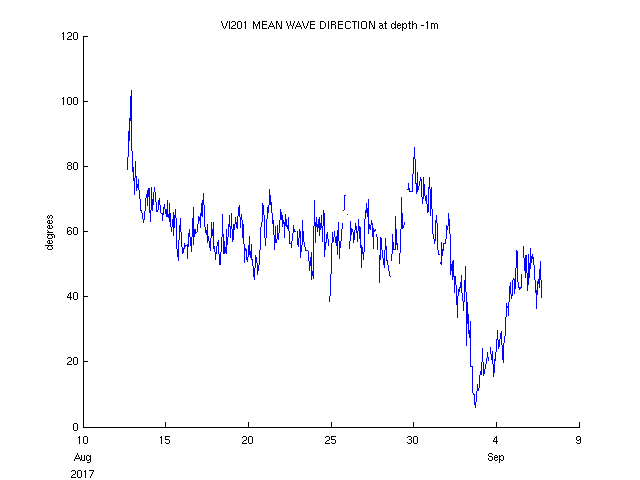
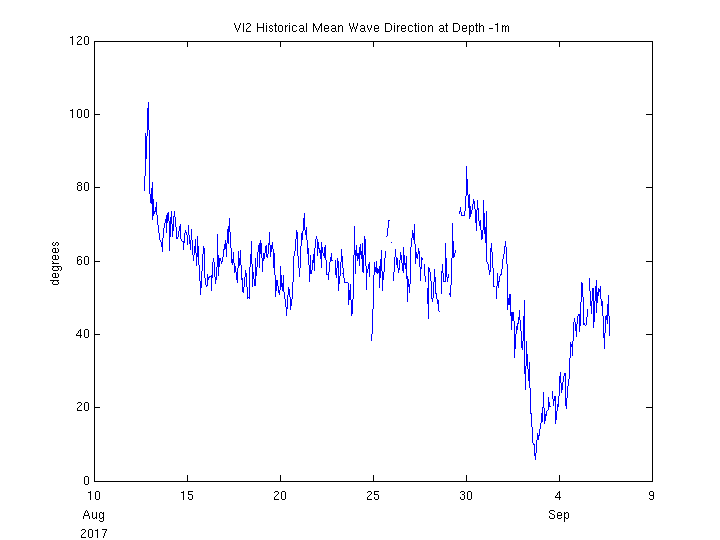
| Mean Wave Direction (-1m) | 39.7 degrees | 2017 Sep 06 5:00 PM |
|
|
|
|
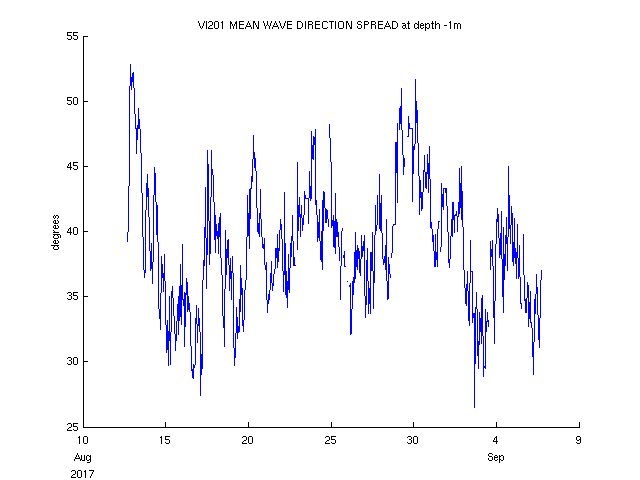
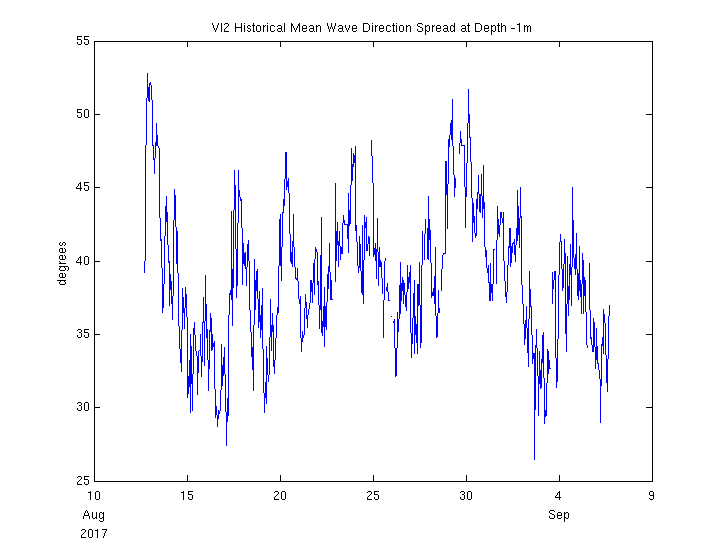
| Mean Wave Direction Spread (-1m) | 37.0 degrees | 2017 Sep 06 5:00 PM |
|
|
|
|
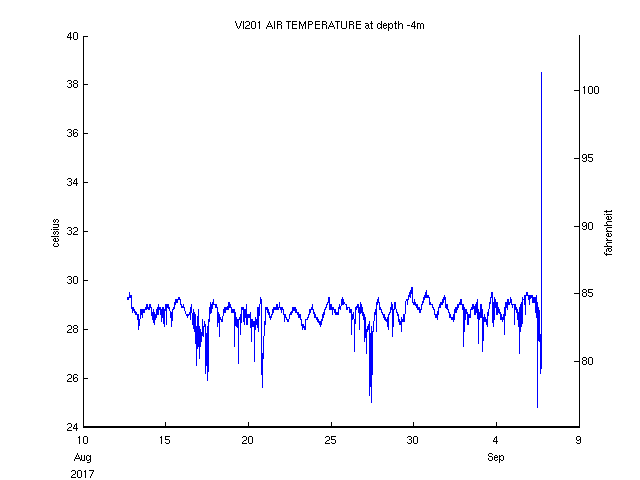
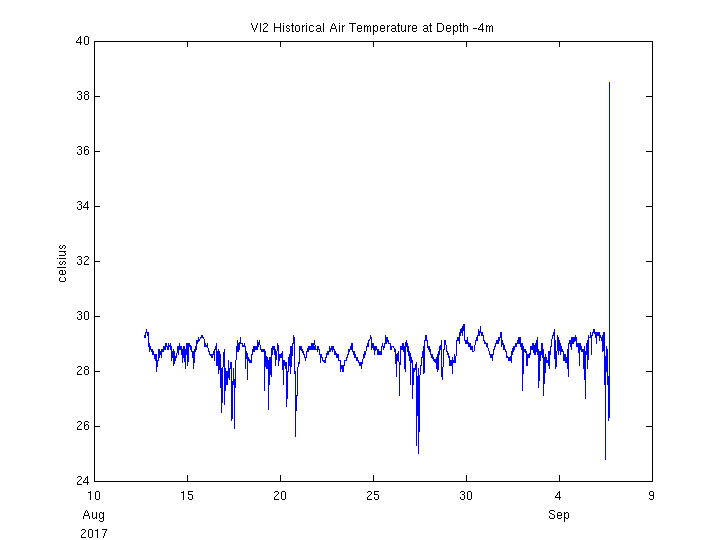
| Air Temperature (-4m) | Sensor Failure | 2017 Sep 06 5:30 PM |
|
|
|
|
| Relative Humidity (-4m) | Sensor Failure | 2017 Sep 06 5:30 PM |
|
|
|
|
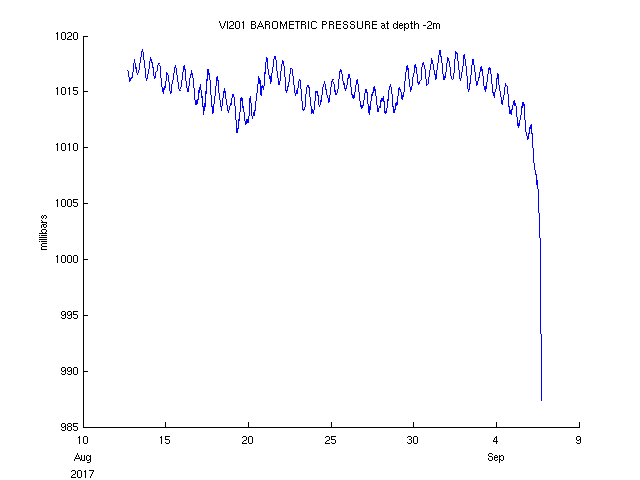
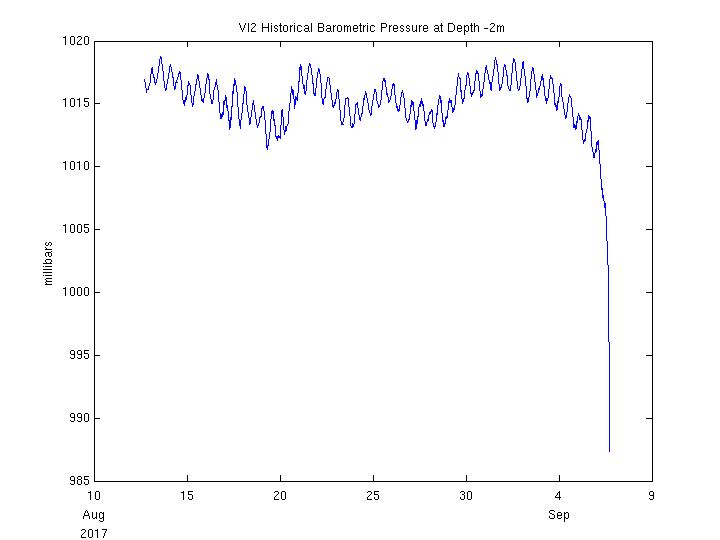
| Barometric Pressure (-2m) | 987.3 millibars | 2017 Sep 06 5:30 PM |
|
|
|
|
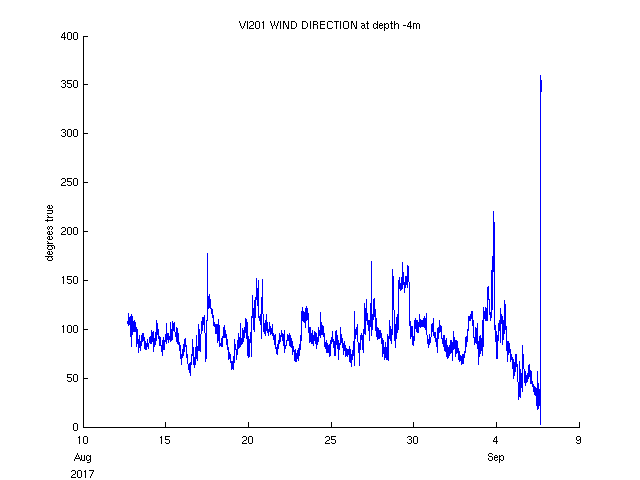
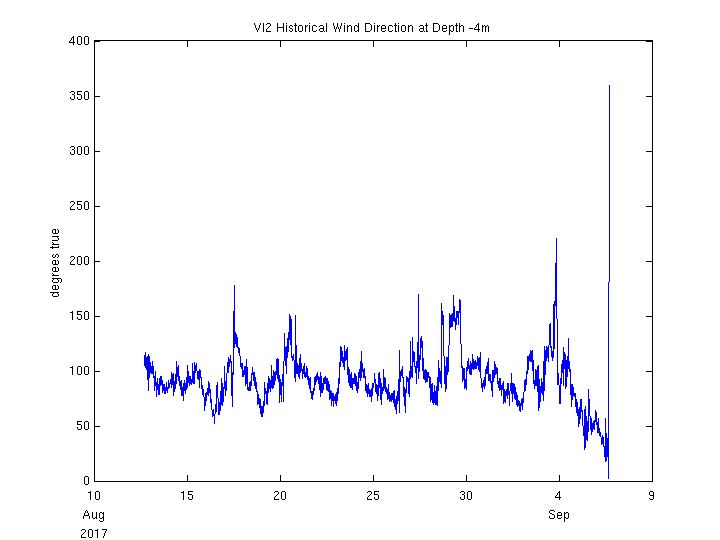
| Wind Direction [Primary] (-4m) | NNW | 2017 Sep 06 5:30 PM |
|
|
|
|
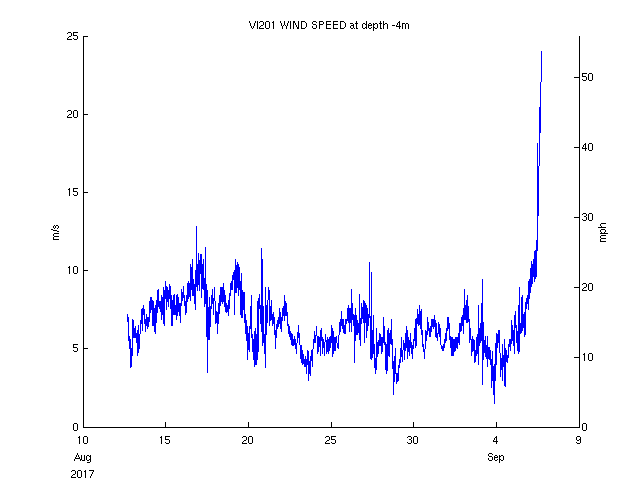
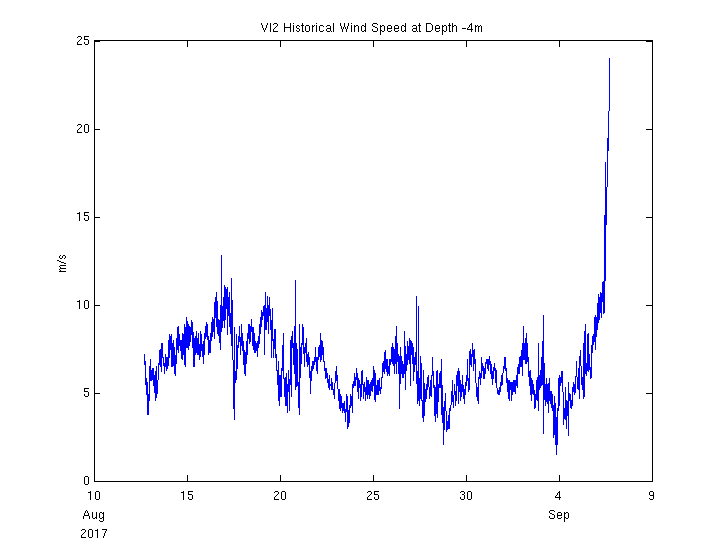
| Wind Speed [Primary] (-4m) | 24.0 m/s (54 mph, 47 kts) | 2017 Sep 06 5:30 PM |
|
|
|
|
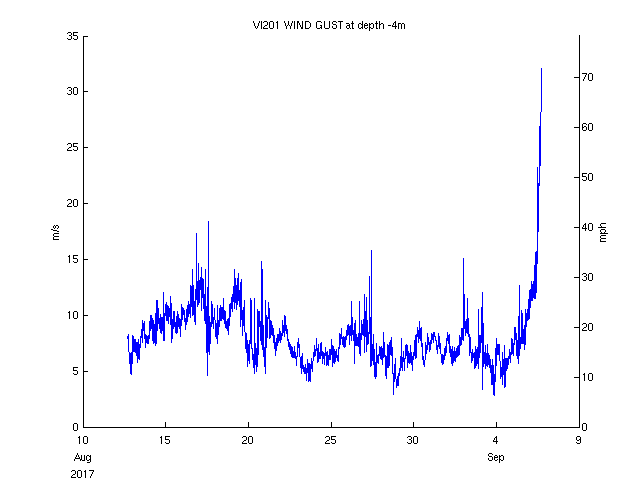
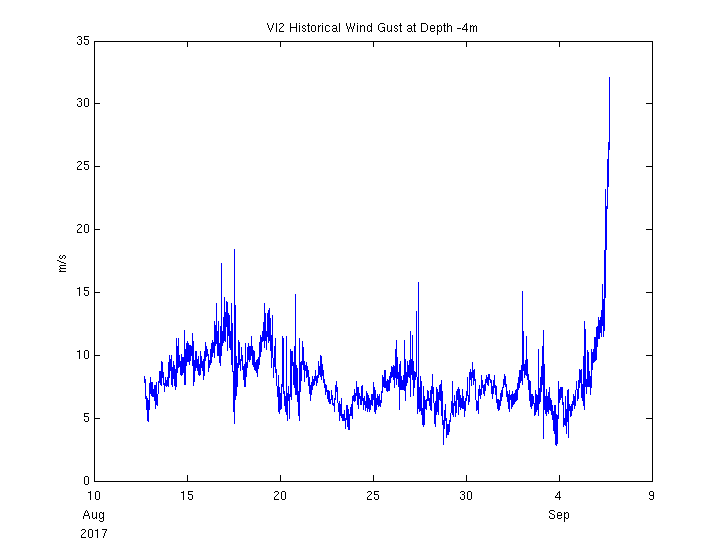
| Wind Gust [Primary] (-4m) | 32.1 m/s (72 mph, 62 kts) | 2017 Sep 06 5:30 PM |
|
|
|
|
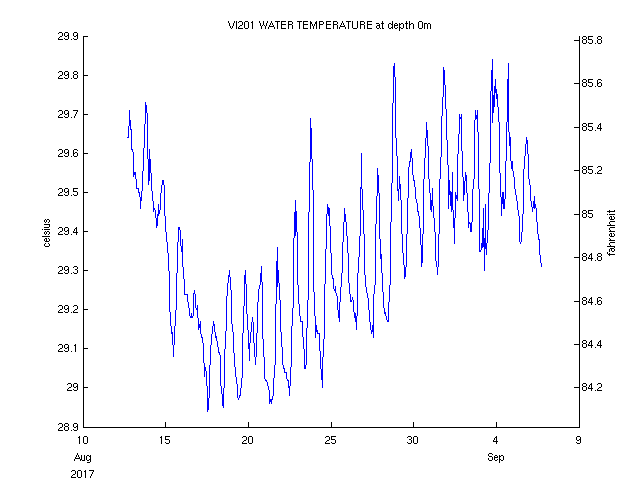
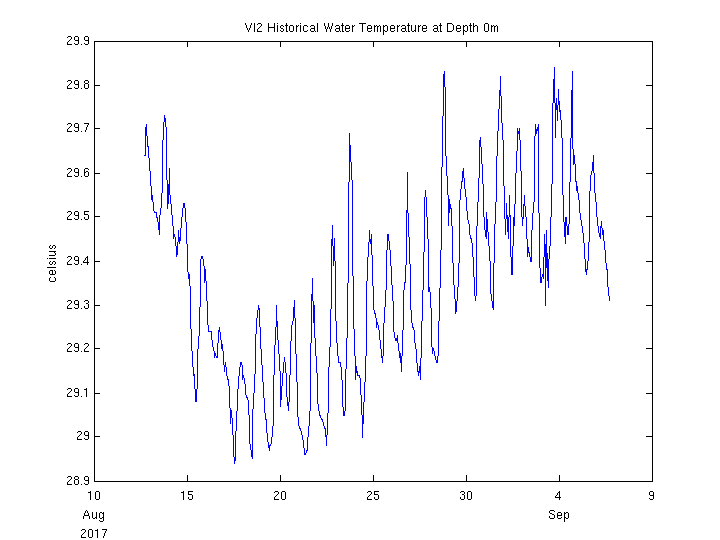
| Water Temperature (1m) | 29.3 C (84.8 F) | 2017 Sep 06 5:00 PM |
|
|
|
|
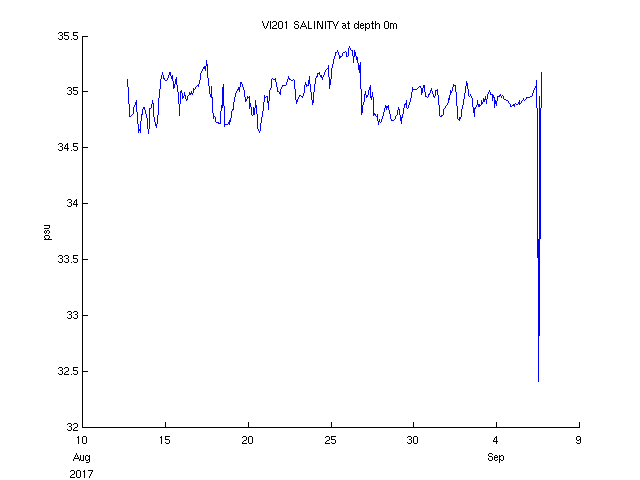
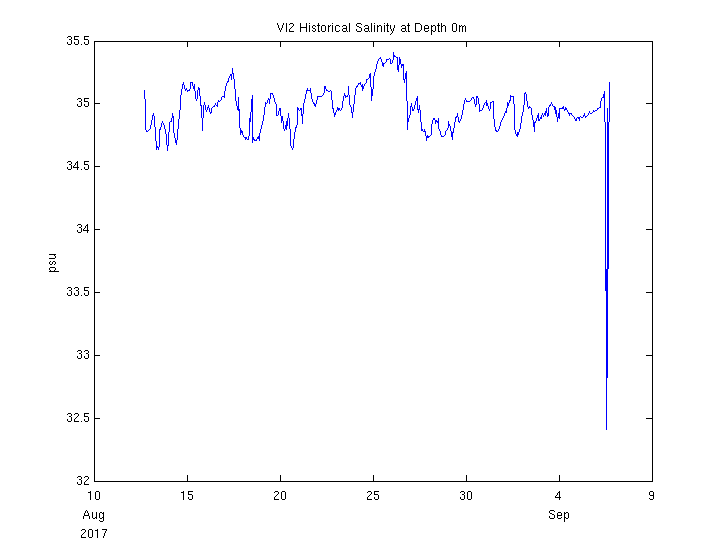
| Salinity (1m) | 35.2 psu | 2017 Sep 06 5:00 PM |
|
|
|
|
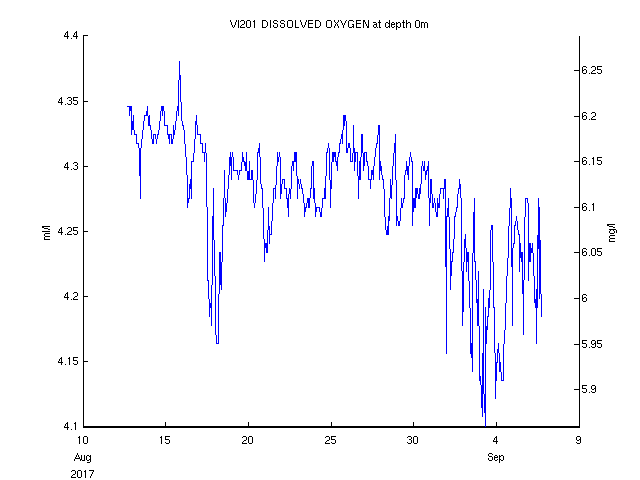
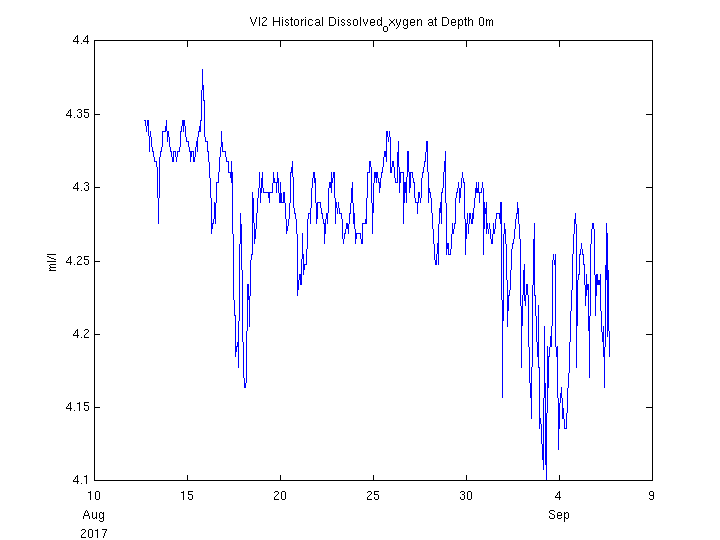
| Dissolved Oxygen (1m) | 4.2 ml/l (6.0 mg/l) | 2017 Sep 06 5:00 PM |
|
|
|
|
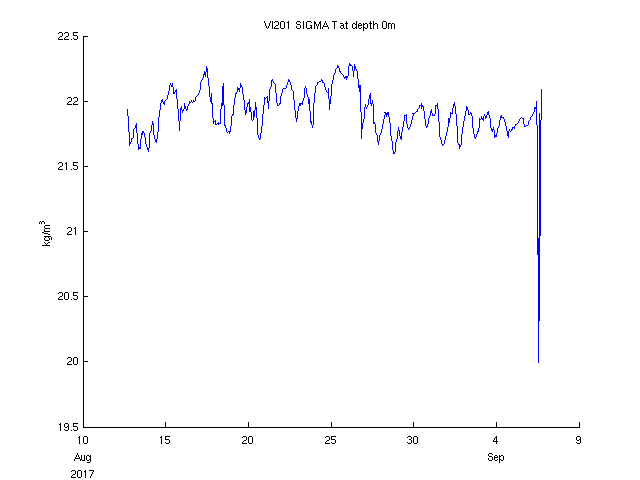
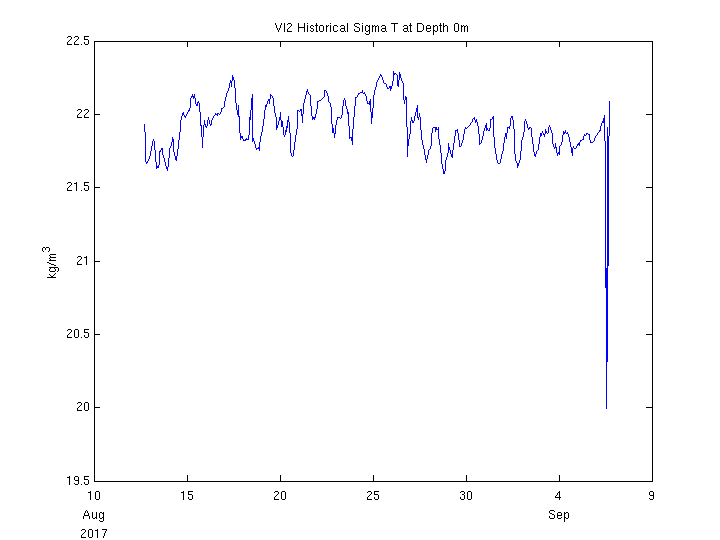
| Sigma-T (1m) | 22.1 kg/m^3 | 2017 Sep 06 5:00 PM |
|
|
|
|
| Current Direction (2m) | SW | 2017 Sep 06 5:00 PM |
|
|||
| Current Direction (2.5m) | SW | 2017 Sep 06 5:00 PM |
|
|||
| Current Direction (4m) | SW | 2017 Sep 06 5:00 PM |
|
|||
| Current Direction (5m) | SW | 2017 Sep 06 5:00 PM |
|
|||
| Current Direction (6m) | SW | 2017 Sep 06 5:00 PM |
|
|||
| Current Direction (7m) | SW | 2017 Sep 06 5:00 PM |
|
|||
| Current Direction (8m) | SW | 2017 Sep 06 5:00 PM |
|
|||
| Current Direction (9m) | SW | 2017 Sep 06 5:00 PM |
|
|||
| Current Direction (10m) | SW | 2017 Sep 06 5:00 PM |
|
|||
| Current Direction (11m) | SW | 2017 Sep 06 5:00 PM |
|
|||
| Current Direction (12m) | SW | 2017 Sep 06 5:00 PM |
|
|||
| Current Direction (13m) | SW | 2017 Sep 06 5:00 PM |
|
|||
| Current Direction (14m) | SW | 2017 Sep 06 5:00 PM |
|
|||
| Current Direction (15m) | SW | 2017 Sep 06 5:00 PM |
|
|||
| Current Direction (16m) | SW | 2017 Sep 06 5:00 PM |
|
|||
| Current Direction (19m) | SW | 2017 Sep 06 5:00 PM |
|
|||
| Current Direction (20m) | WSW | 2017 Sep 06 5:00 PM |
|
|||
| Current Direction (21m) | SW | 2017 Sep 06 5:00 PM |
|
|||
| Current Direction (22m) | SW | 2017 Sep 06 5:00 PM |
|
|||
| Current Speed (2m) | 51.2 cm/s (1.00 kts) | 2017 Sep 06 5:00 PM |
|
|||
| Current Speed (2.5m) | 49.2 cm/s (0.96 kts) | 2017 Sep 06 5:00 PM |
|
|||
| Current Speed (4m) | 39.7 cm/s (0.77 kts) | 2017 Sep 06 5:00 PM |
|
|||
| Current Speed (5m) | 40.9 cm/s (0.80 kts) | 2017 Sep 06 5:00 PM |
|
|||
| Current Speed (6m) | 41.5 cm/s (0.81 kts) | 2017 Sep 06 5:00 PM |
|
|||
| Current Speed (7m) | 41.5 cm/s (0.81 kts) | 2017 Sep 06 5:00 PM |
|
|||
| Current Speed (8m) | 40.0 cm/s (0.78 kts) | 2017 Sep 06 5:00 PM |
|
|||
| Current Speed (9m) | 42.4 cm/s (0.82 kts) | 2017 Sep 06 5:00 PM |
|
|||
| Current Speed (10m) | 43.2 cm/s (0.84 kts) | 2017 Sep 06 5:00 PM |
|
|||
| Current Speed (11m) | 45.5 cm/s (0.88 kts) | 2017 Sep 06 5:00 PM |
|
|||
| Current Speed (12m) | 44.3 cm/s (0.86 kts) | 2017 Sep 06 5:00 PM |
|
|||
| Current Speed (13m) | 41.6 cm/s (0.81 kts) | 2017 Sep 06 5:00 PM |
|
|||
| Current Speed (14m) | 37.2 cm/s (0.72 kts) | 2017 Sep 06 5:00 PM |
|
|||
| Current Speed (15m) | 37.1 cm/s (0.72 kts) | 2017 Sep 06 5:00 PM |
|
|||
| Current Speed (16m) | 38.4 cm/s (0.75 kts) | 2017 Sep 06 5:00 PM |
|
|||
| Current Speed (19m) | 42.8 cm/s (0.83 kts) | 2017 Sep 06 5:00 PM |
|
|||
| Current Speed (20m) | 38.3 cm/s (0.74 kts) | 2017 Sep 06 5:00 PM |
|
|||
| Current Speed (21m) | 38.5 cm/s (0.75 kts) | 2017 Sep 06 5:00 PM |
|
|||
| Current Speed (22m) | 38.2 cm/s (0.74 kts) | 2017 Sep 06 5:00 PM |
|
|||
| East Current Velocity (2m) | -31.1 cm/s (-0.61 kts) | 2017 Sep 06 5:00 PM |
|
|||
| East Current Velocity (2.5m) | -31.3 cm/s (-0.61 kts) | 2017 Sep 06 5:00 PM |
|
|||
| East Current Velocity (4m) | -27.8 cm/s (-0.54 kts) | 2017 Sep 06 5:00 PM |
|
|||
| East Current Velocity (5m) | -26.5 cm/s (-0.52 kts) | 2017 Sep 06 5:00 PM |
|
|||
| East Current Velocity (6m) | -28.0 cm/s (-0.54 kts) | 2017 Sep 06 5:00 PM |
|
|||
| East Current Velocity (7m) | -29.1 cm/s (-0.56 kts) | 2017 Sep 06 5:00 PM |
|
|||
| East Current Velocity (8m) | -29.5 cm/s (-0.57 kts) | 2017 Sep 06 5:00 PM |
|
|||
| East Current Velocity (9m) | -31.7 cm/s (-0.62 kts) | 2017 Sep 06 5:00 PM |
|
|||
| East Current Velocity (10m) | -31.3 cm/s (-0.61 kts) | 2017 Sep 06 5:00 PM |
|
|||
| East Current Velocity (11m) | -30.7 cm/s (-0.60 kts) | 2017 Sep 06 5:00 PM |
|
|||
| East Current Velocity (12m) | -32.6 cm/s (-0.63 kts) | 2017 Sep 06 5:00 PM |
|
|||
| East Current Velocity (13m) | -32.1 cm/s (-0.62 kts) | 2017 Sep 06 5:00 PM |
|
|||
| East Current Velocity (14m) | -28.7 cm/s (-0.56 kts) | 2017 Sep 06 5:00 PM |
|
|||
| East Current Velocity (15m) | -26.0 cm/s (-0.51 kts) | 2017 Sep 06 5:00 PM |
|
|||
| East Current Velocity (16m) | -27.4 cm/s (-0.53 kts) | 2017 Sep 06 5:00 PM |
|
|||
| East Current Velocity (19m) | -33.0 cm/s (-0.64 kts) | 2017 Sep 06 5:00 PM |
|
|||
| East Current Velocity (20m) | -31.9 cm/s (-0.62 kts) | 2017 Sep 06 5:00 PM |
|
|||
| East Current Velocity (21m) | -28.4 cm/s (-0.55 kts) | 2017 Sep 06 5:00 PM |
|
|||
| East Current Velocity (22m) | -27.7 cm/s (-0.54 kts) | 2017 Sep 06 5:00 PM |
|
|||
| North Current Velocity (2m) | -40.6 cm/s (-0.79 kts) | 2017 Sep 06 5:00 PM |
|
|||
| North Current Velocity (2.5m) | -38.0 cm/s (-0.74 kts) | 2017 Sep 06 5:00 PM |
|
|||
| North Current Velocity (4m) | -28.3 cm/s (-0.55 kts) | 2017 Sep 06 5:00 PM |
|
|||
| North Current Velocity (5m) | -31.1 cm/s (-0.60 kts) | 2017 Sep 06 5:00 PM |
|
|||
| North Current Velocity (6m) | -30.6 cm/s (-0.60 kts) | 2017 Sep 06 5:00 PM |
|
|||
| North Current Velocity (7m) | -29.6 cm/s (-0.58 kts) | 2017 Sep 06 5:00 PM |
|
|||
| North Current Velocity (8m) | -27.0 cm/s (-0.53 kts) | 2017 Sep 06 5:00 PM |
|
|||
| North Current Velocity (9m) | -28.1 cm/s (-0.55 kts) | 2017 Sep 06 5:00 PM |
|
|||
| North Current Velocity (10m) | -29.8 cm/s (-0.58 kts) | 2017 Sep 06 5:00 PM |
|
|||
| North Current Velocity (11m) | -33.6 cm/s (-0.65 kts) | 2017 Sep 06 5:00 PM |
|
|||
| North Current Velocity (12m) | -30.0 cm/s (-0.58 kts) | 2017 Sep 06 5:00 PM |
|
|||
| North Current Velocity (13m) | -26.5 cm/s (-0.51 kts) | 2017 Sep 06 5:00 PM |
|
|||
| North Current Velocity (14m) | -23.7 cm/s (-0.46 kts) | 2017 Sep 06 5:00 PM |
|
|||
| North Current Velocity (15m) | -26.5 cm/s (-0.51 kts) | 2017 Sep 06 5:00 PM |
|
|||
| North Current Velocity (16m) | -26.9 cm/s (-0.52 kts) | 2017 Sep 06 5:00 PM |
|
|||
| North Current Velocity (19m) | -27.3 cm/s (-0.53 kts) | 2017 Sep 06 5:00 PM |
|
|||
| North Current Velocity (20m) | -21.2 cm/s (-0.41 kts) | 2017 Sep 06 5:00 PM |
|
|||
| North Current Velocity (21m) | -26.0 cm/s (-0.51 kts) | 2017 Sep 06 5:00 PM |
|
|||
| North Current Velocity (22m) | -26.3 cm/s (-0.51 kts) | 2017 Sep 06 5:00 PM |
|
|||
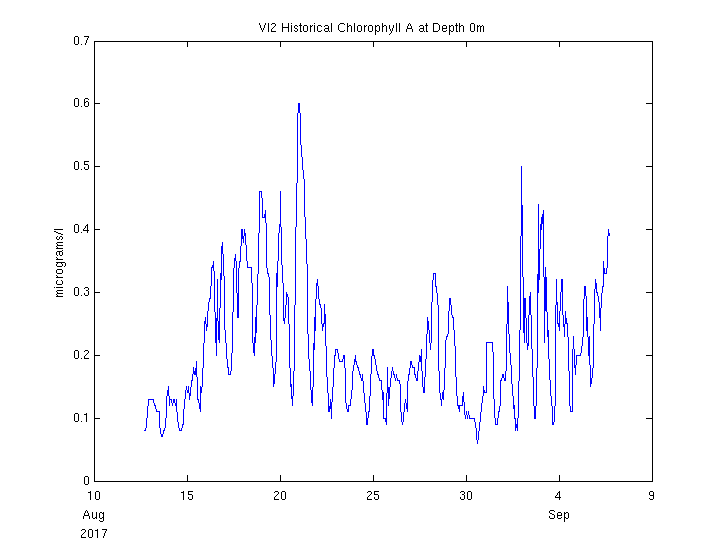
| Average Chlorophyll Concentration (1m) | 0.4 micrograms/l | 2017 Sep 06 5:00 PM |
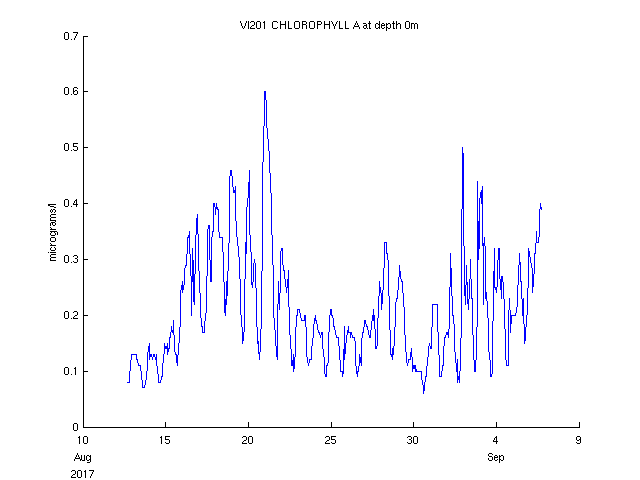
|
|
|
|
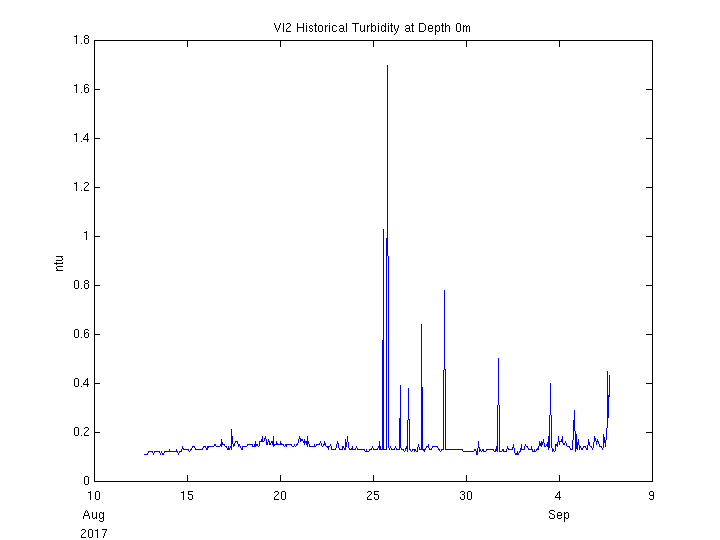
| Sea water Turbidity (1m) | 0.4 ntu | 2017 Sep 06 5:00 PM |
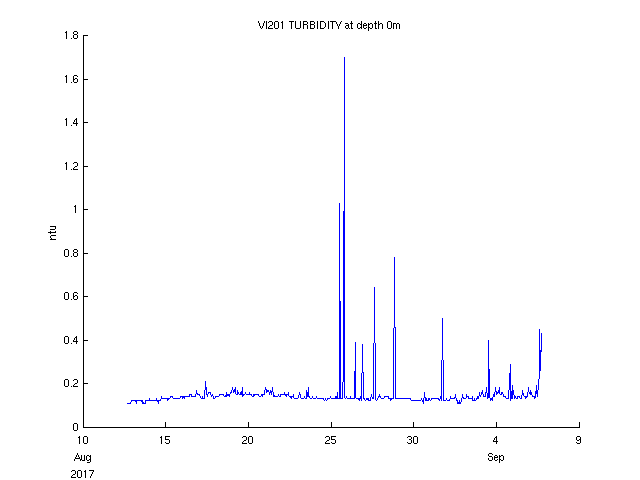
|
|
|
 Latest Month's:
|
 This Deployment:
|
 Entire Position History:
|
 Latest Month's:
|
 This Deployment:
|
 Entire Position History:
|
| CarICOOS Home | NOAA IOOS |