Latitude: 18° 14.95´N
Longitude: 64° 45.79´W
Location Description: South of St John
Deployed: Sep 09 2024
Coast Guard Light List Letter: C
Coast Guard Light List Number 32566
Water Depth: 44 meters (144 feet)
Watch Circle Radius: 60 meters (197 feet)
Last Cell Phone Transmission: May 22, 07 AM AST
Last GOES Transmission: May 22, 07 AM AST
Latest Event:
Sep 02, 08 AM AST
deployed by Lighthouse Marine
deployed by Lighthouse Marine

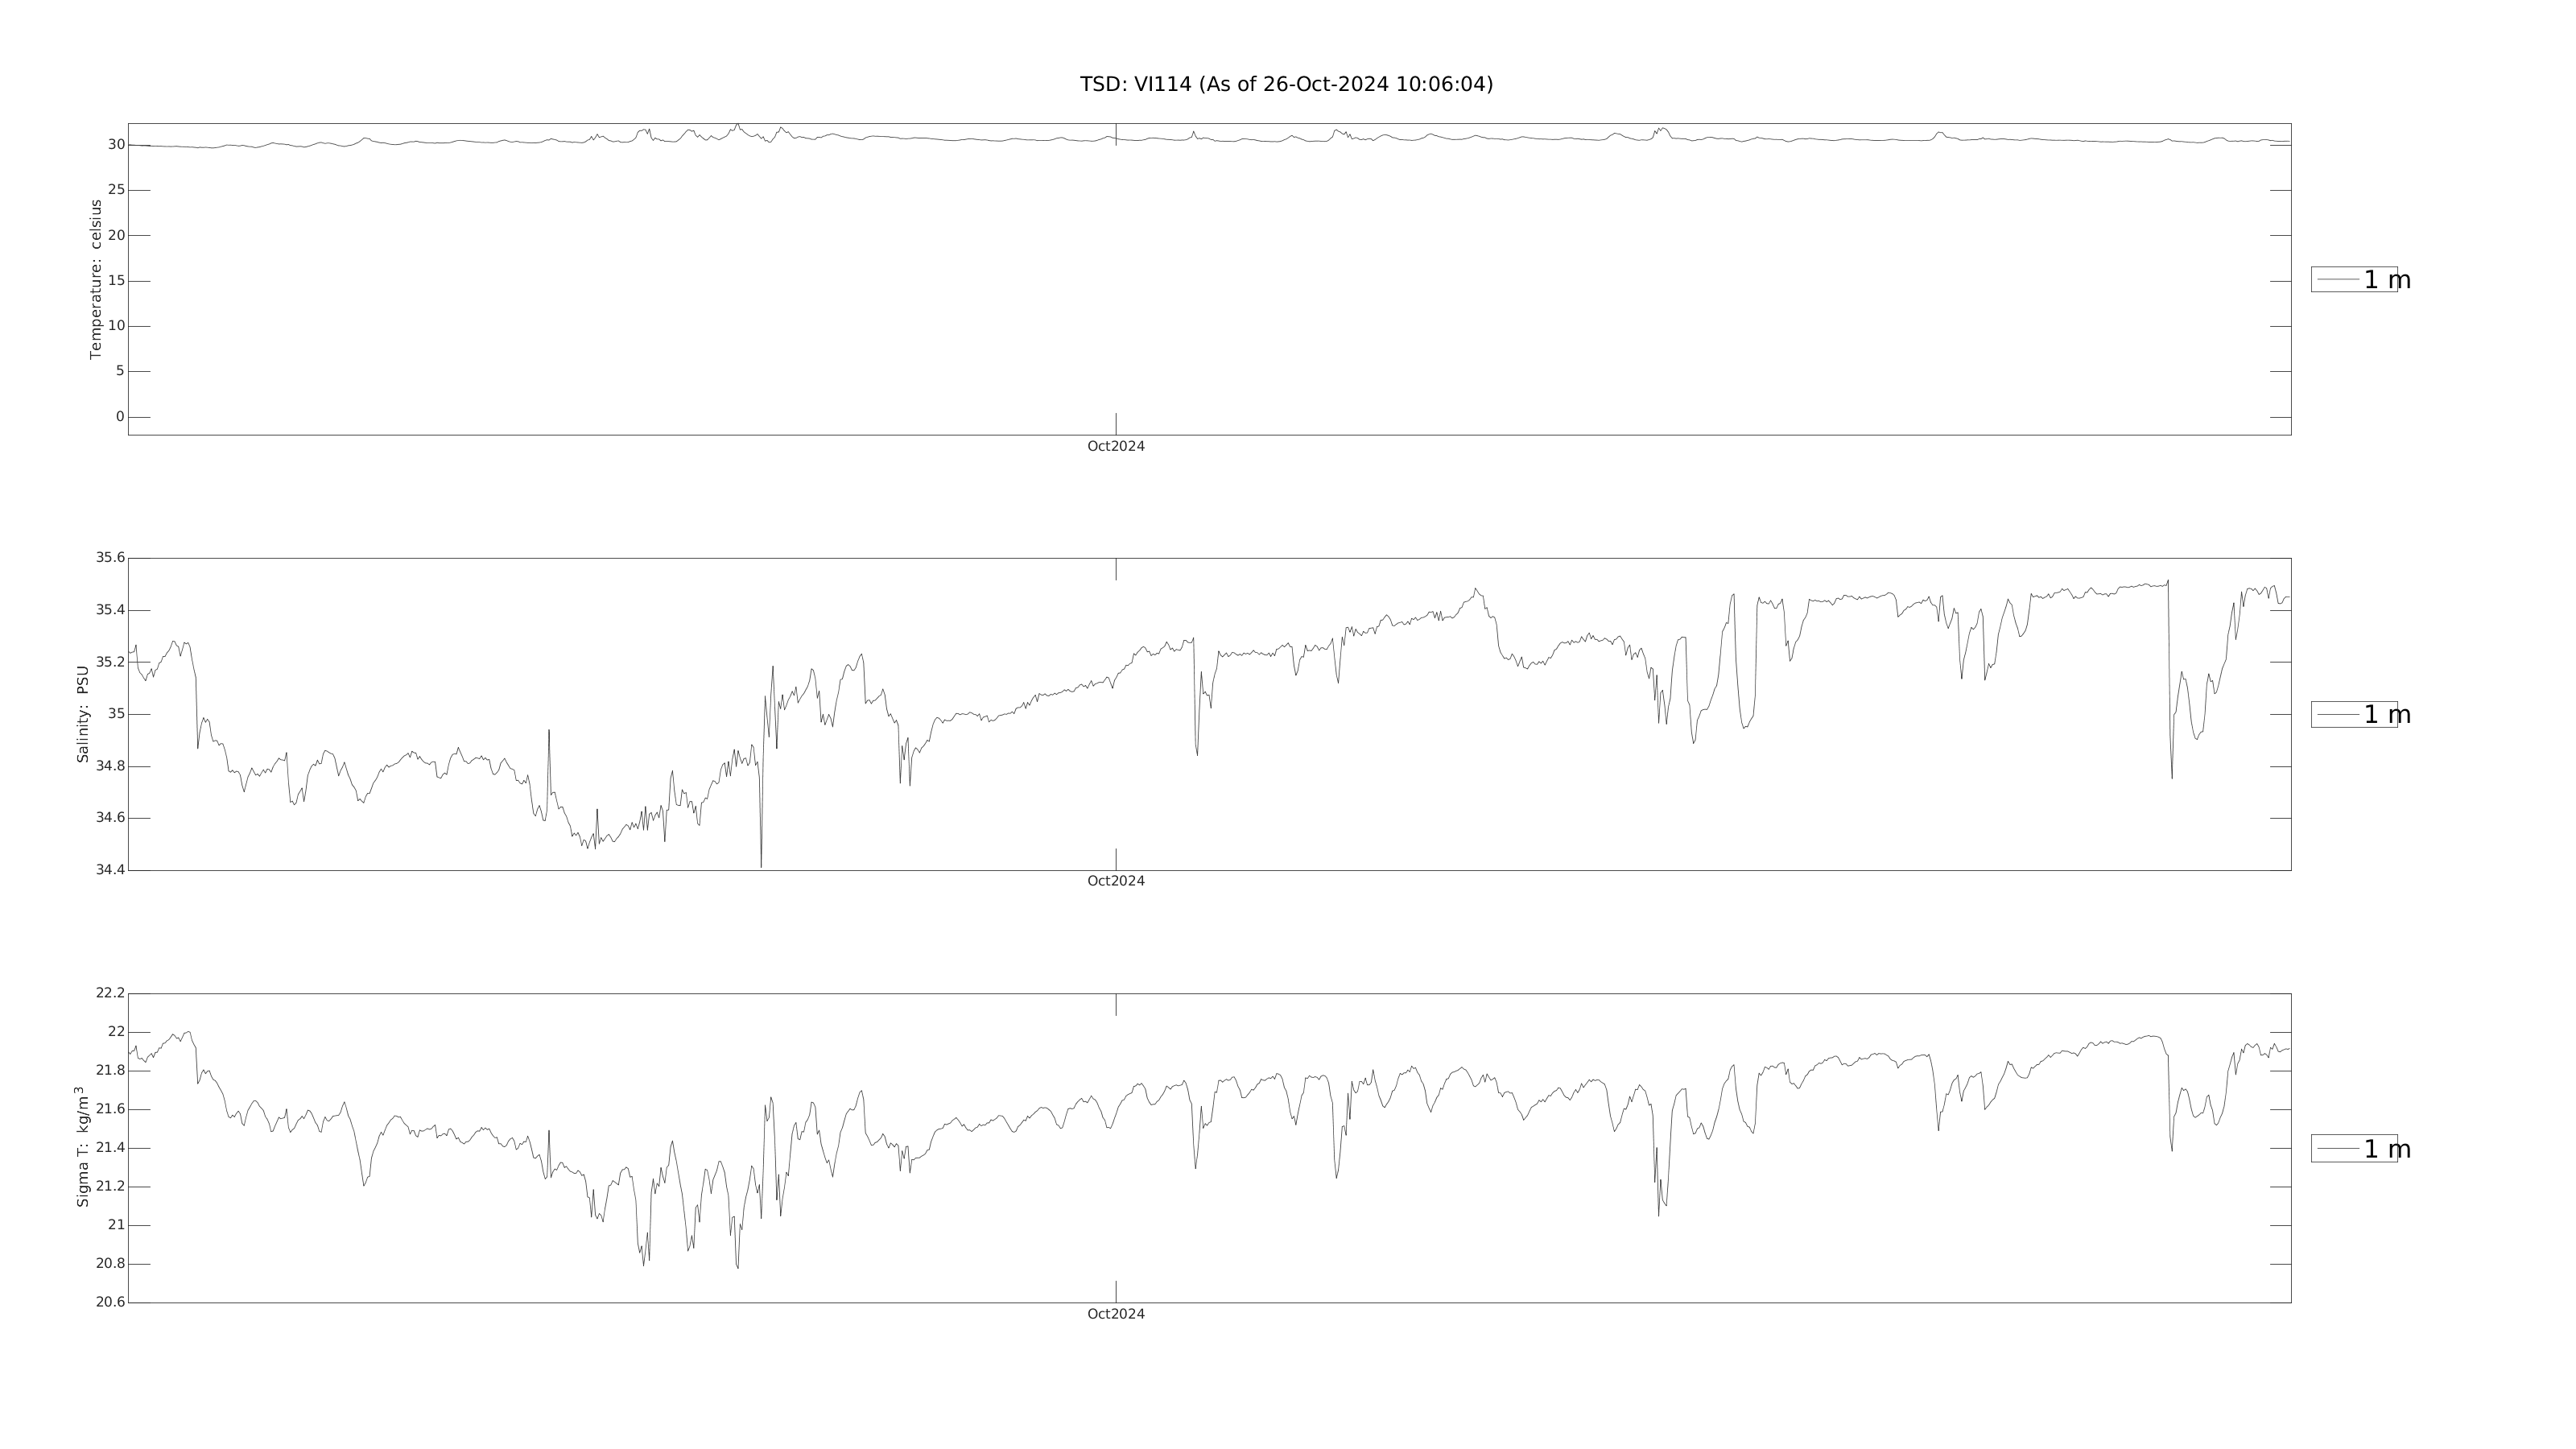
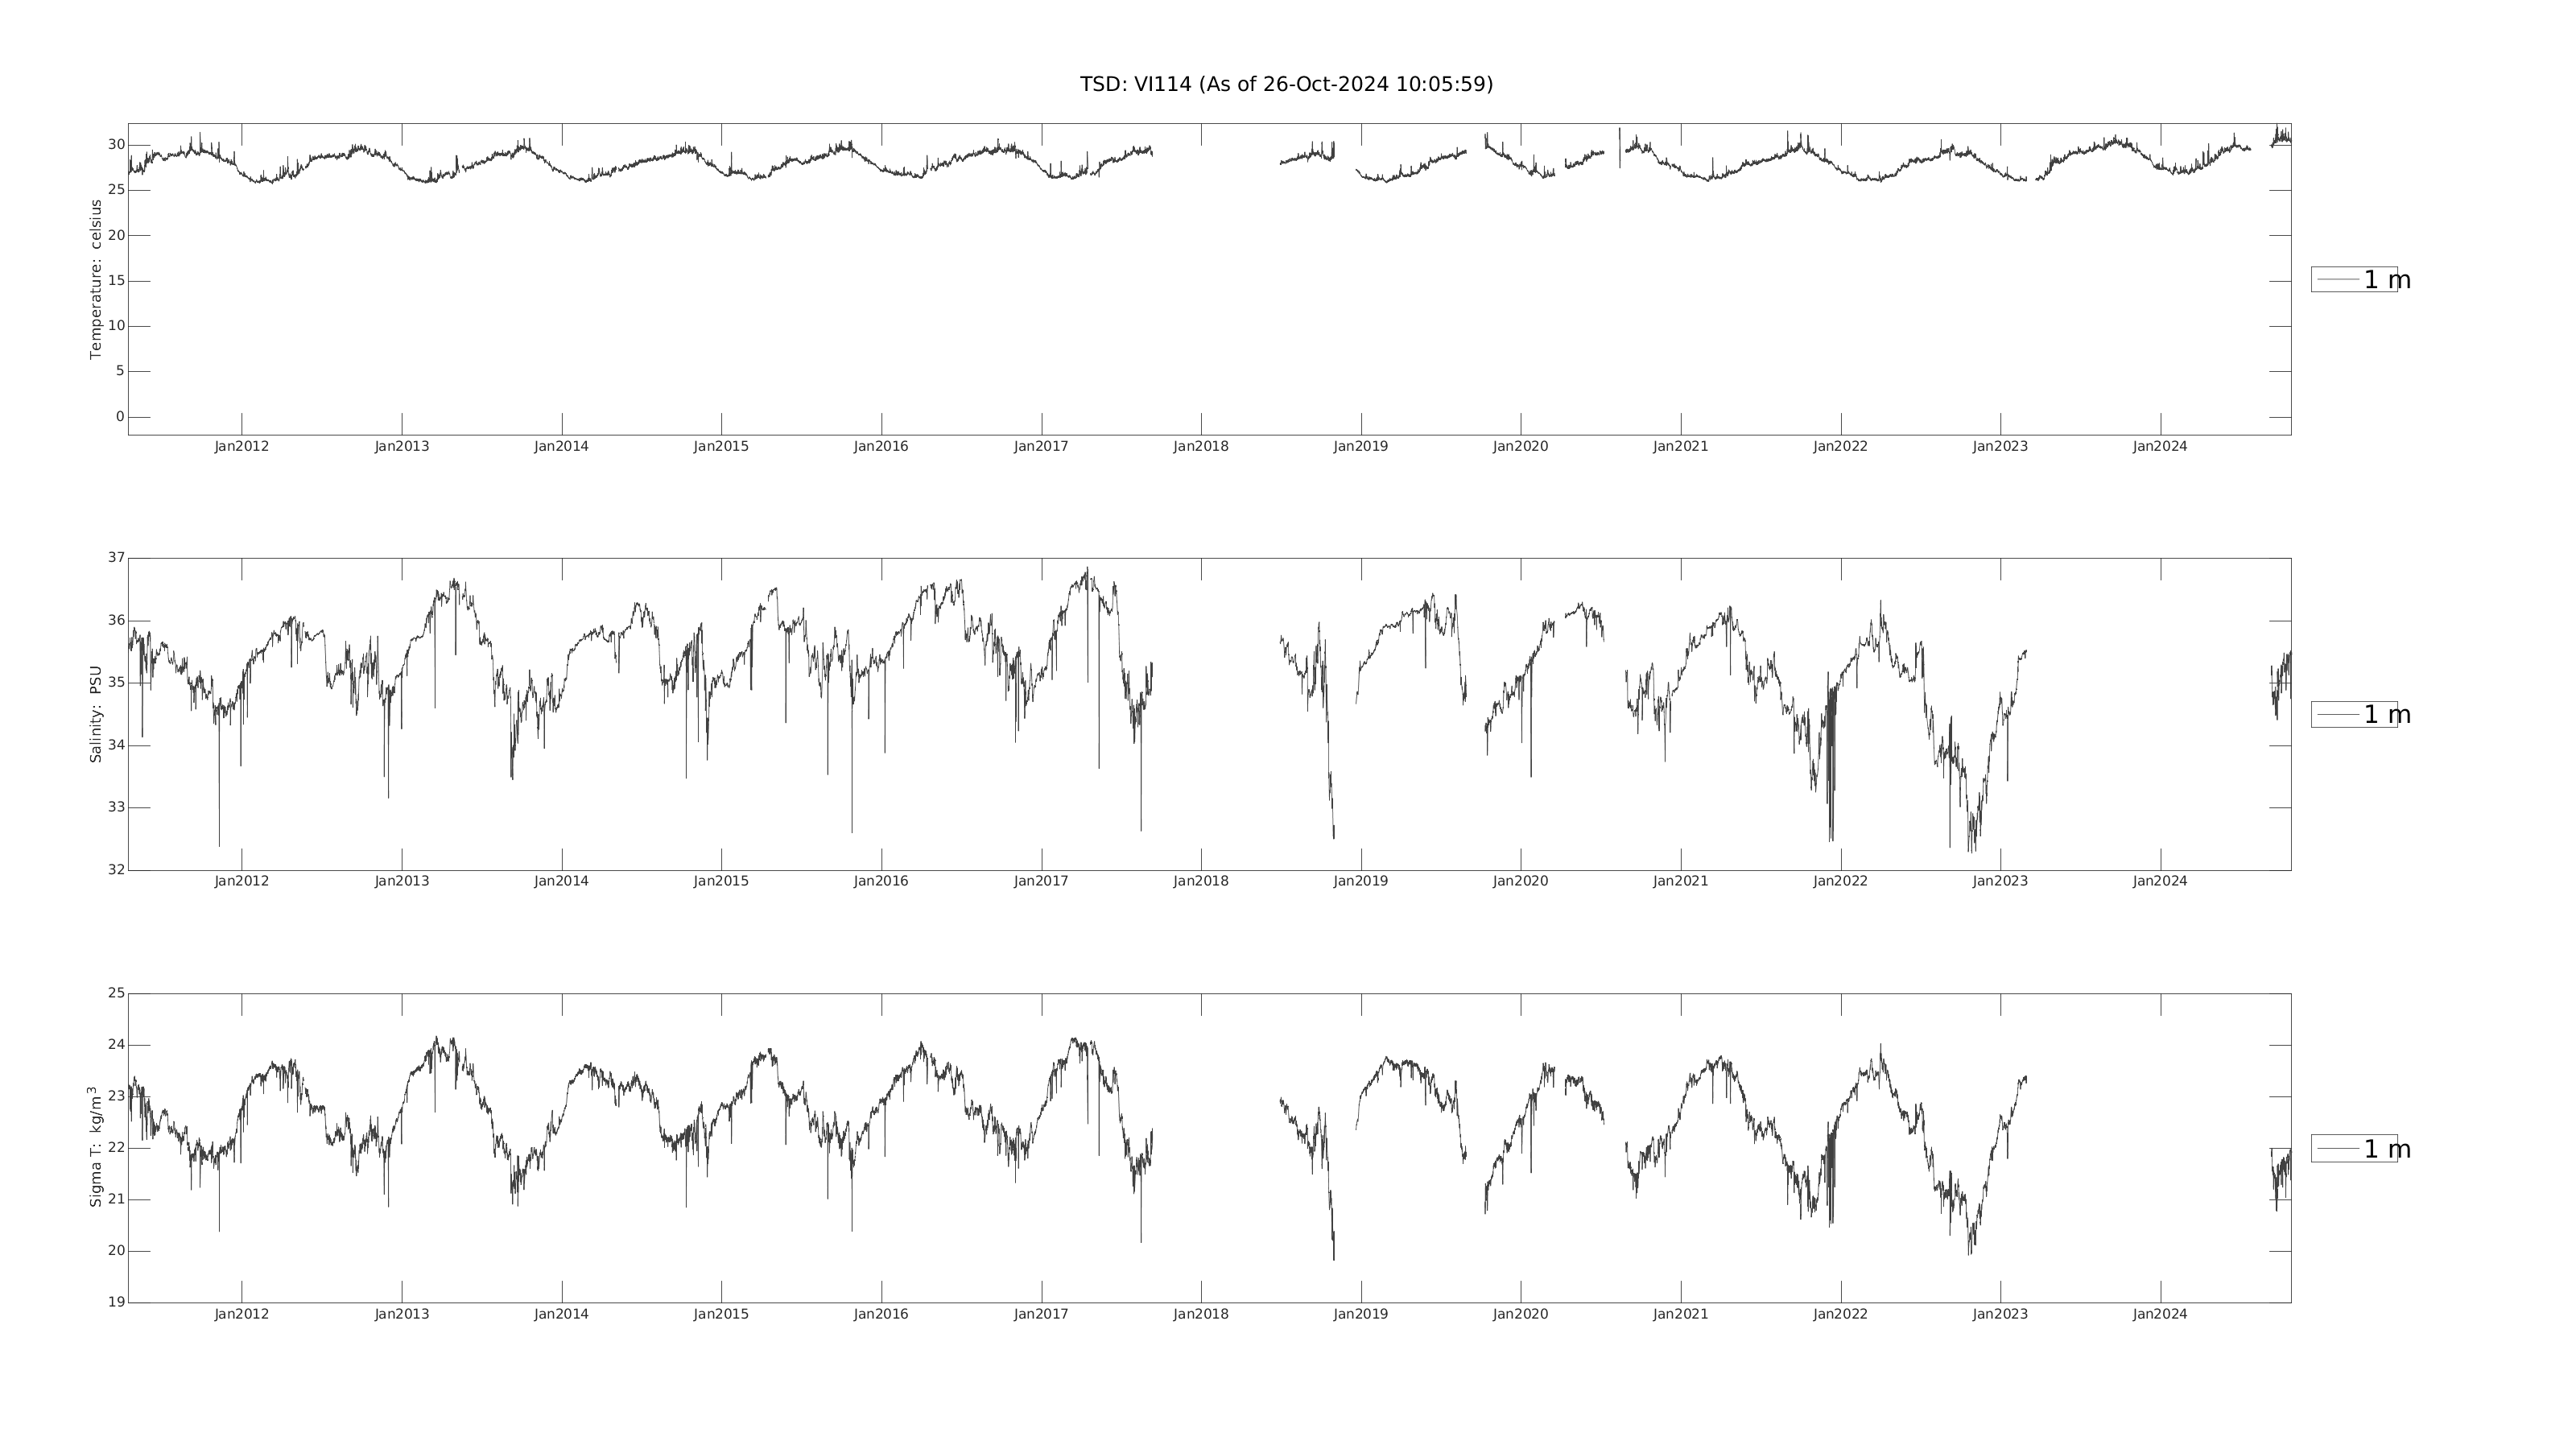 Temperature, Salinity, Density:
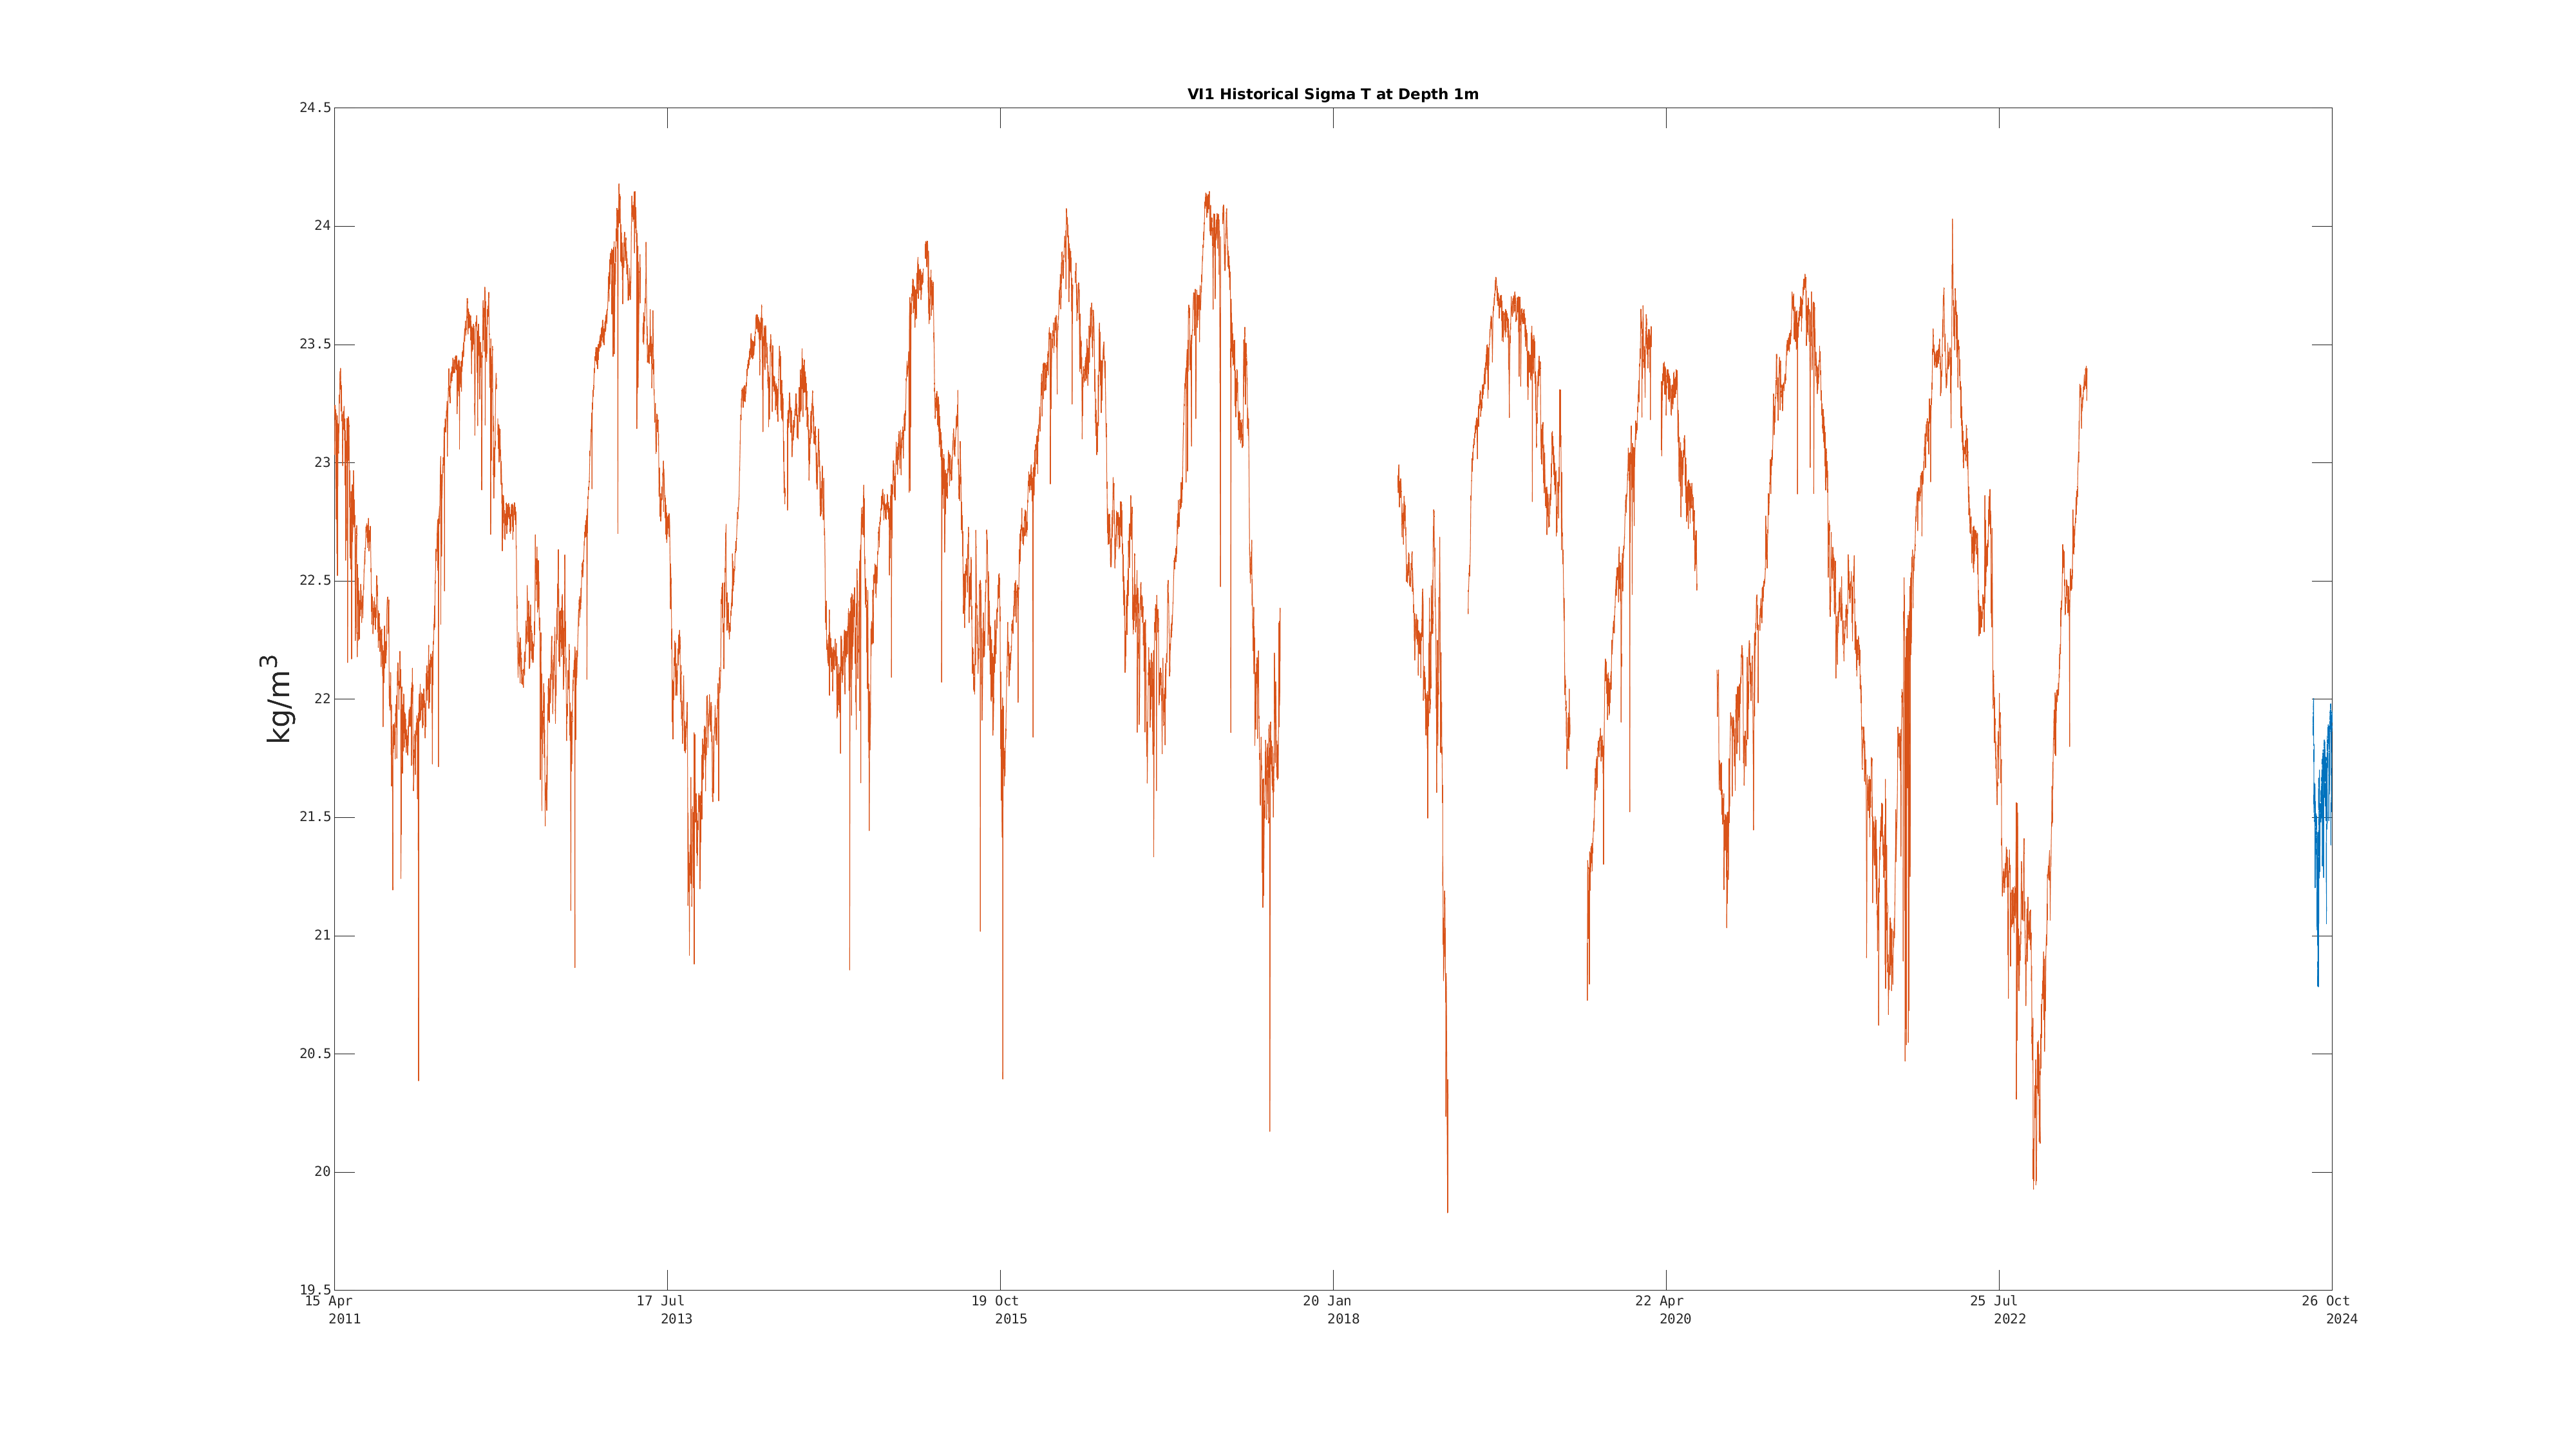
 Temperature, Salinity, Density (Deployment Only):
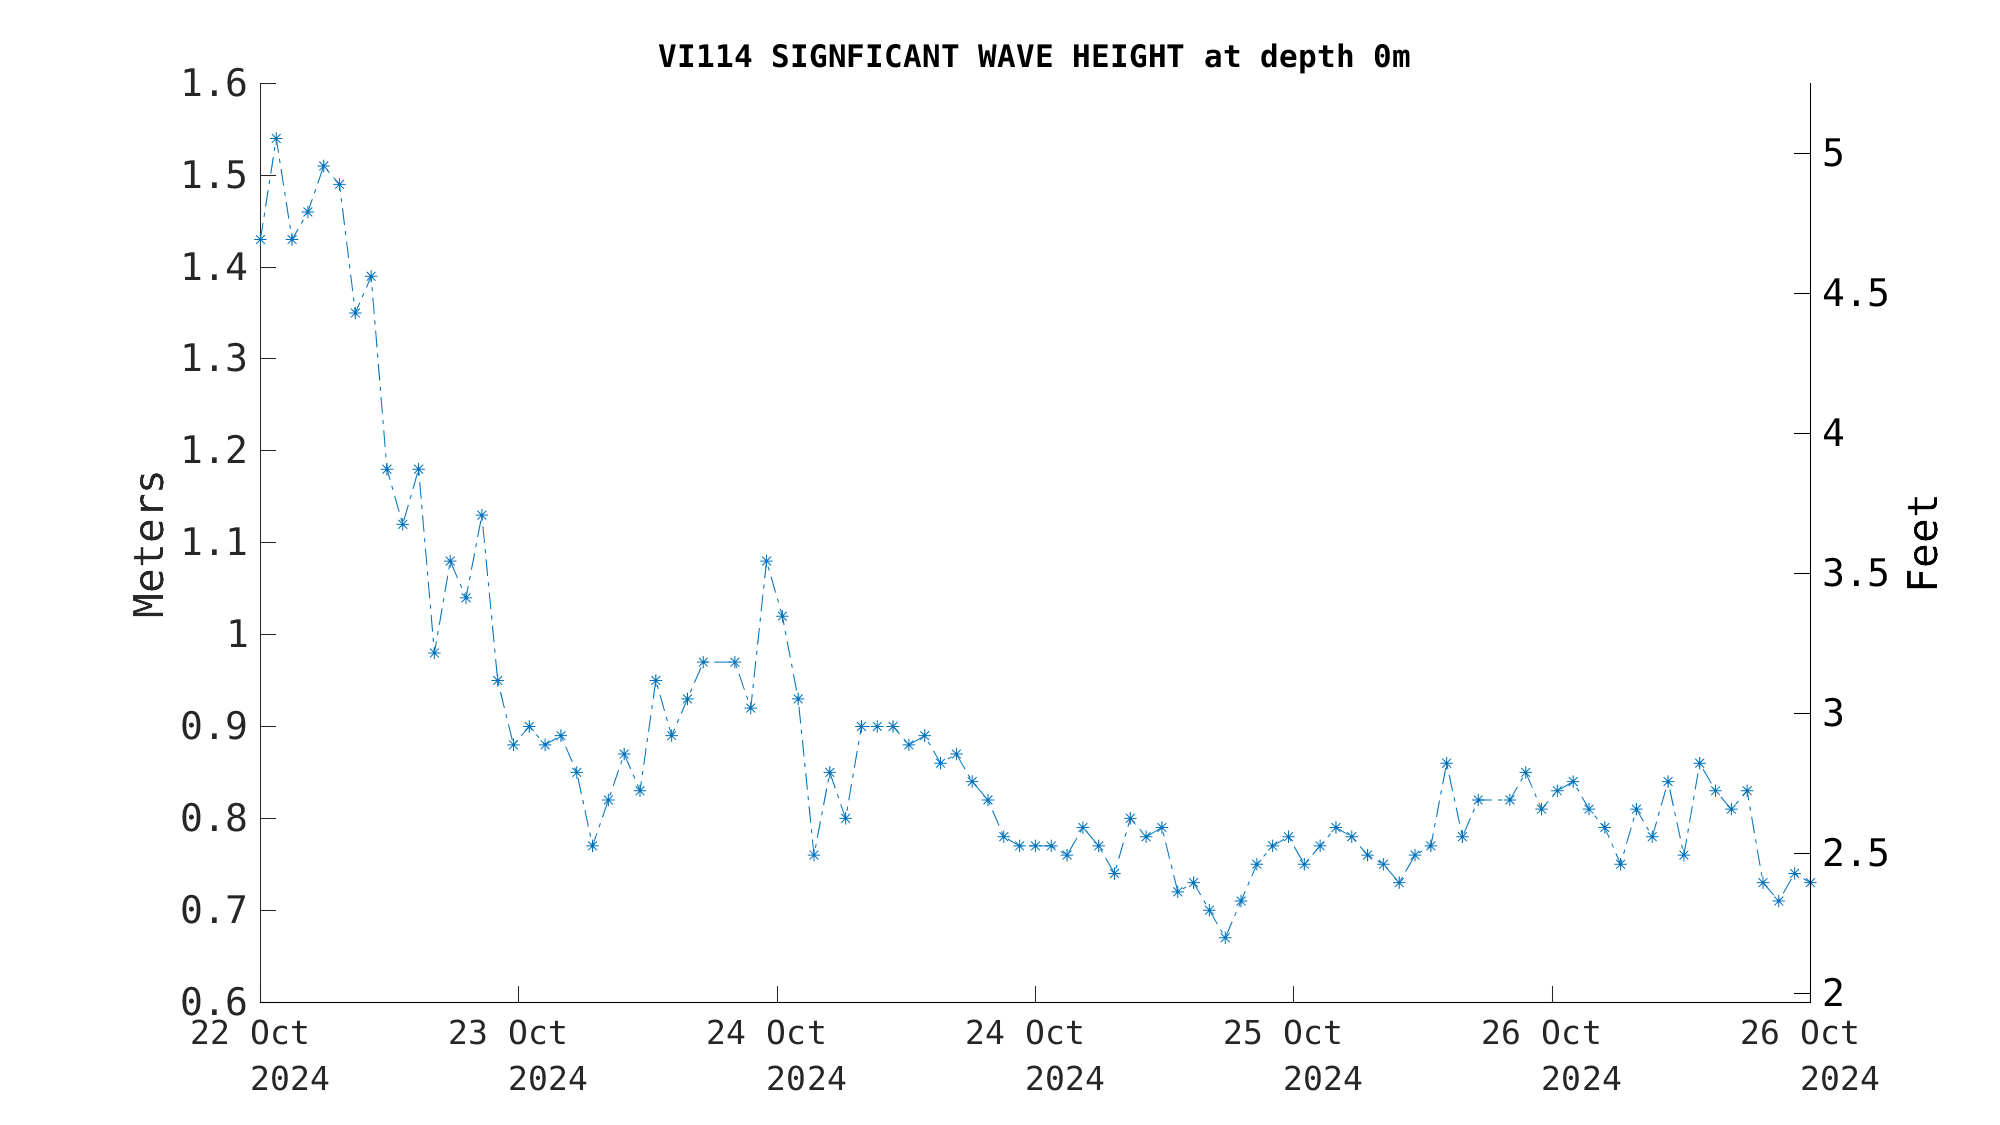
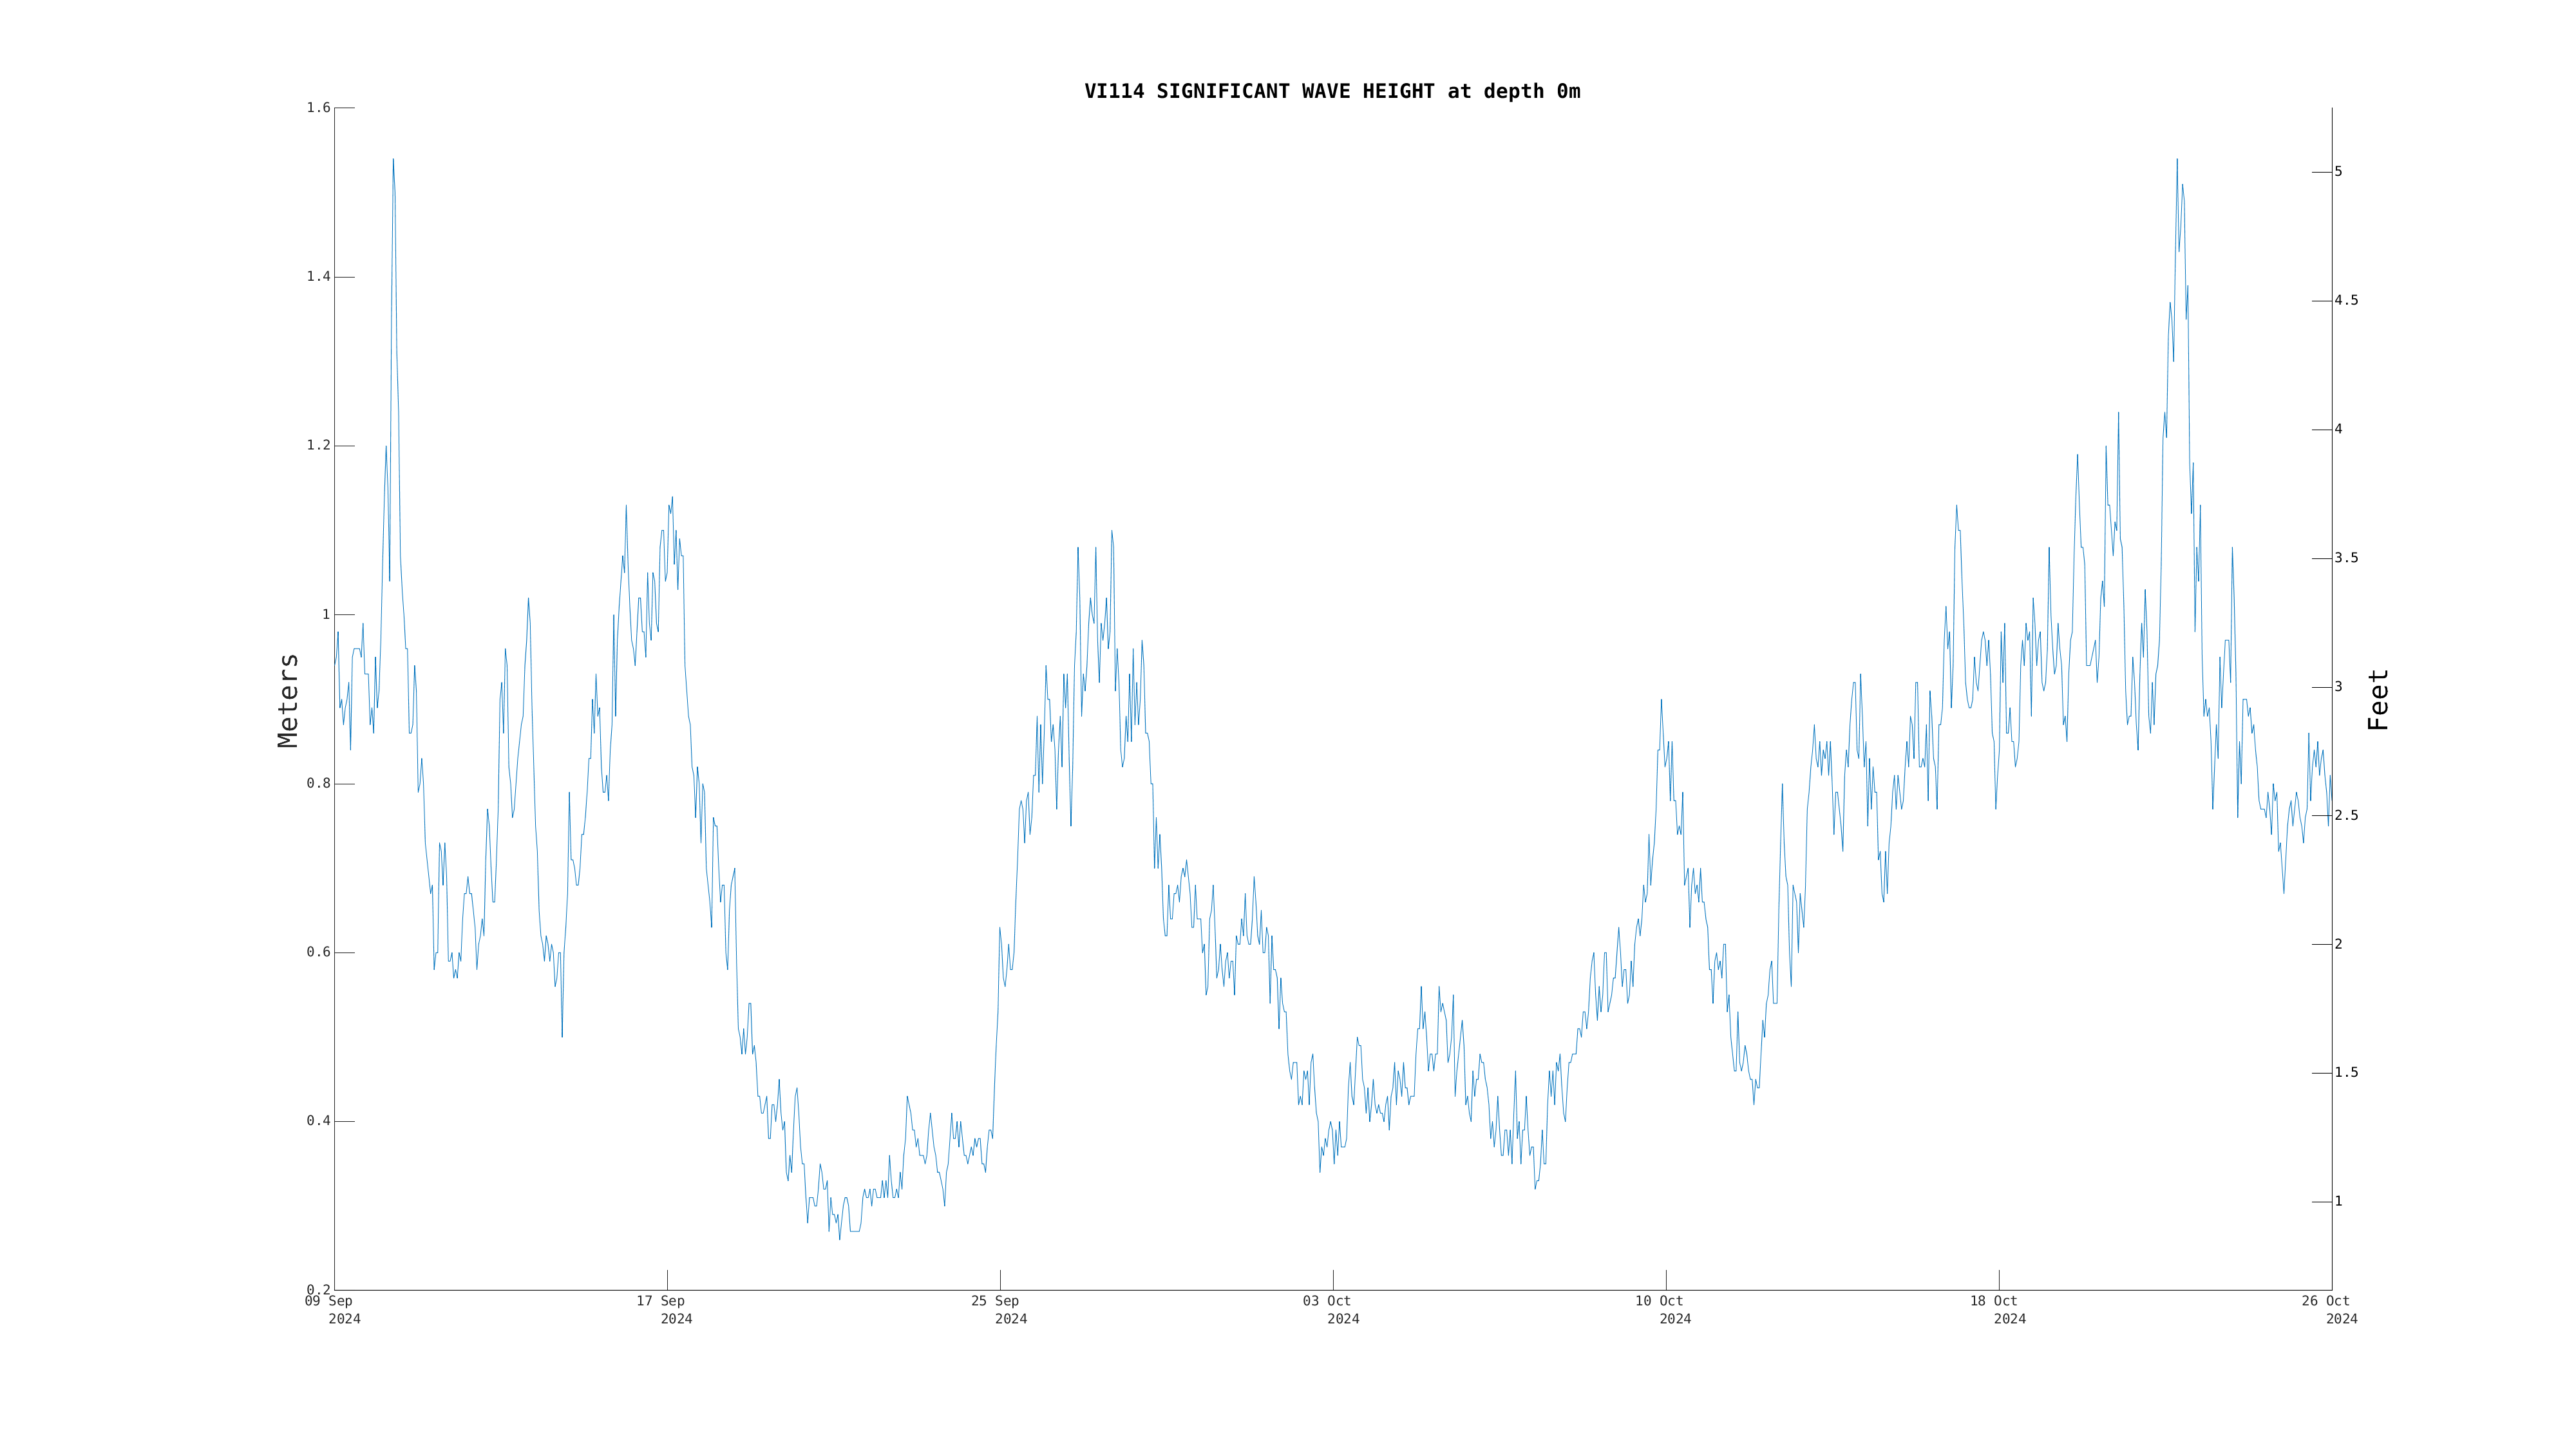


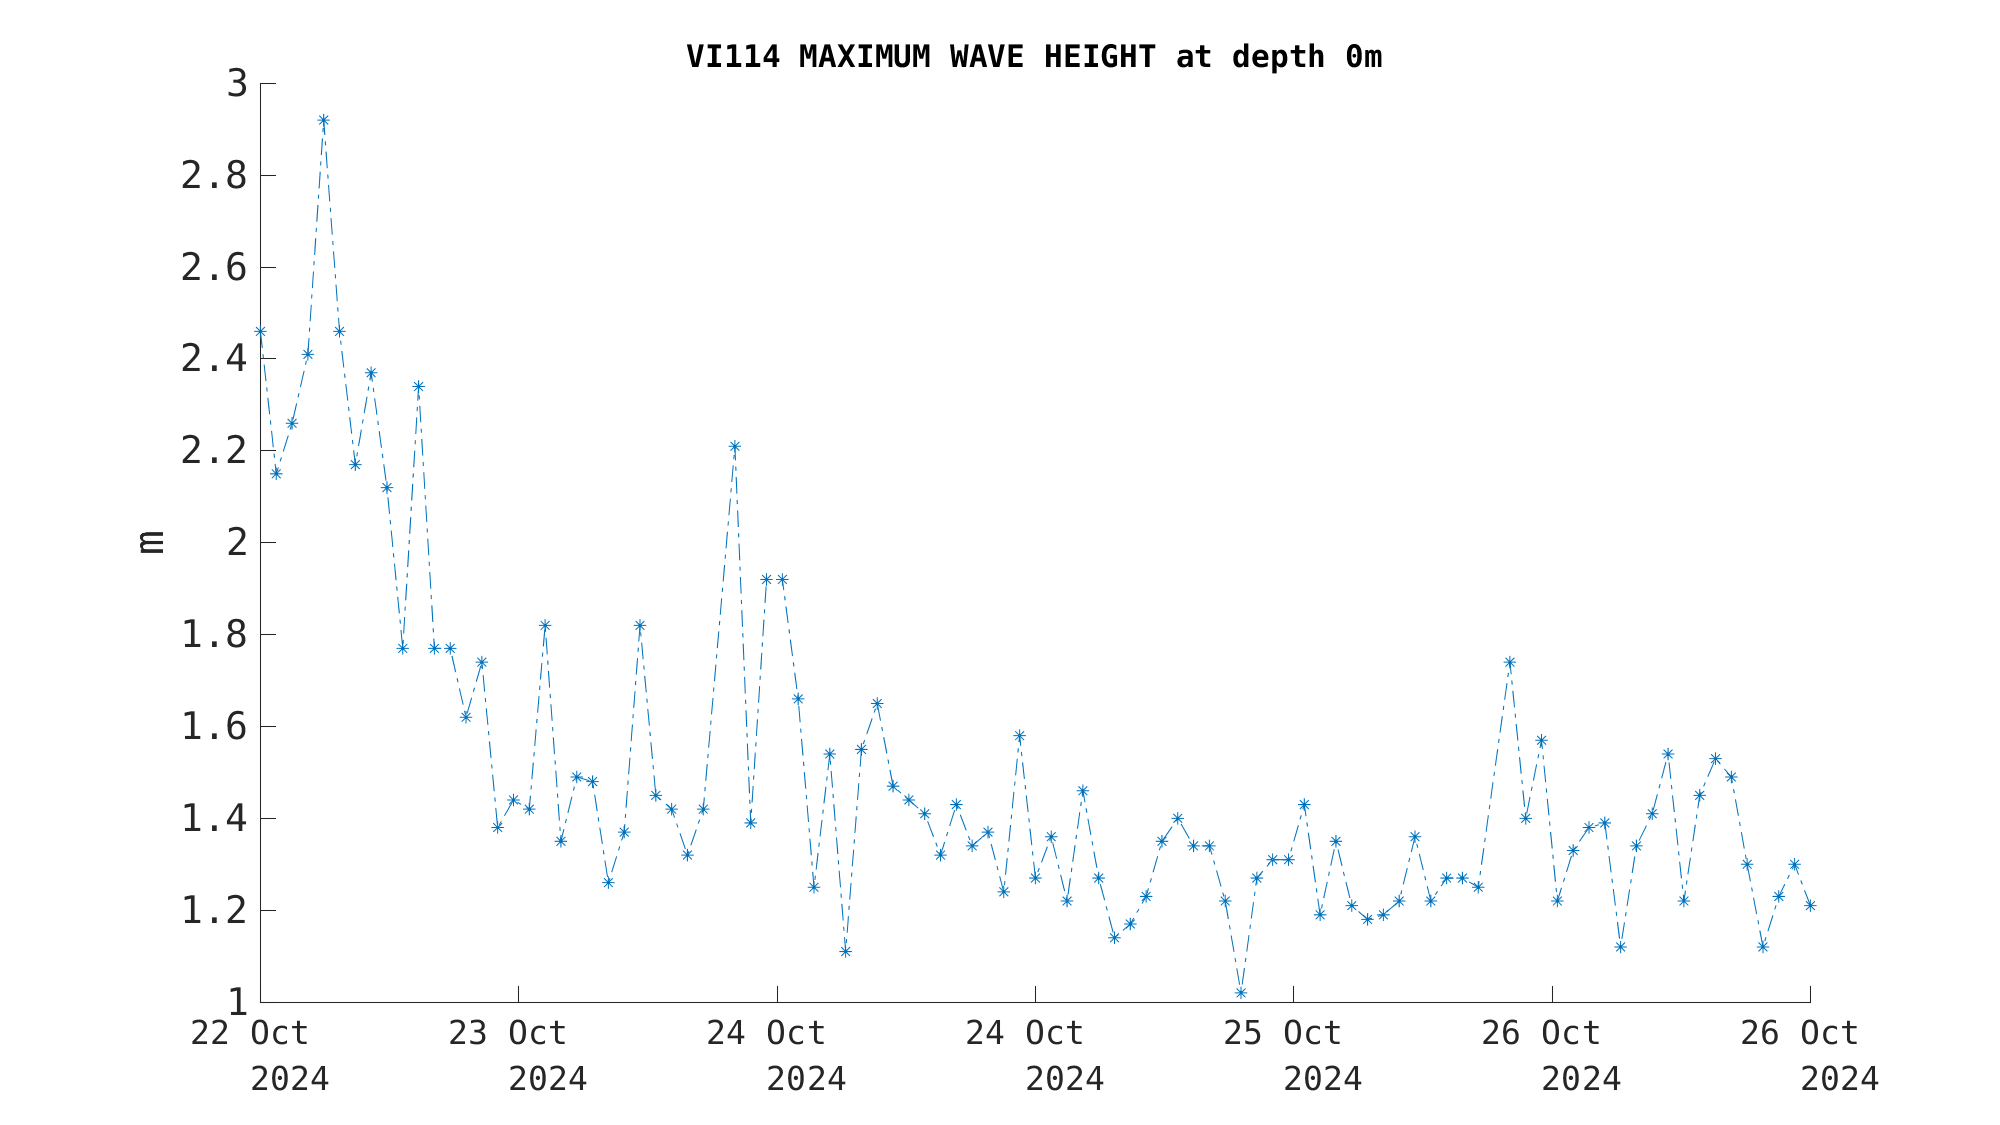
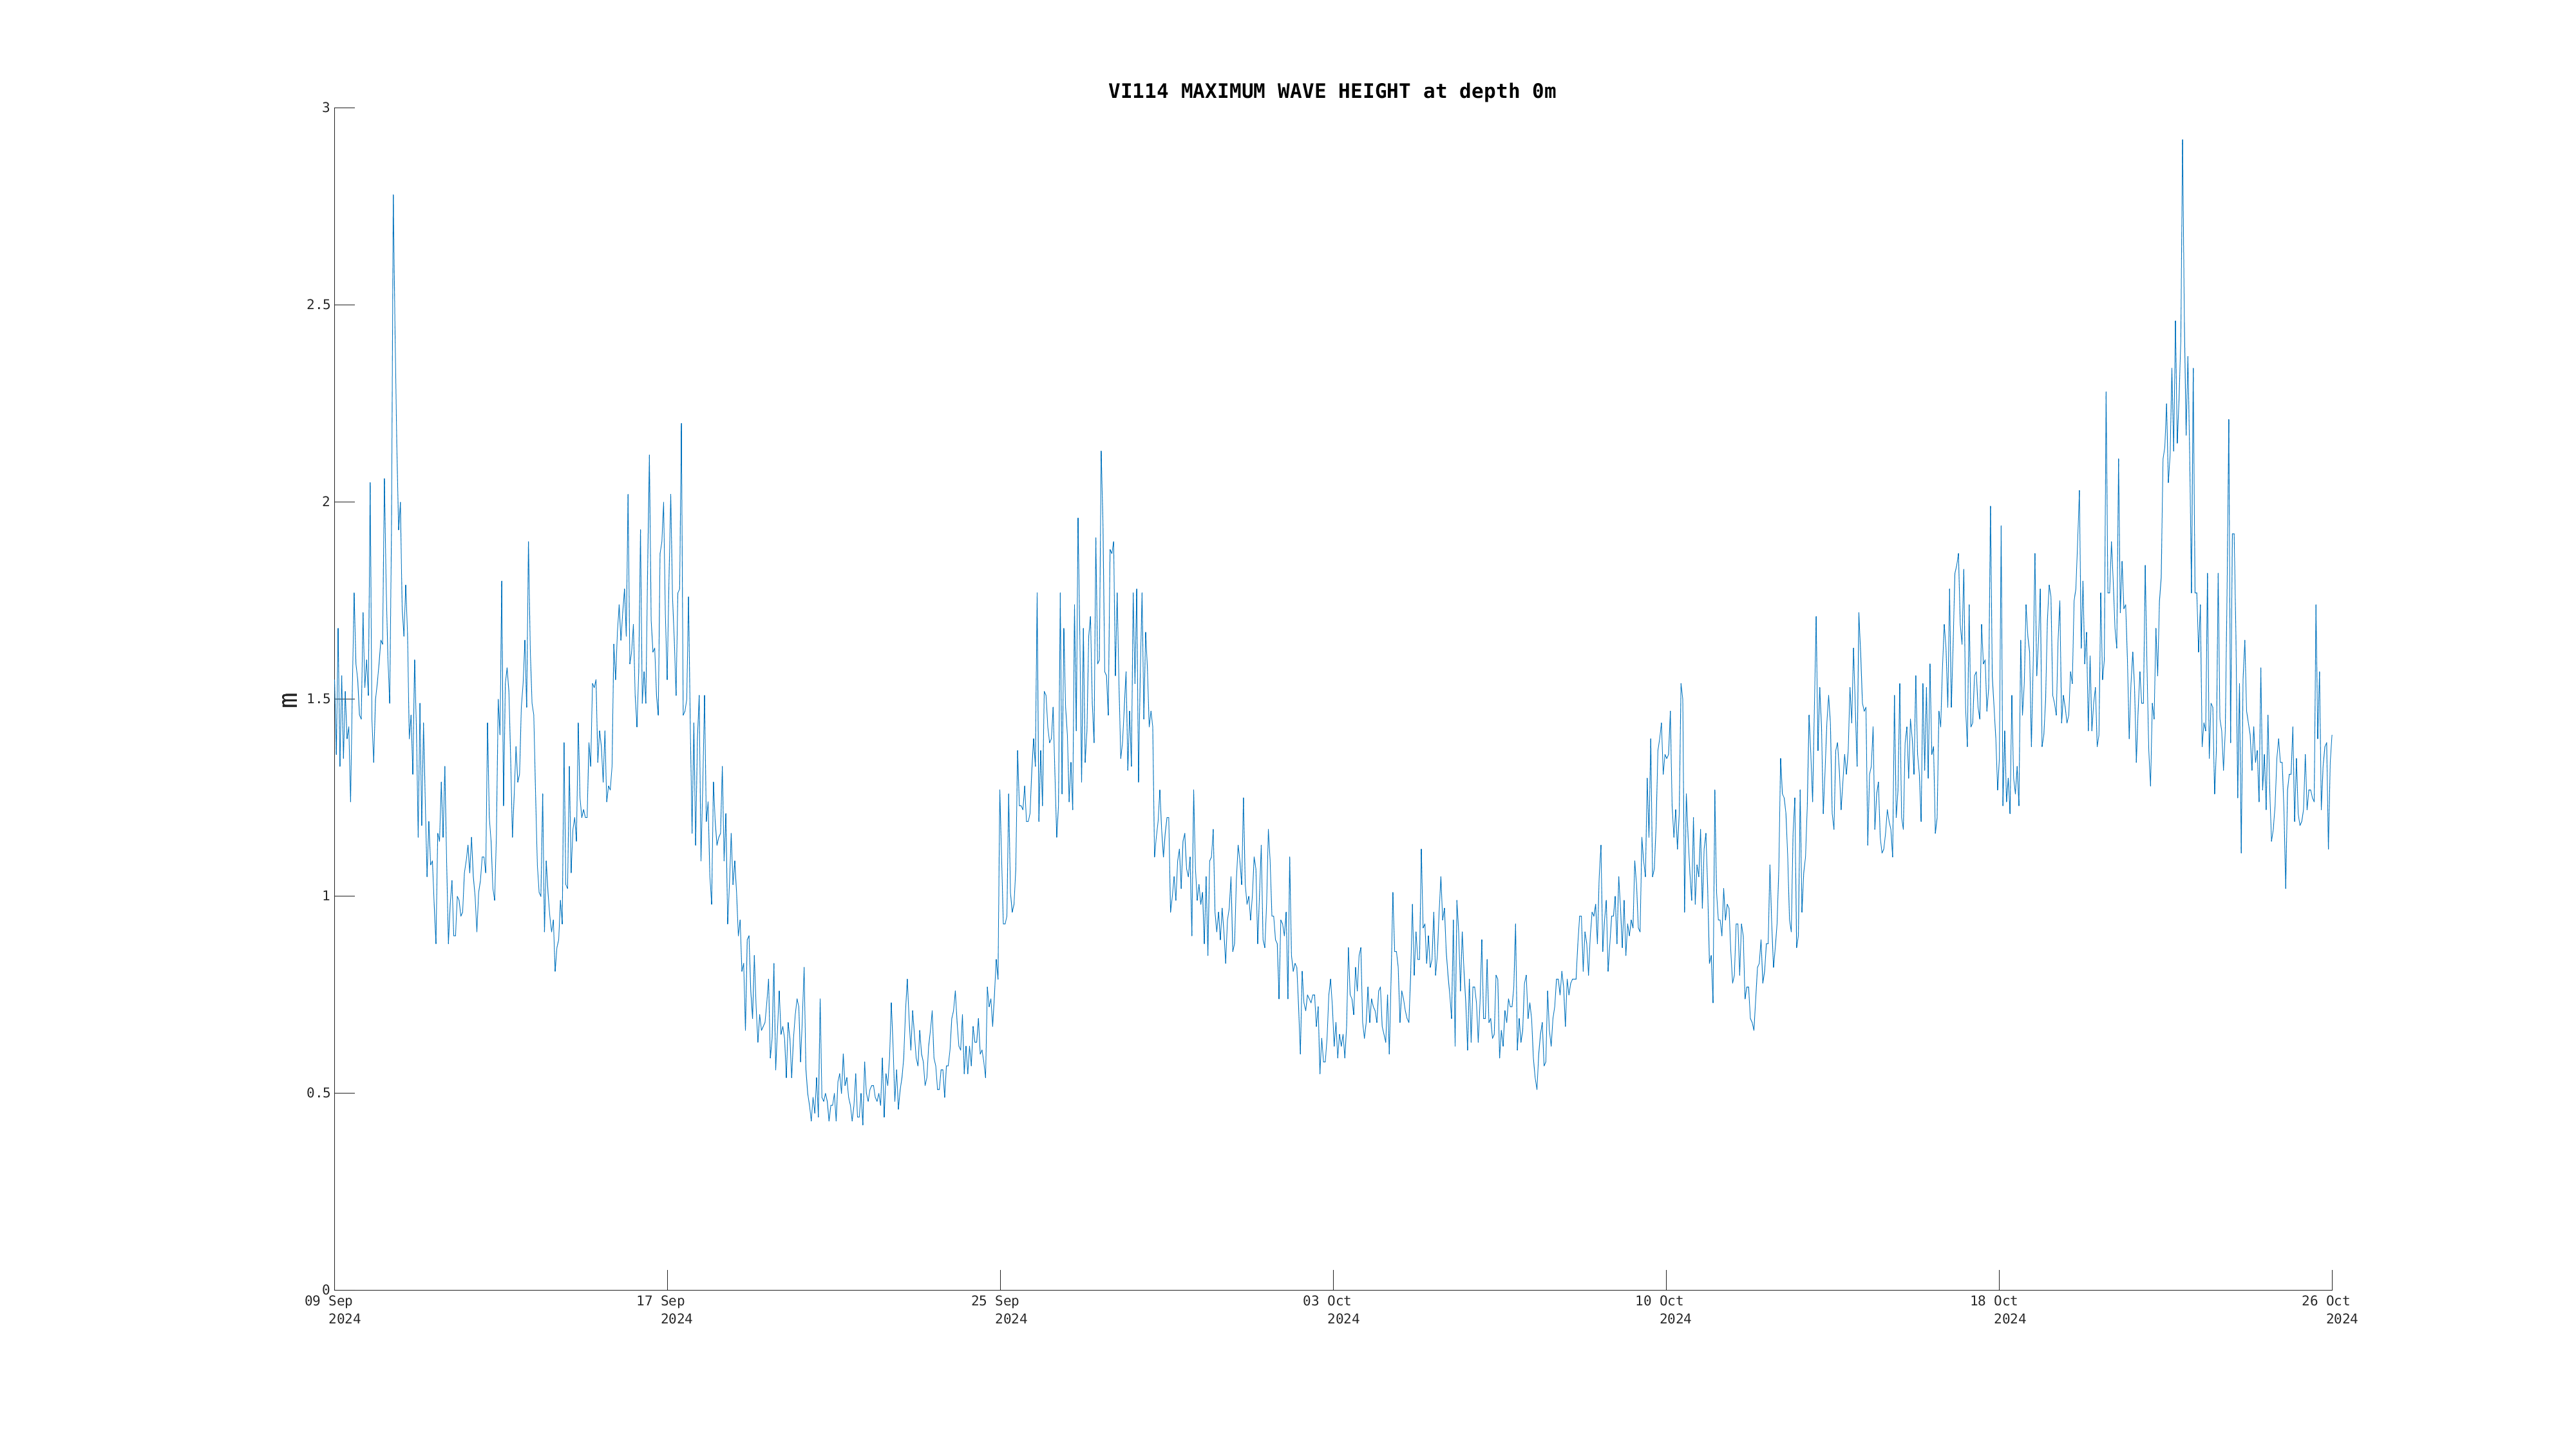
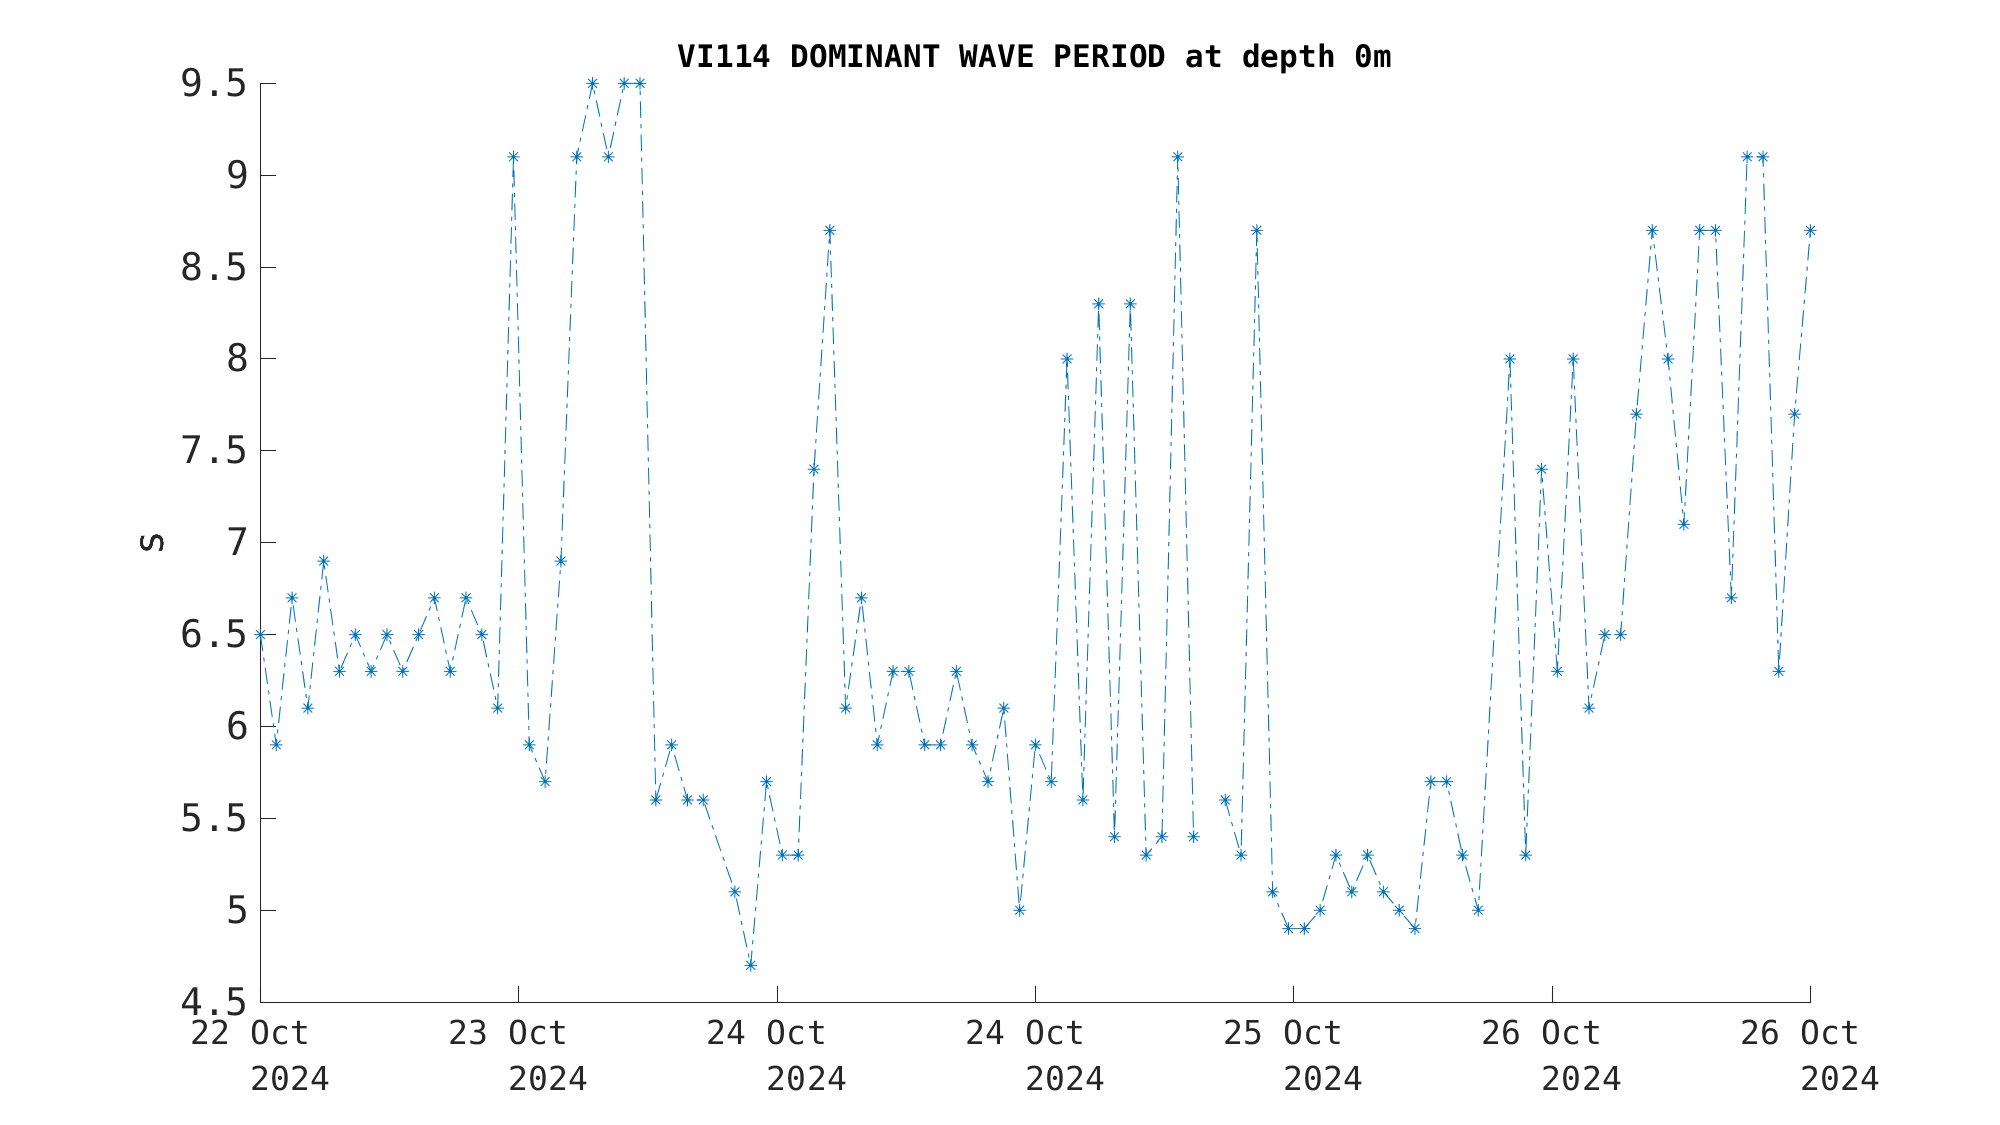
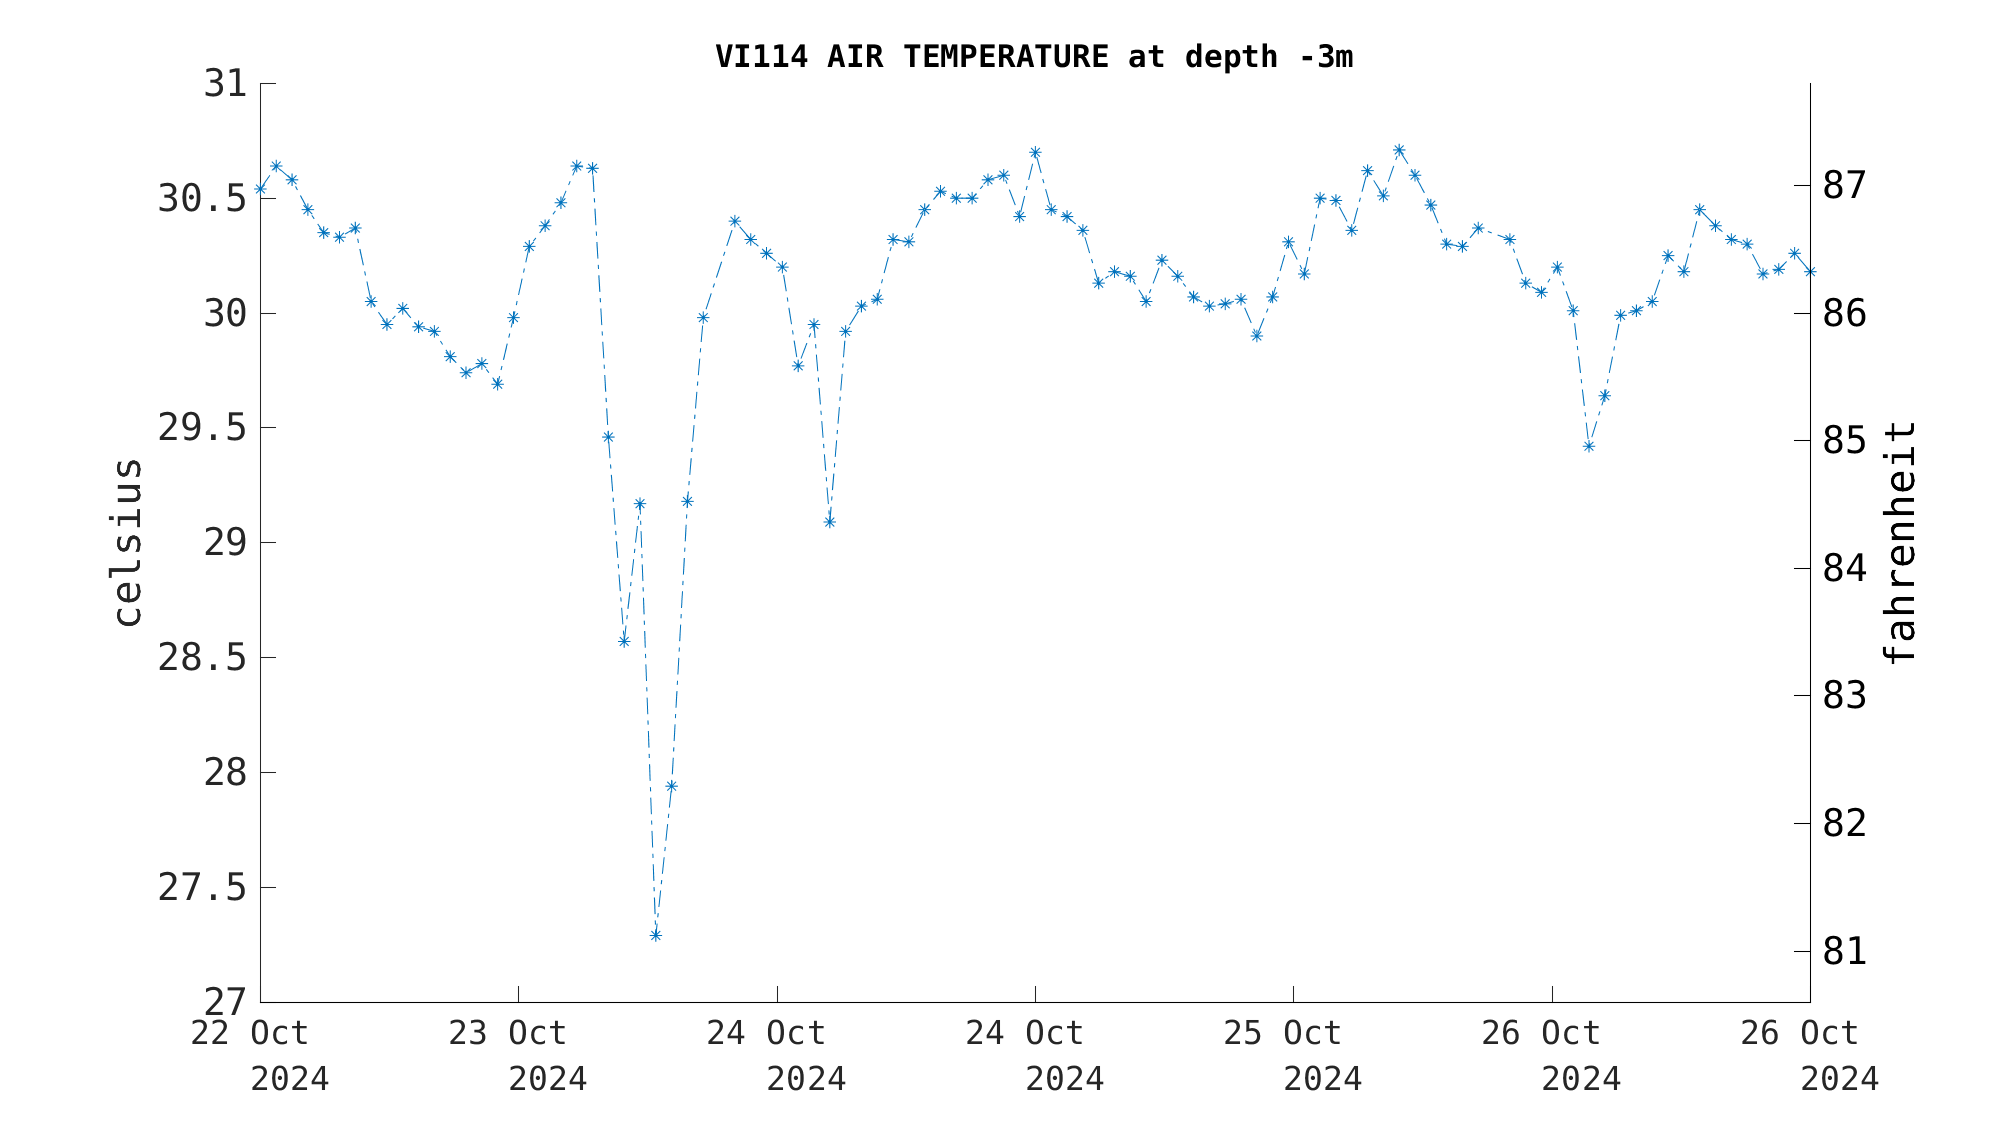
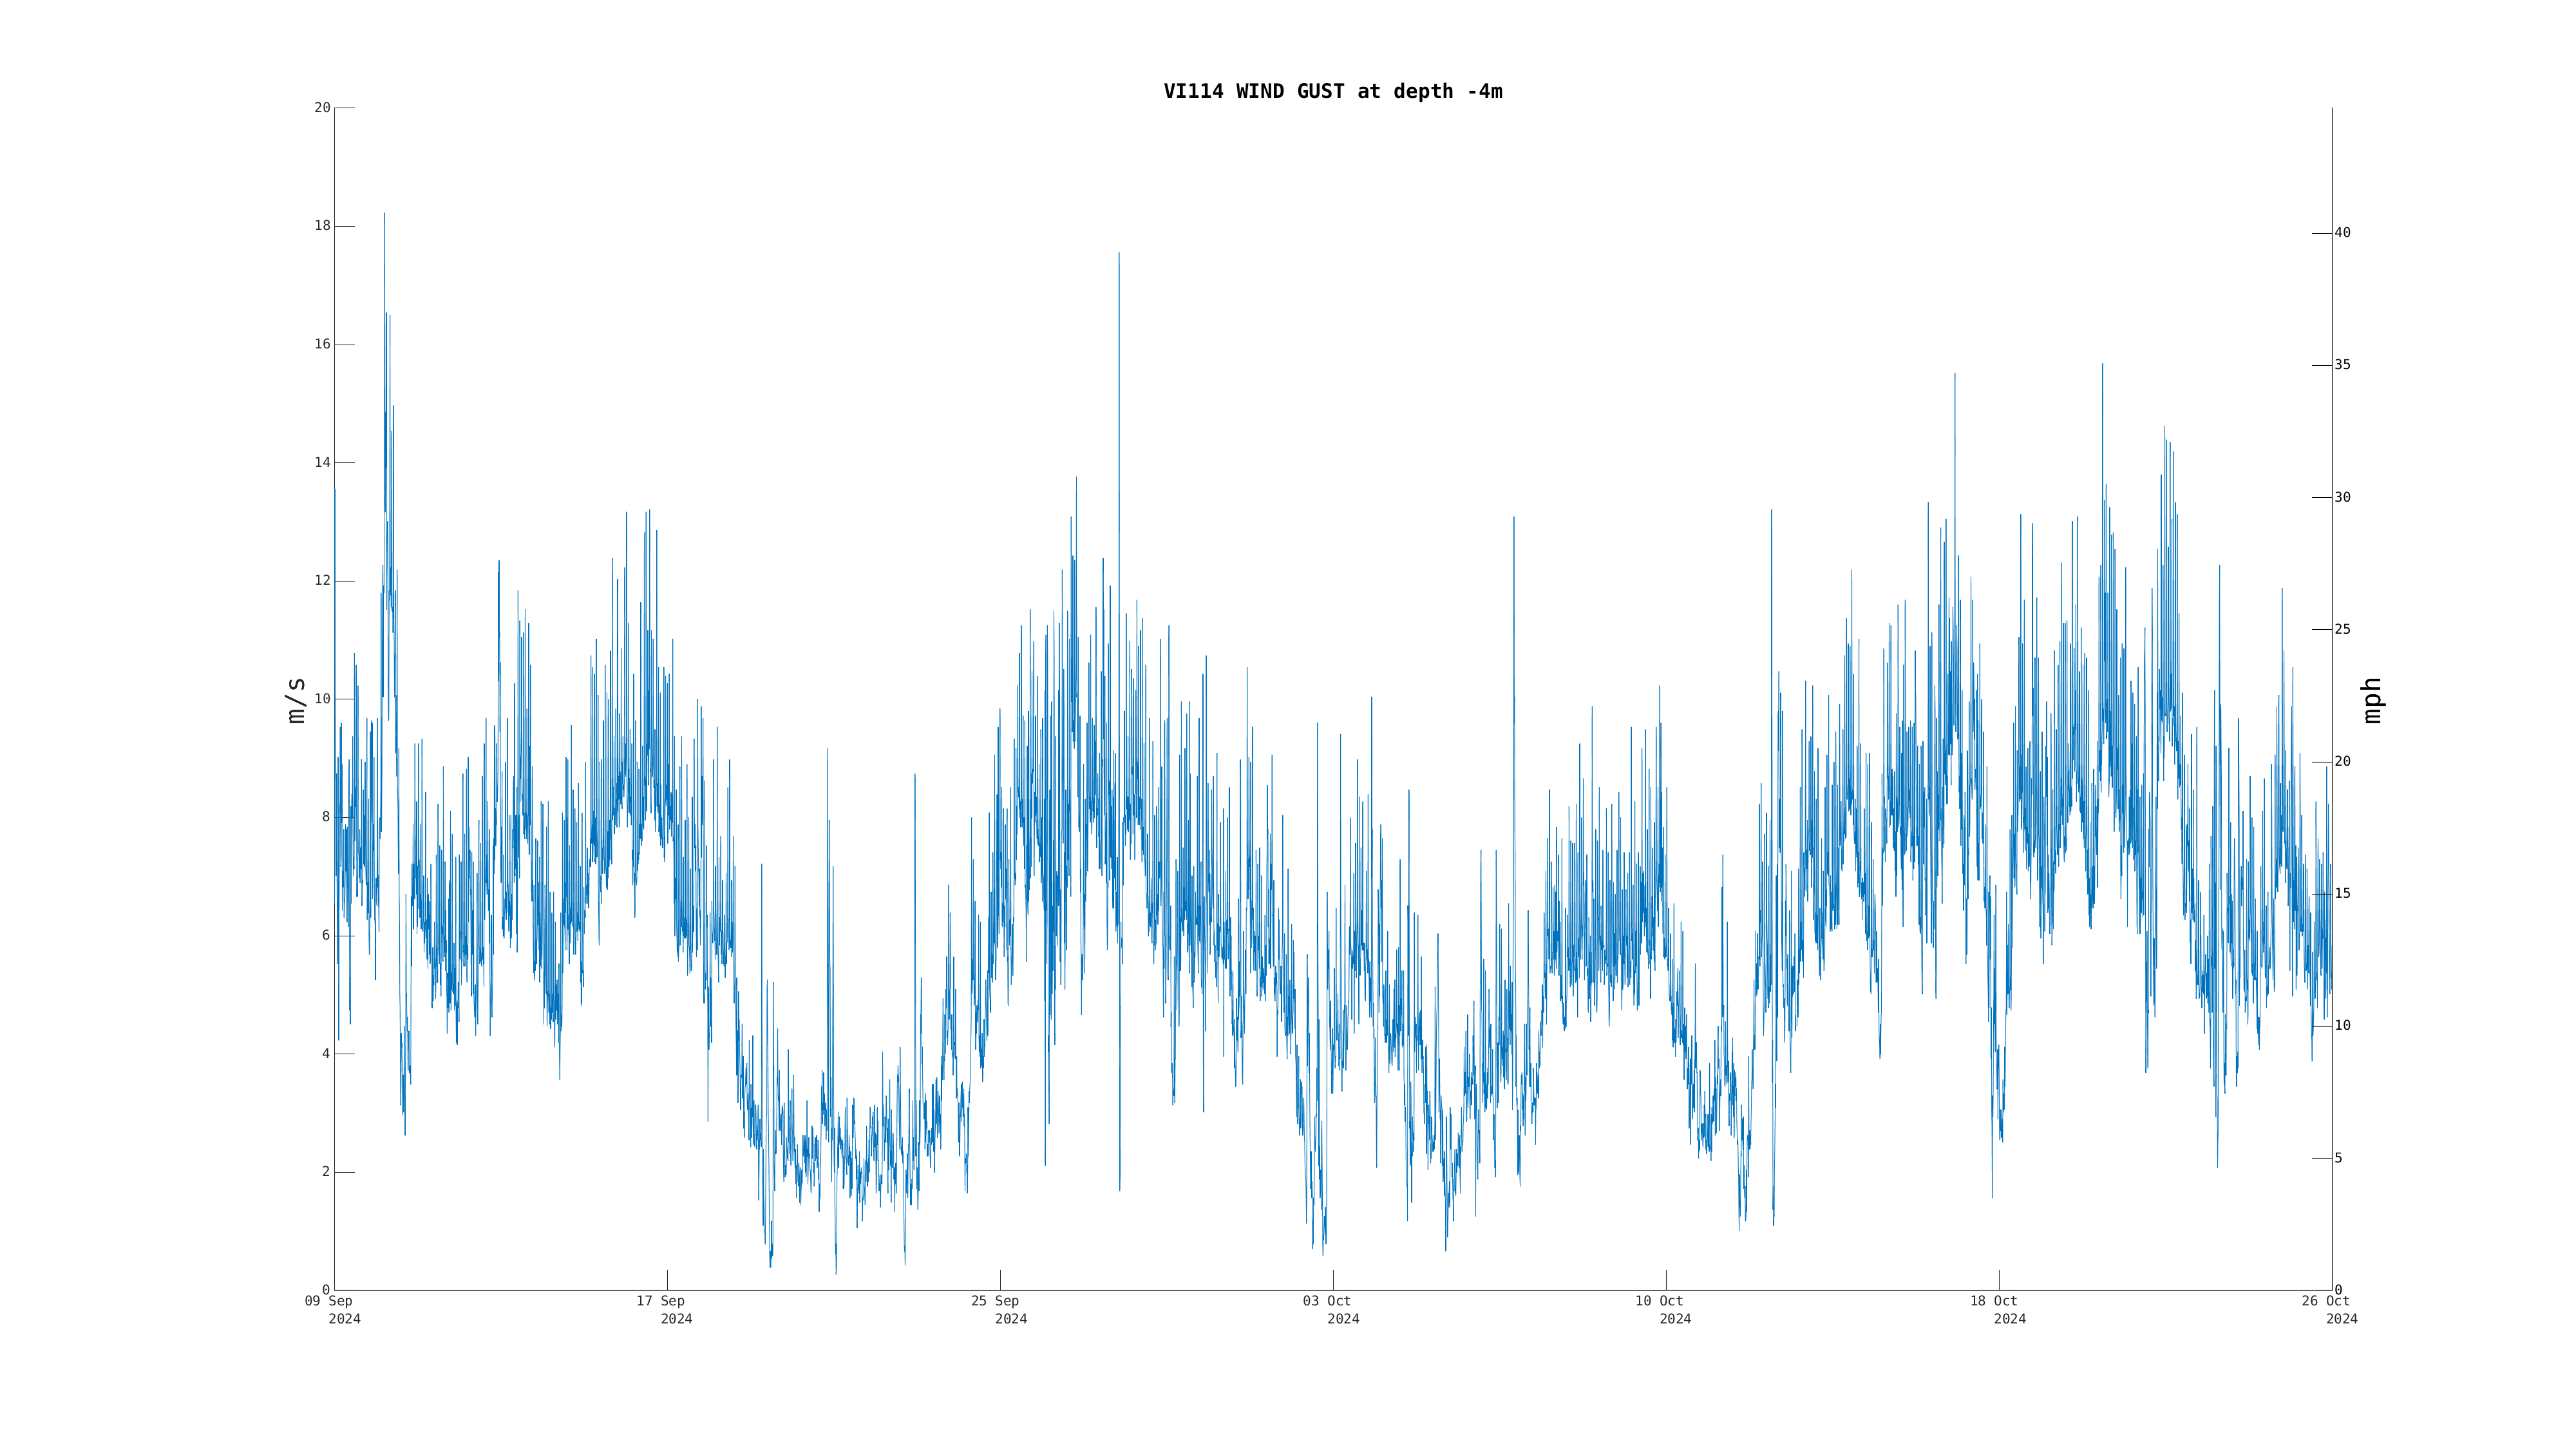
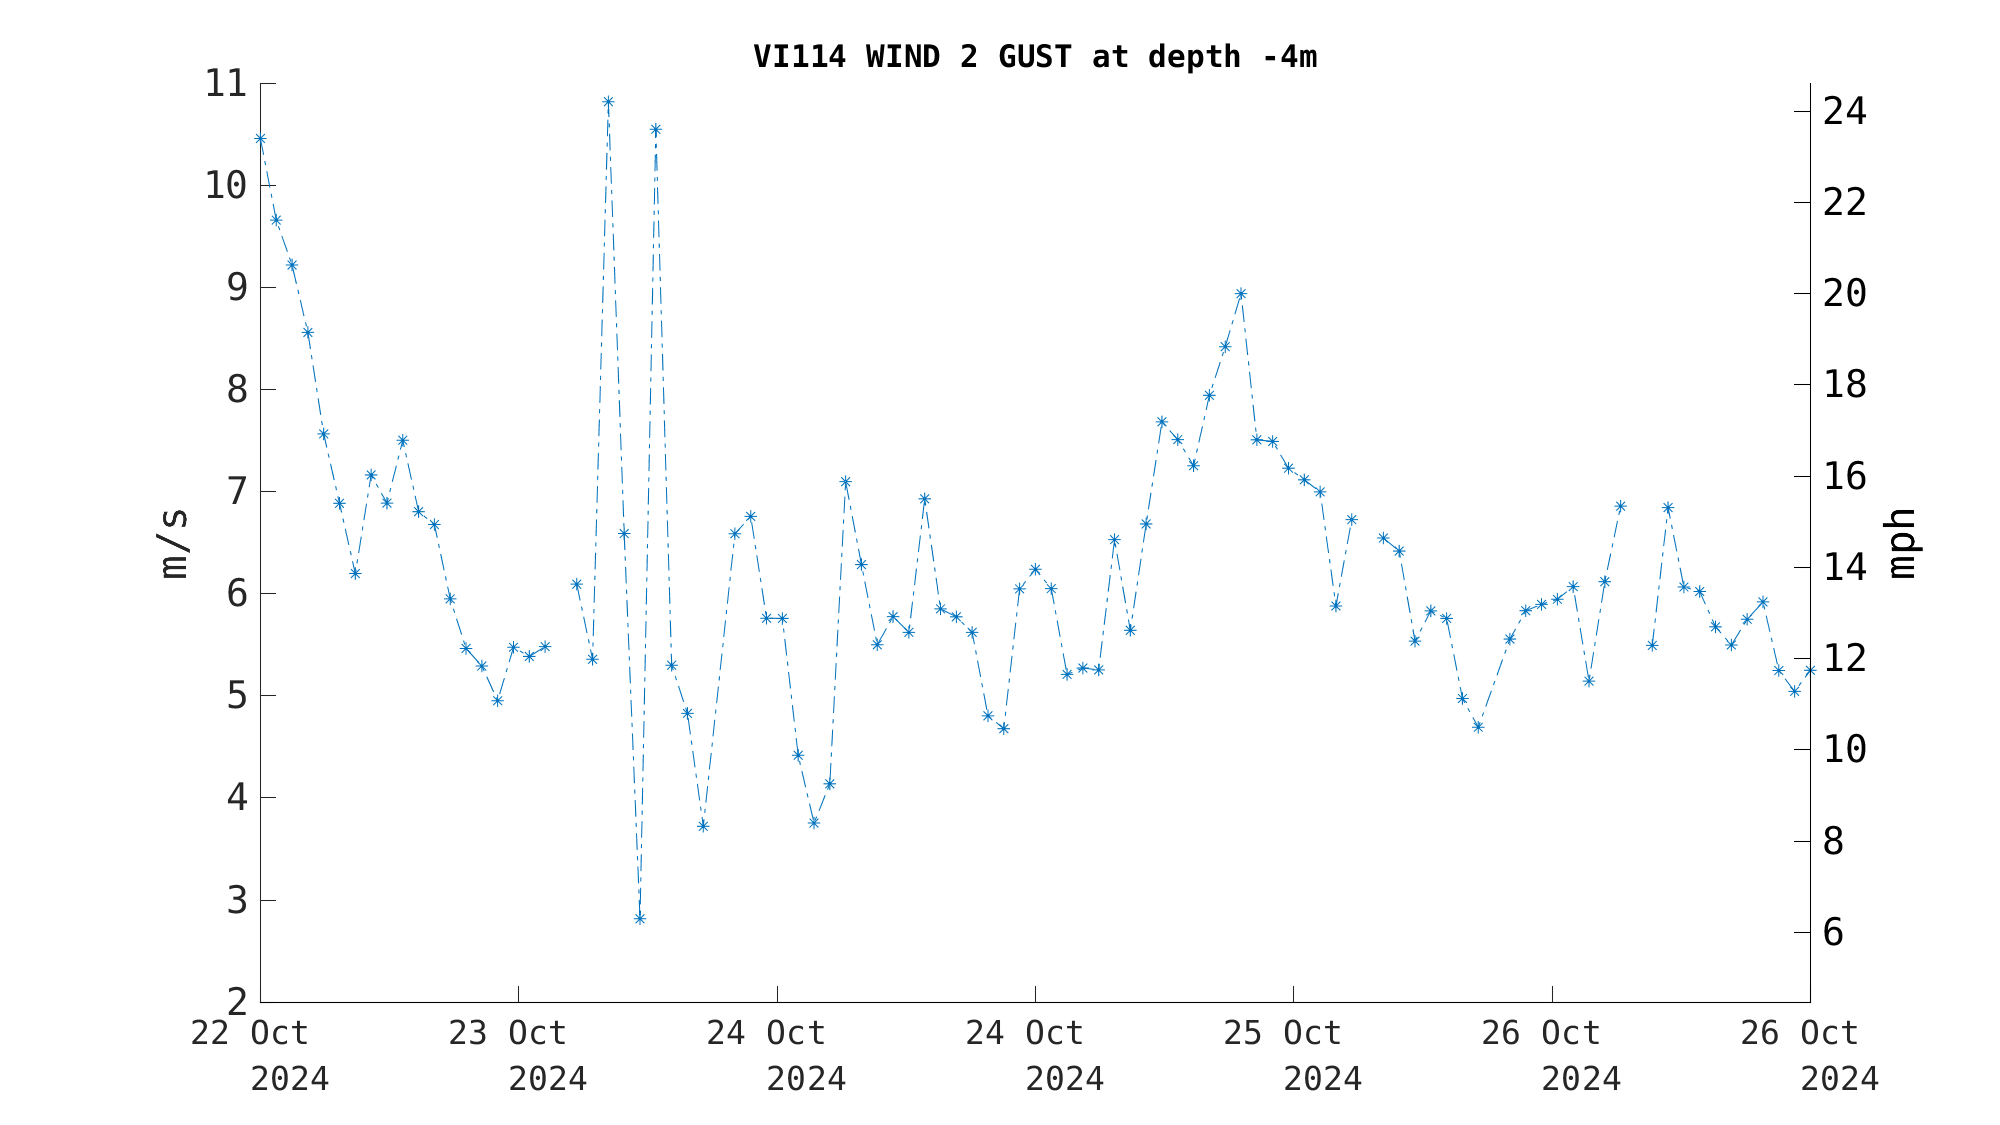
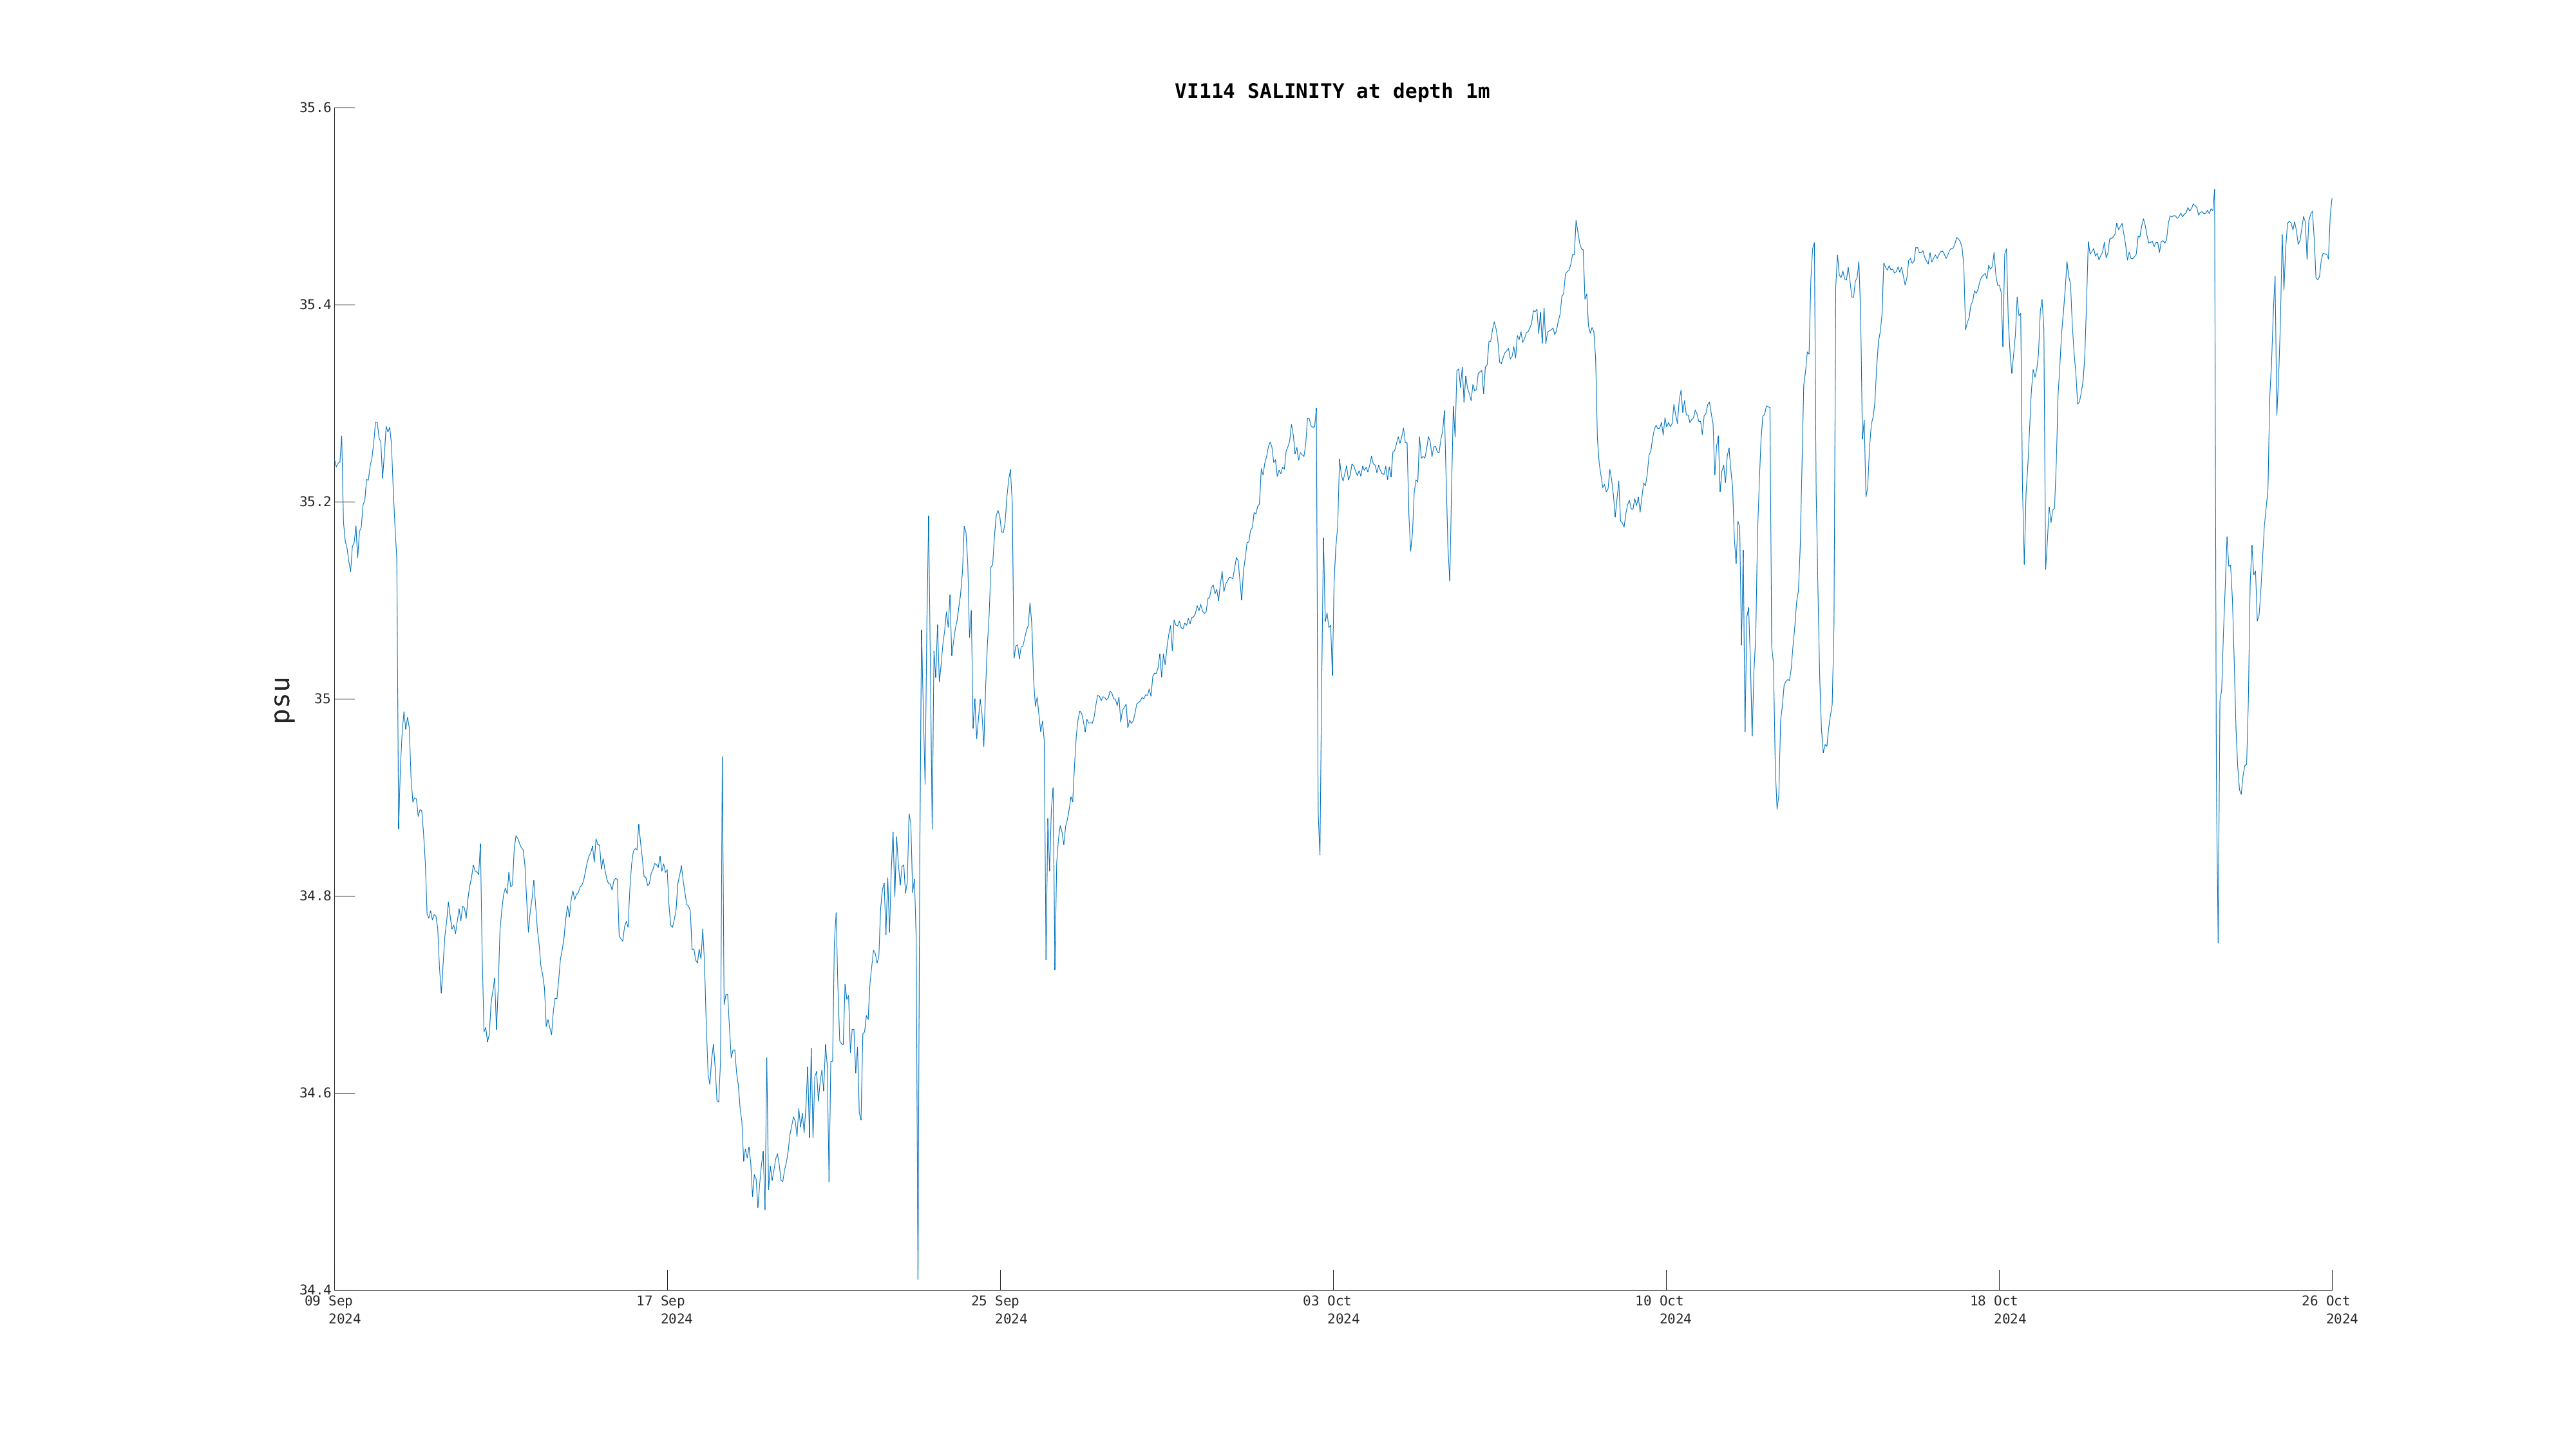
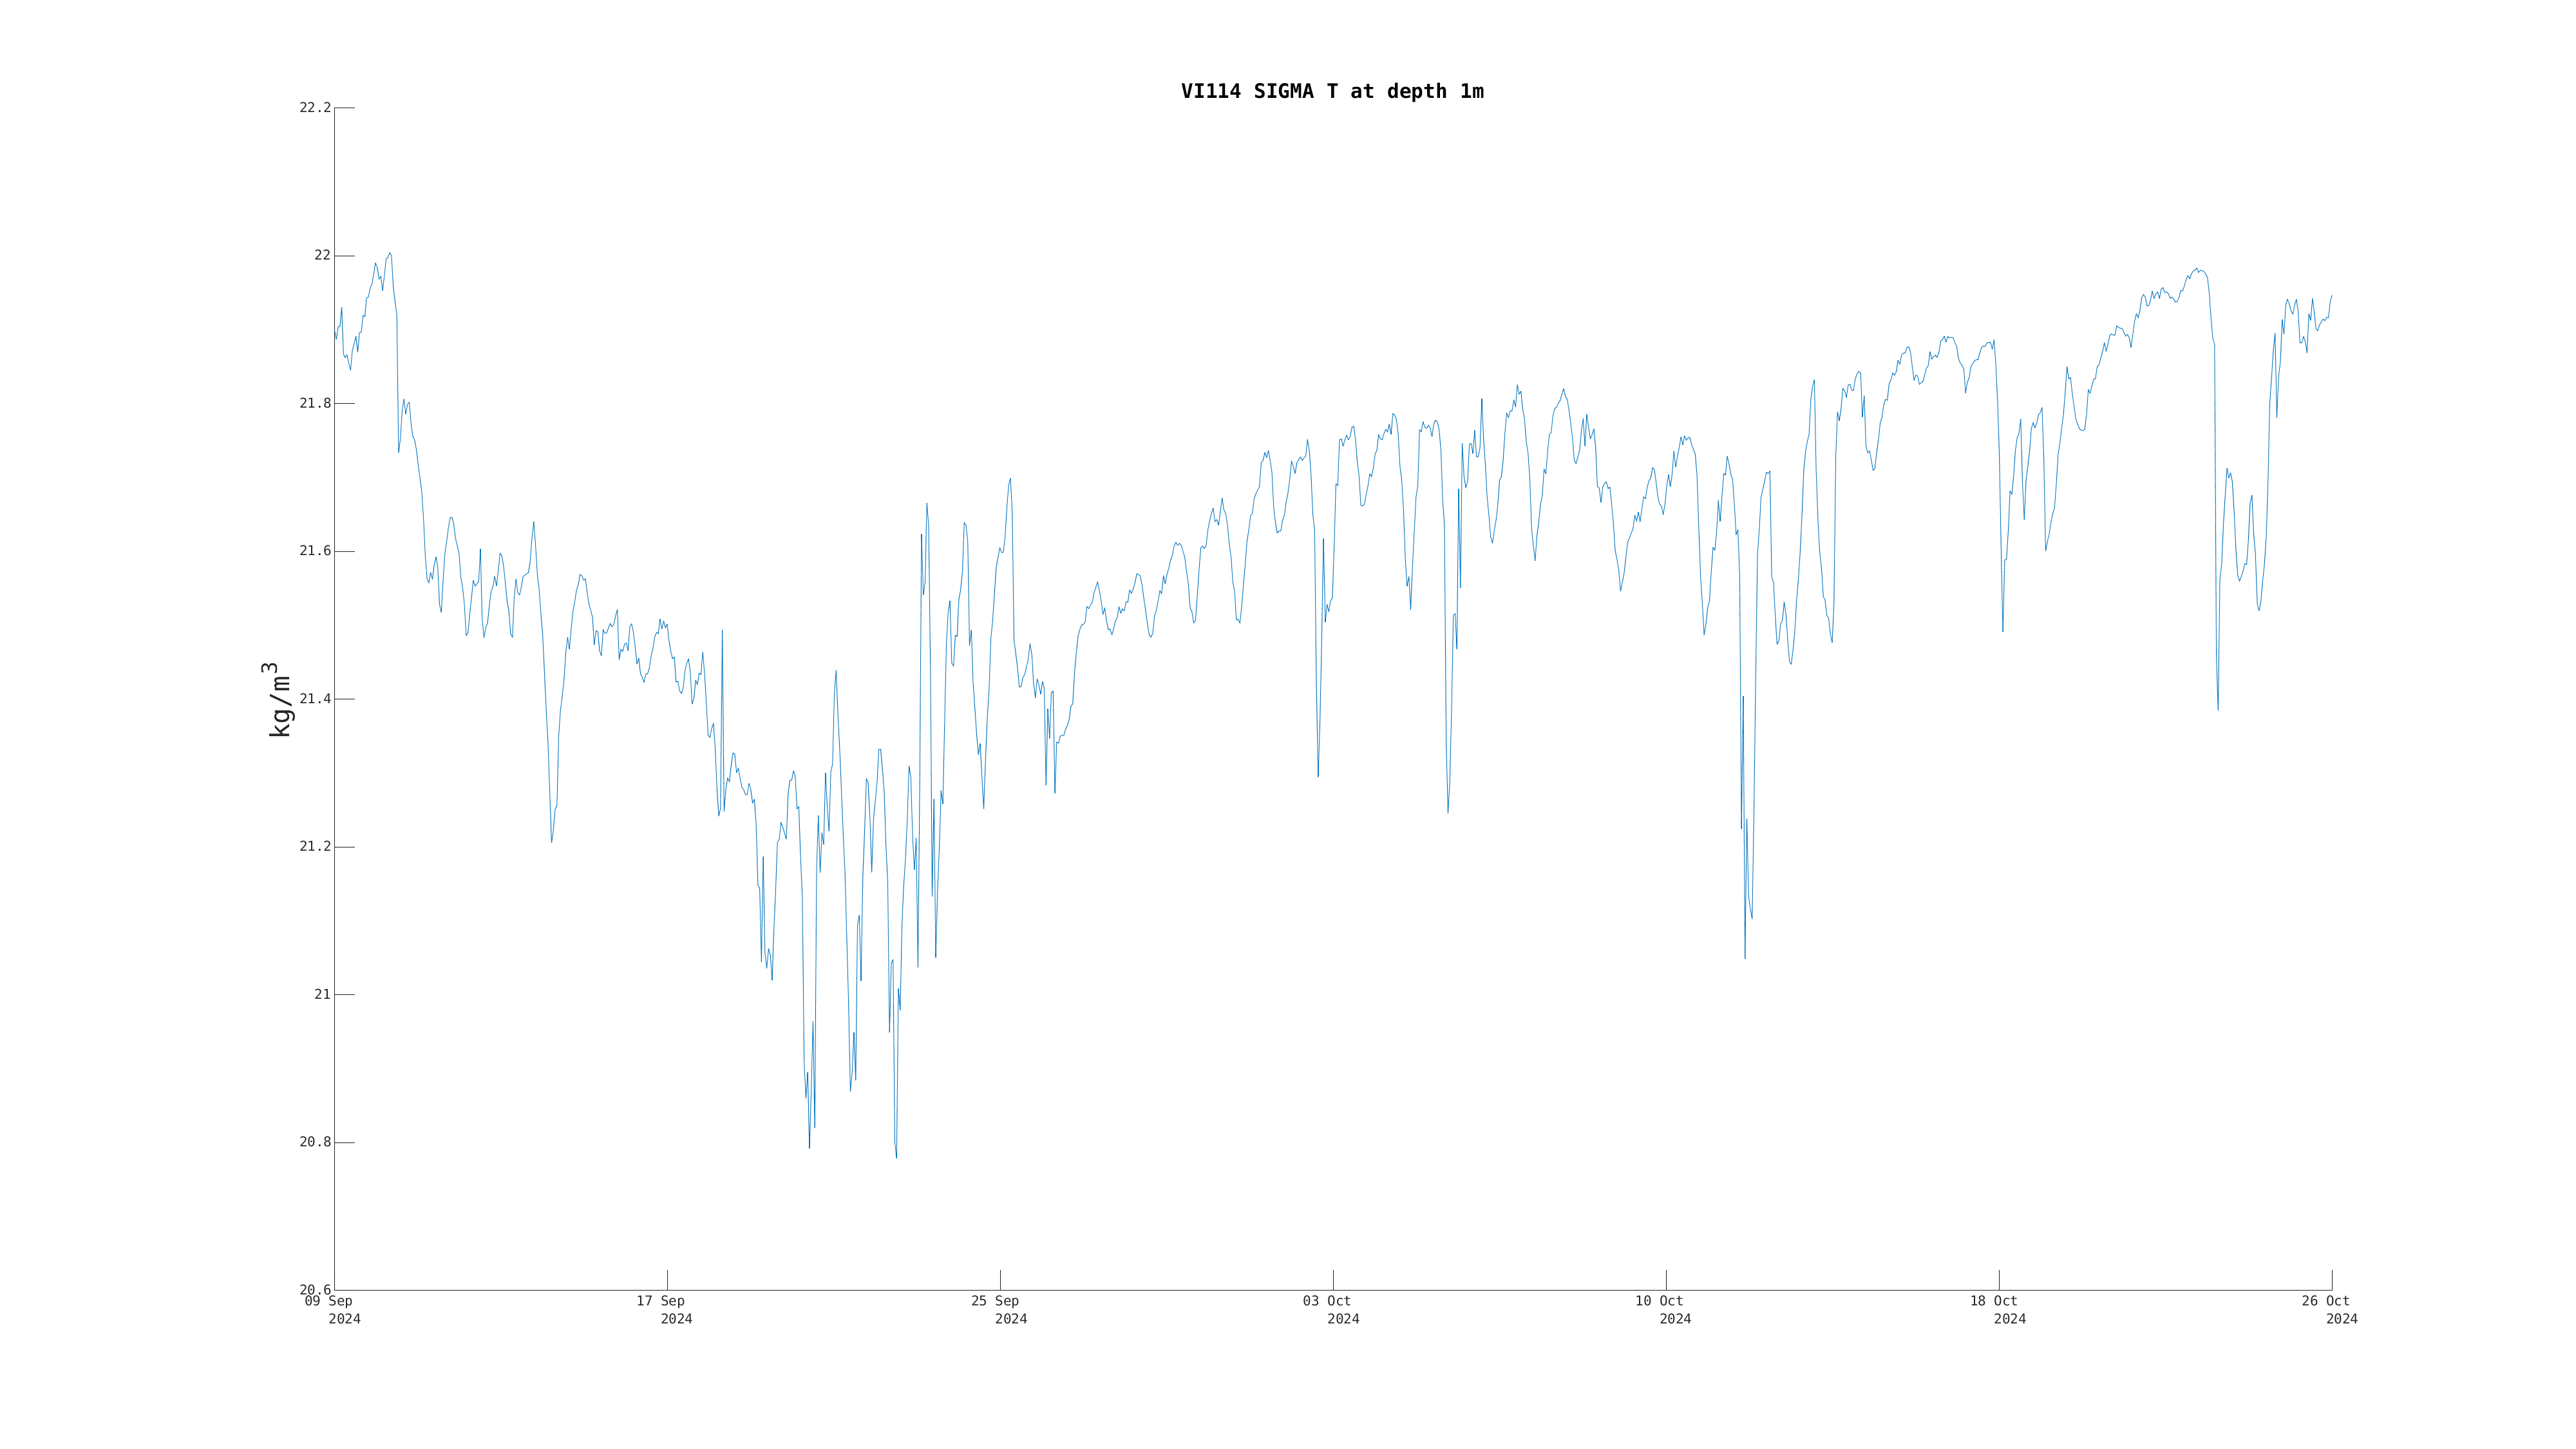
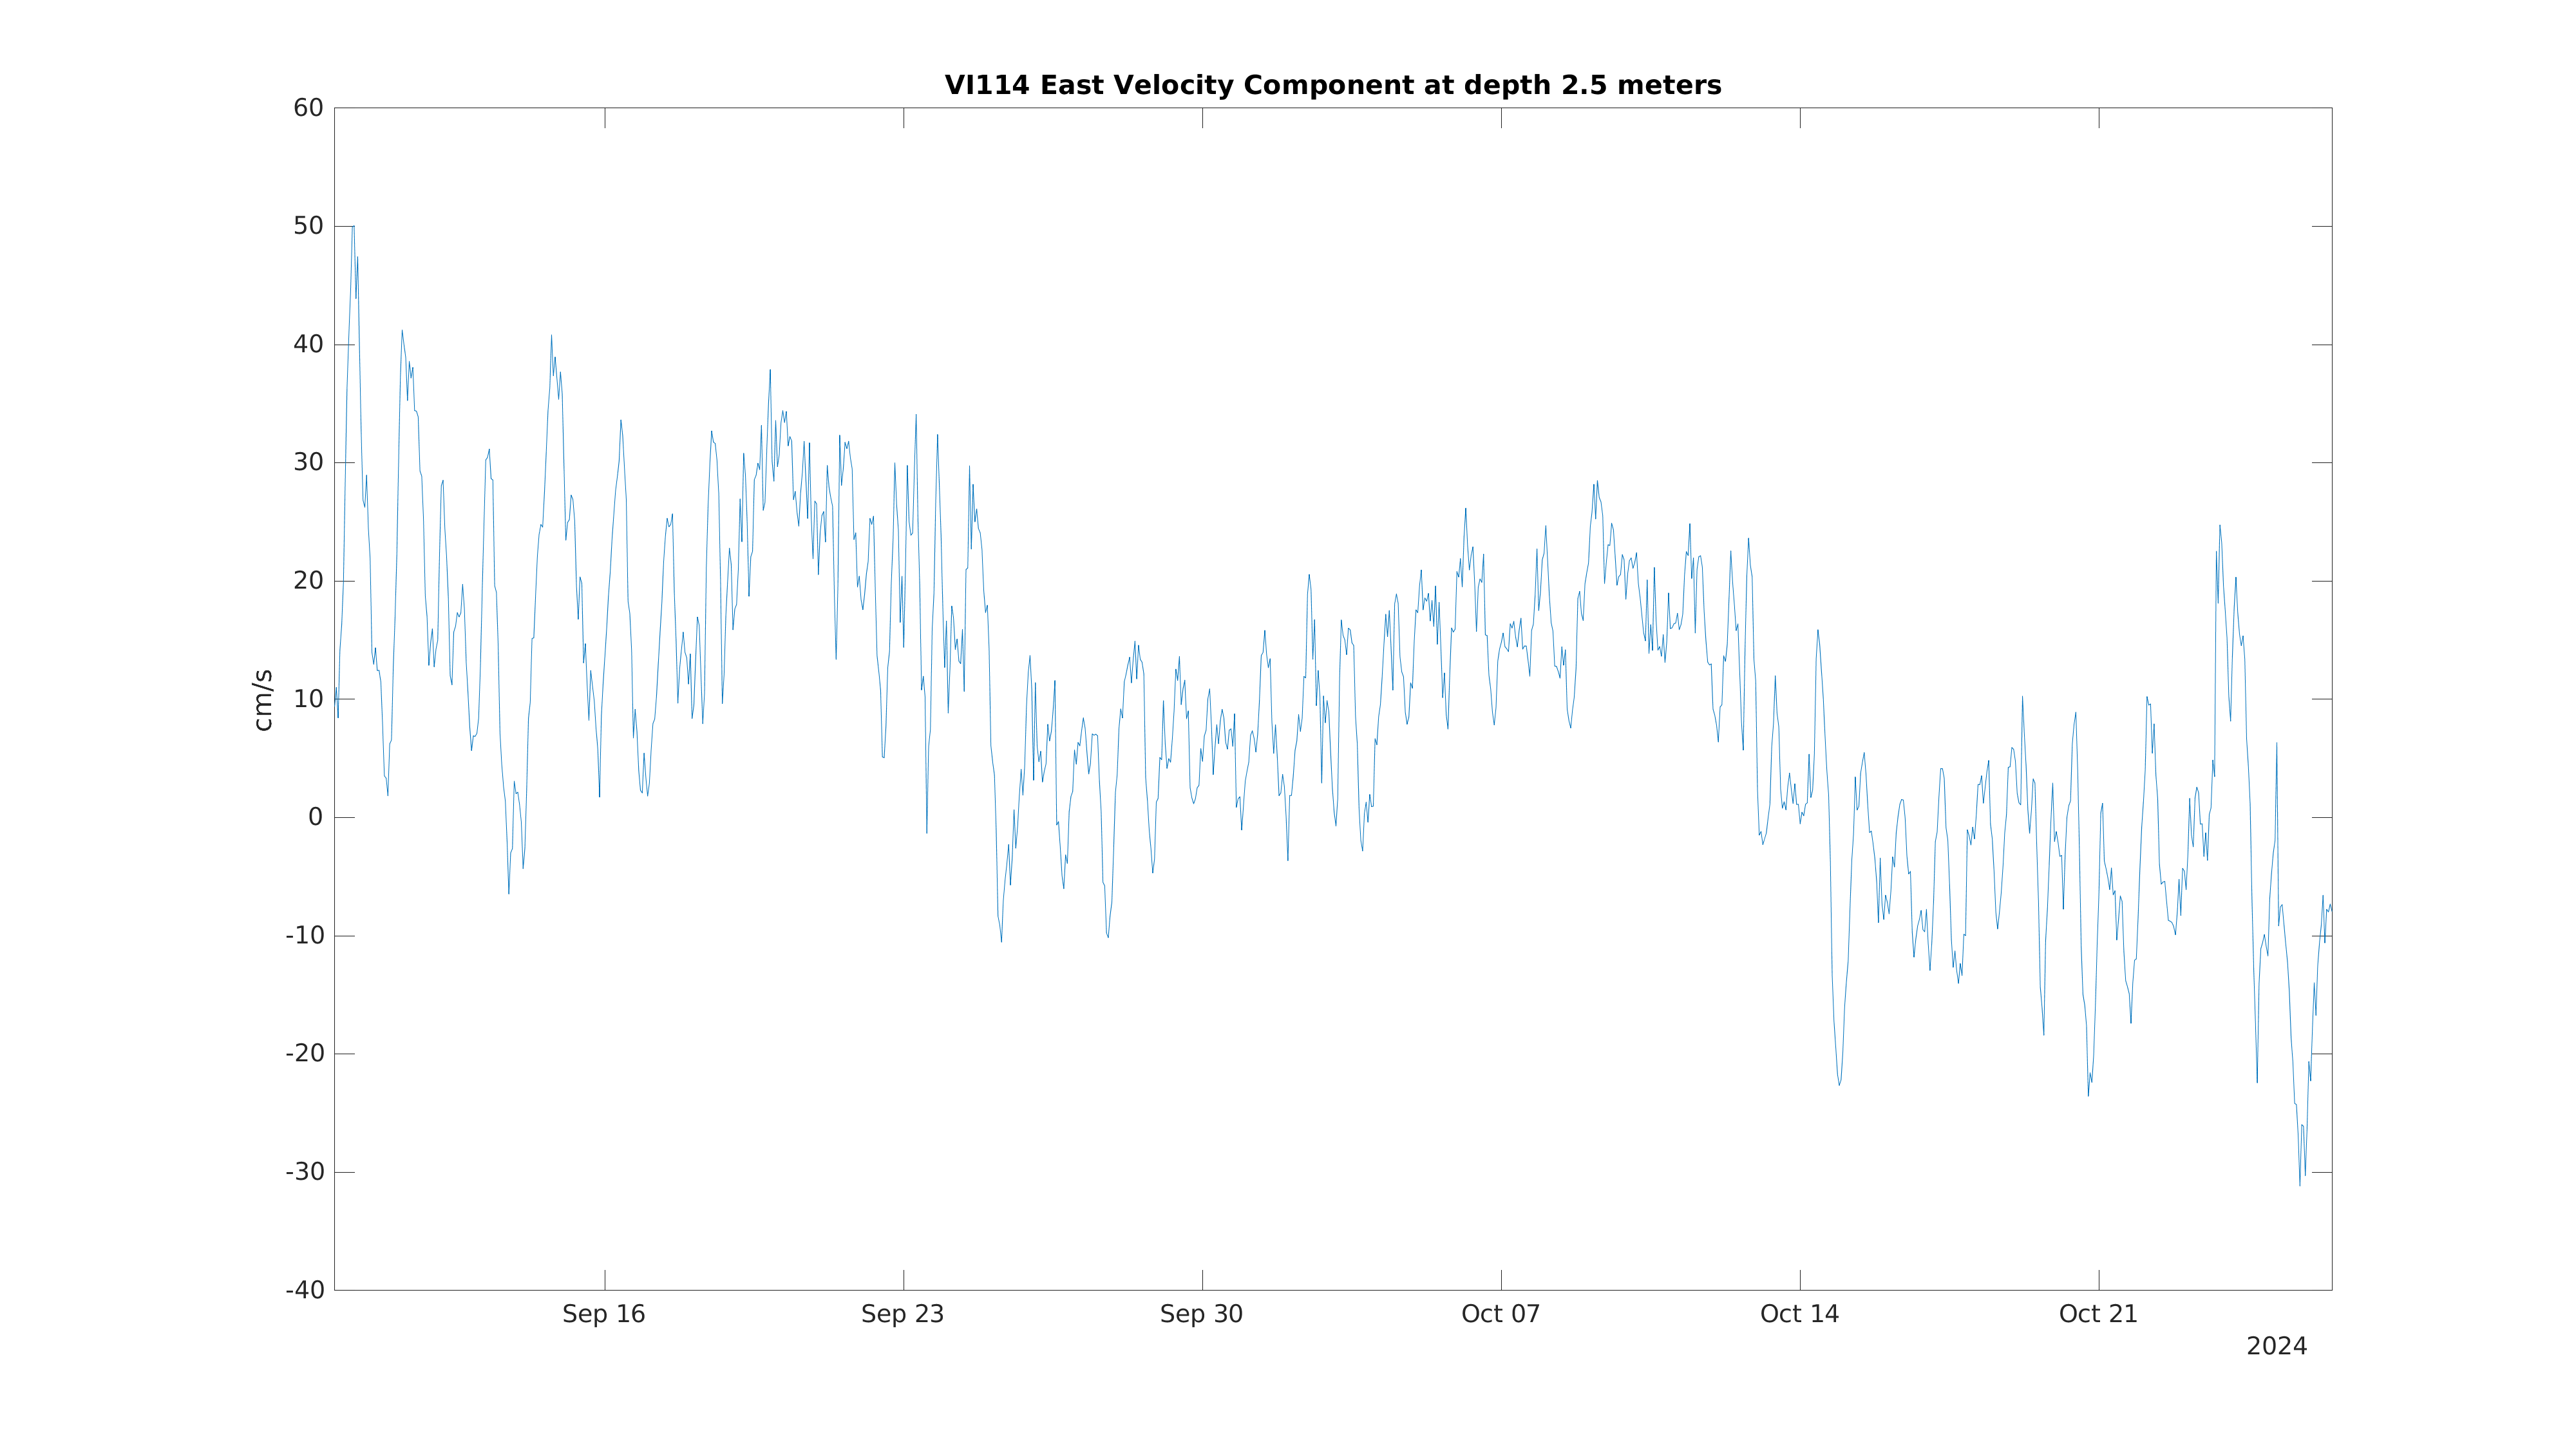


 Latest Month's:
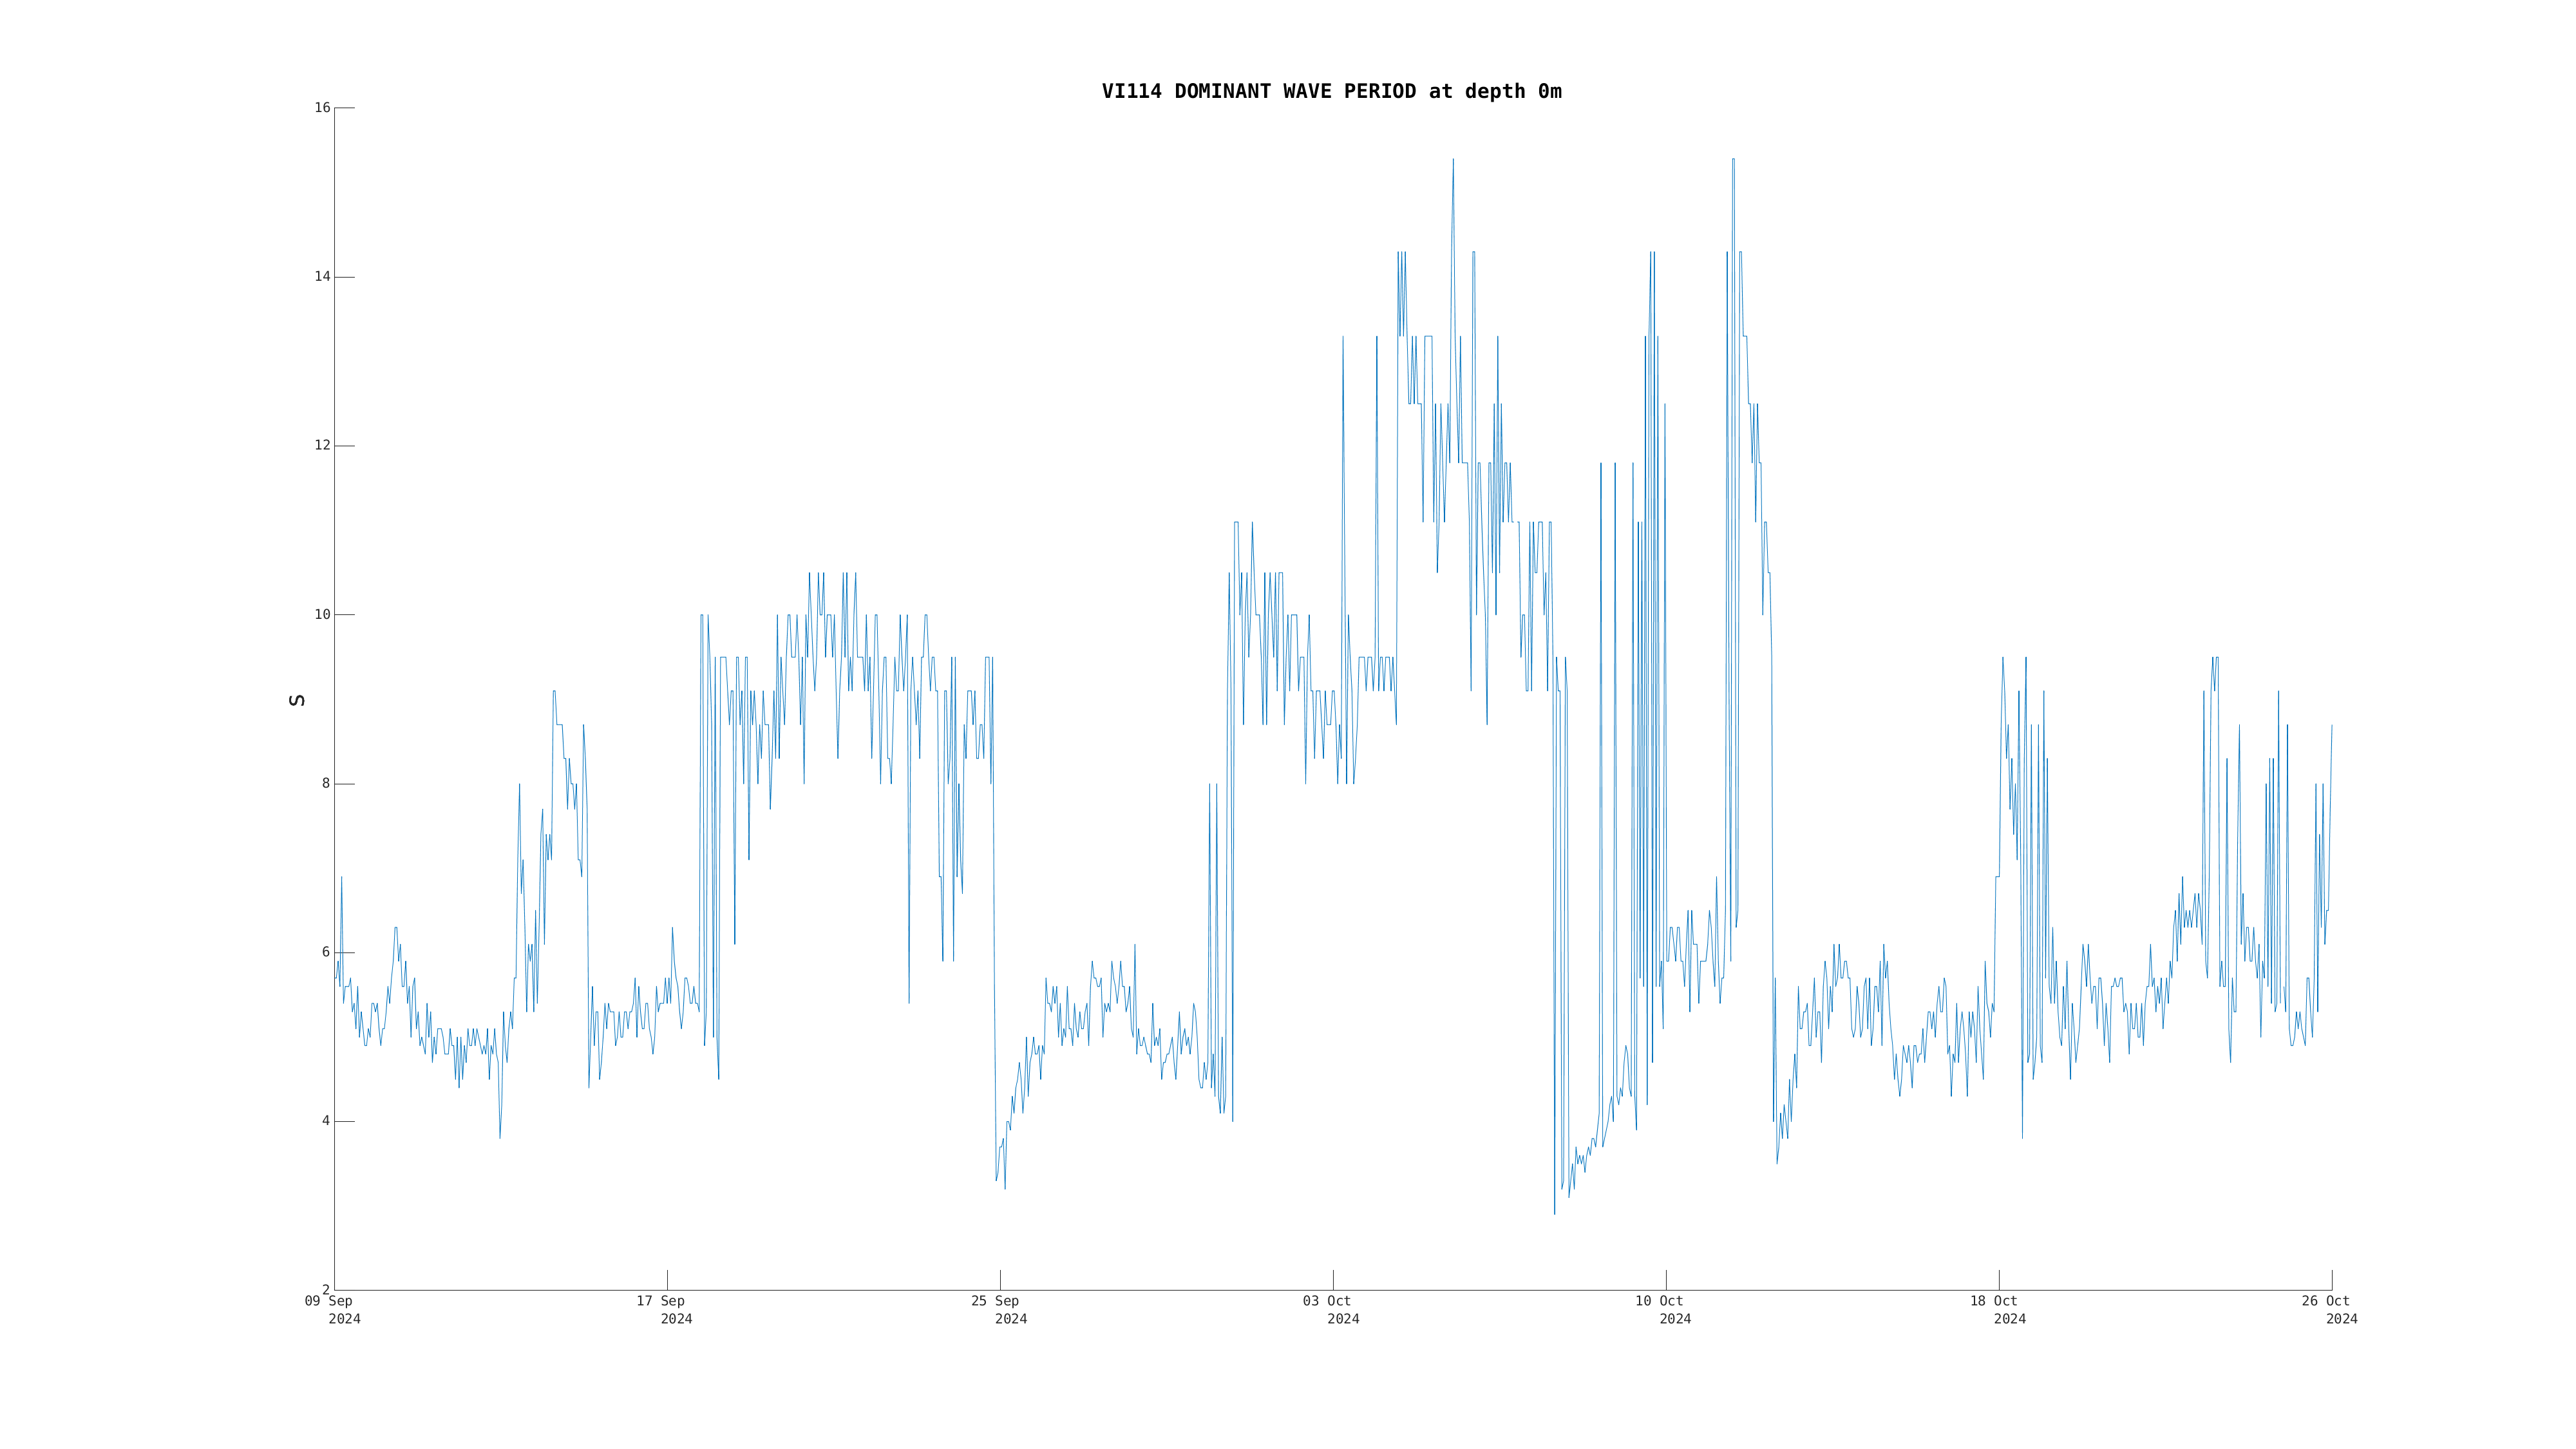
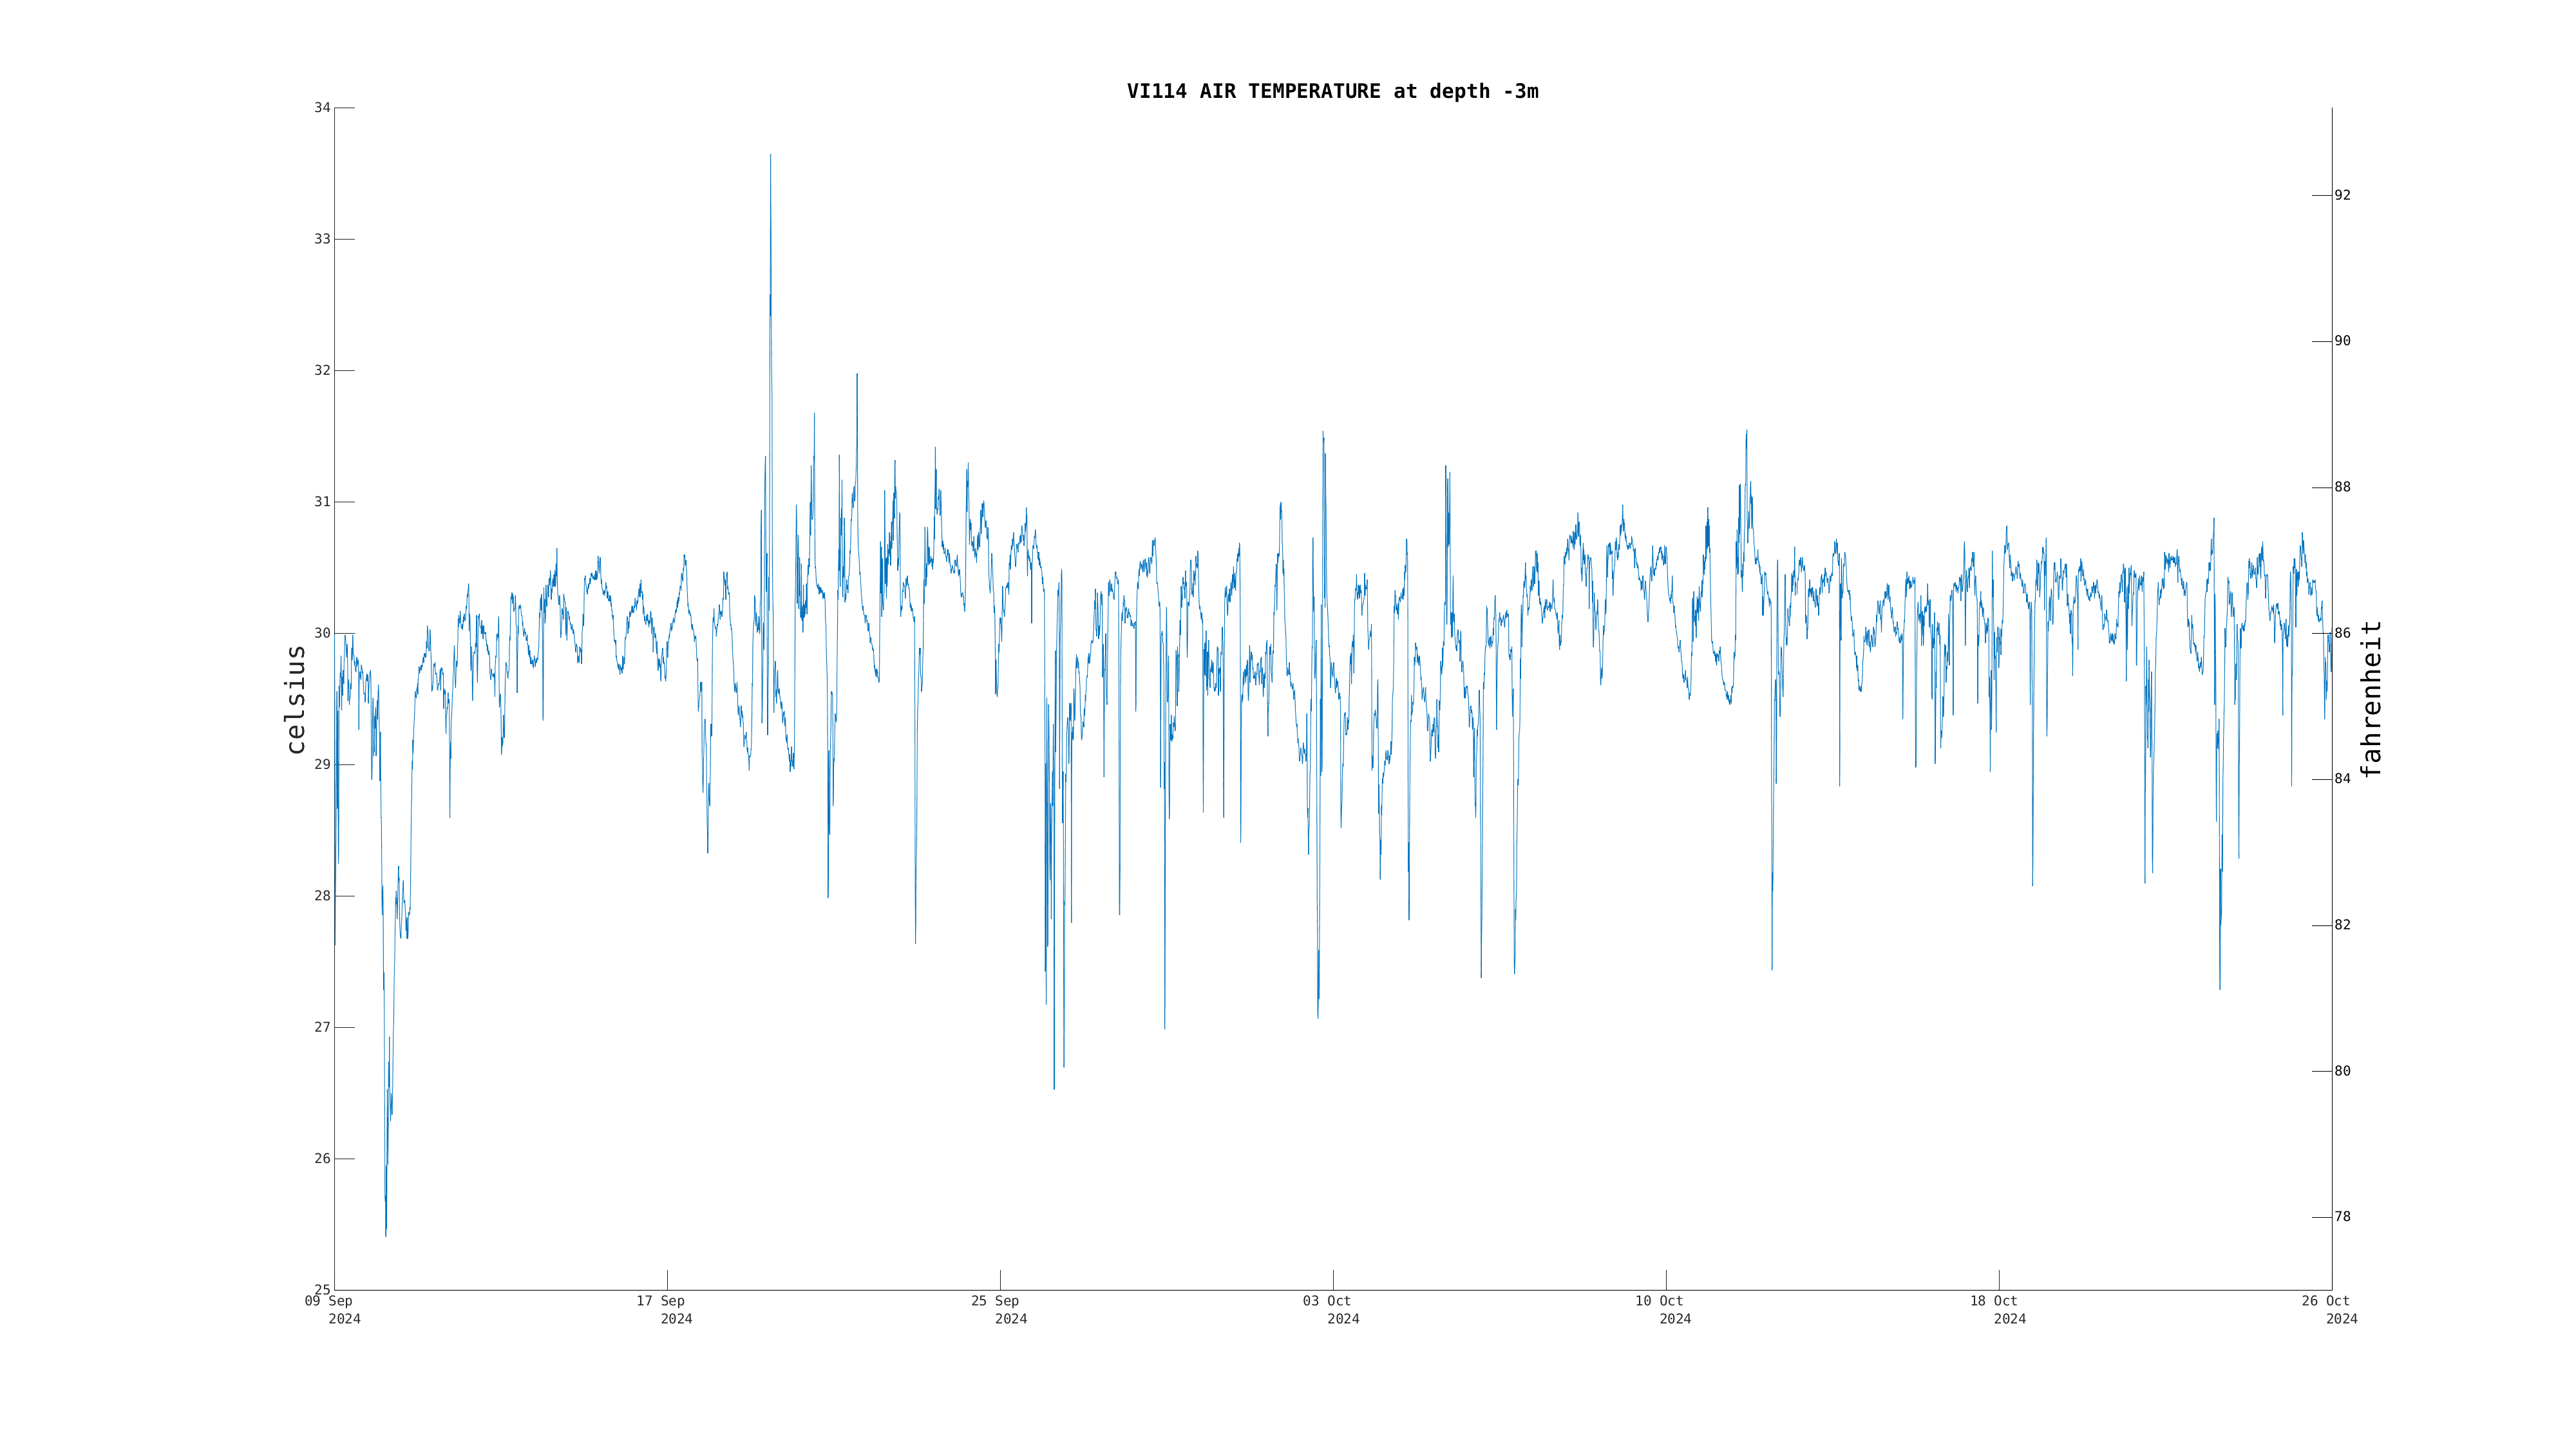
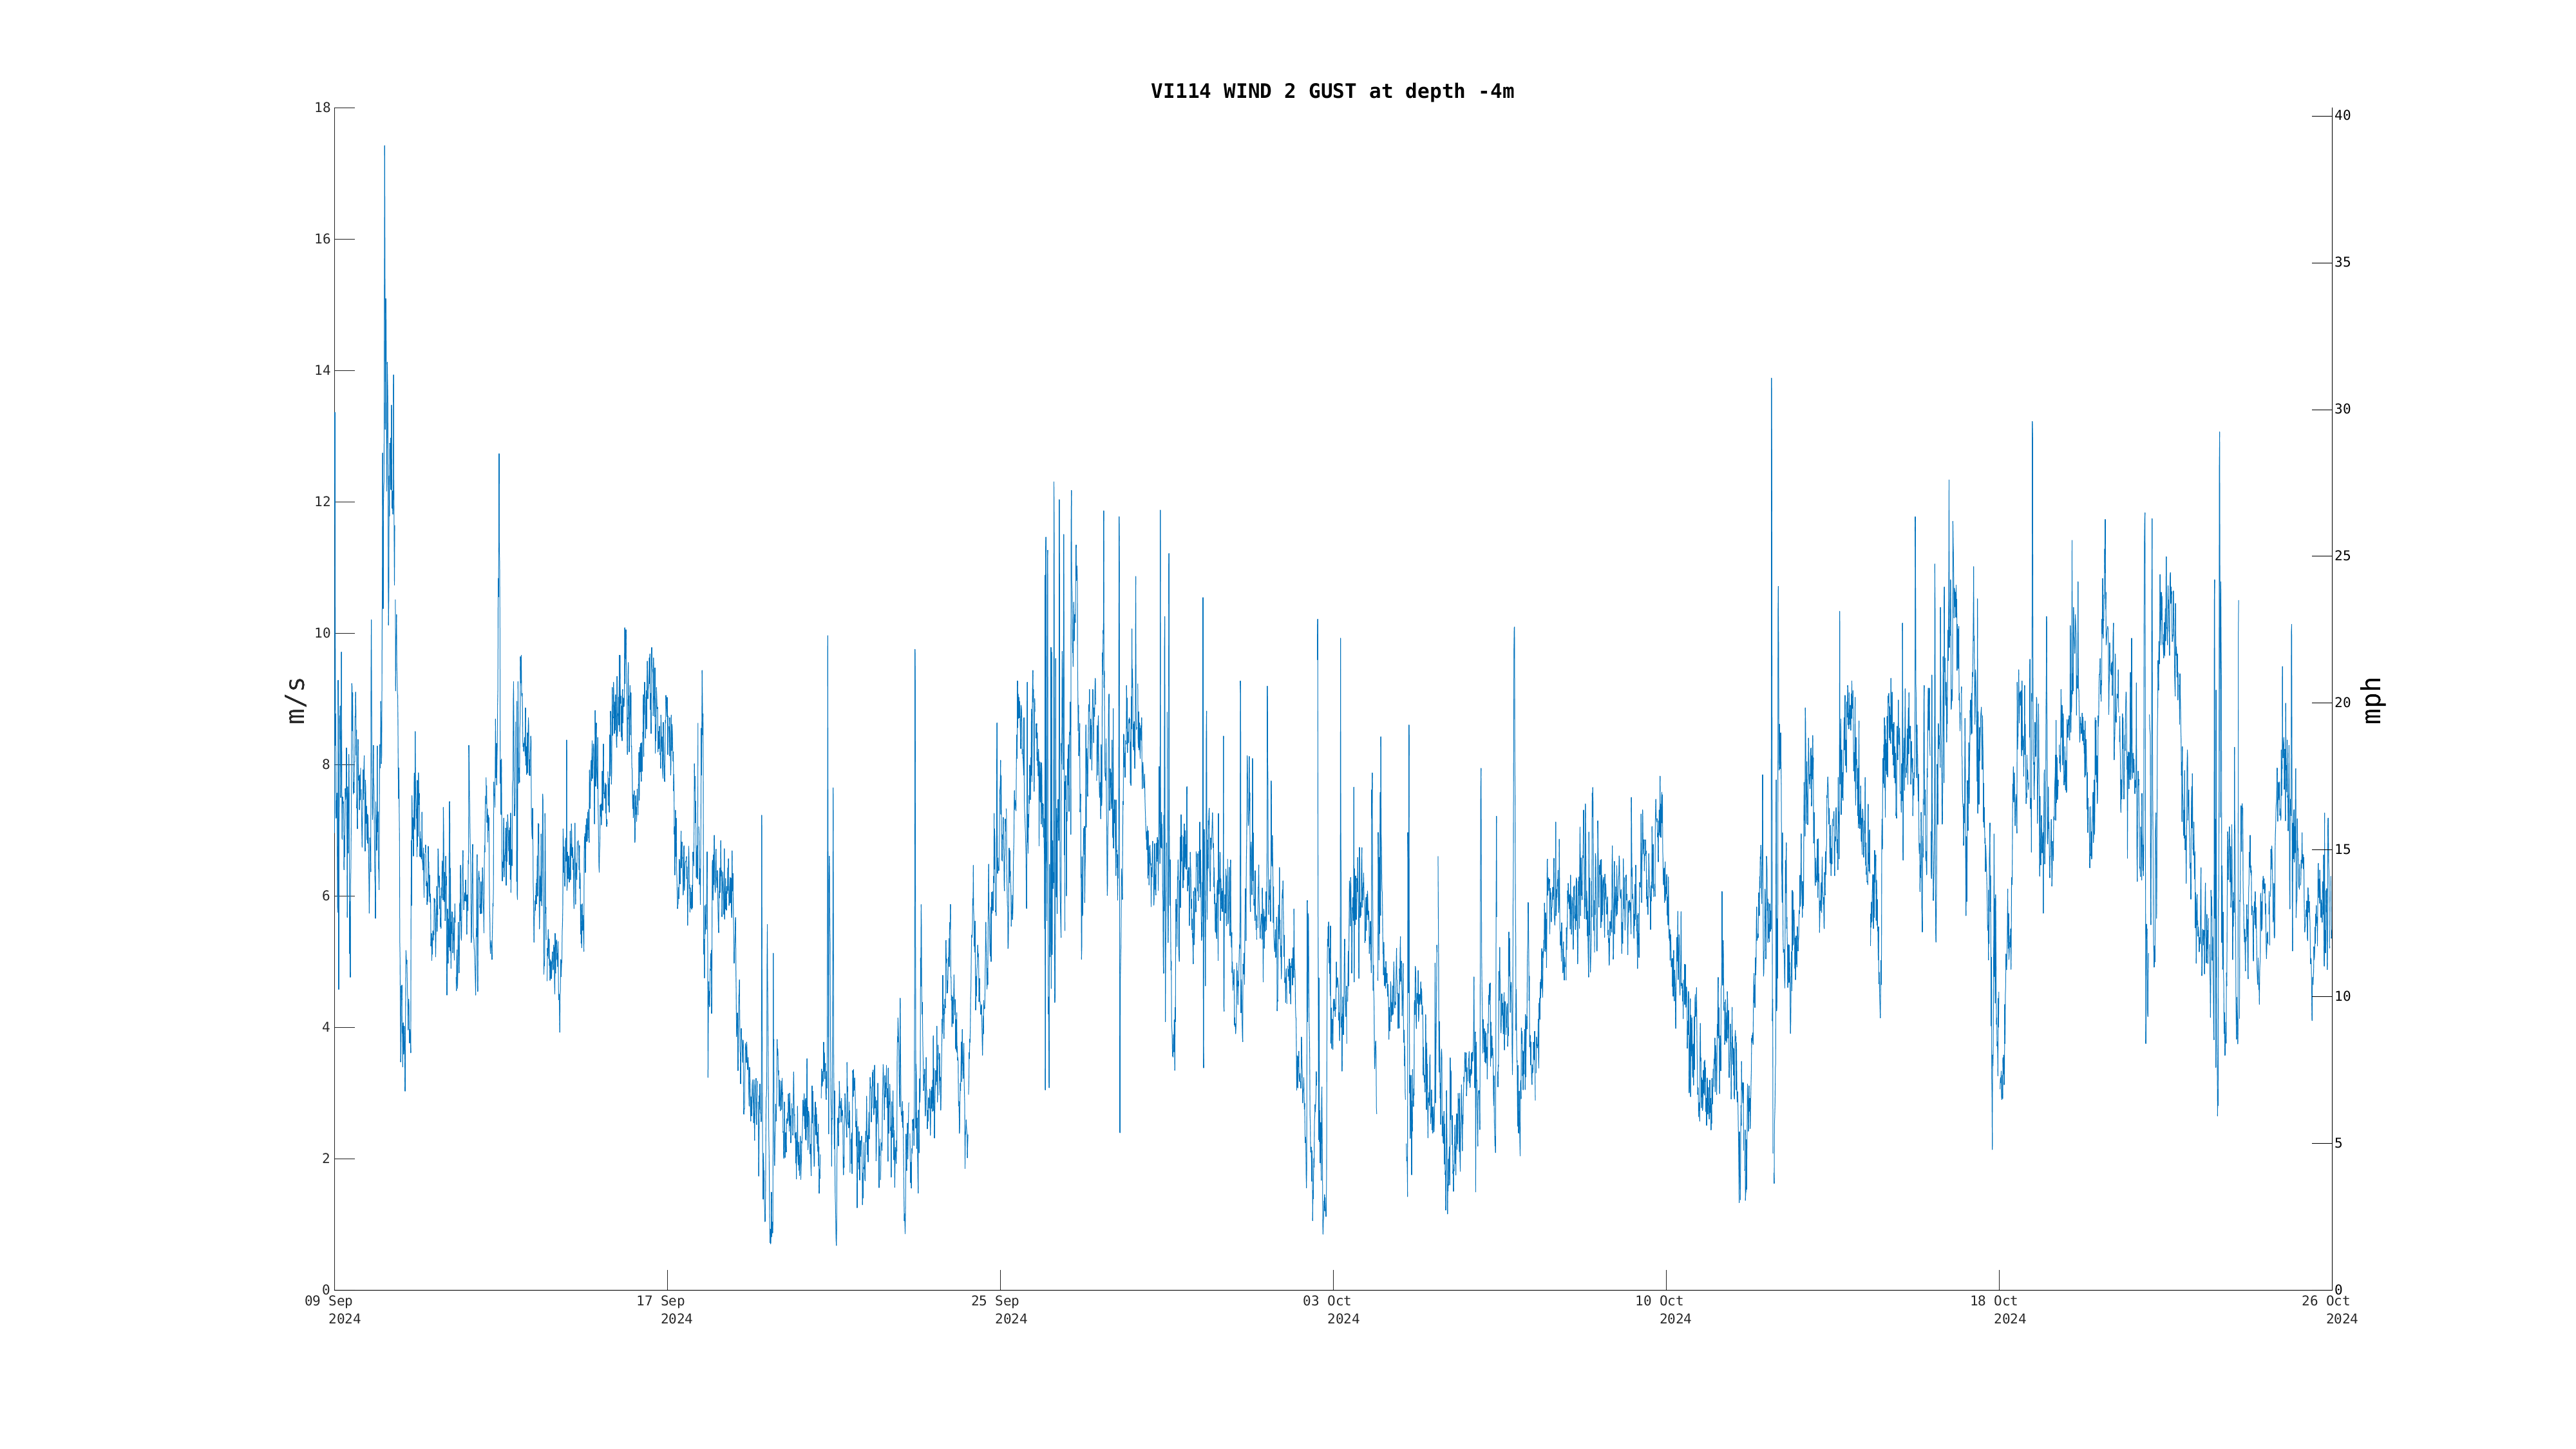
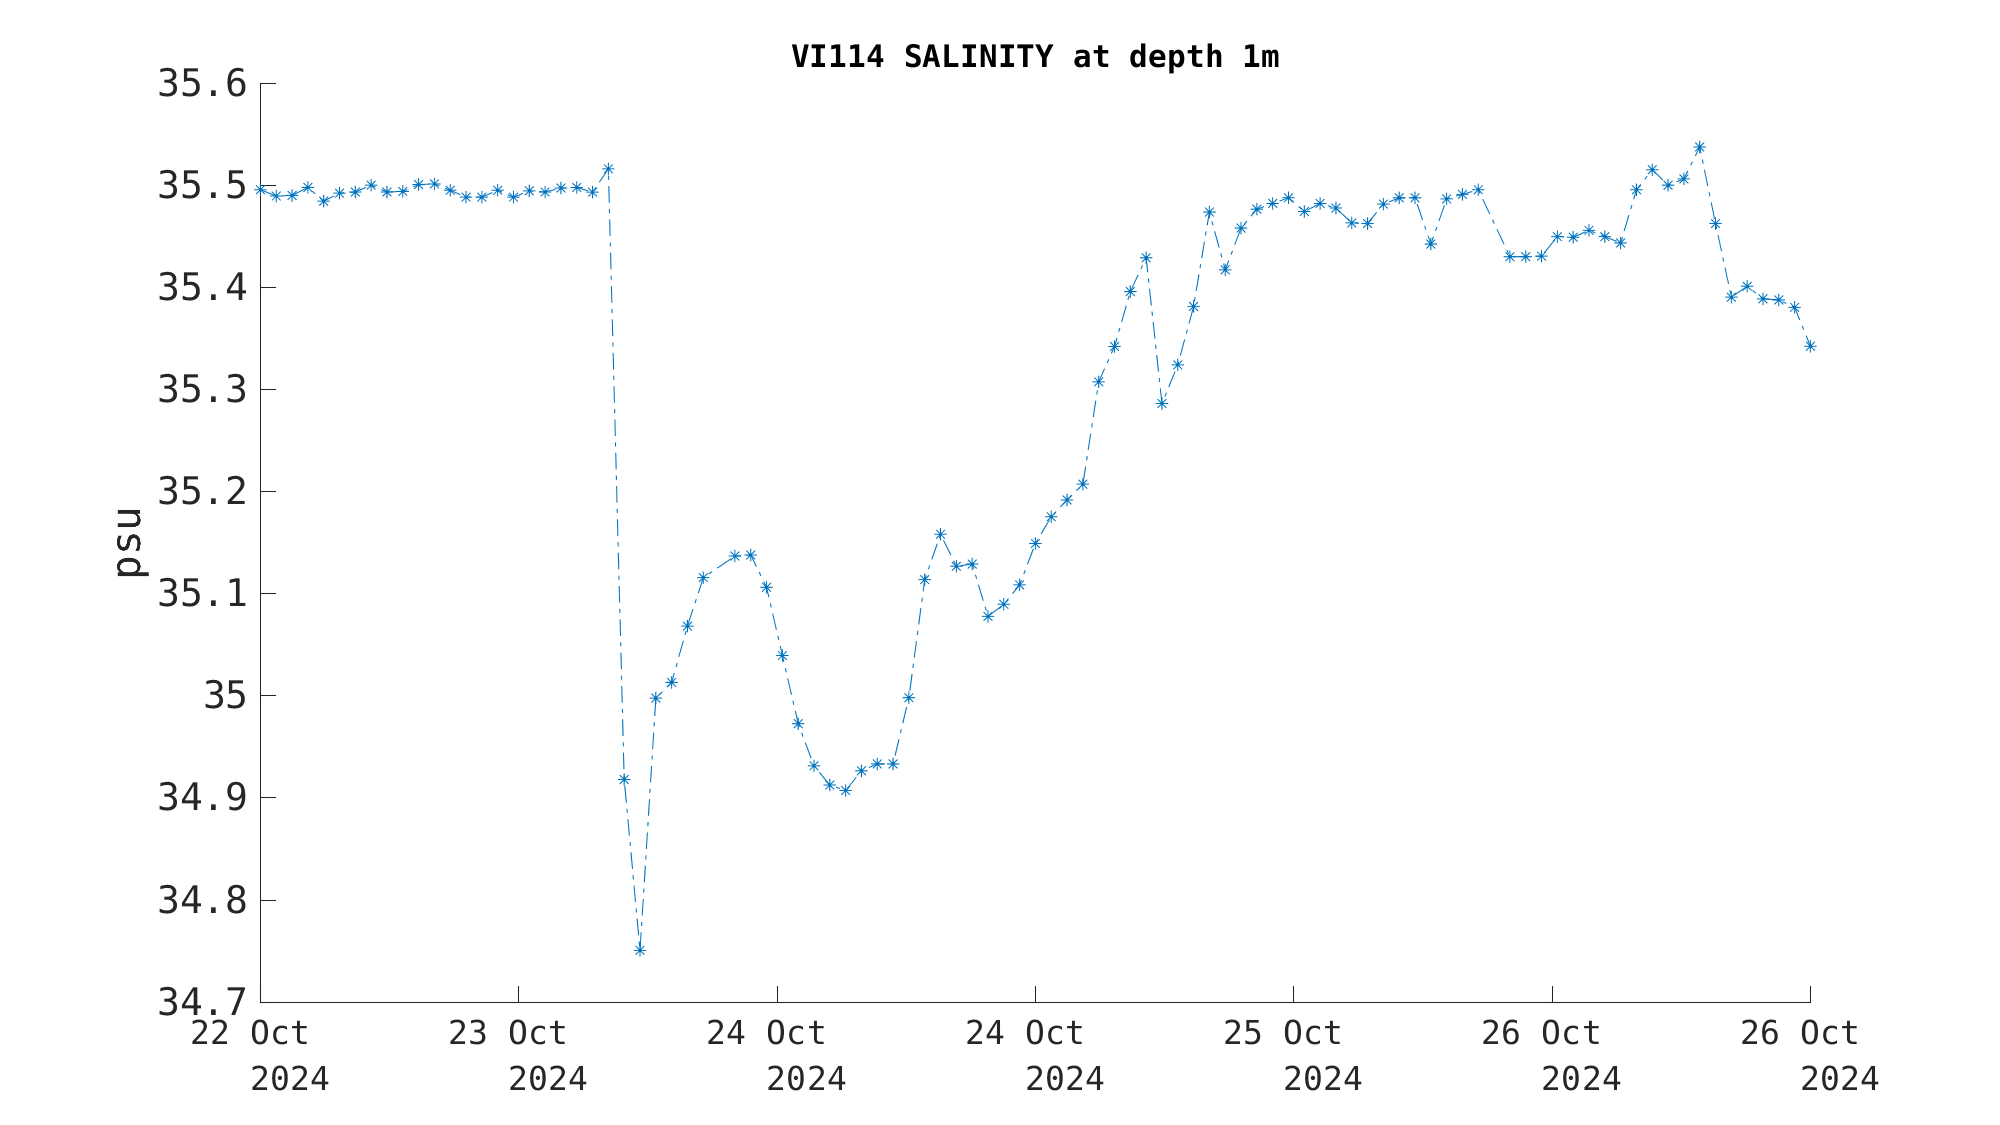
 This Deployment:
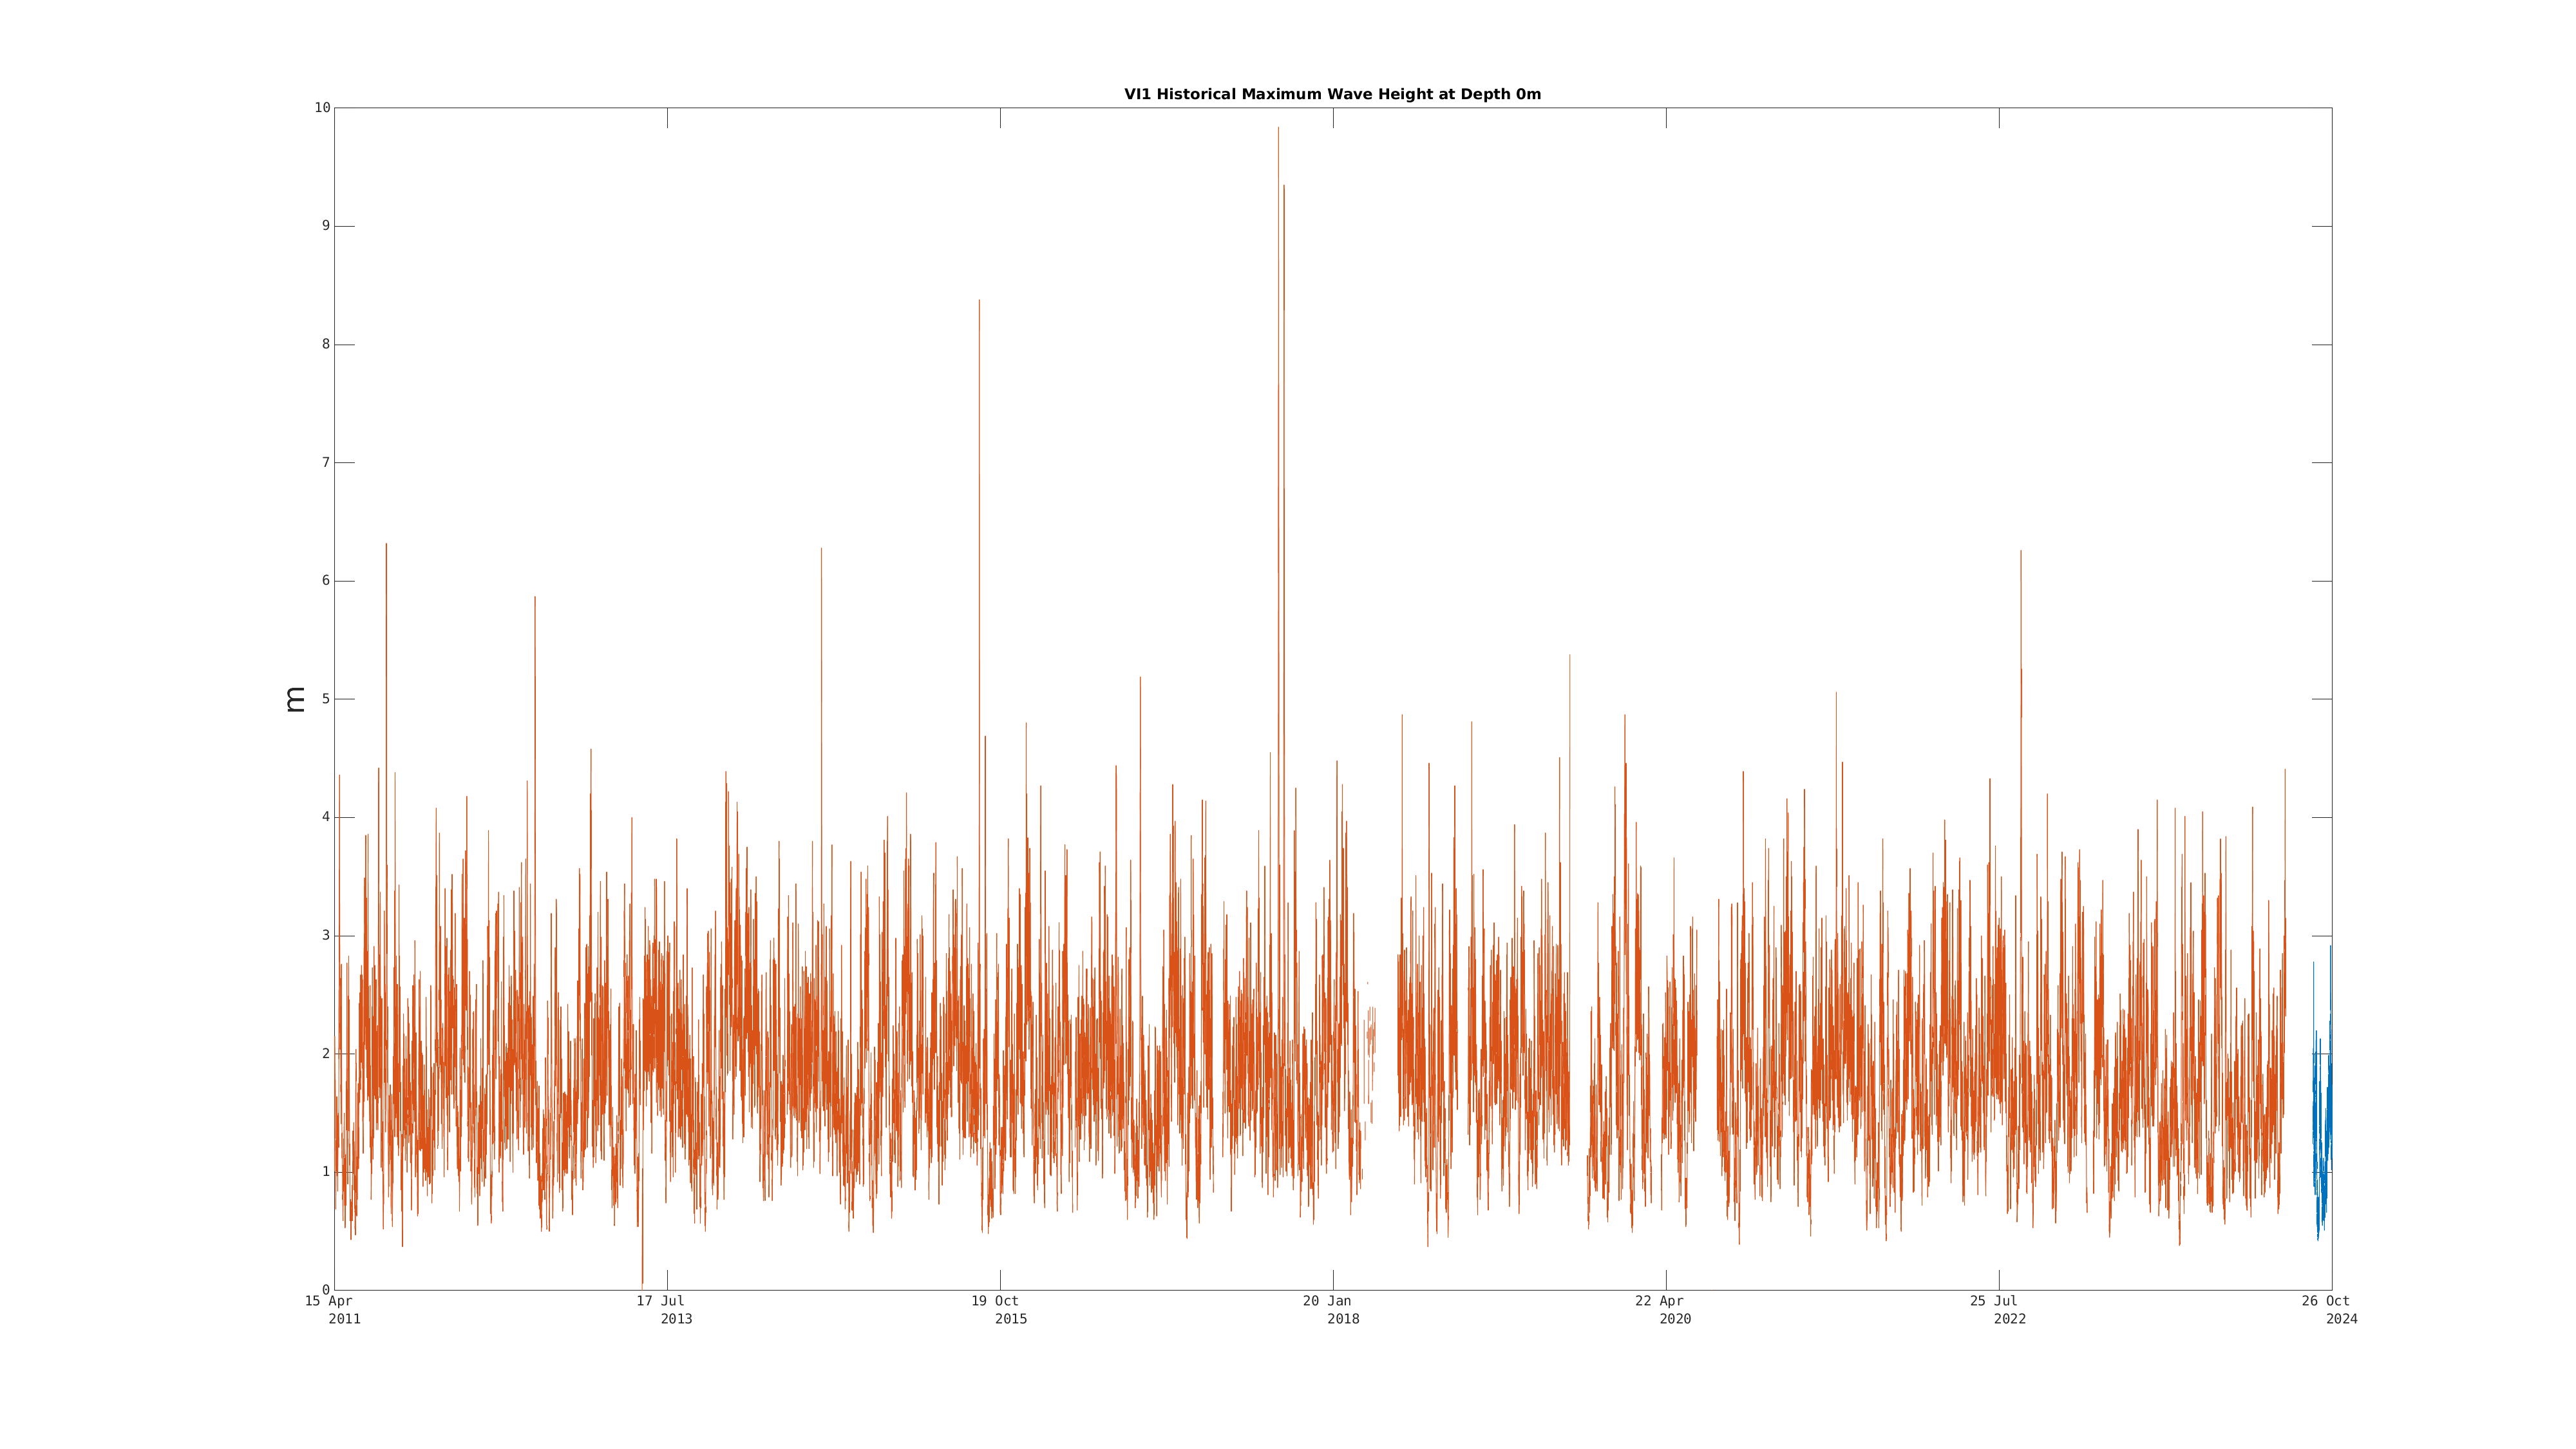
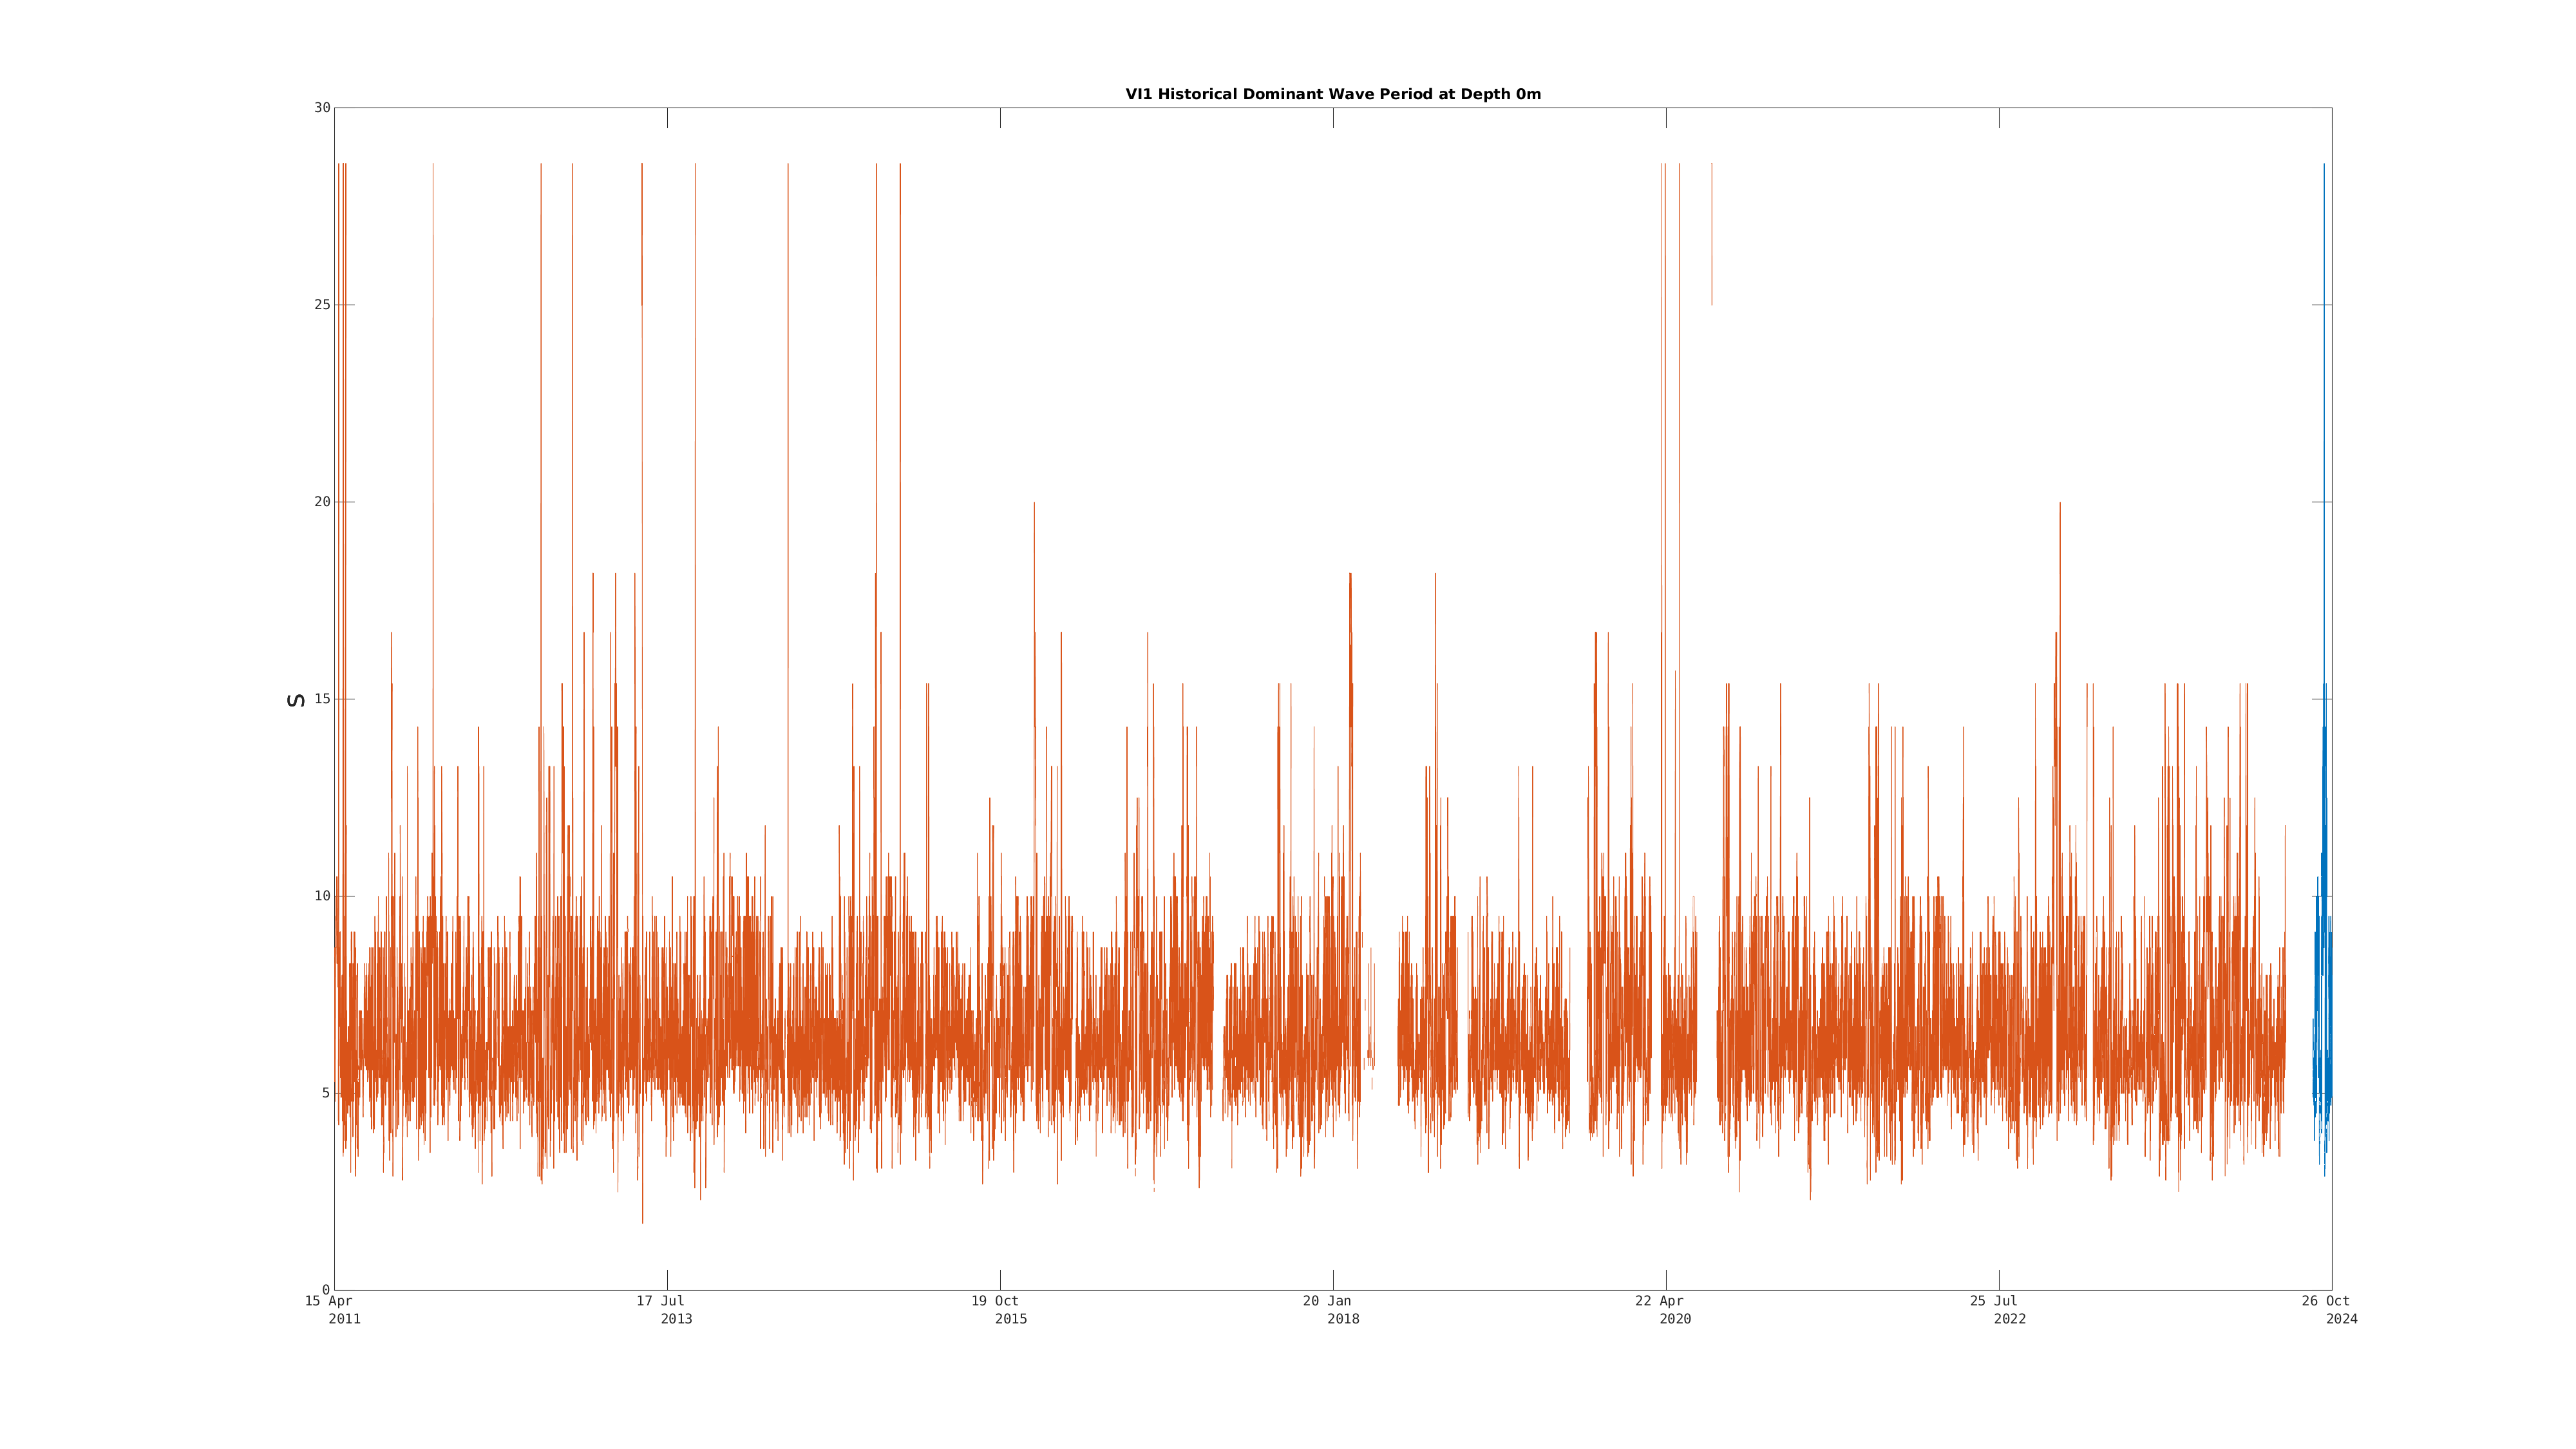
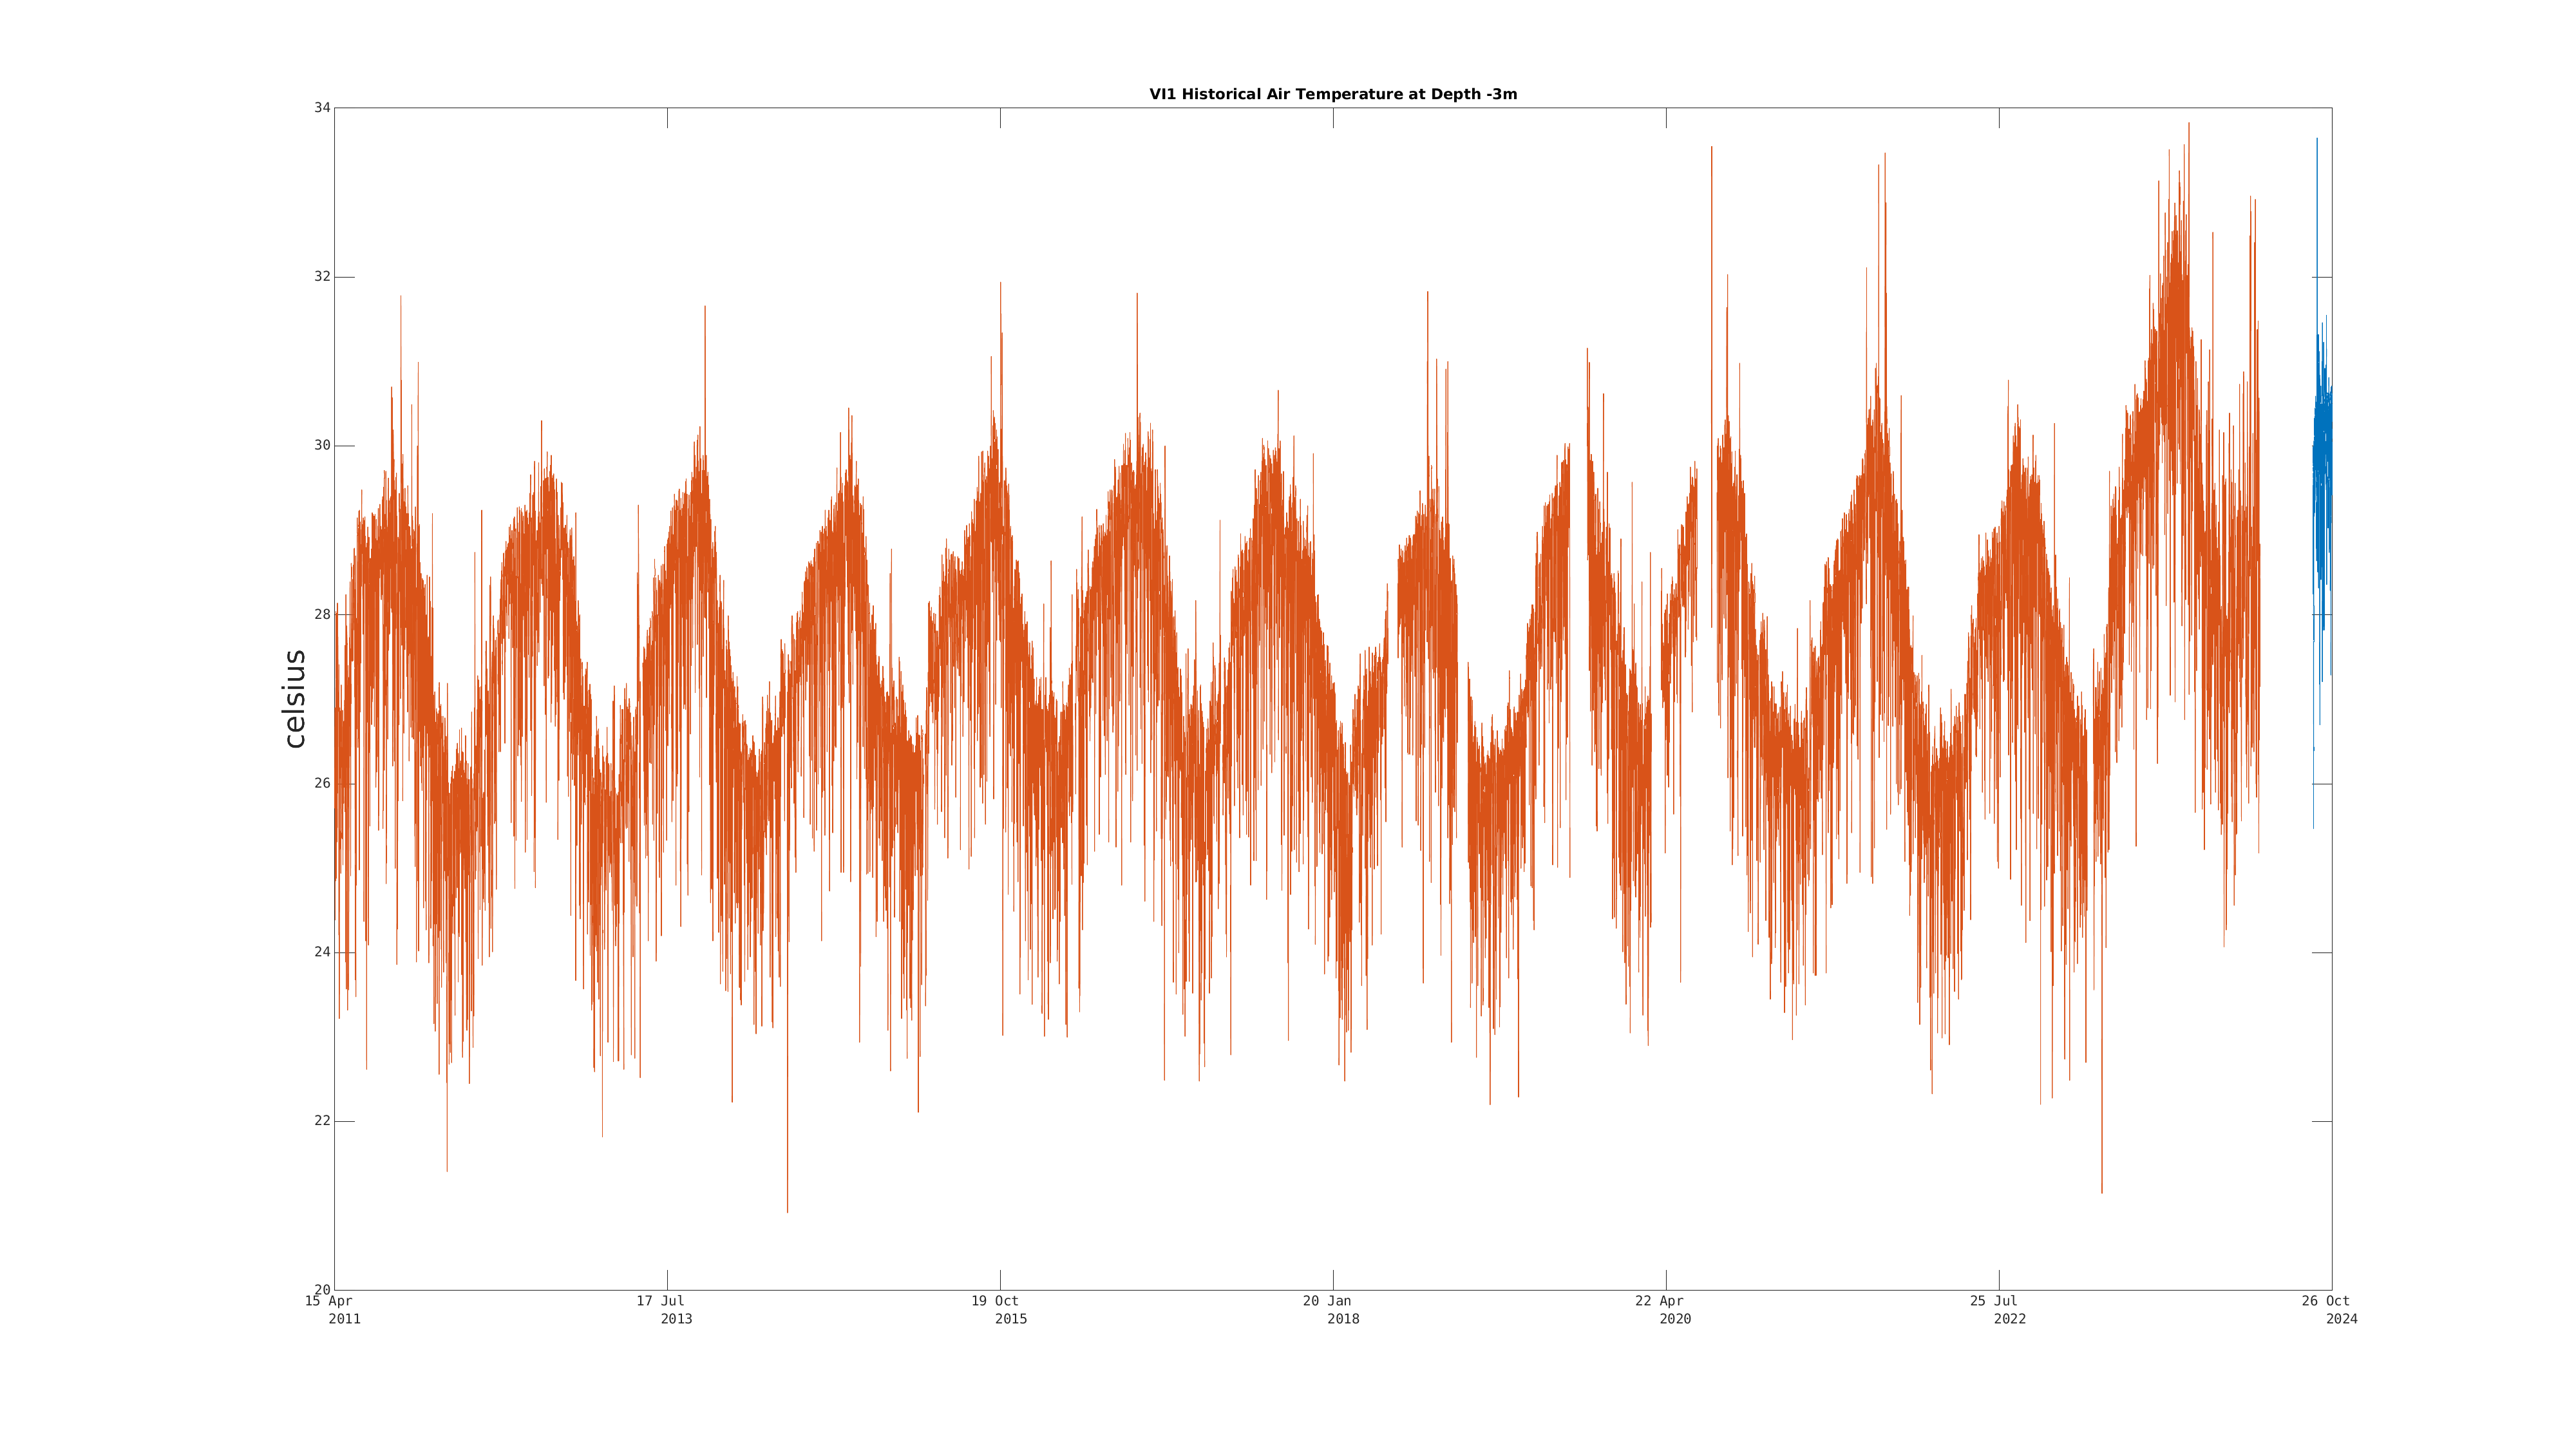
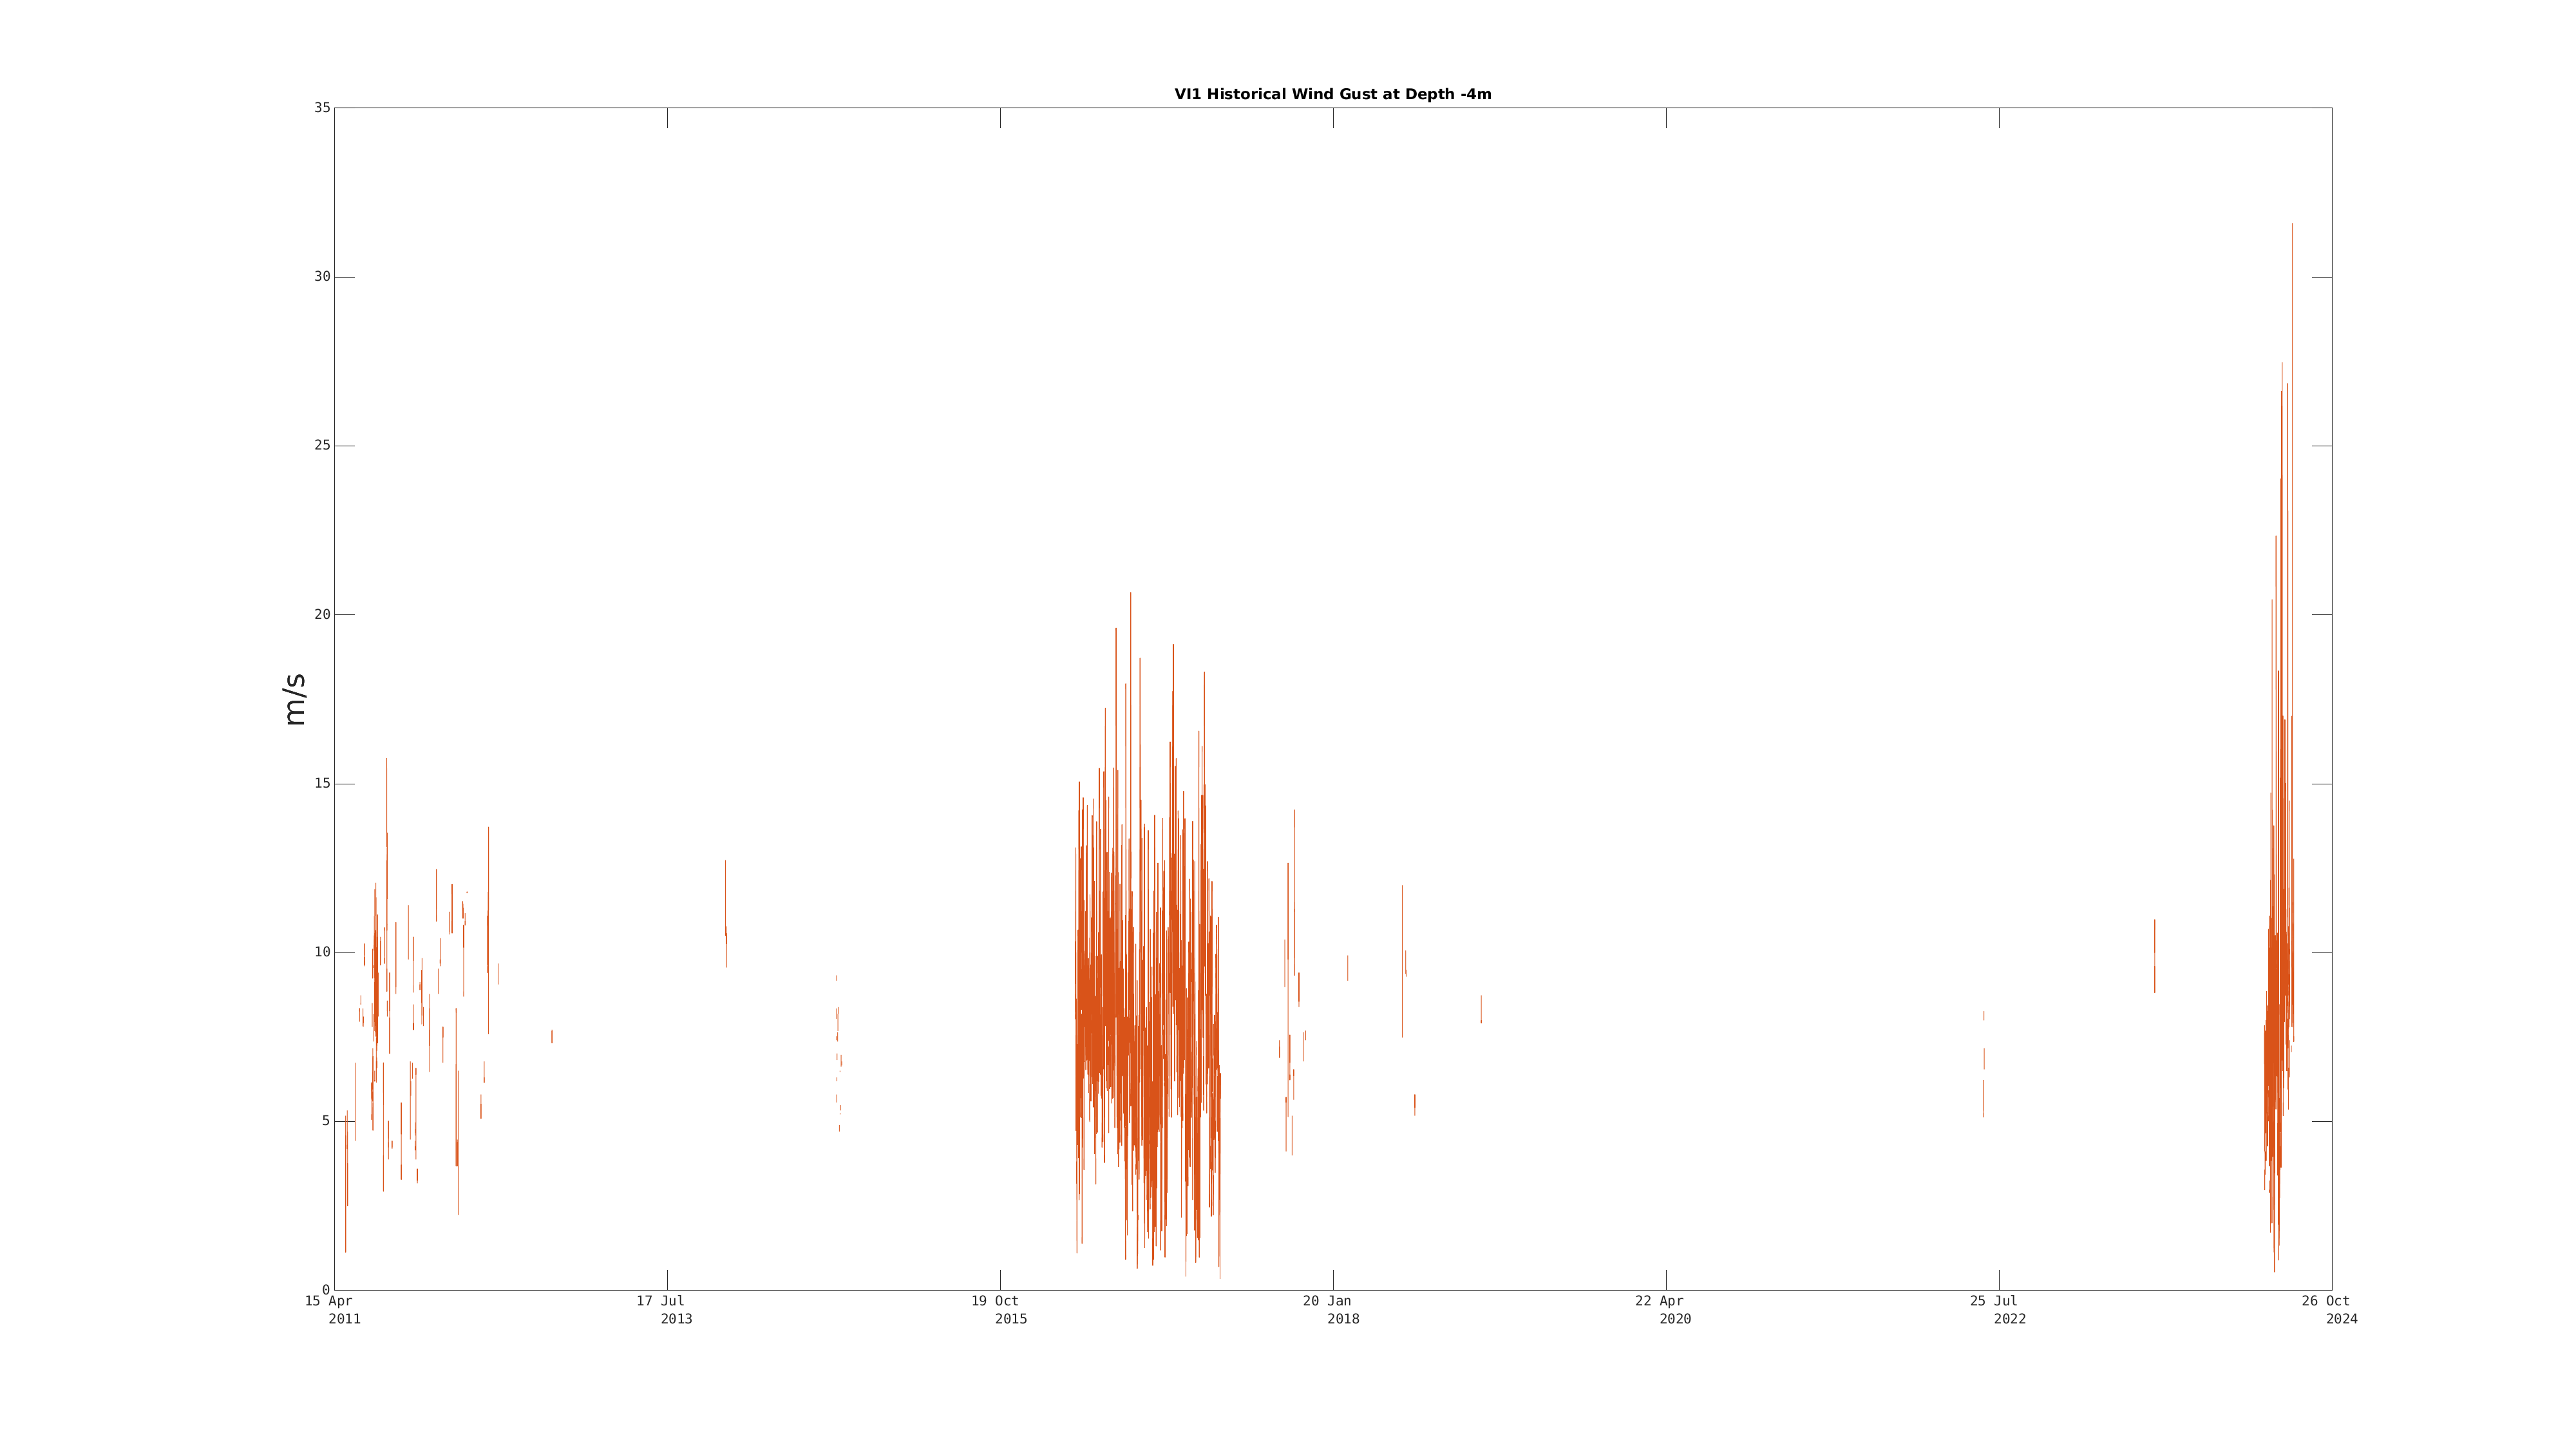
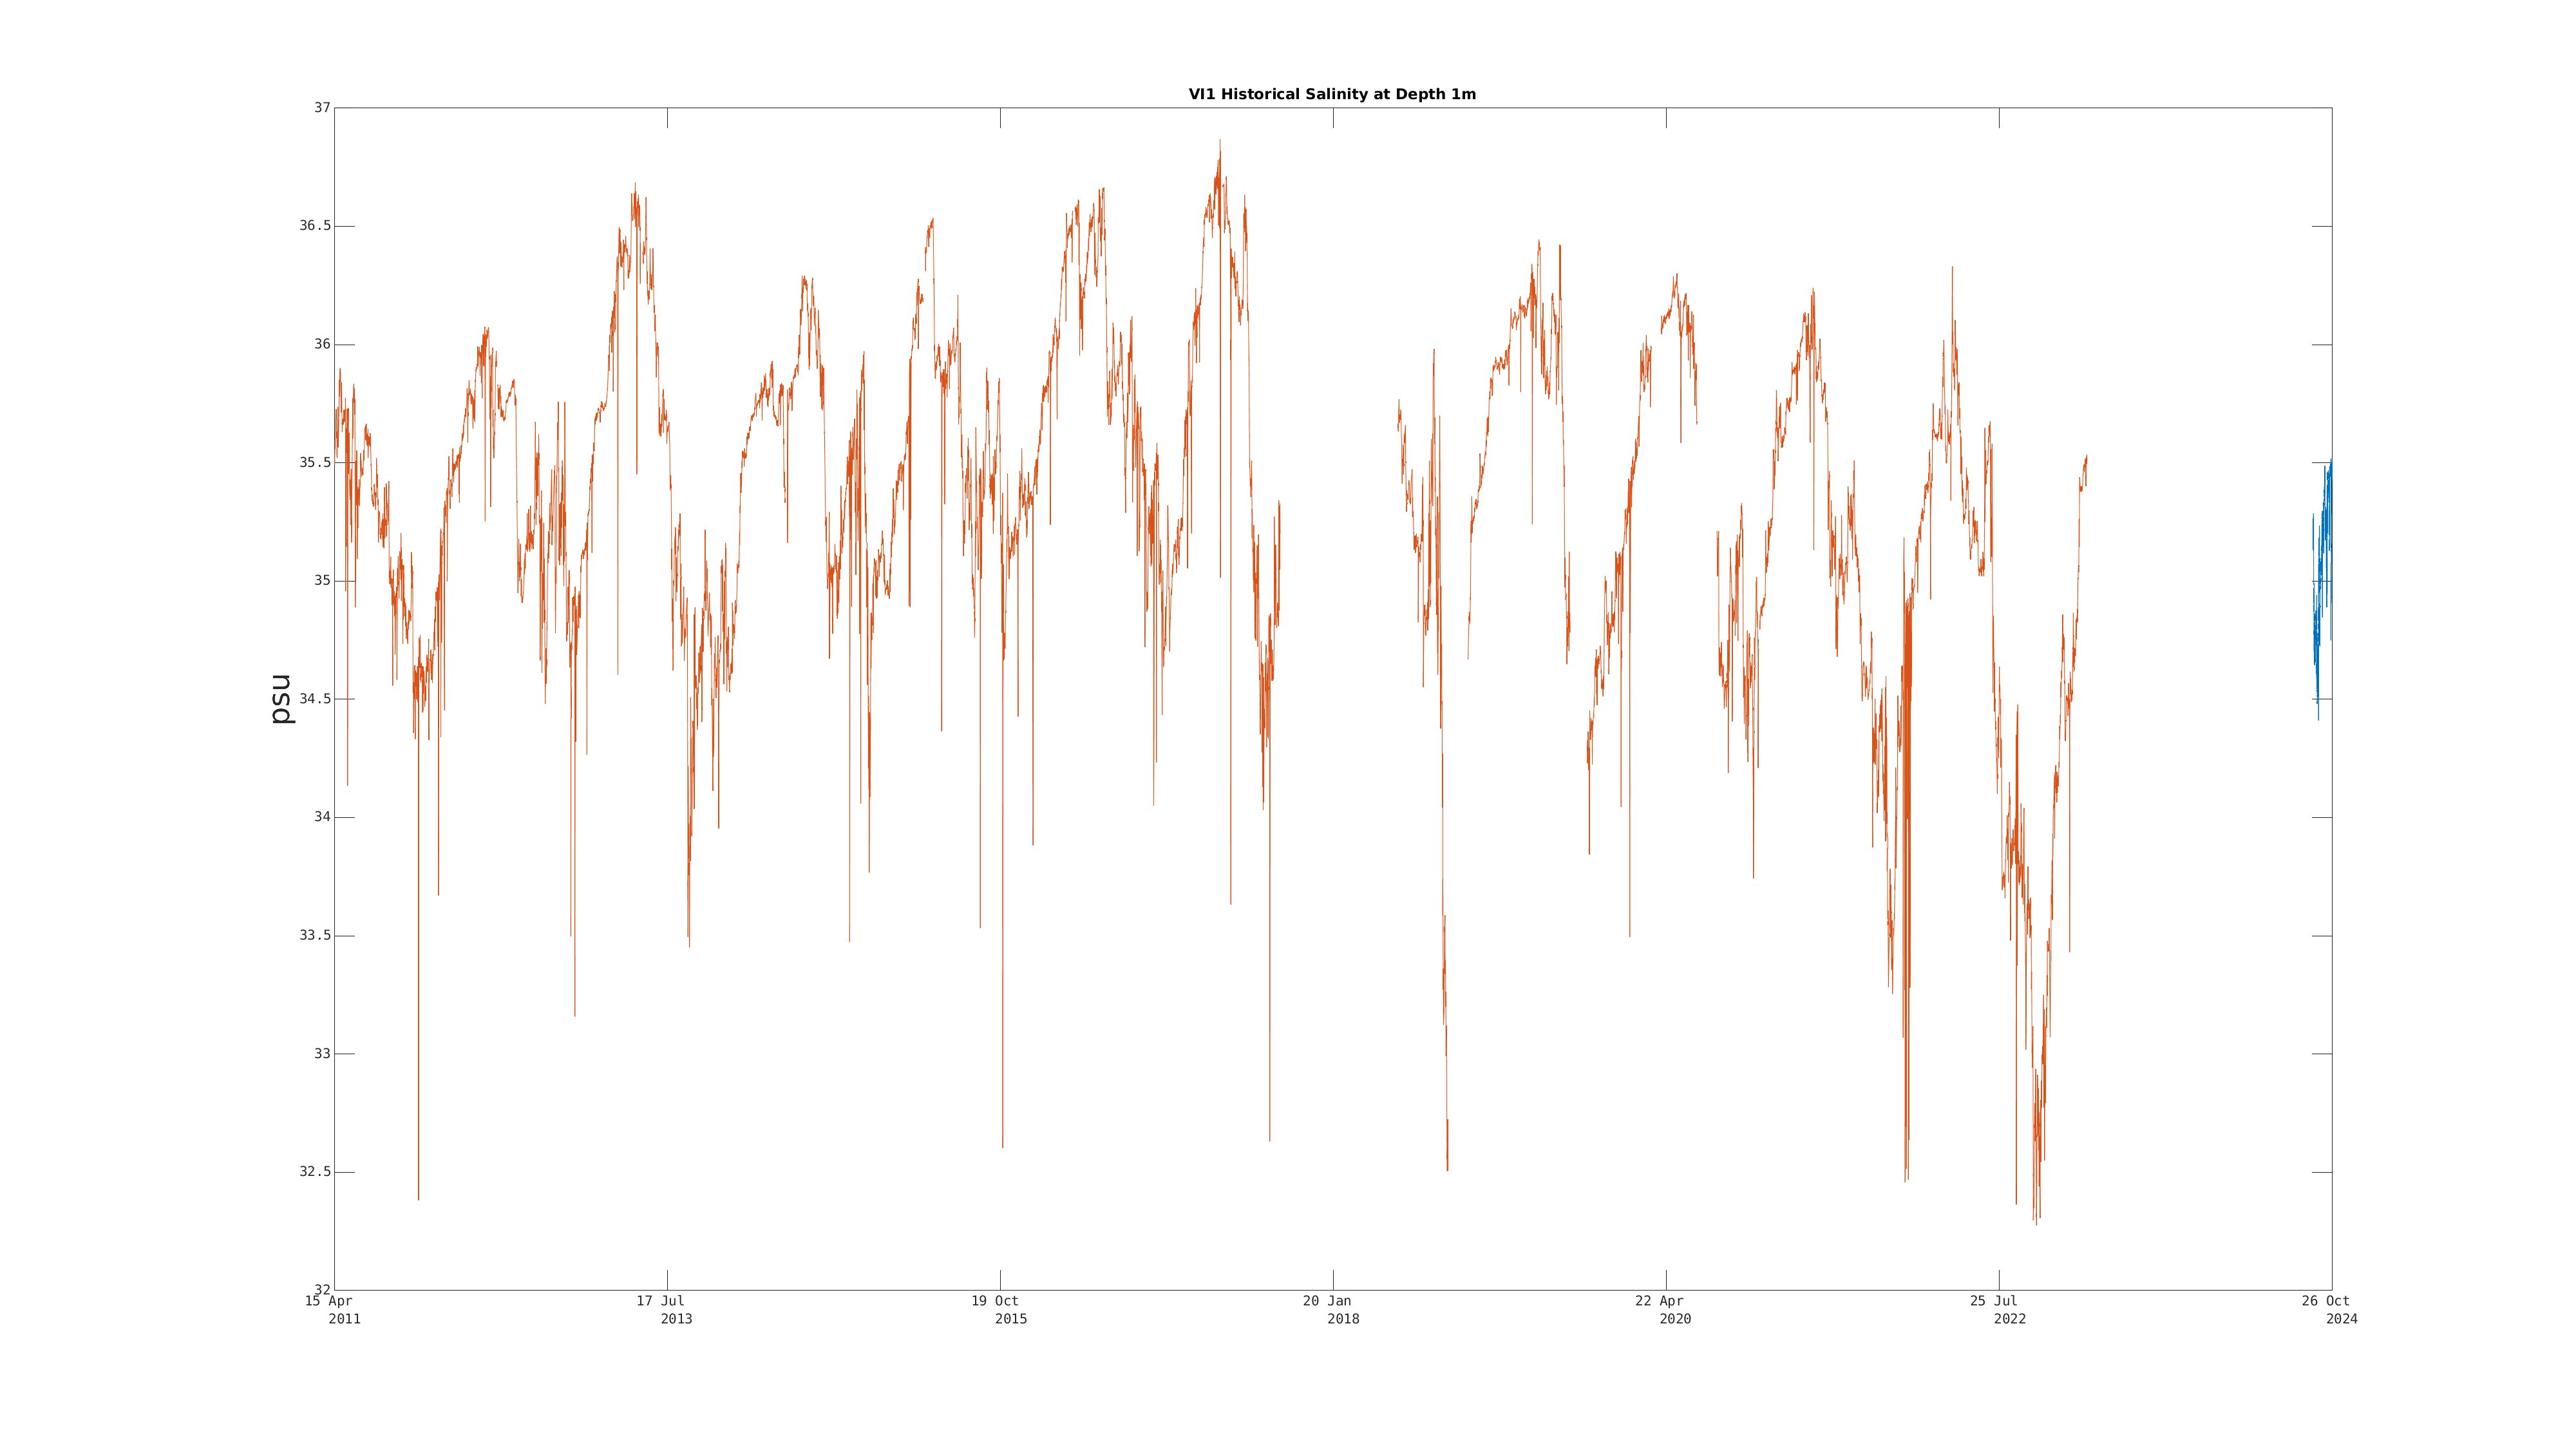
 Entire Position History:
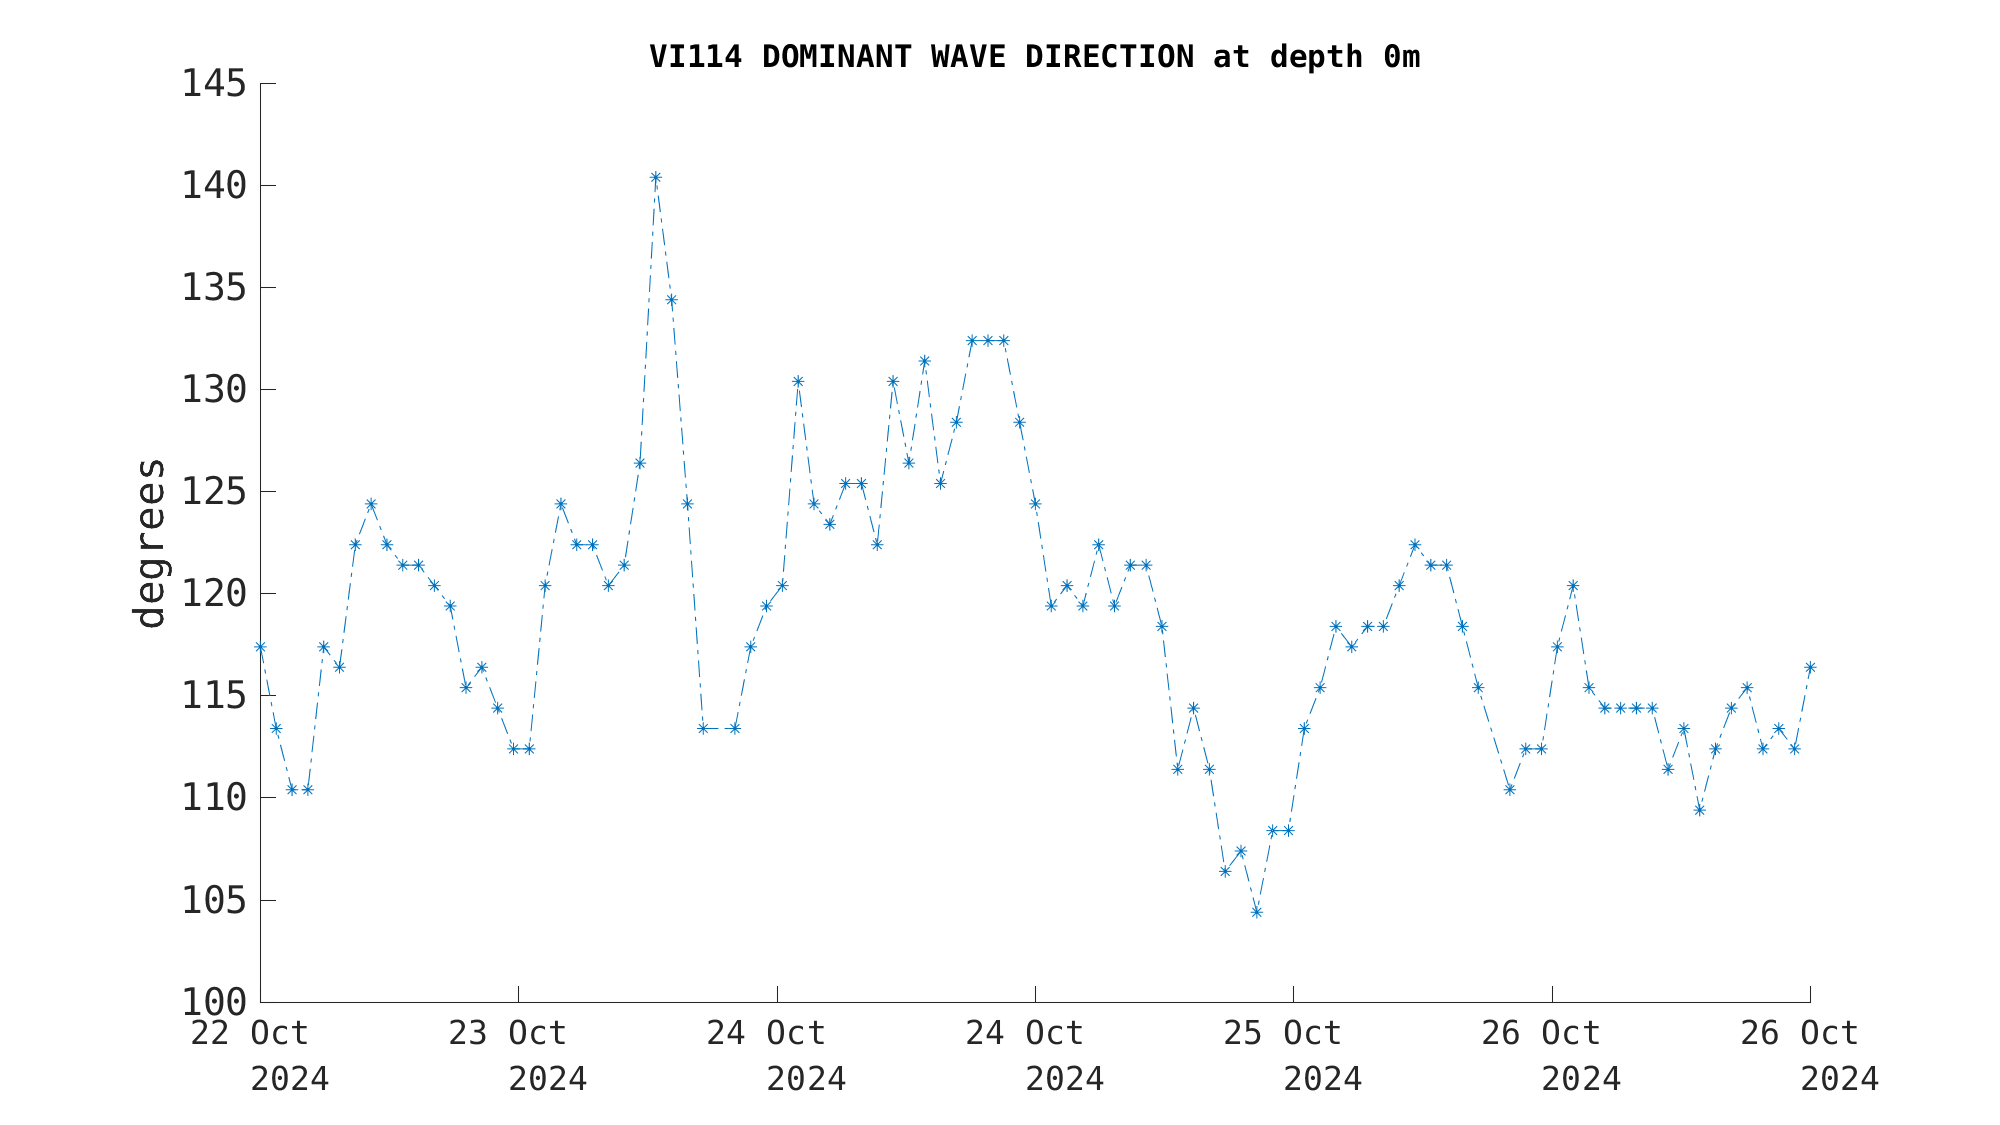
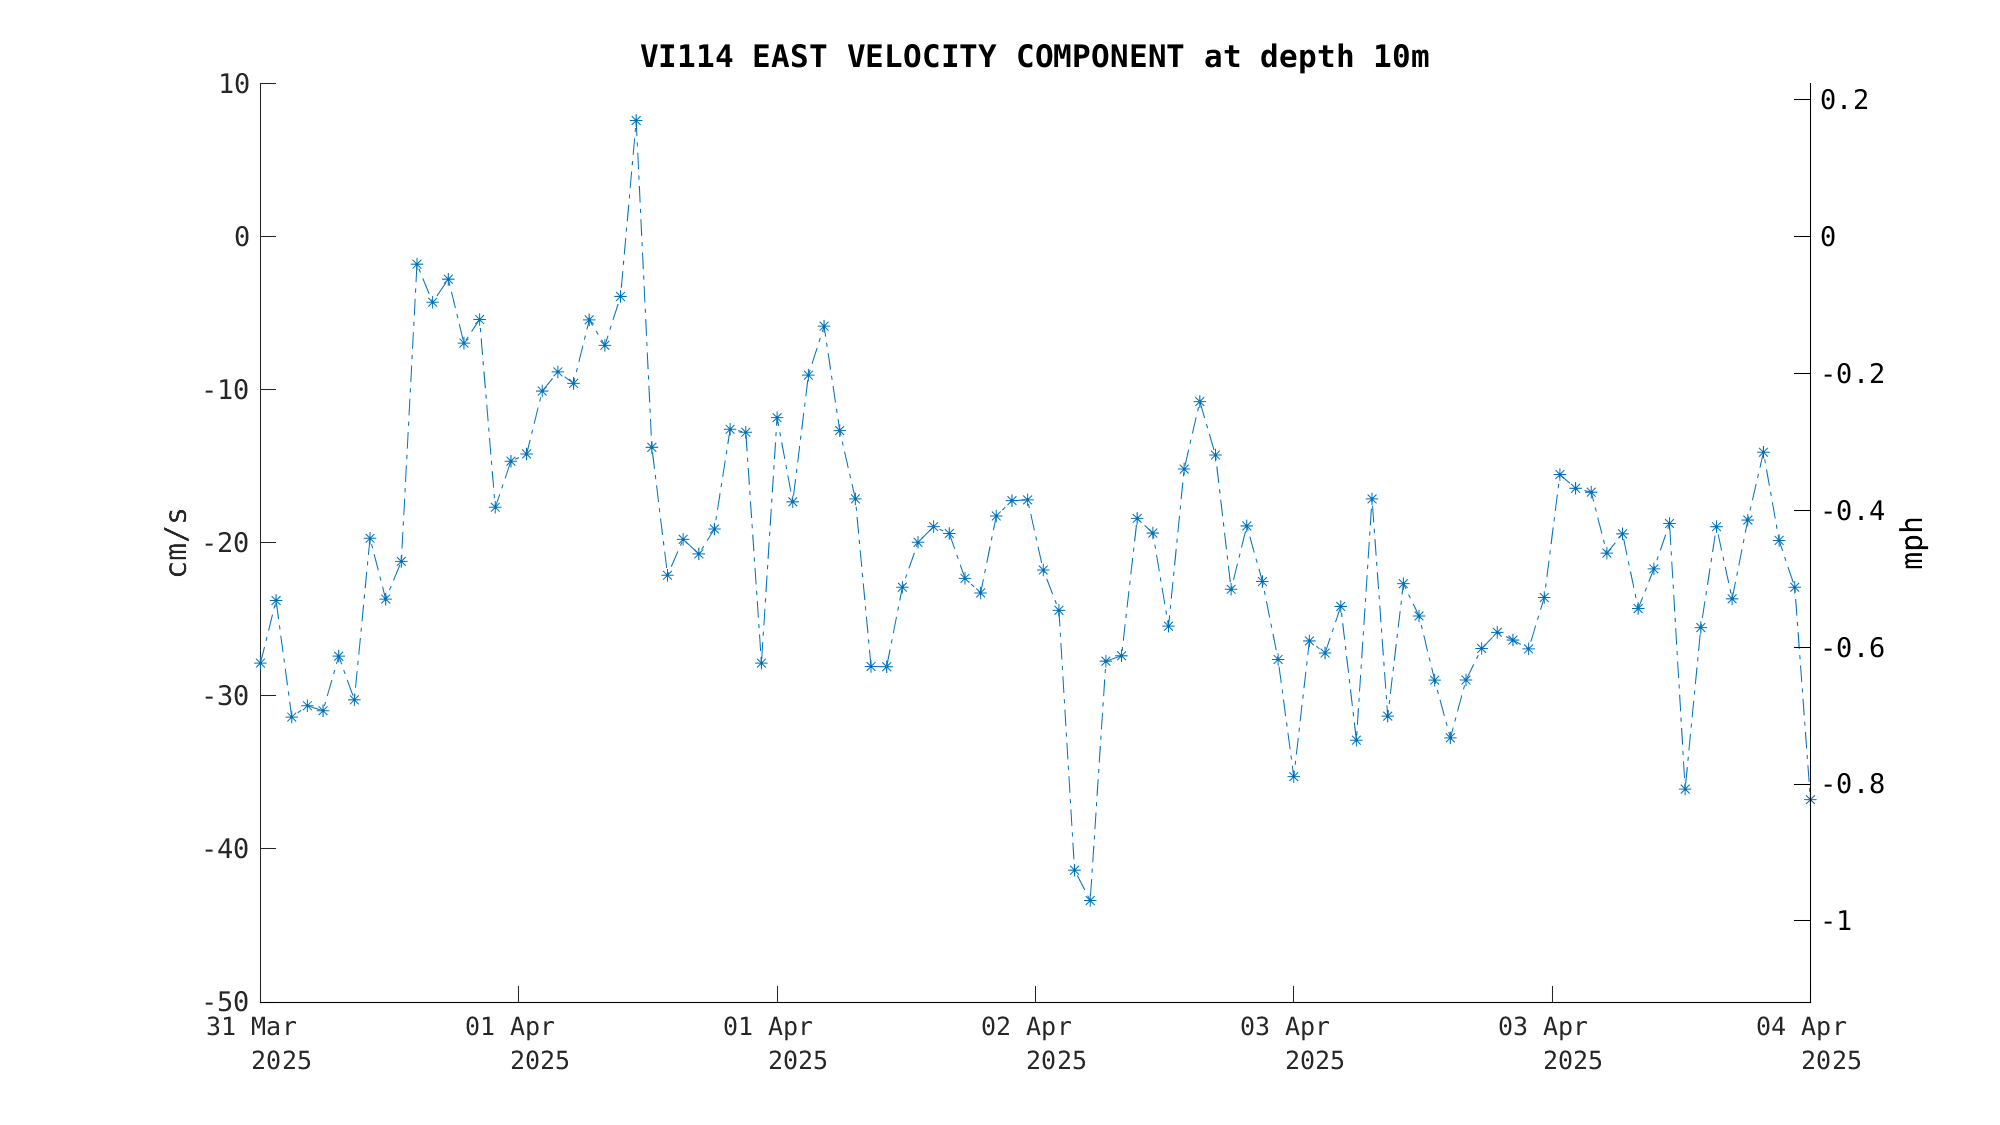
 Latest Month's:
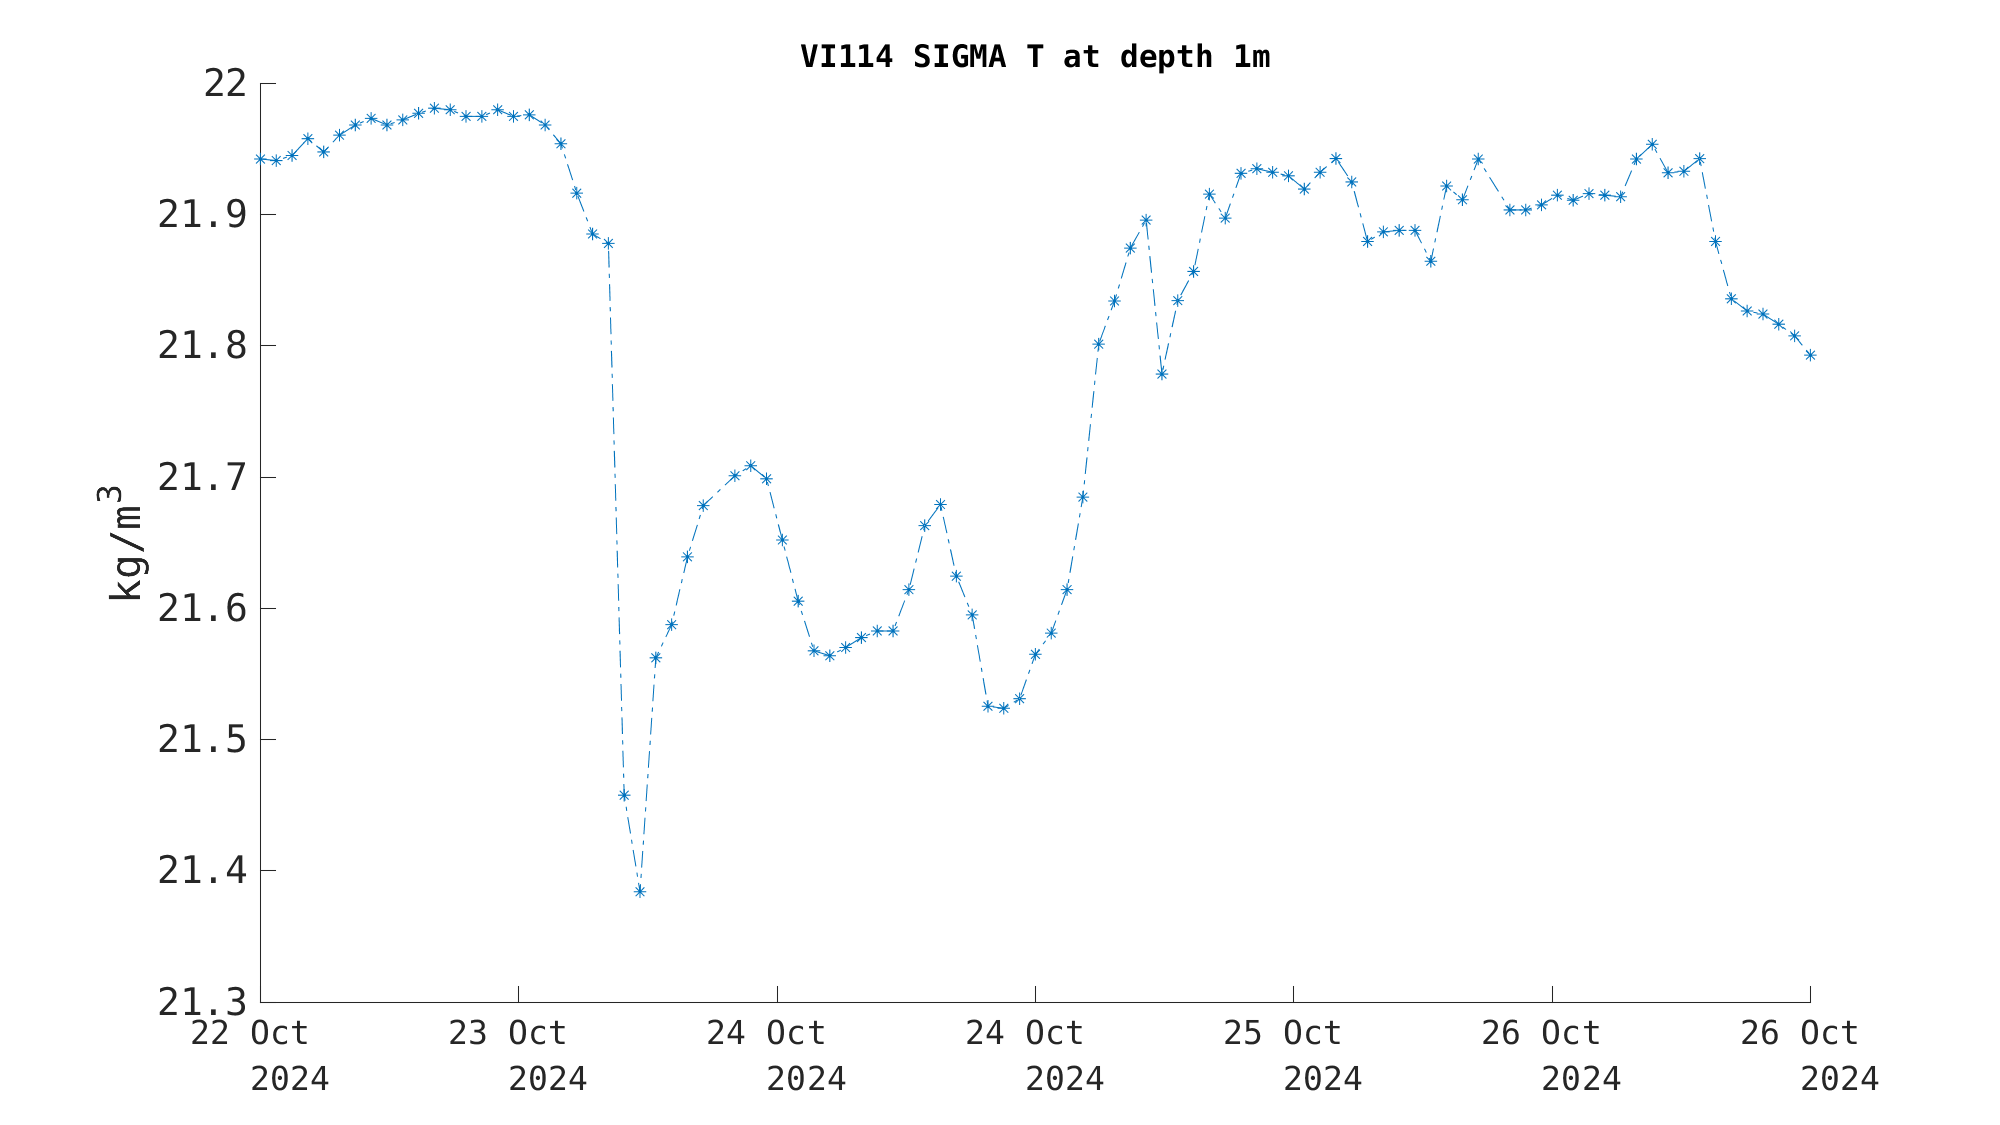
 This Deployment:
 Entire Position History: