Latitude: 18° 15.67´N
Longitude: 65° 27.85´W
Location Description: North of Vieques
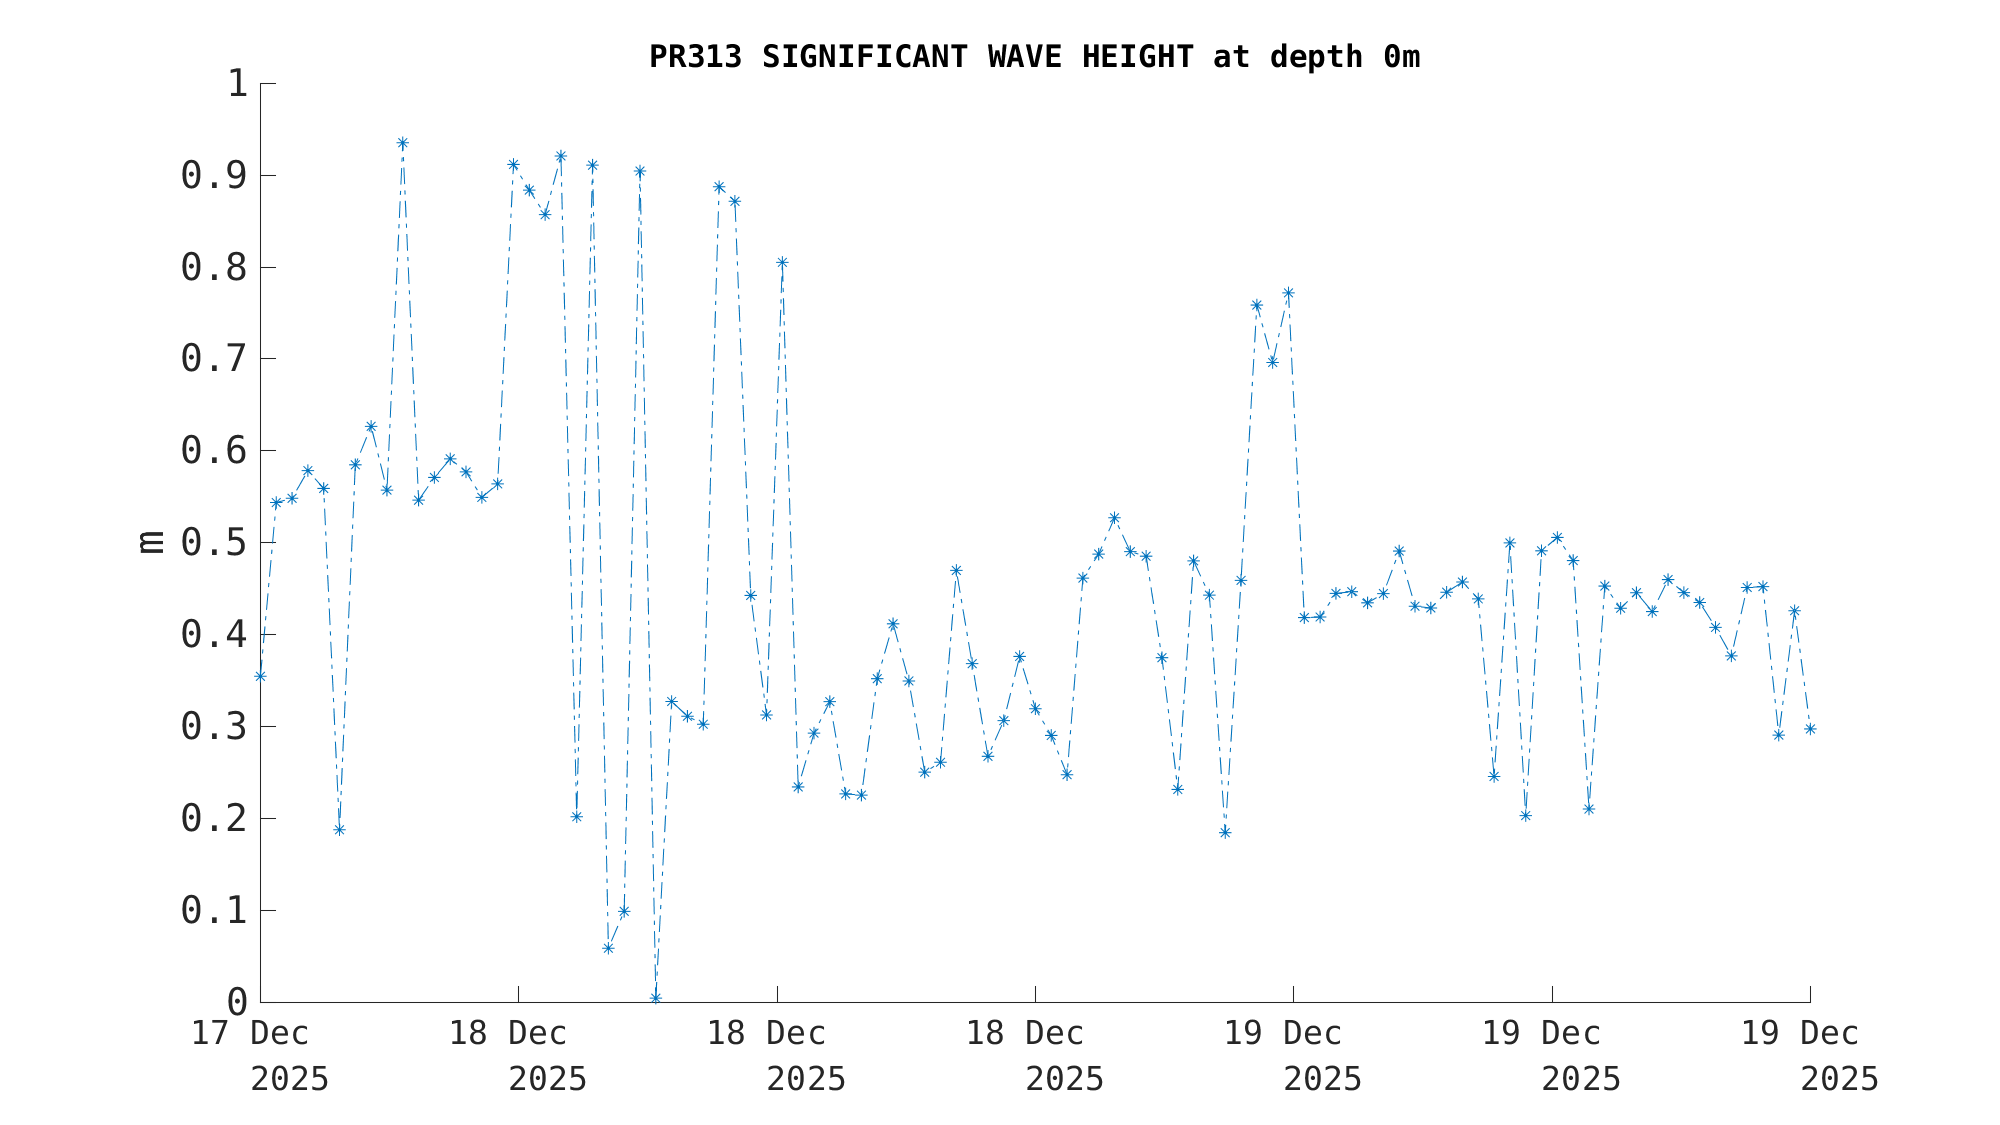
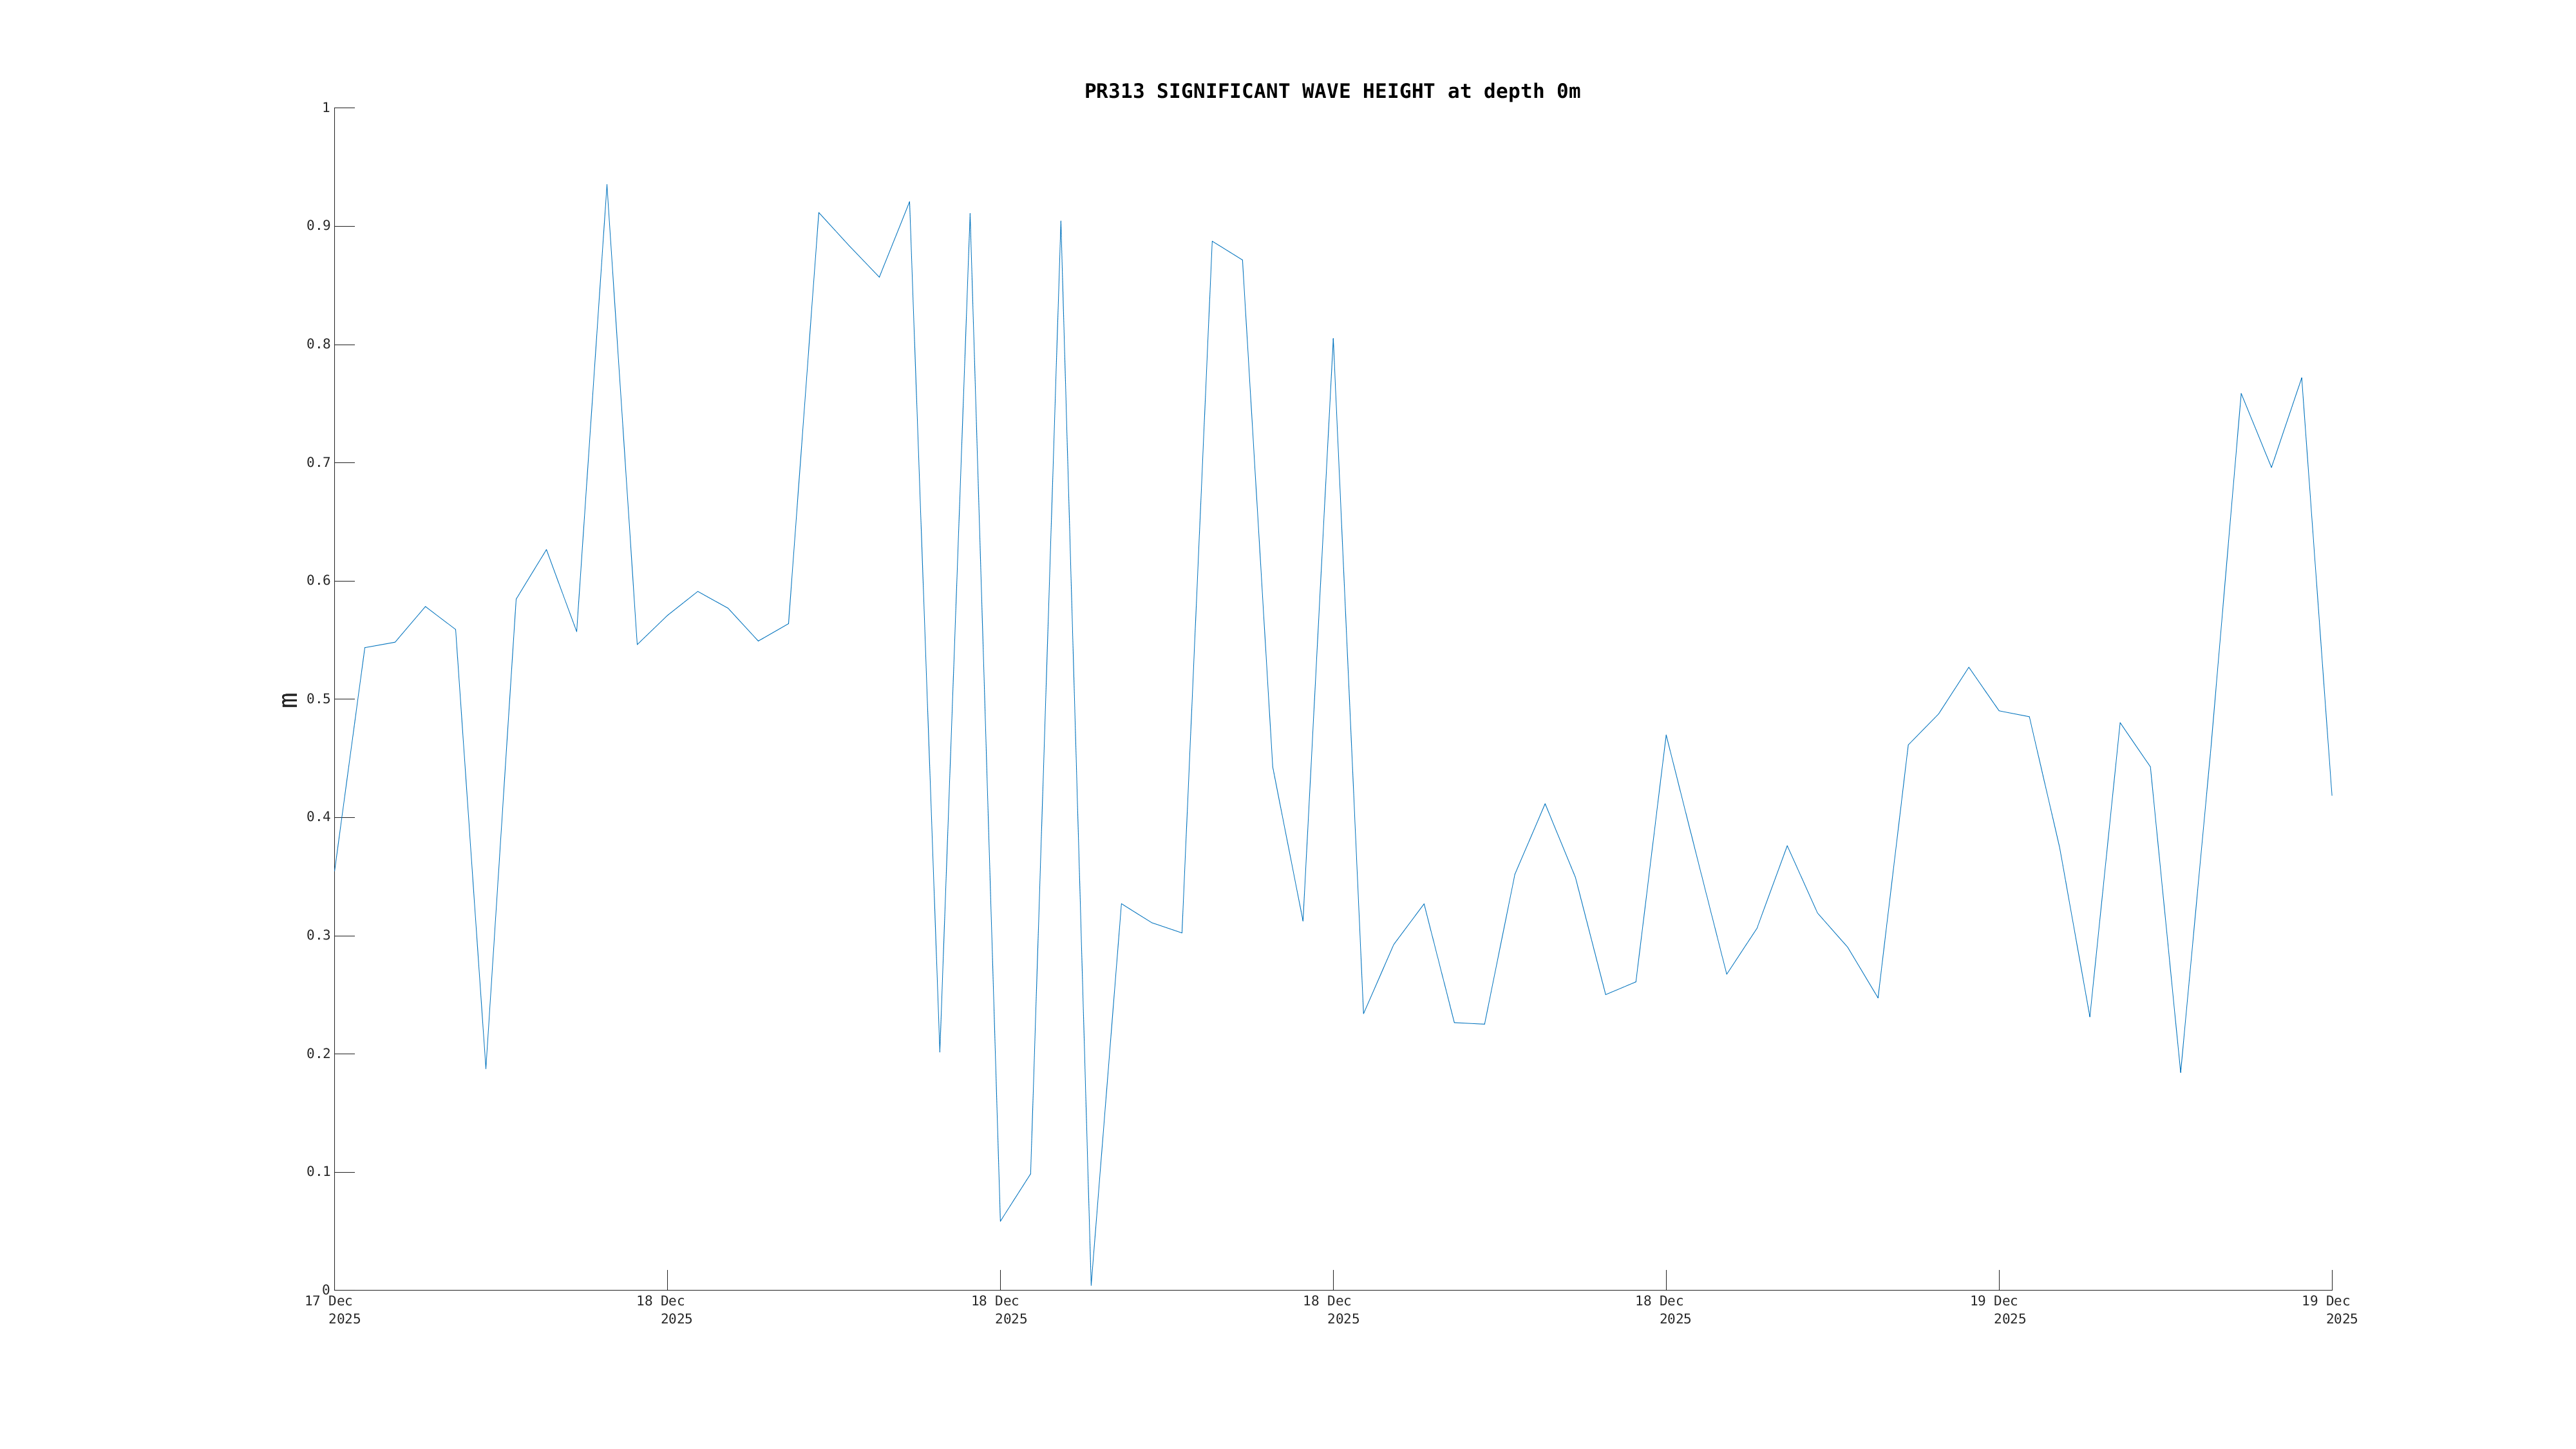
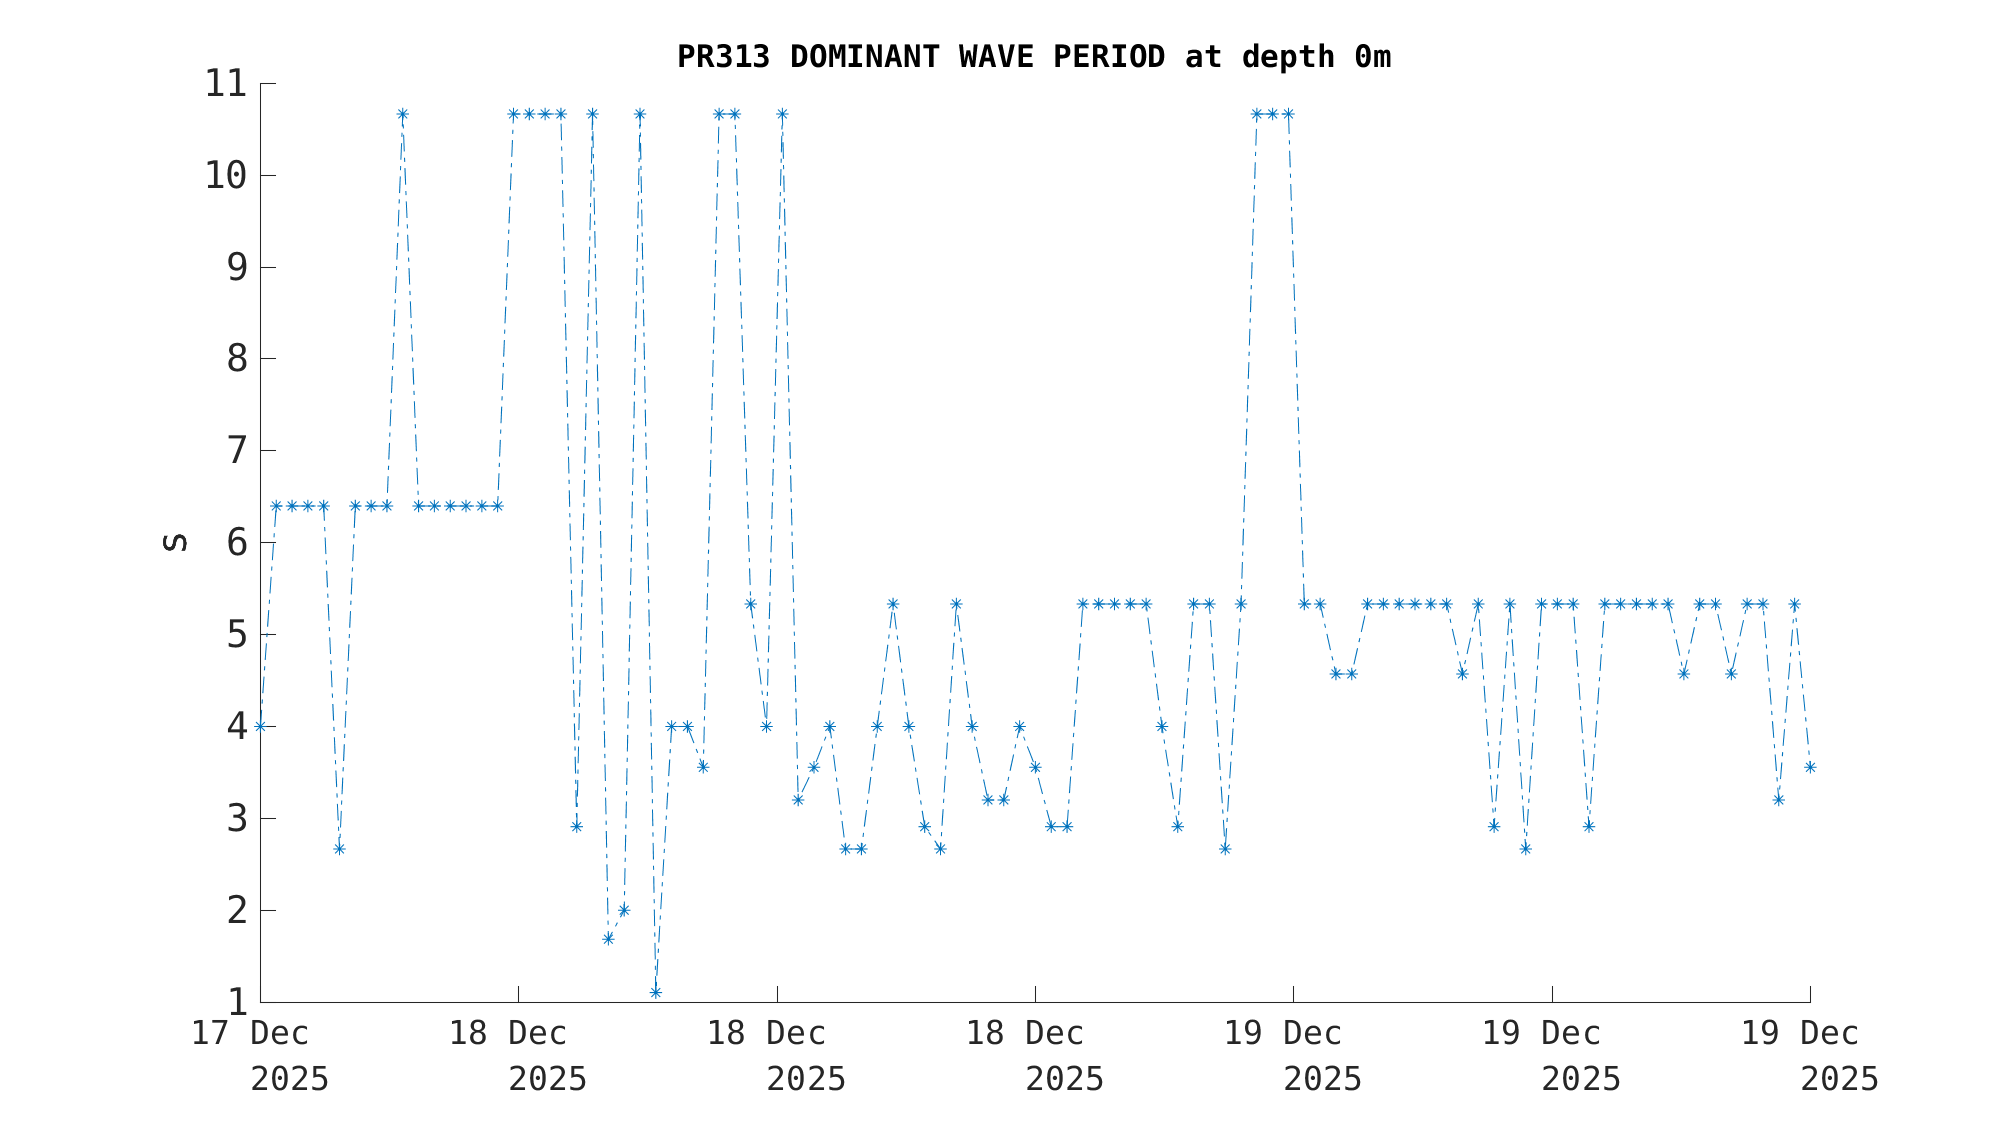
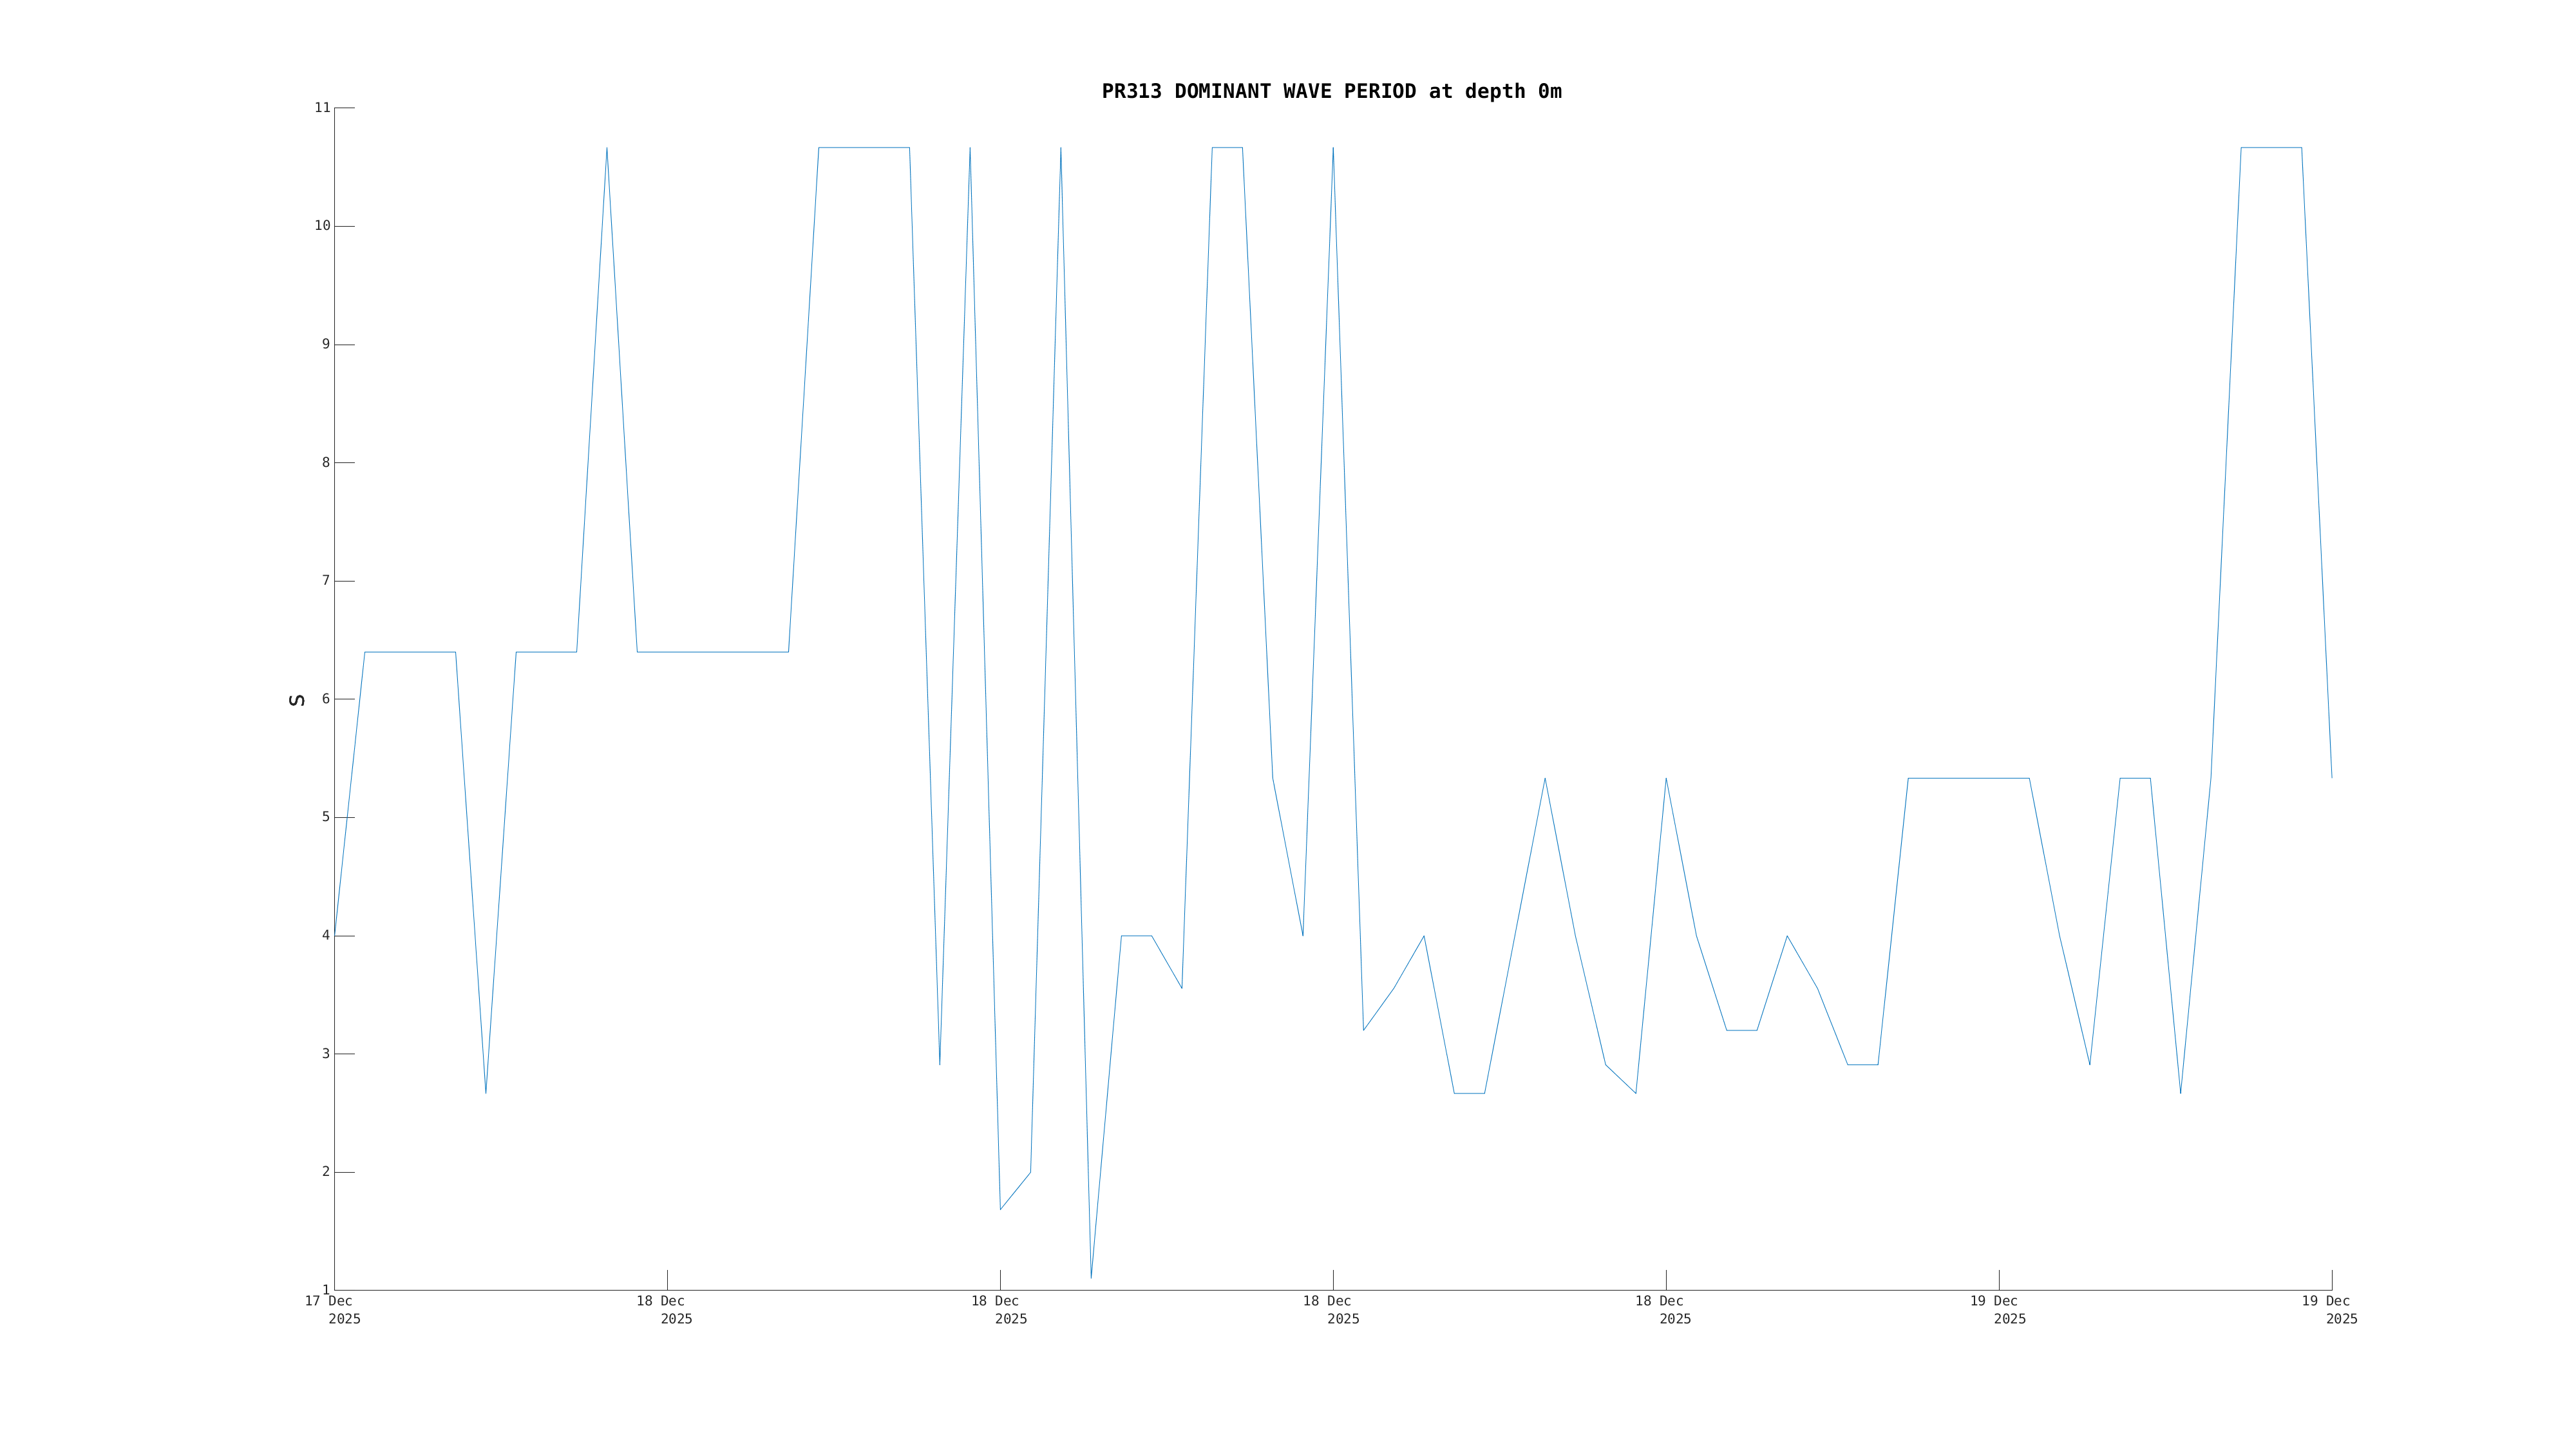
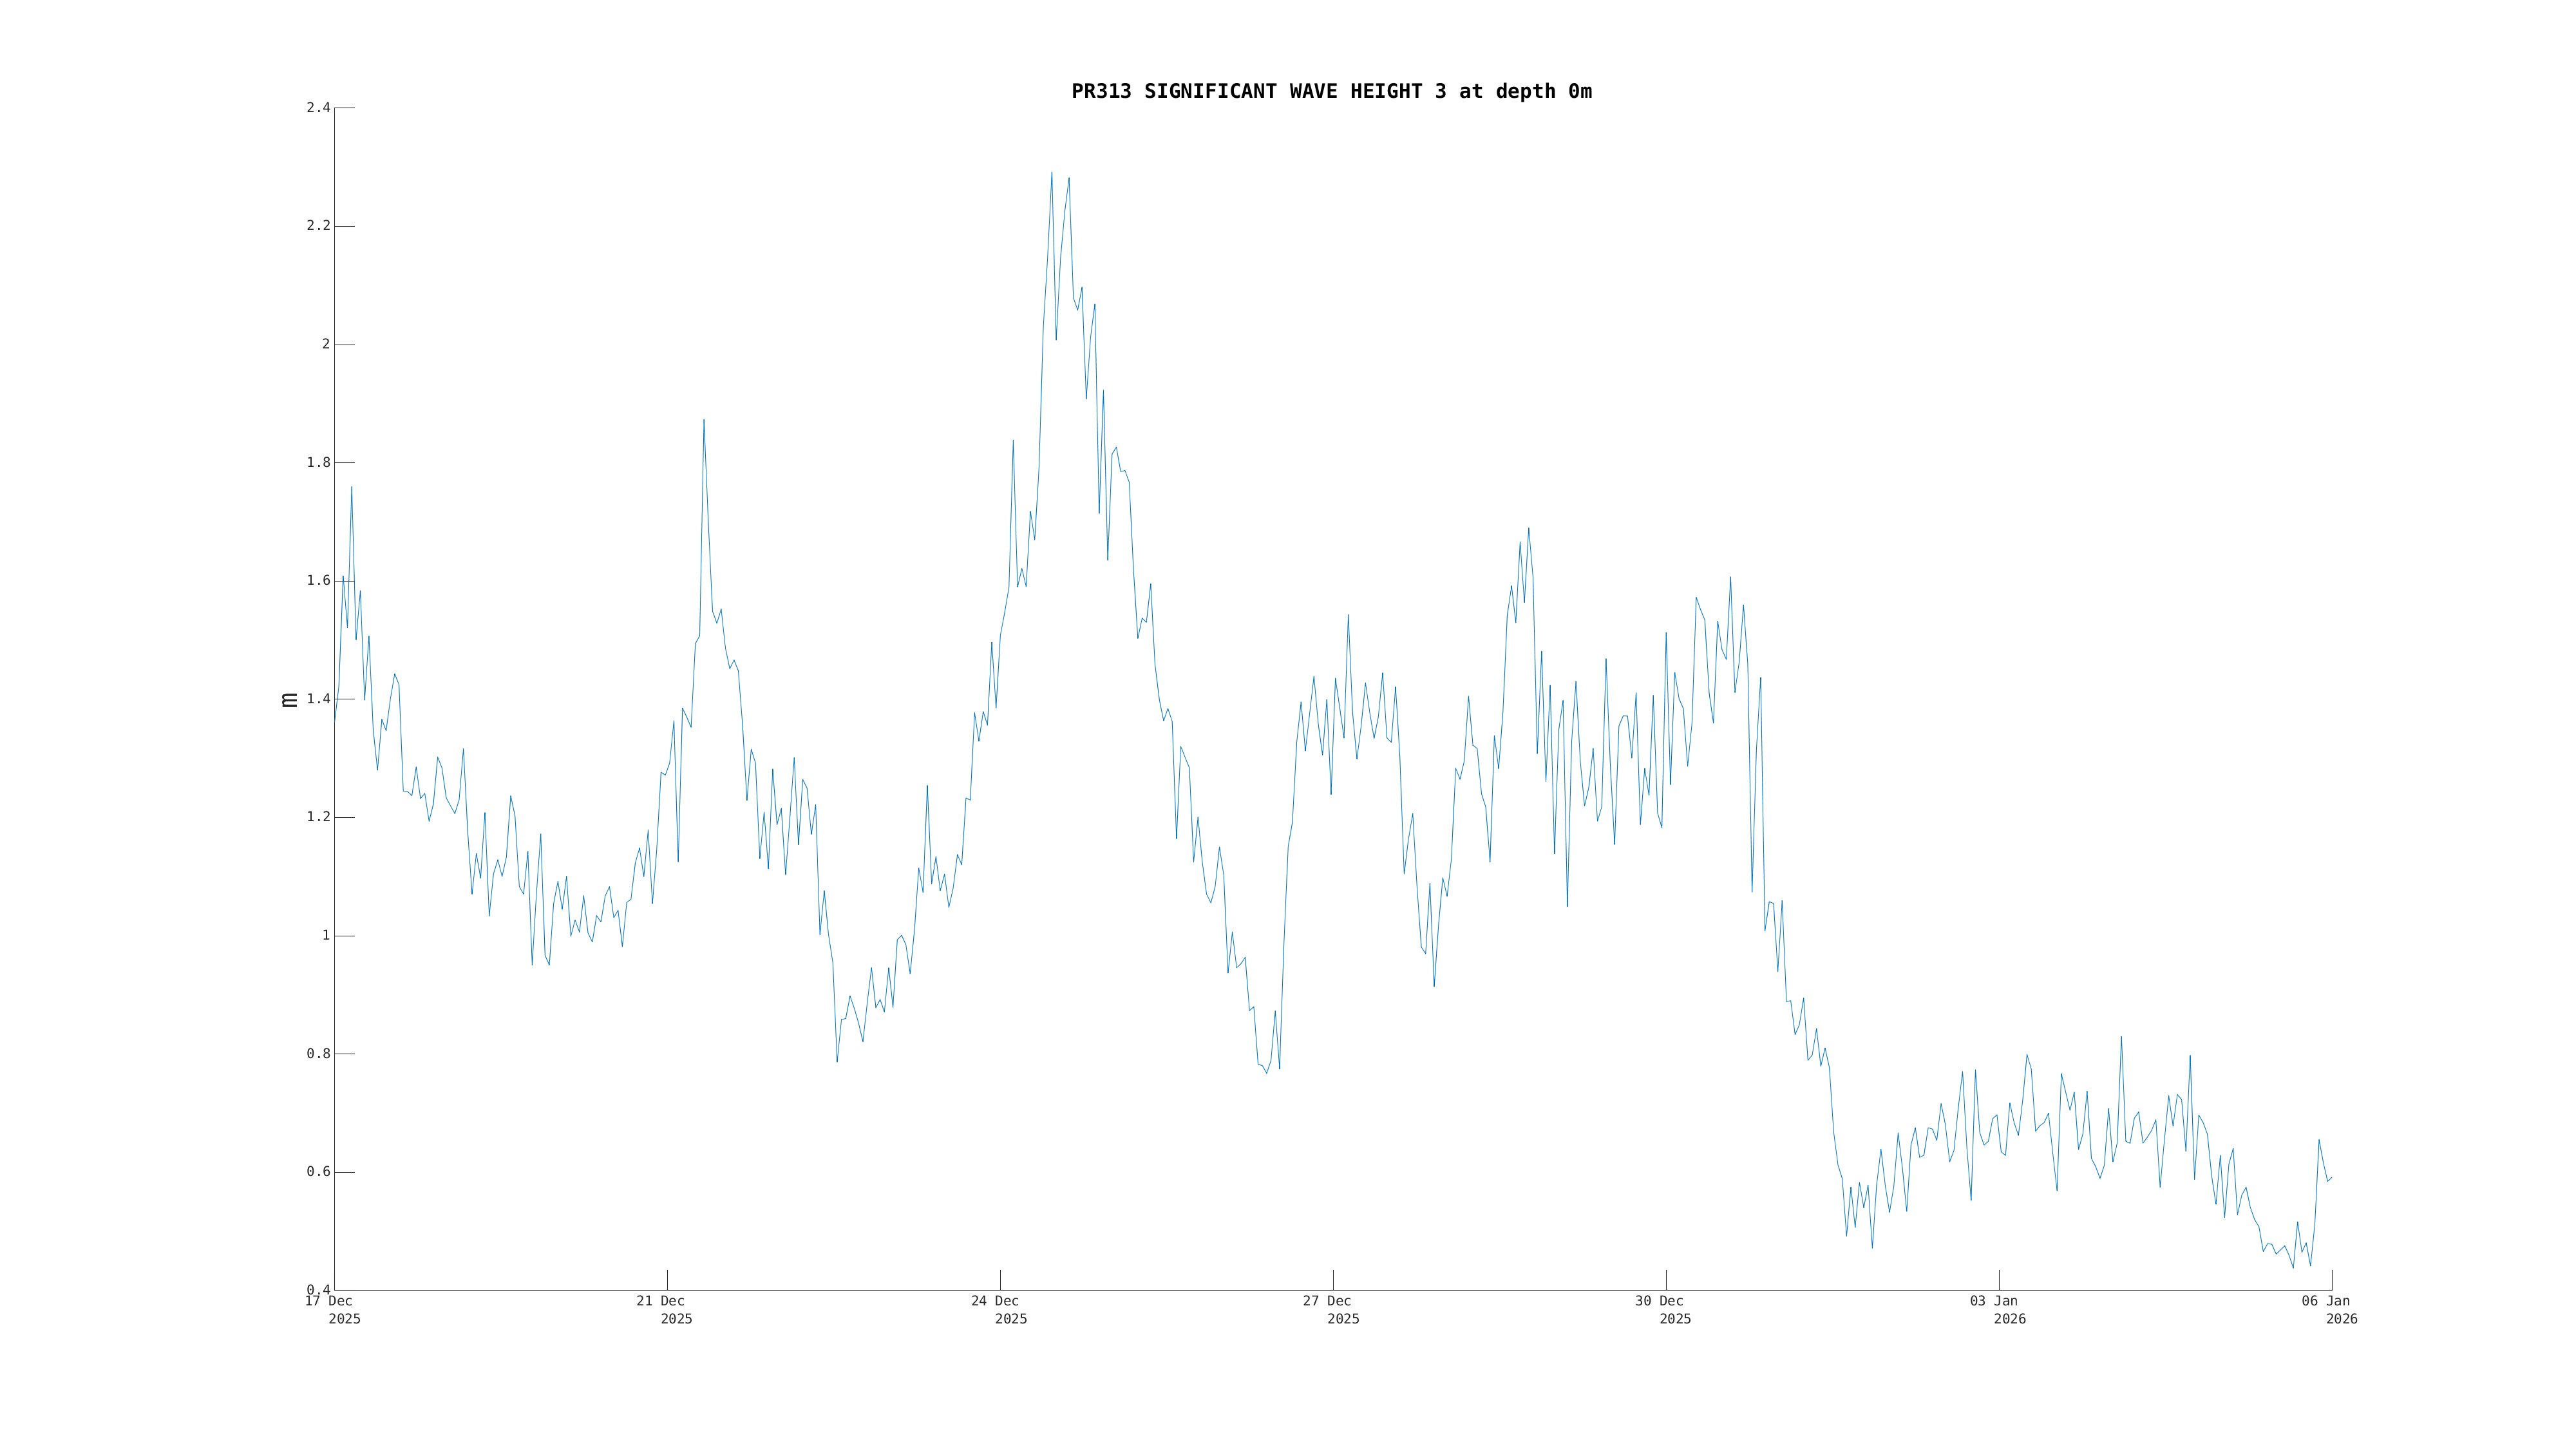
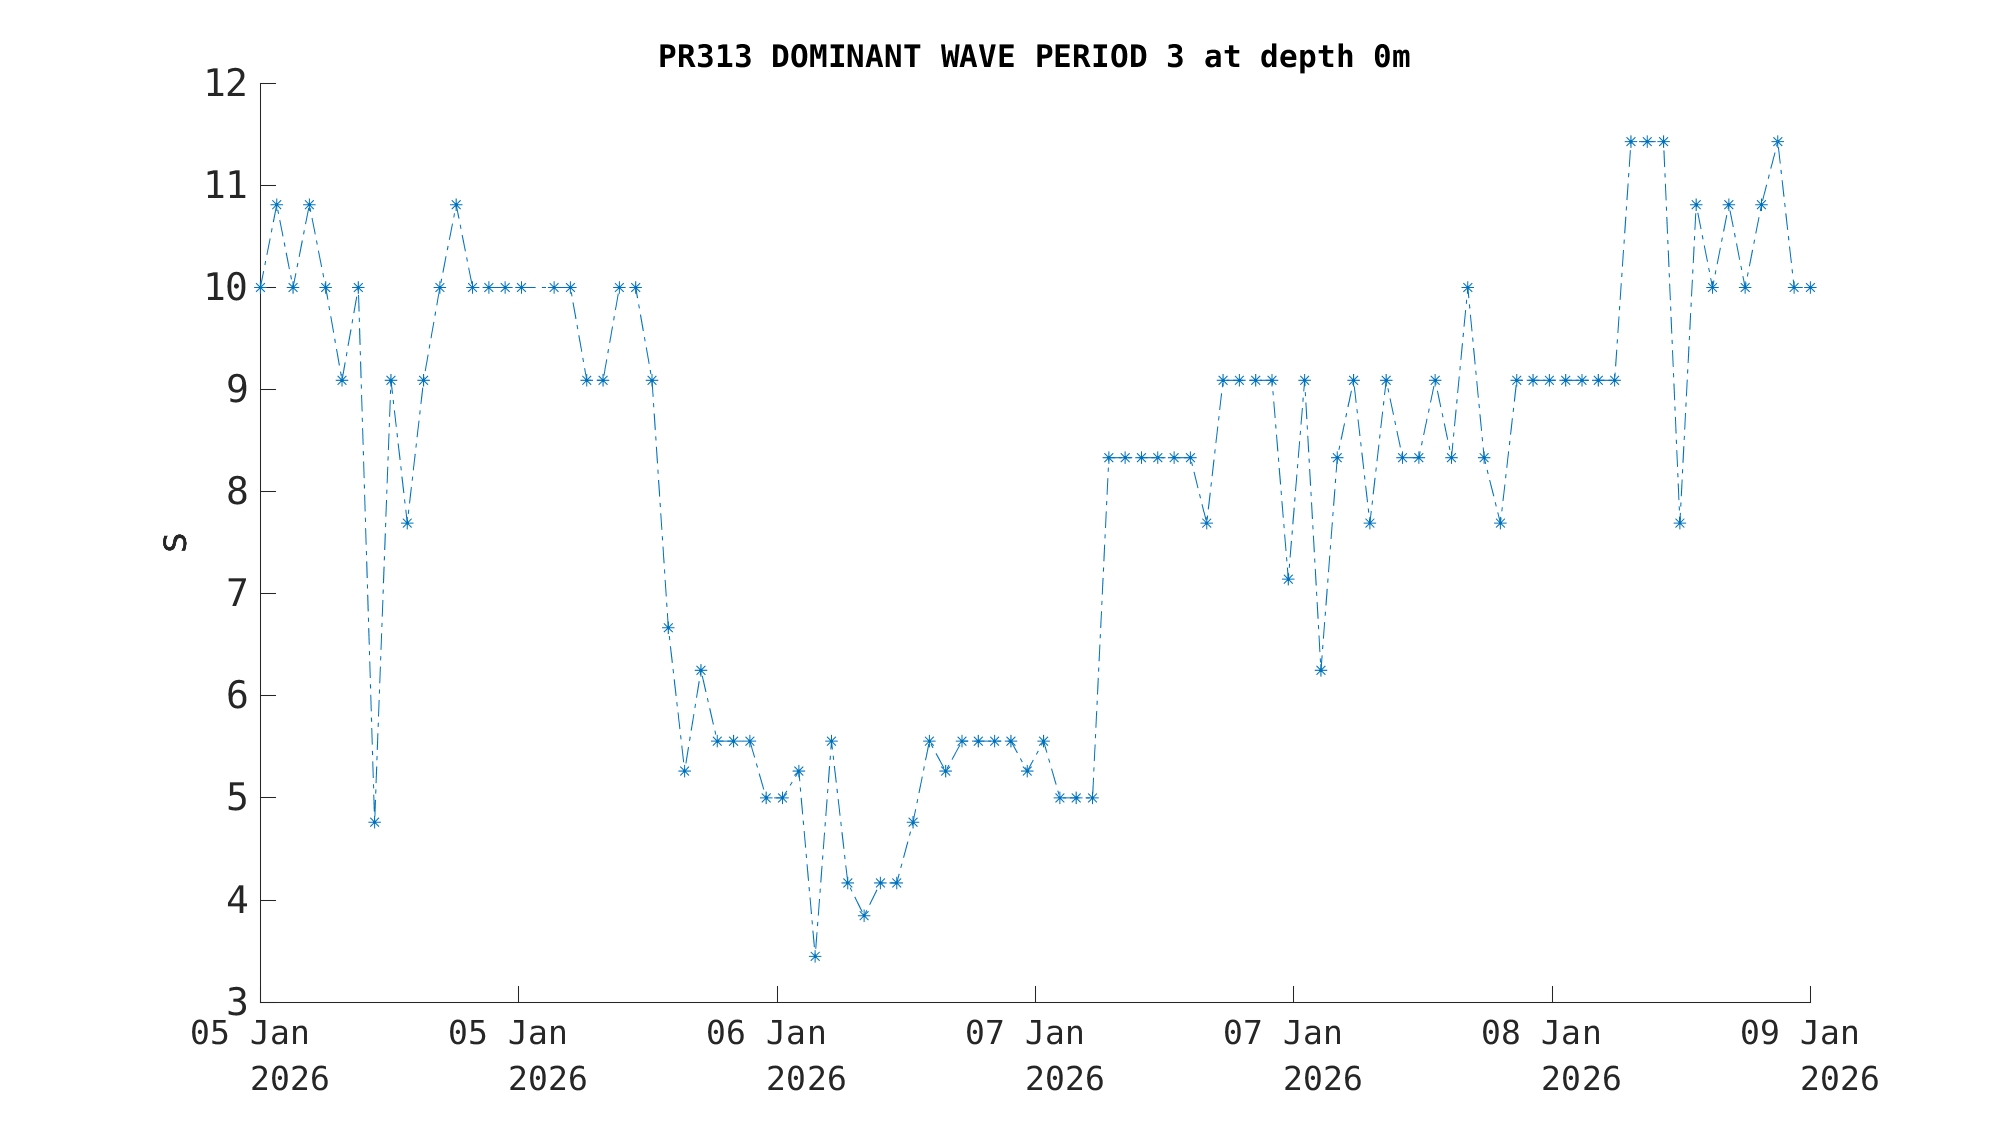
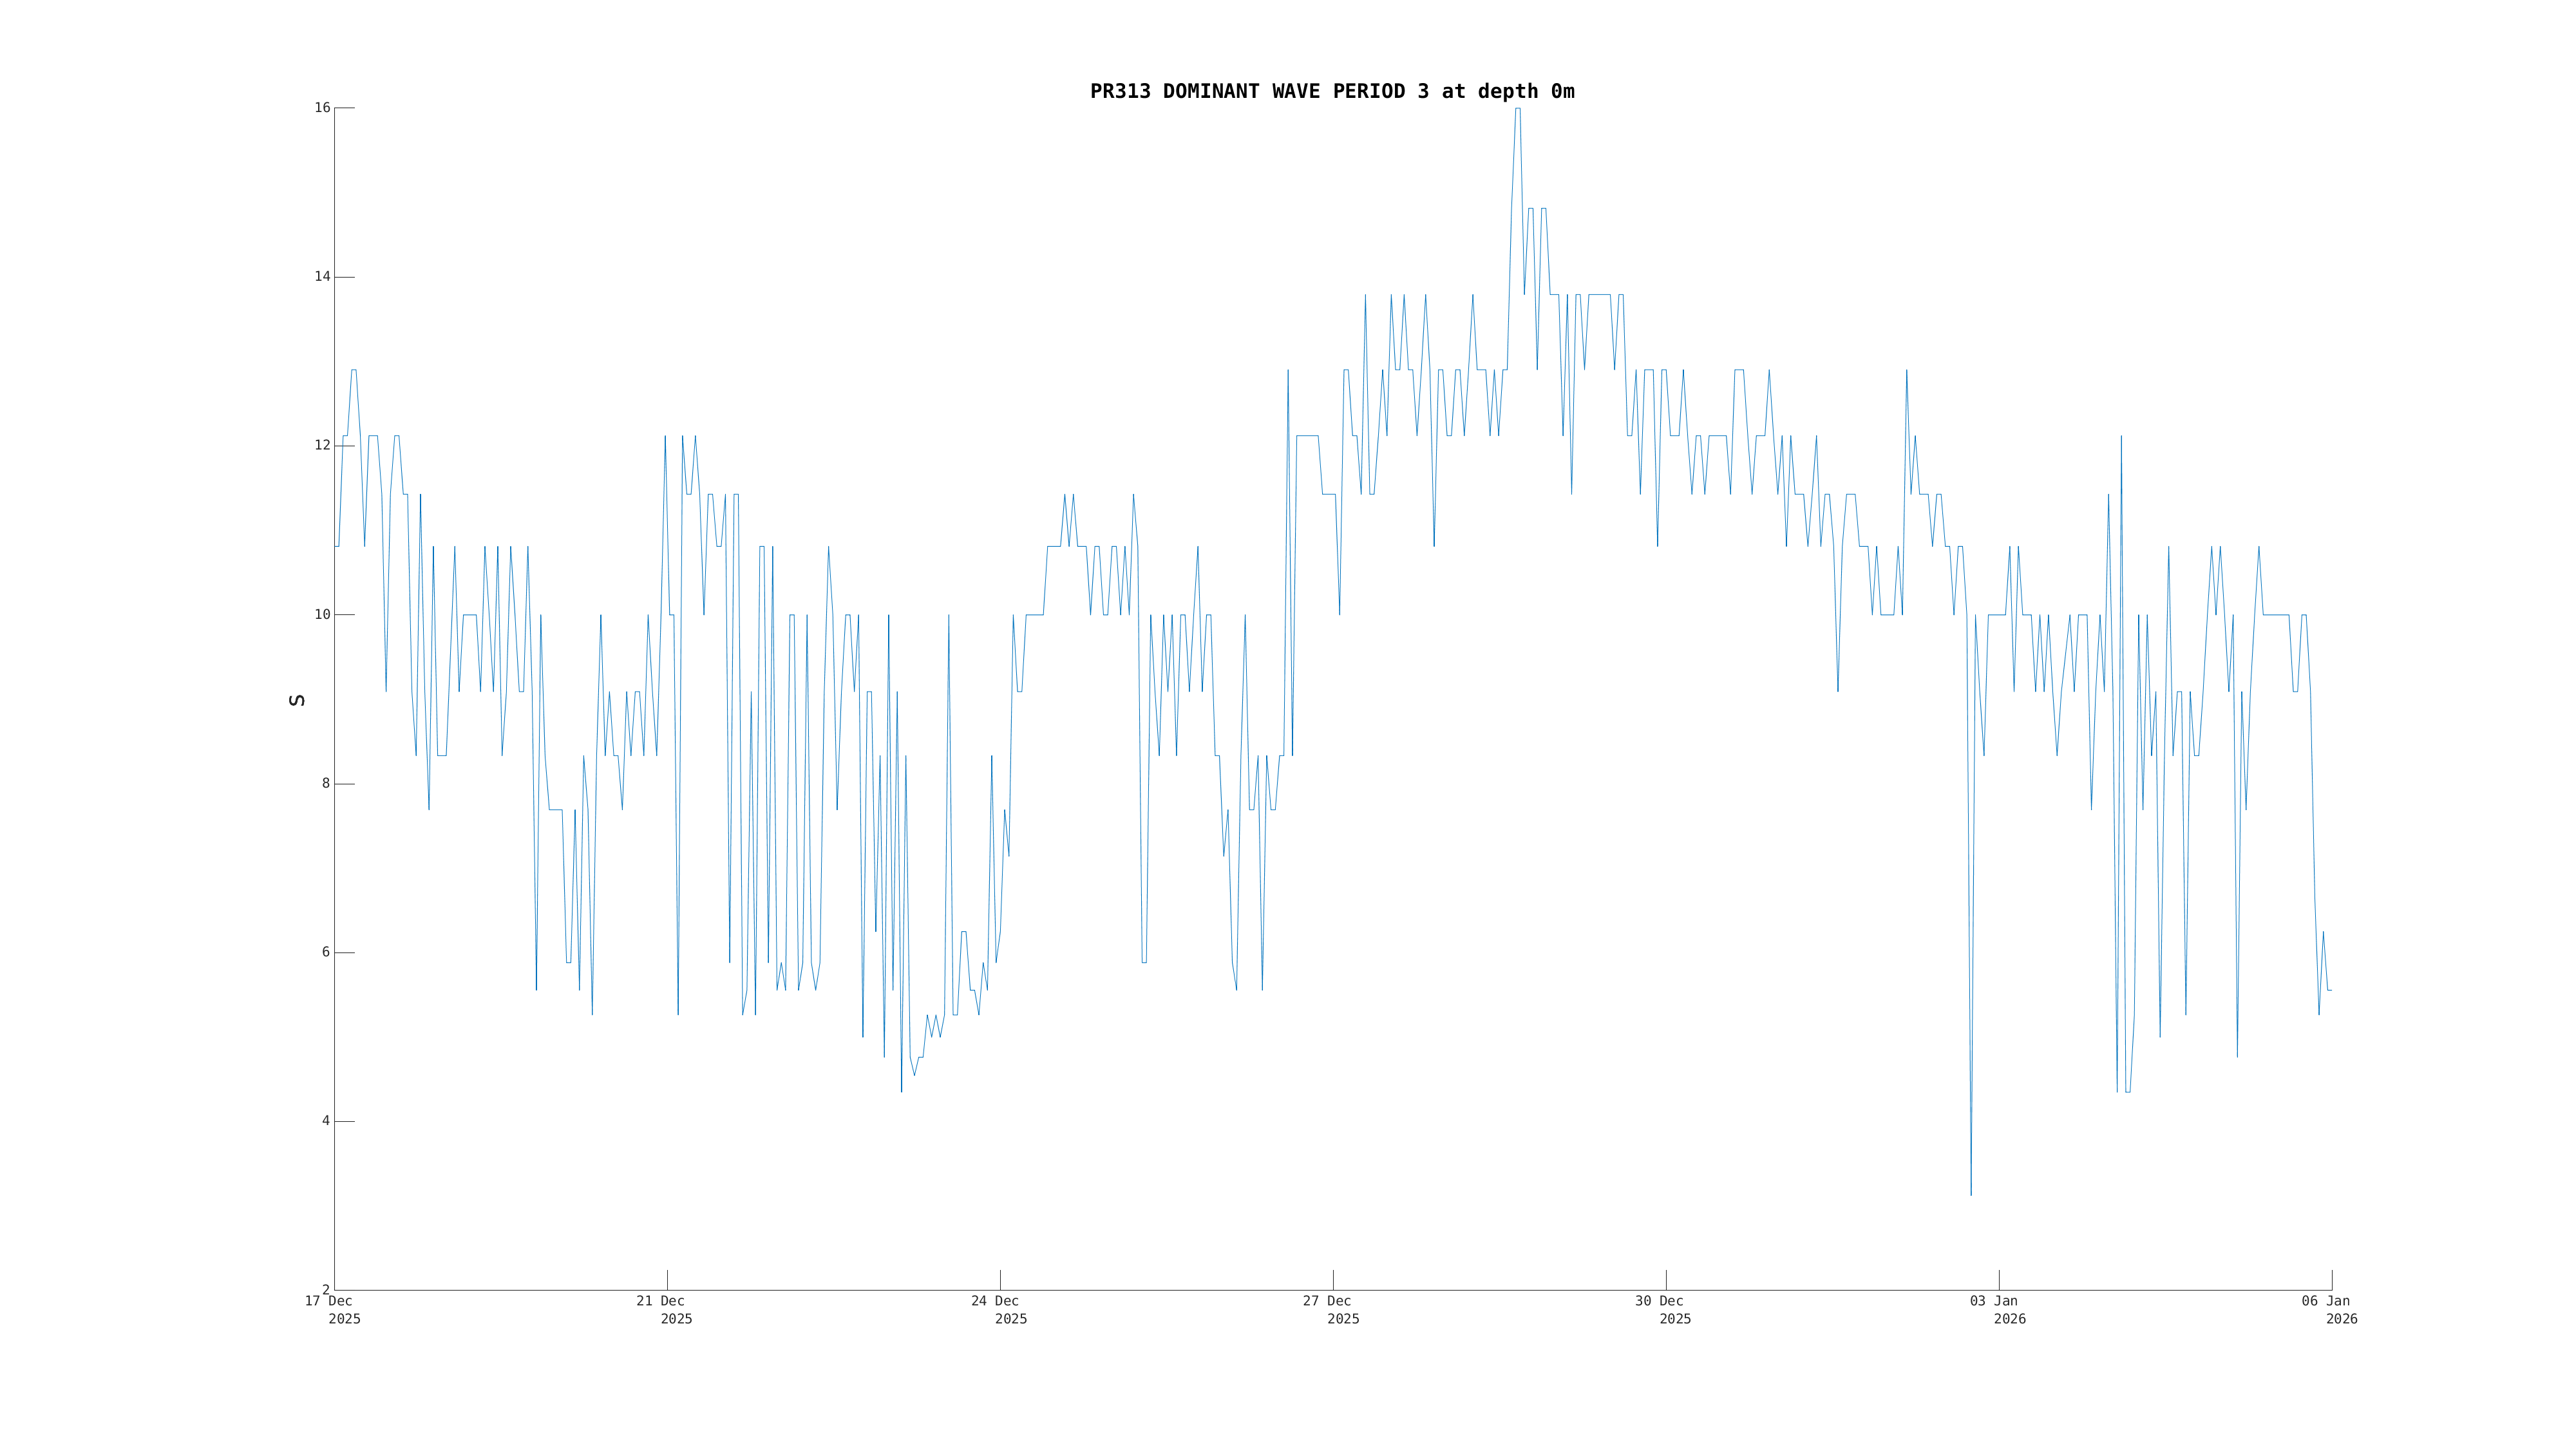
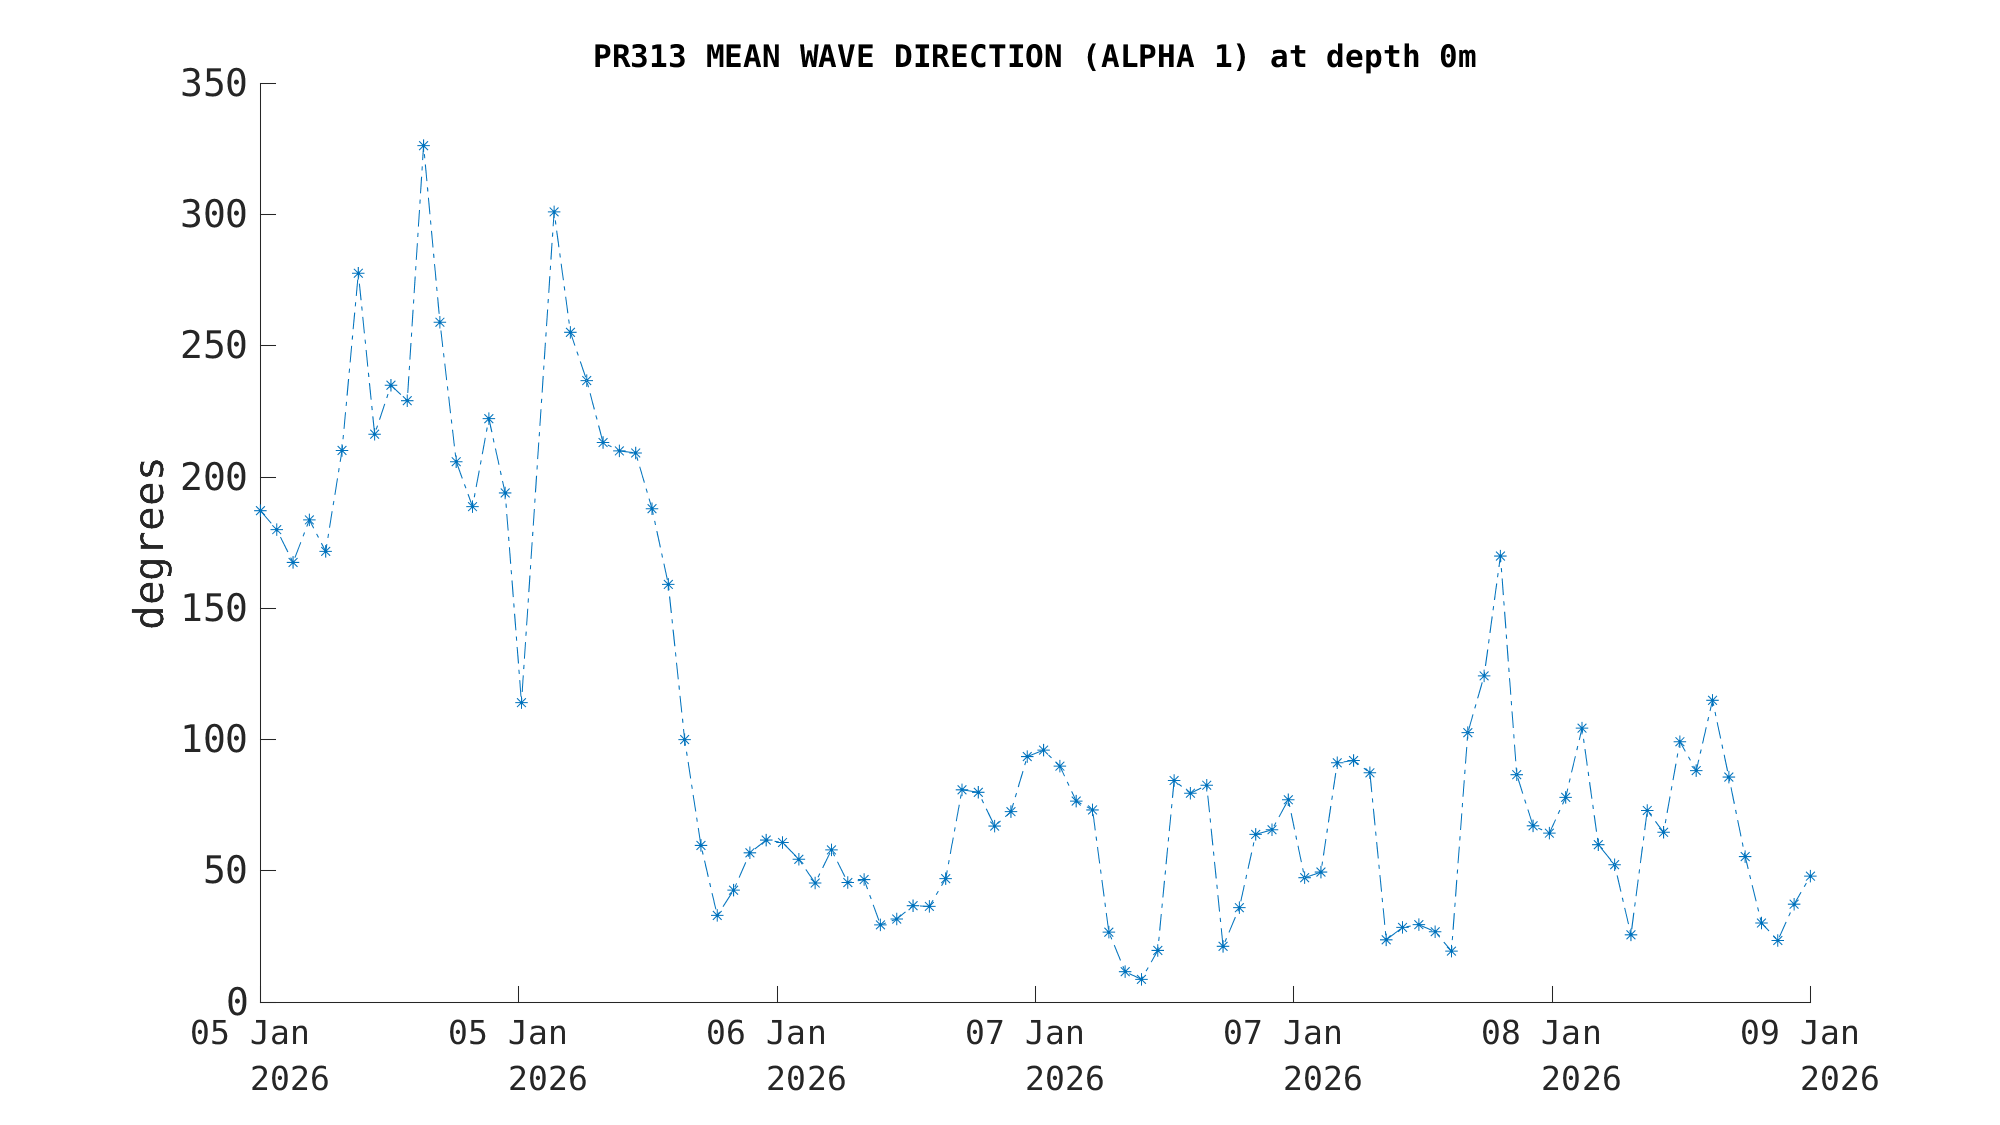
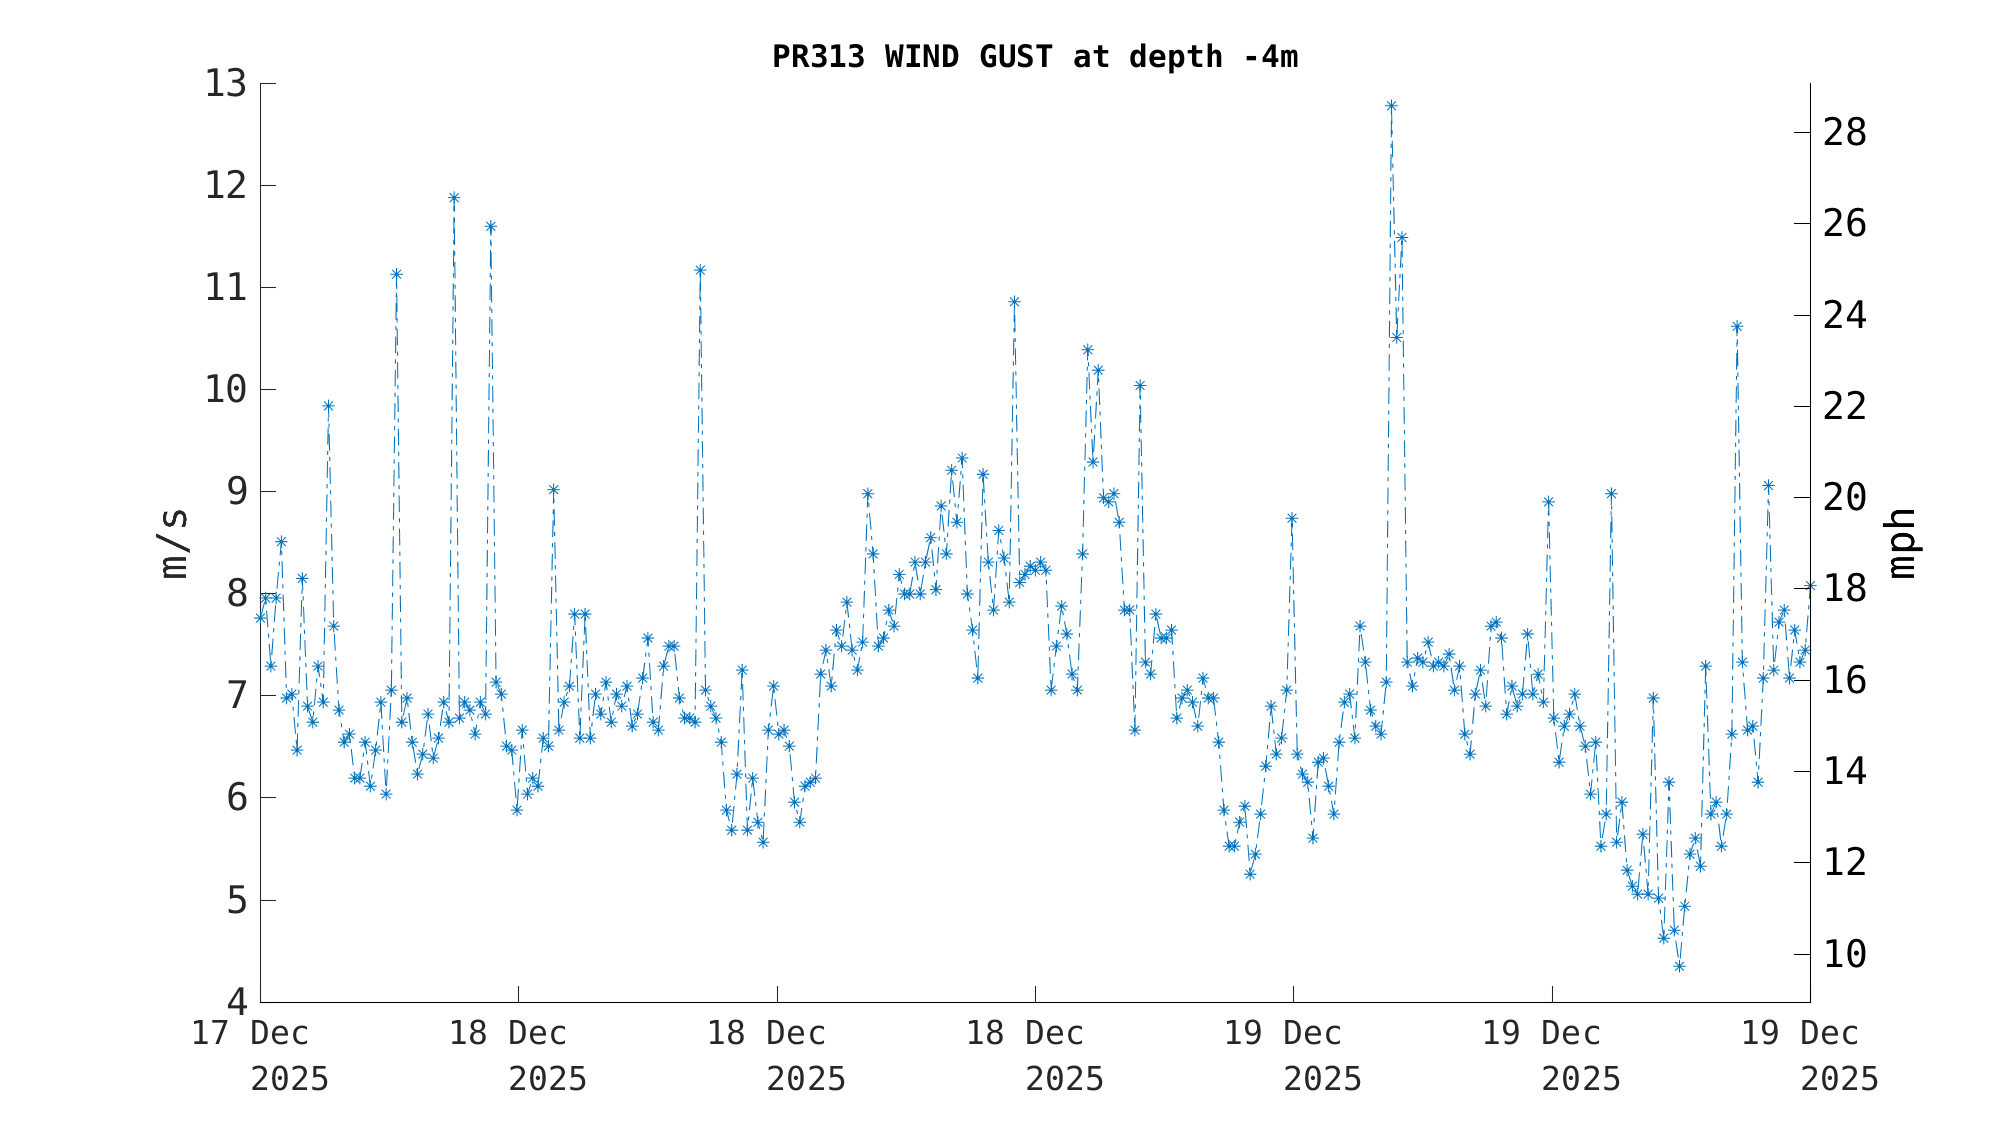
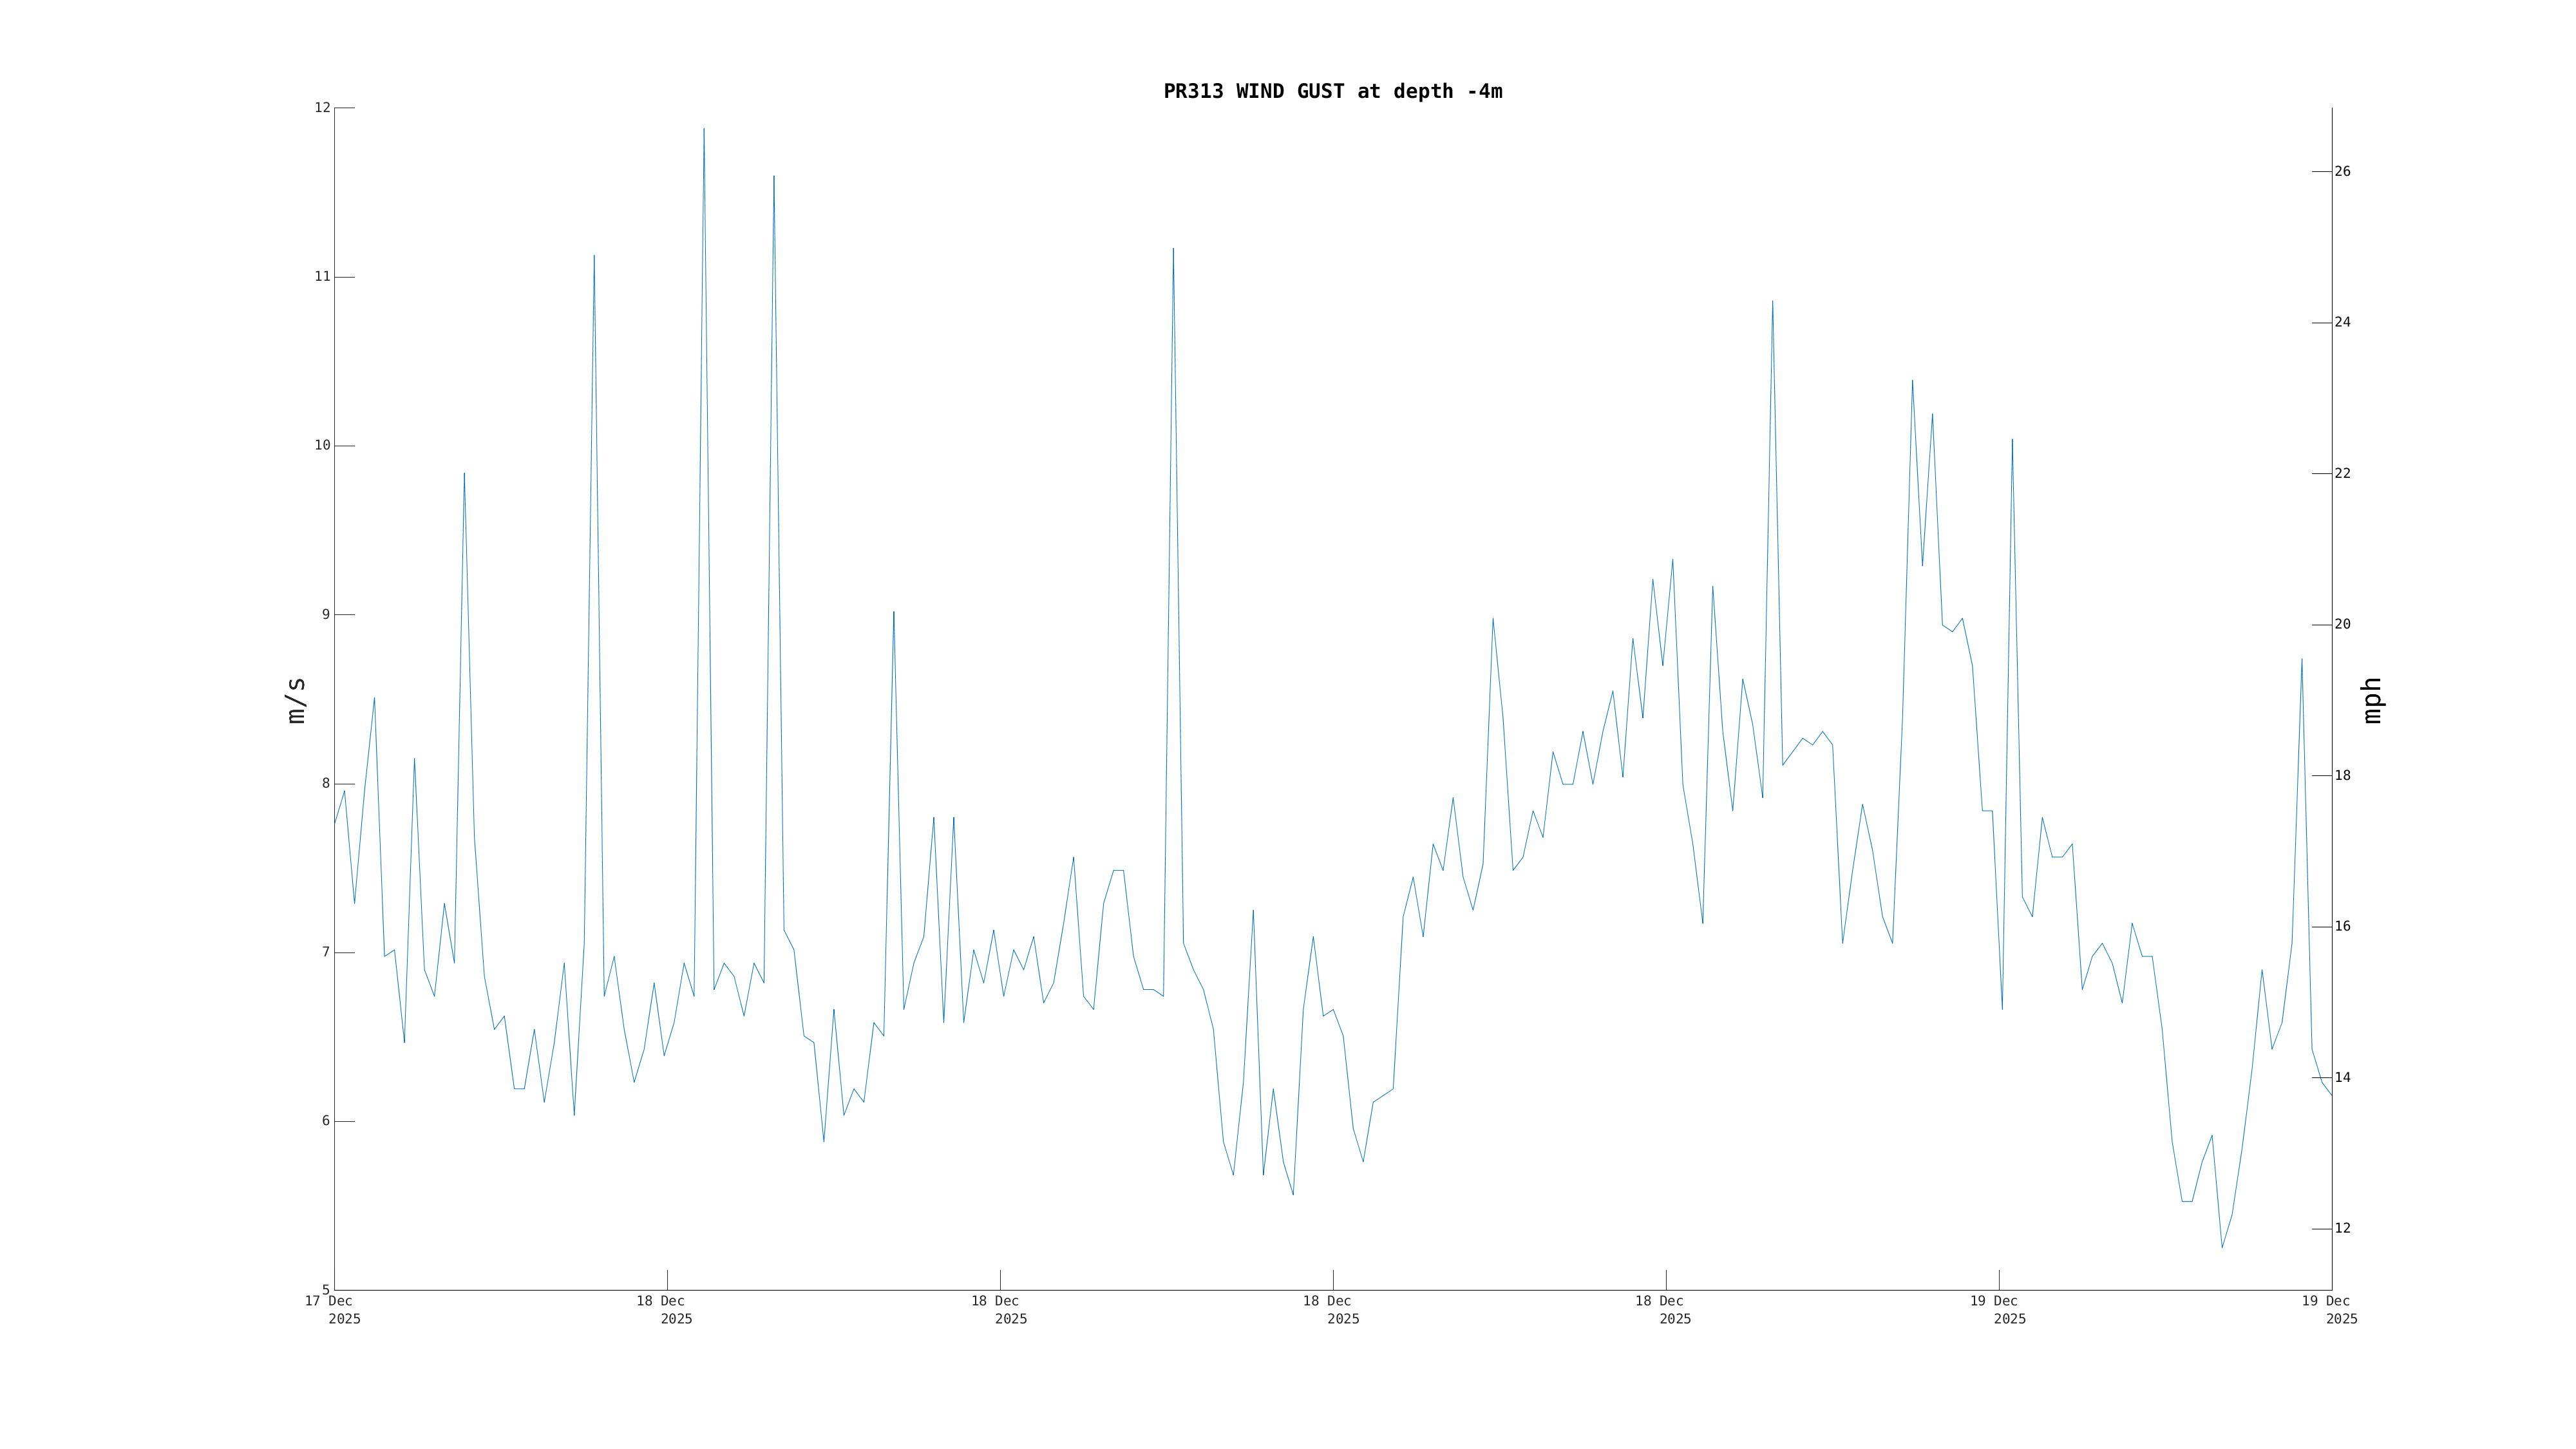
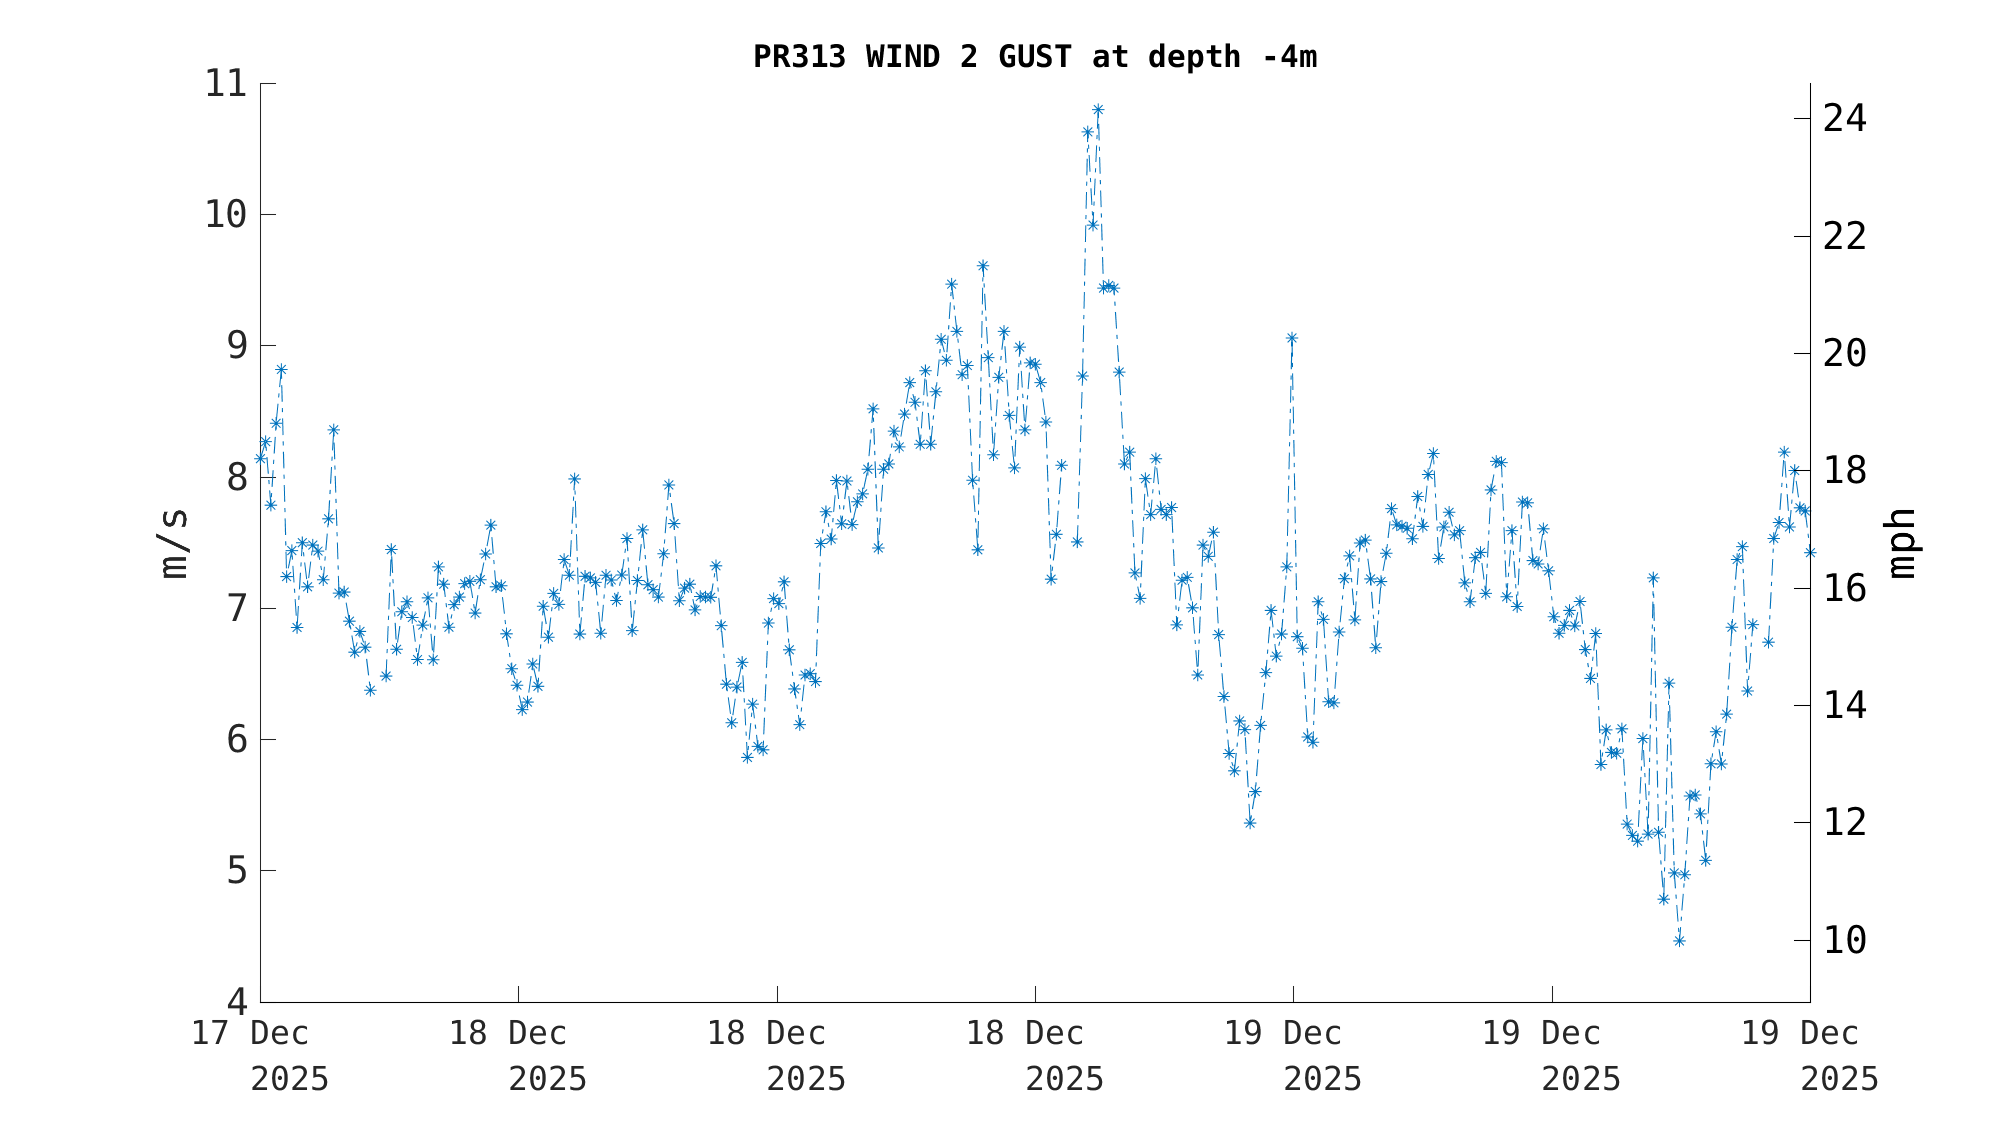
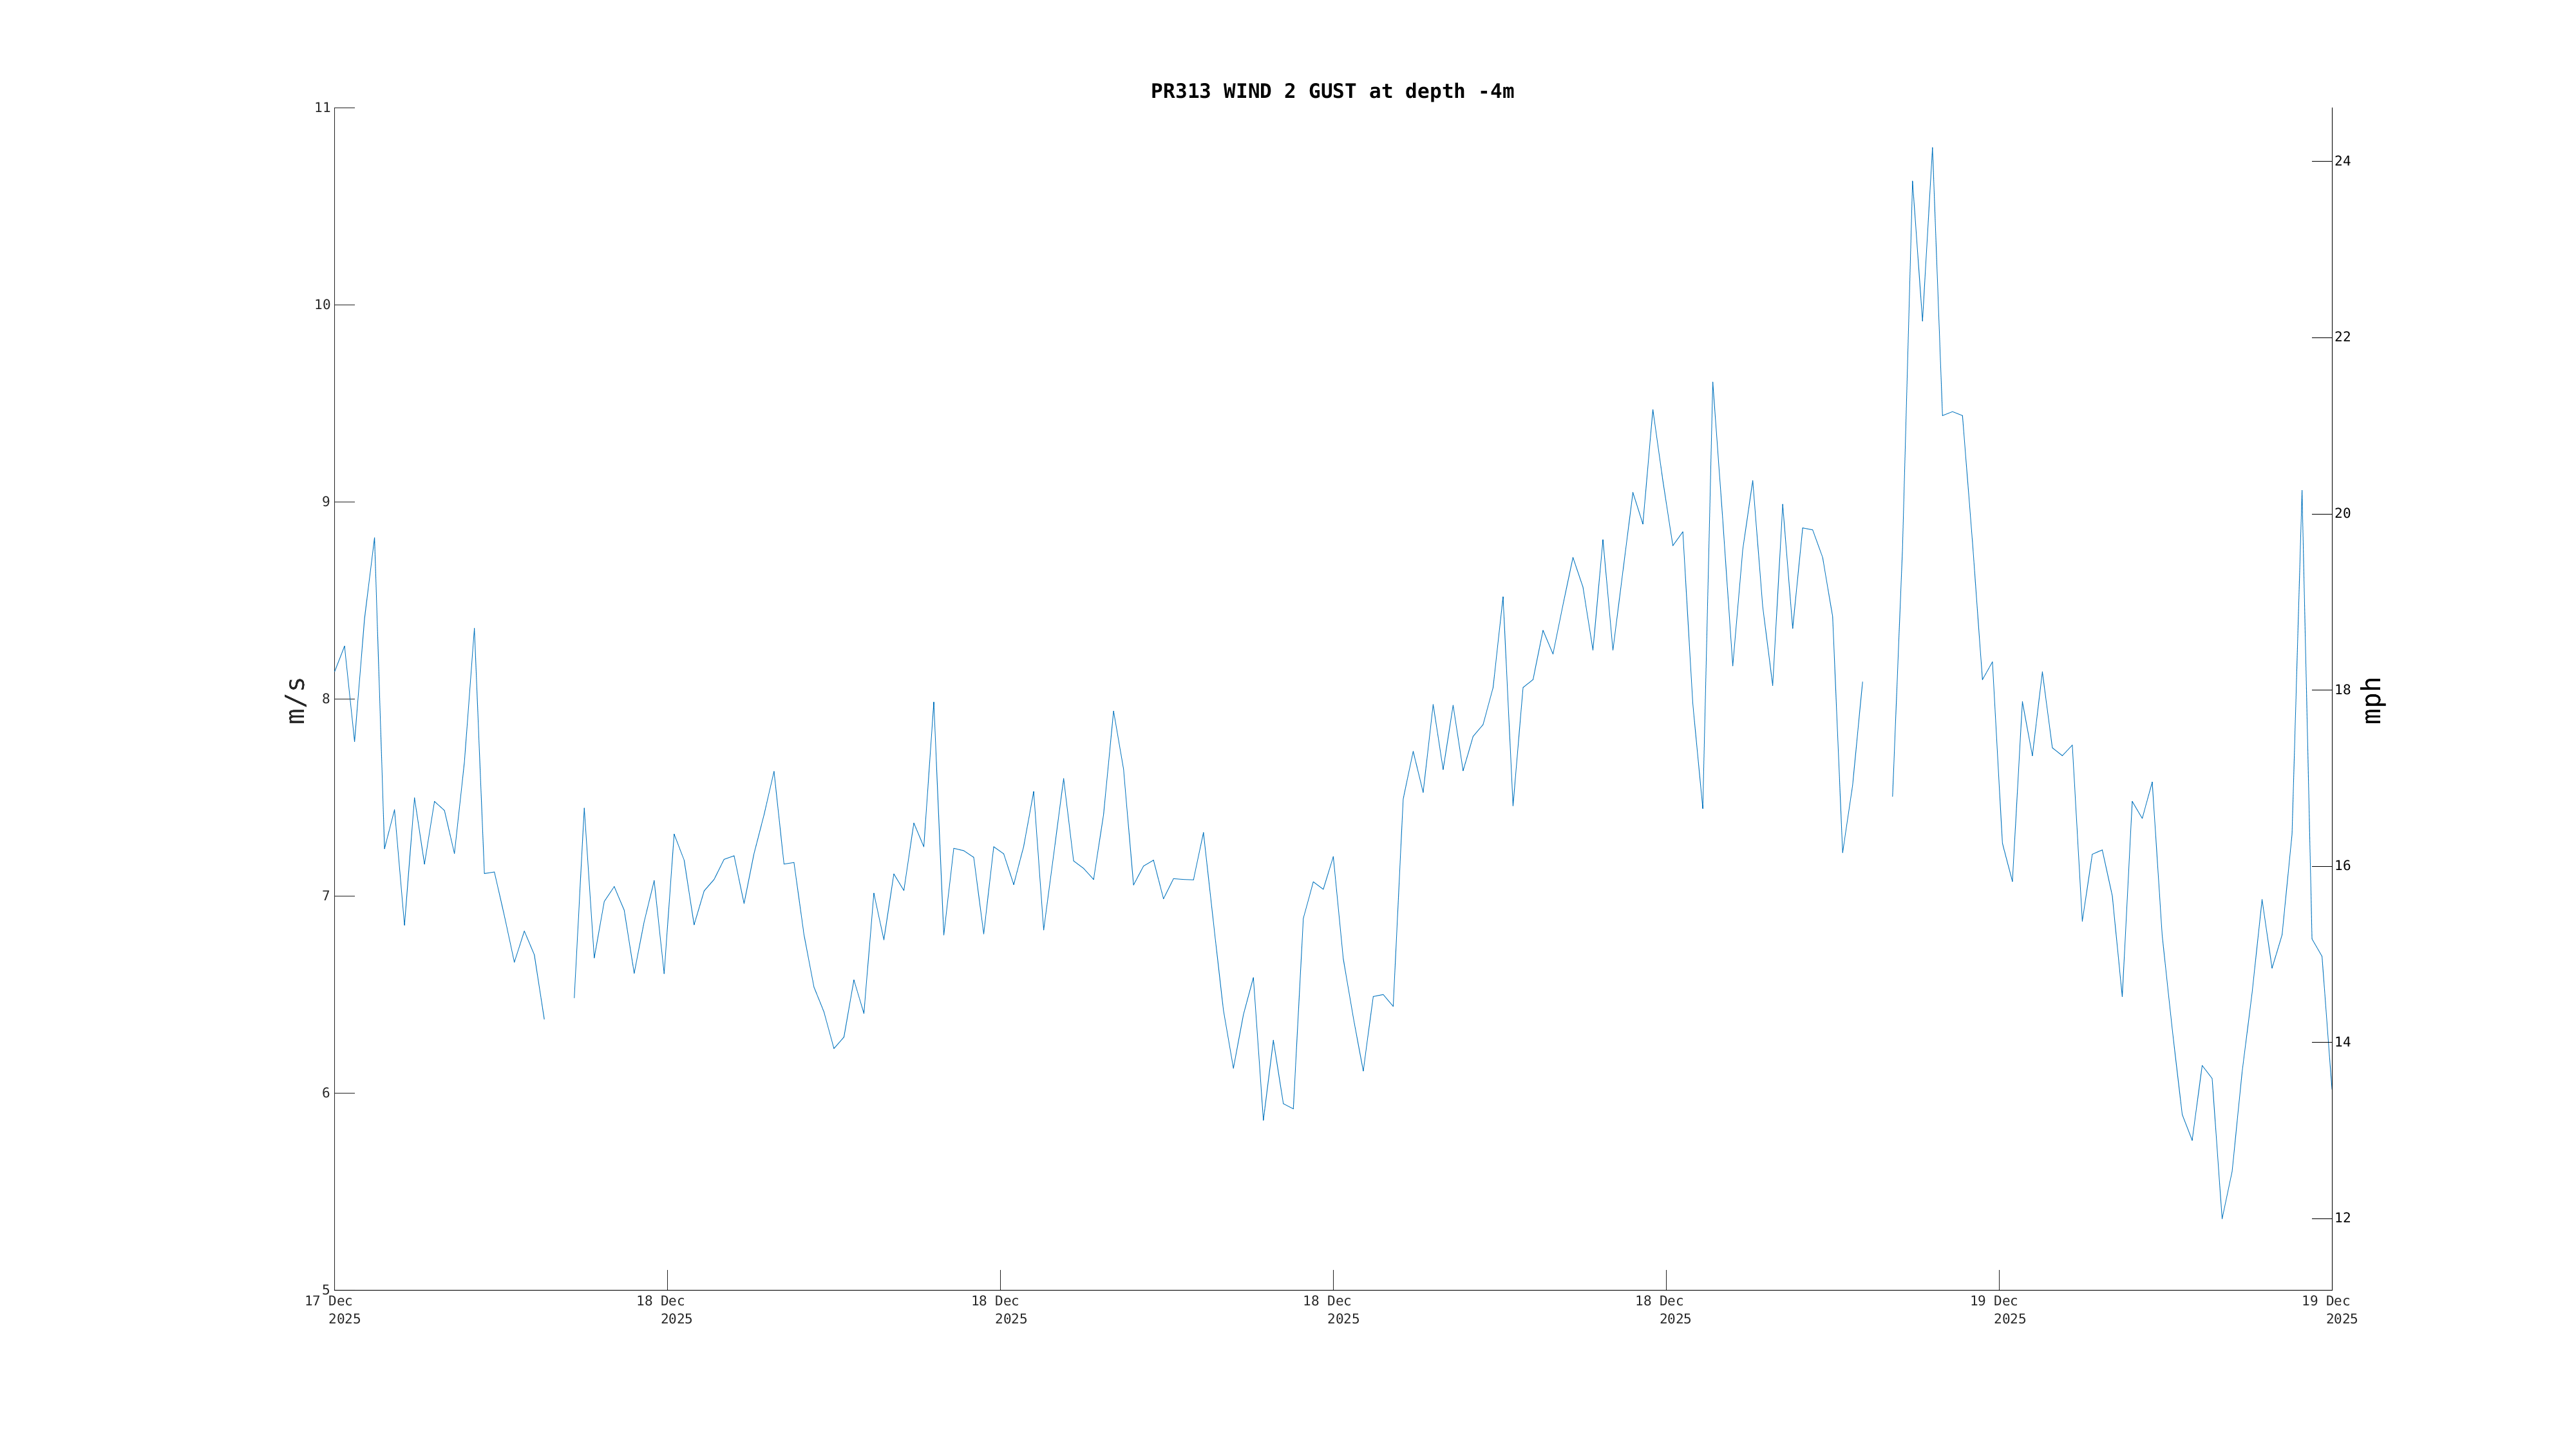
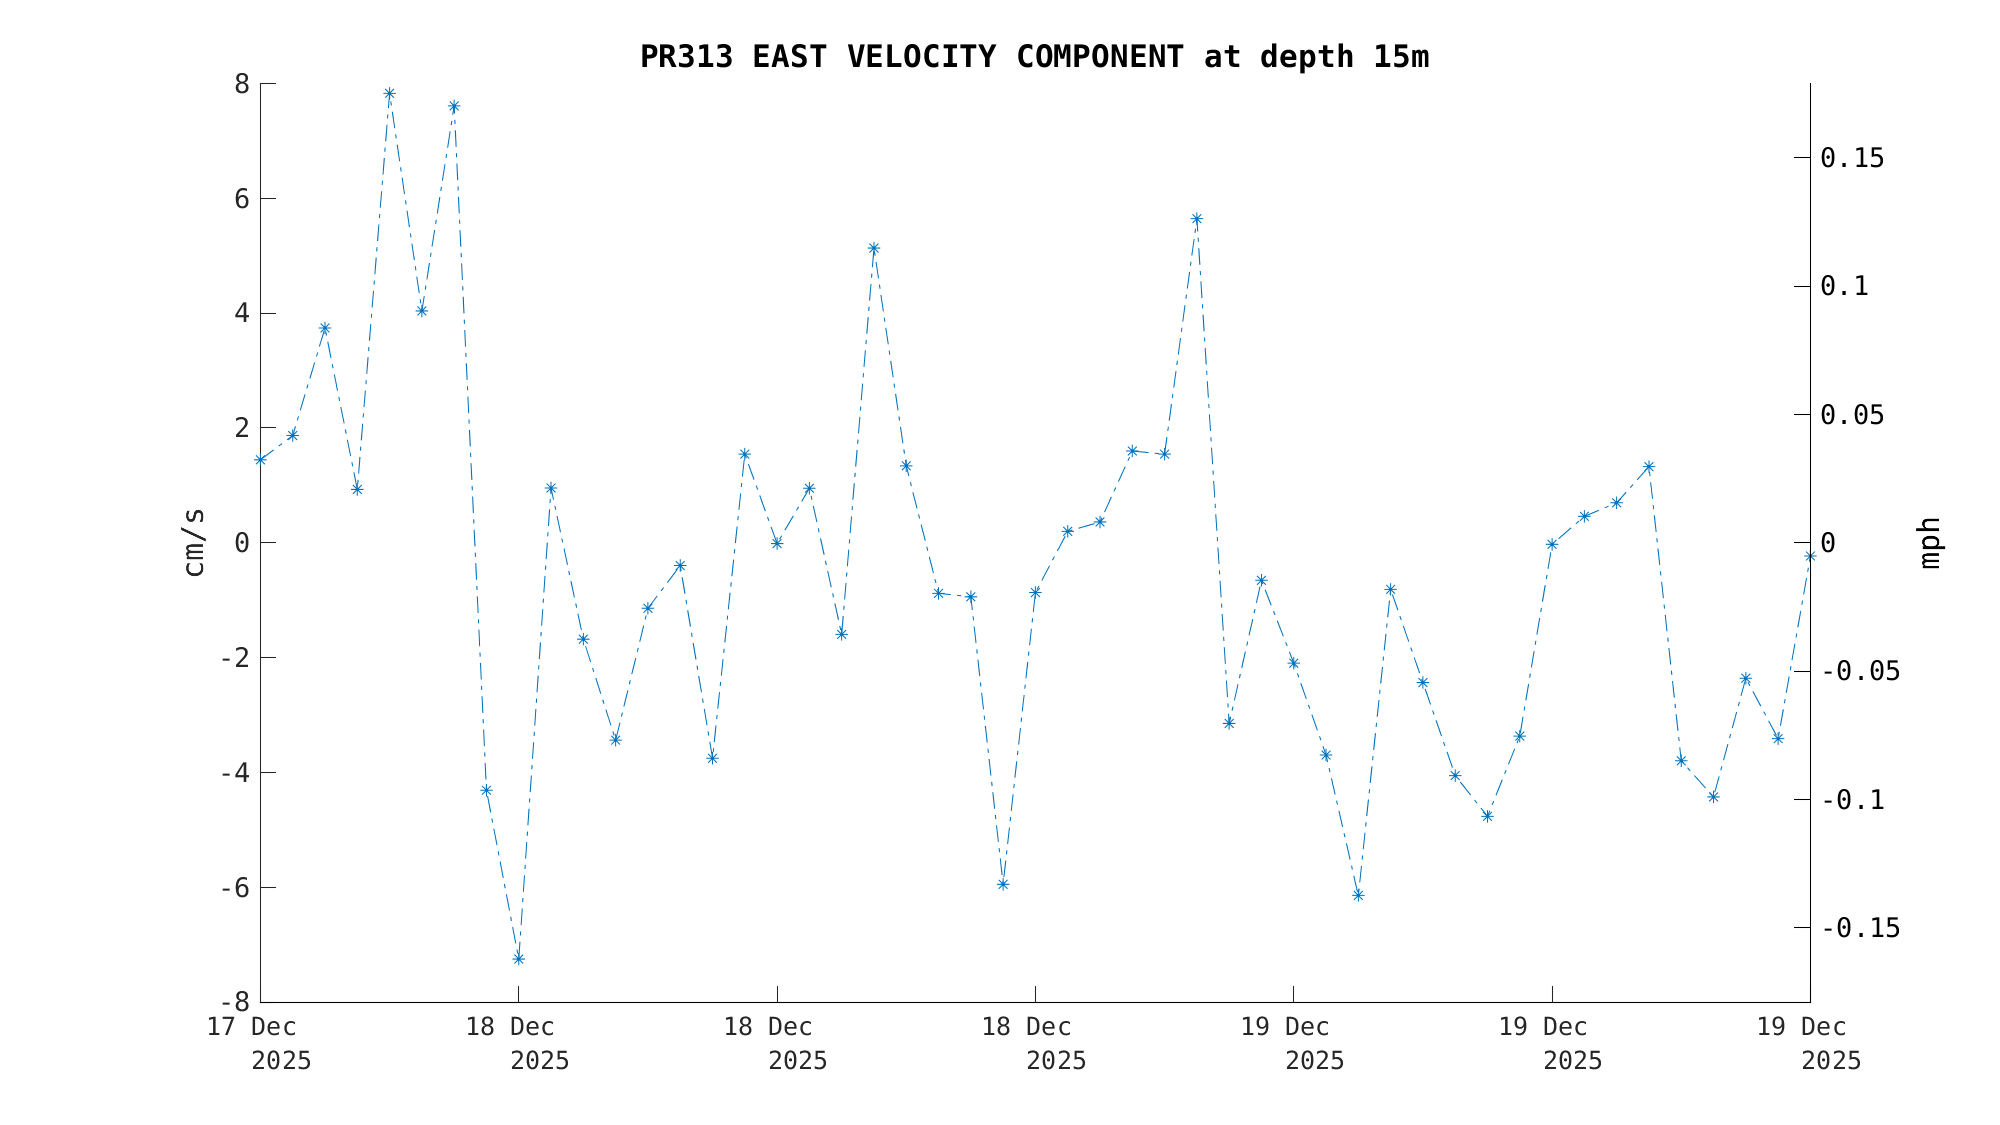
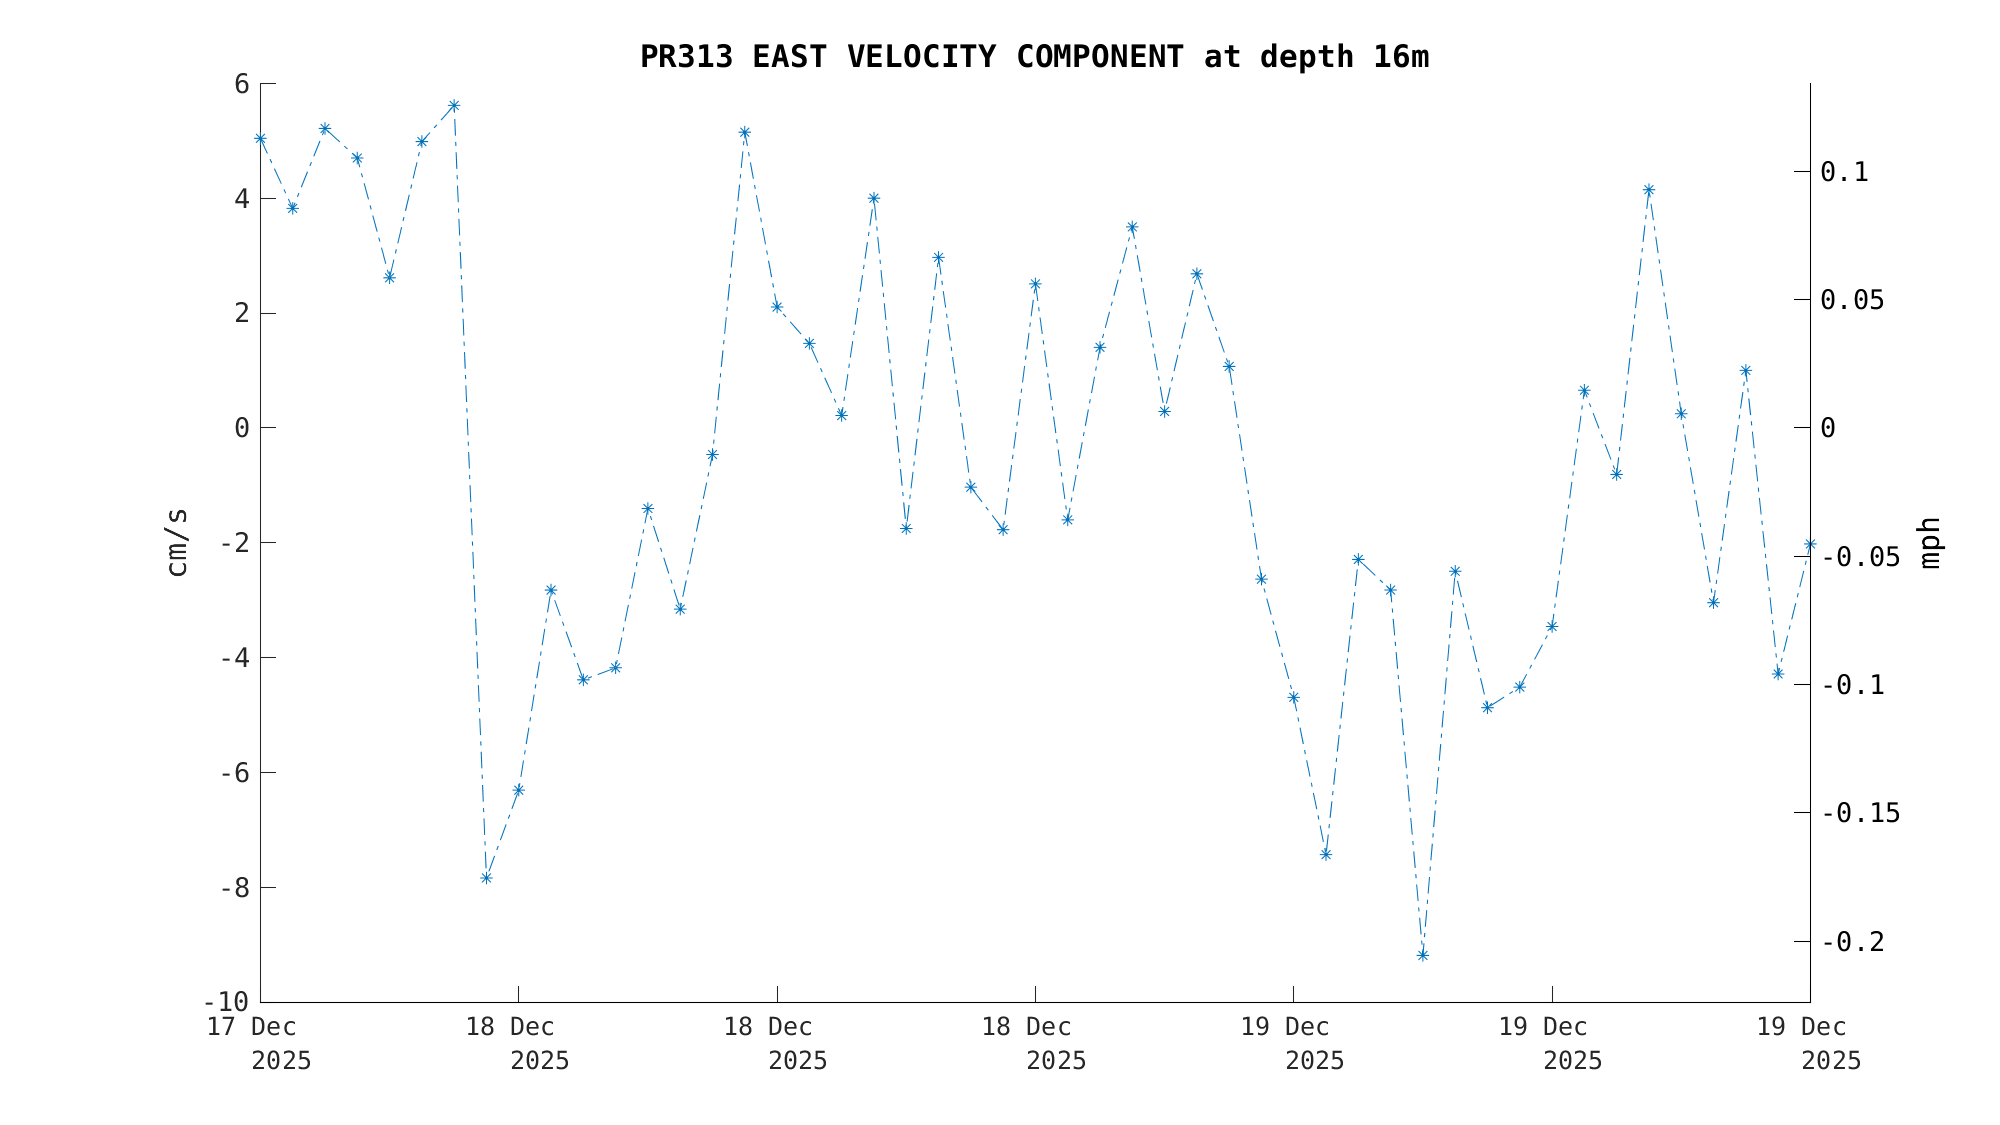
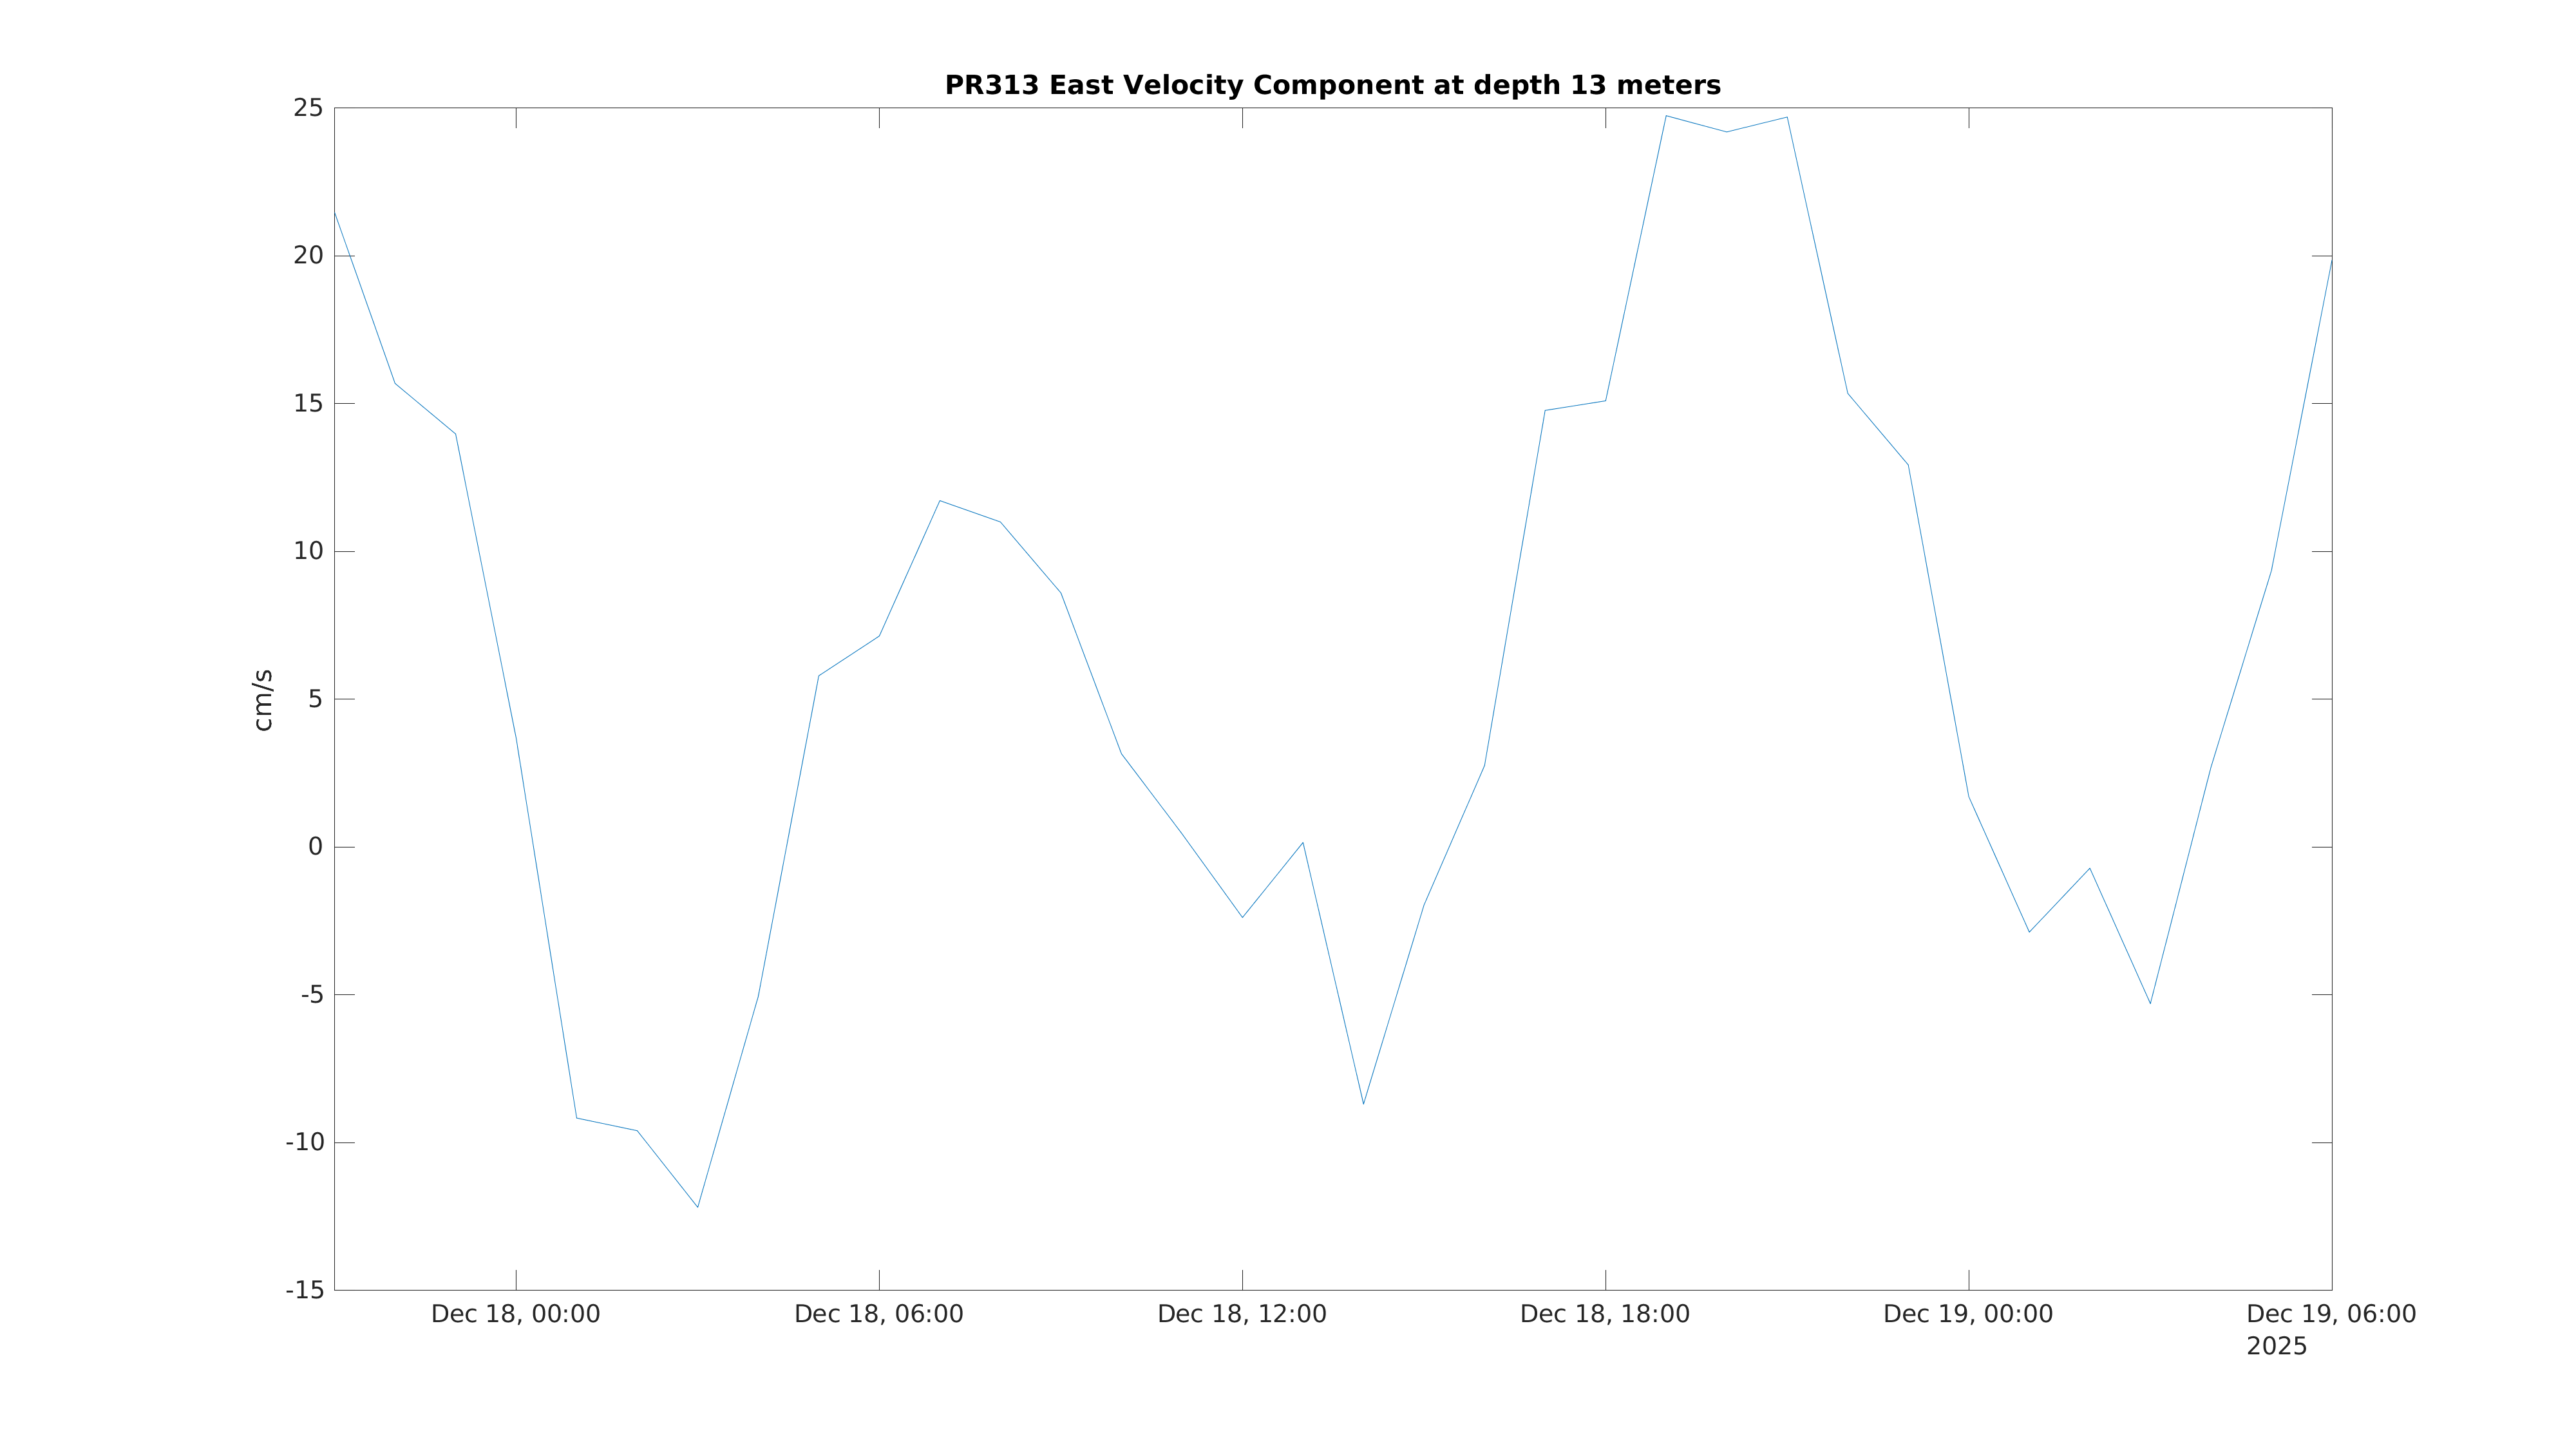
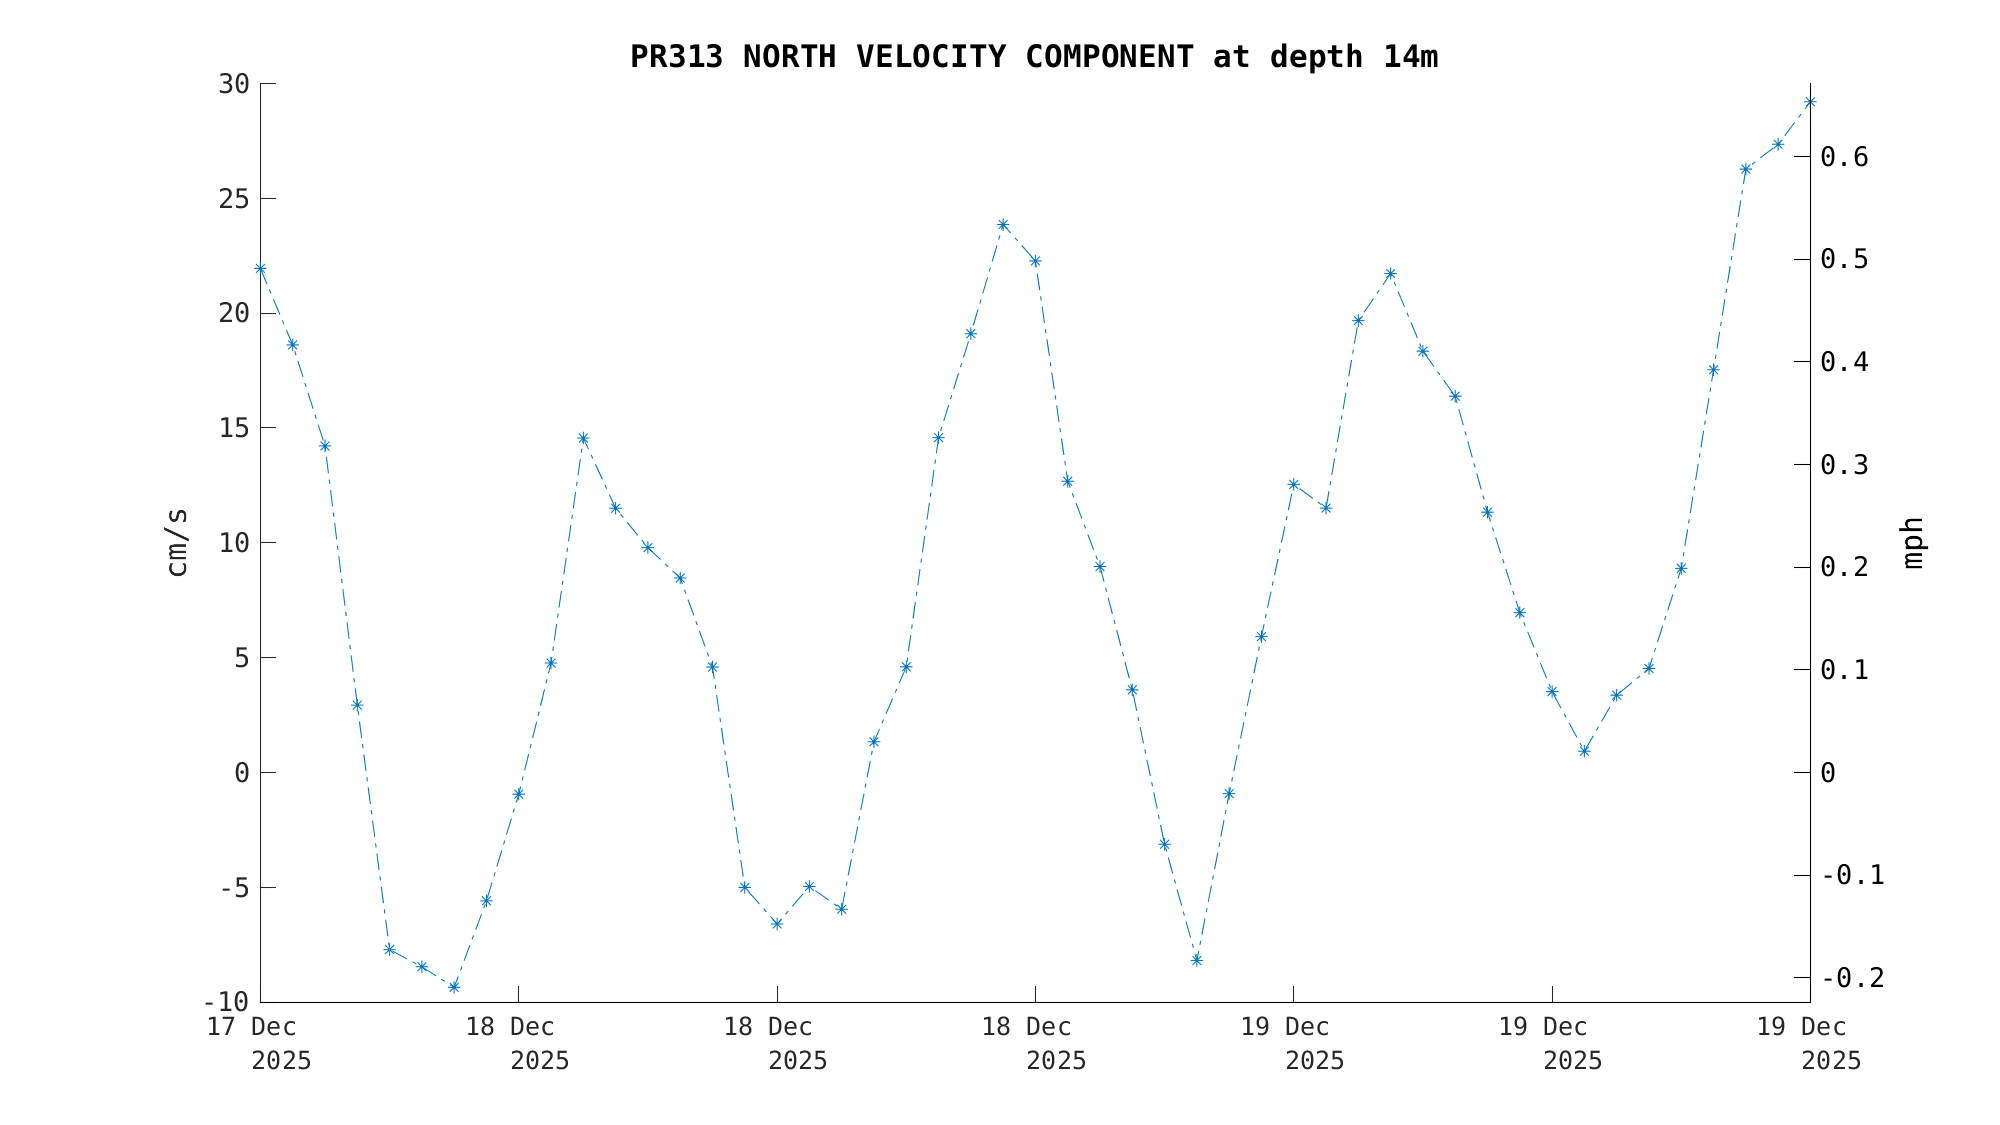
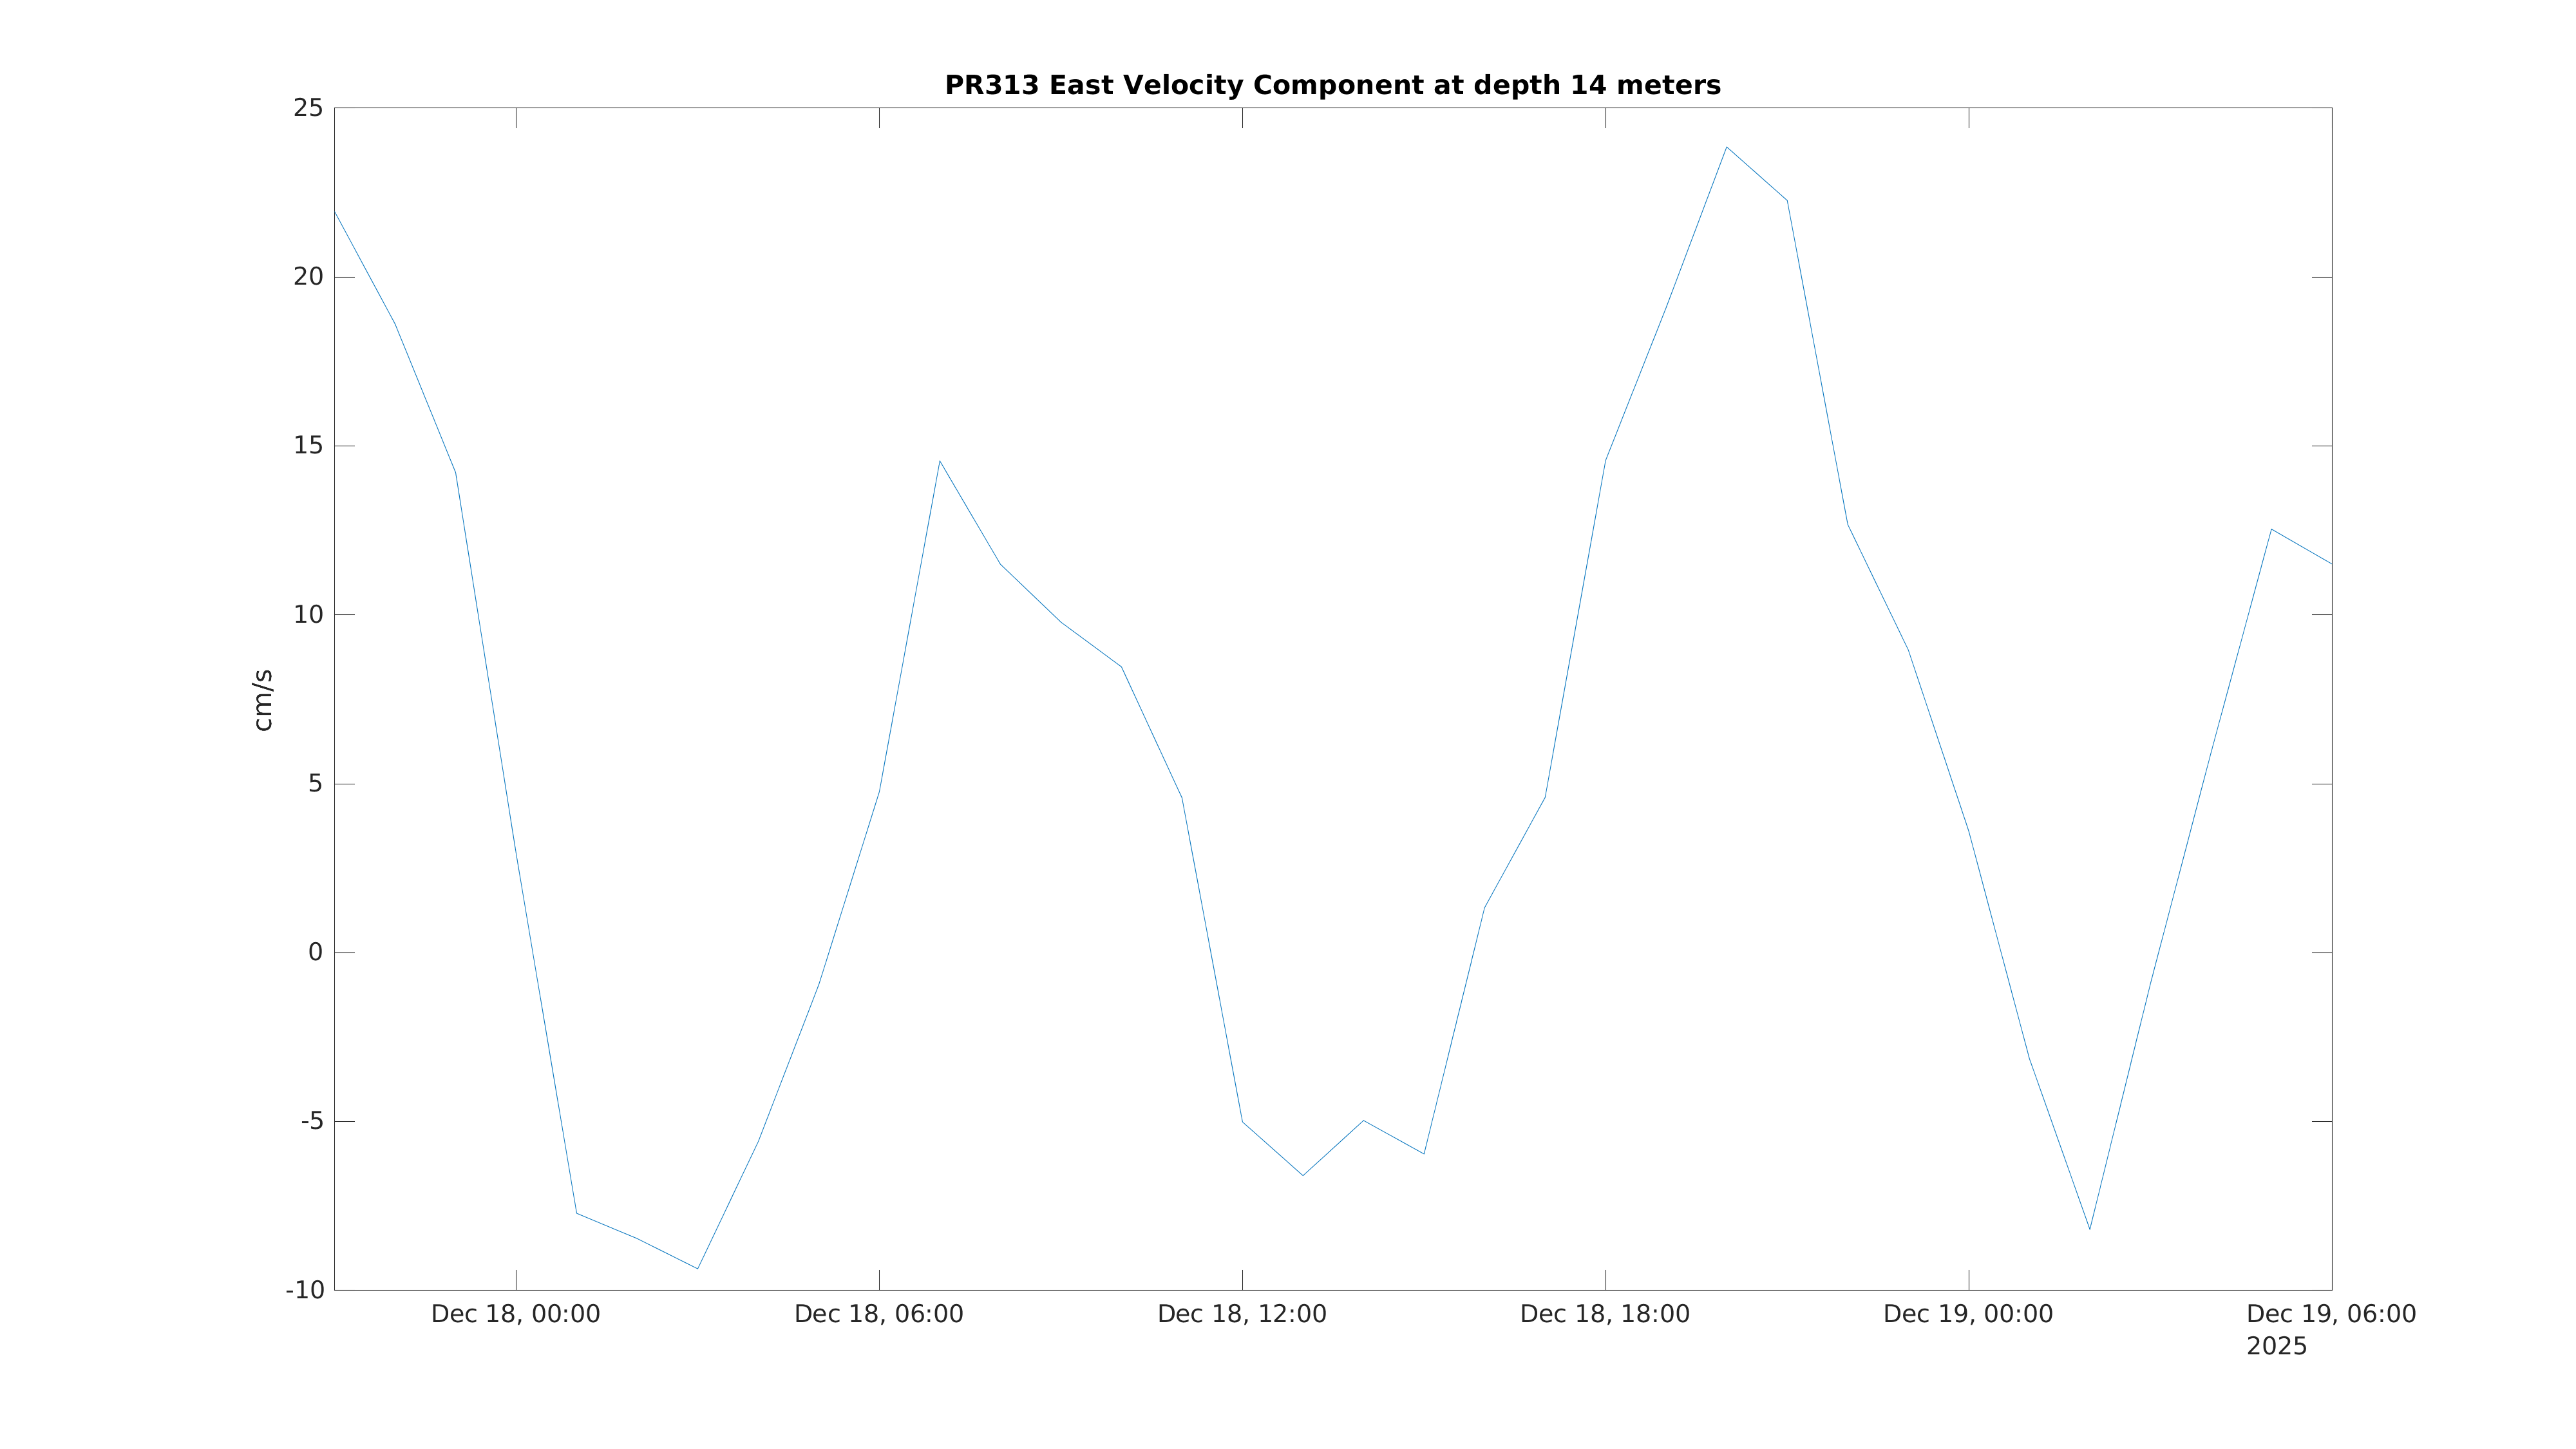
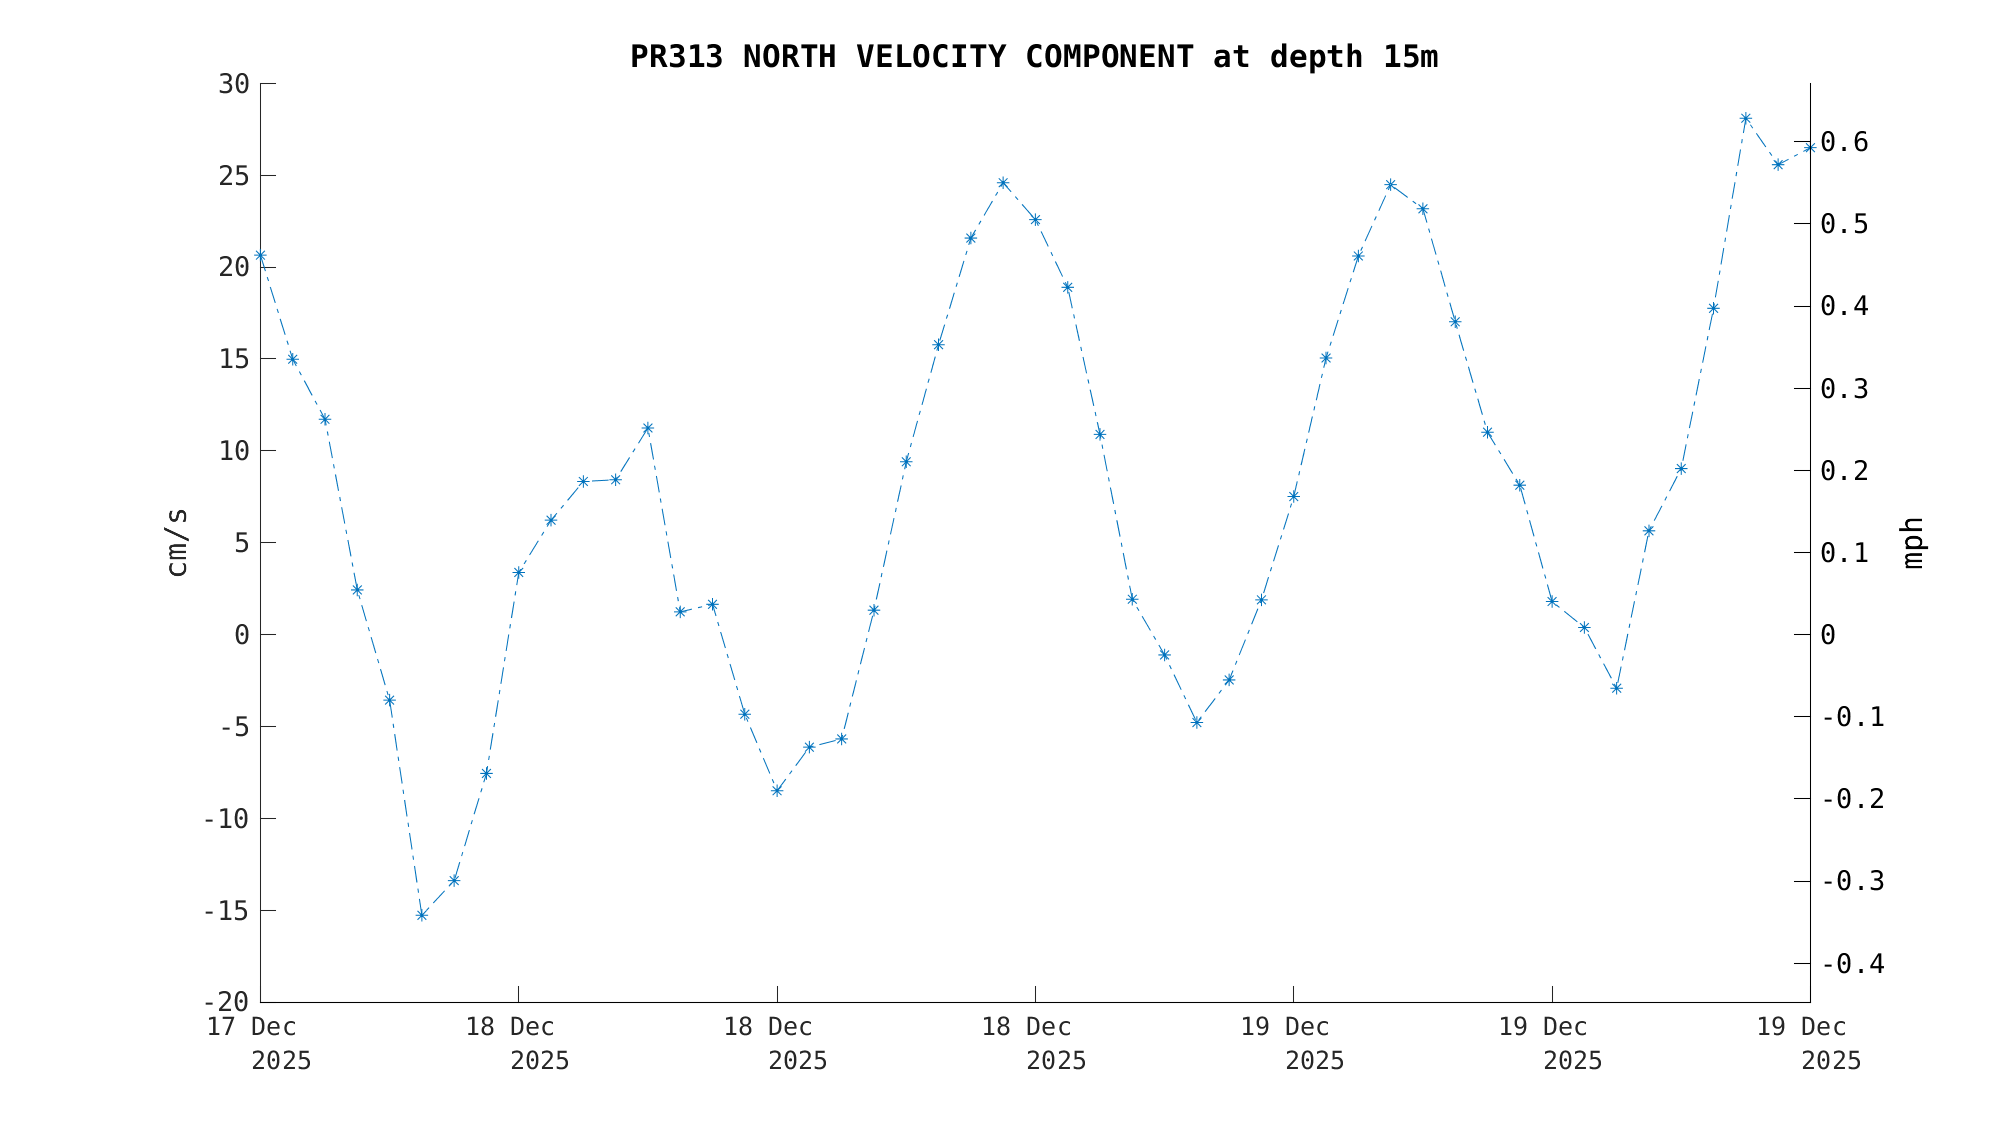
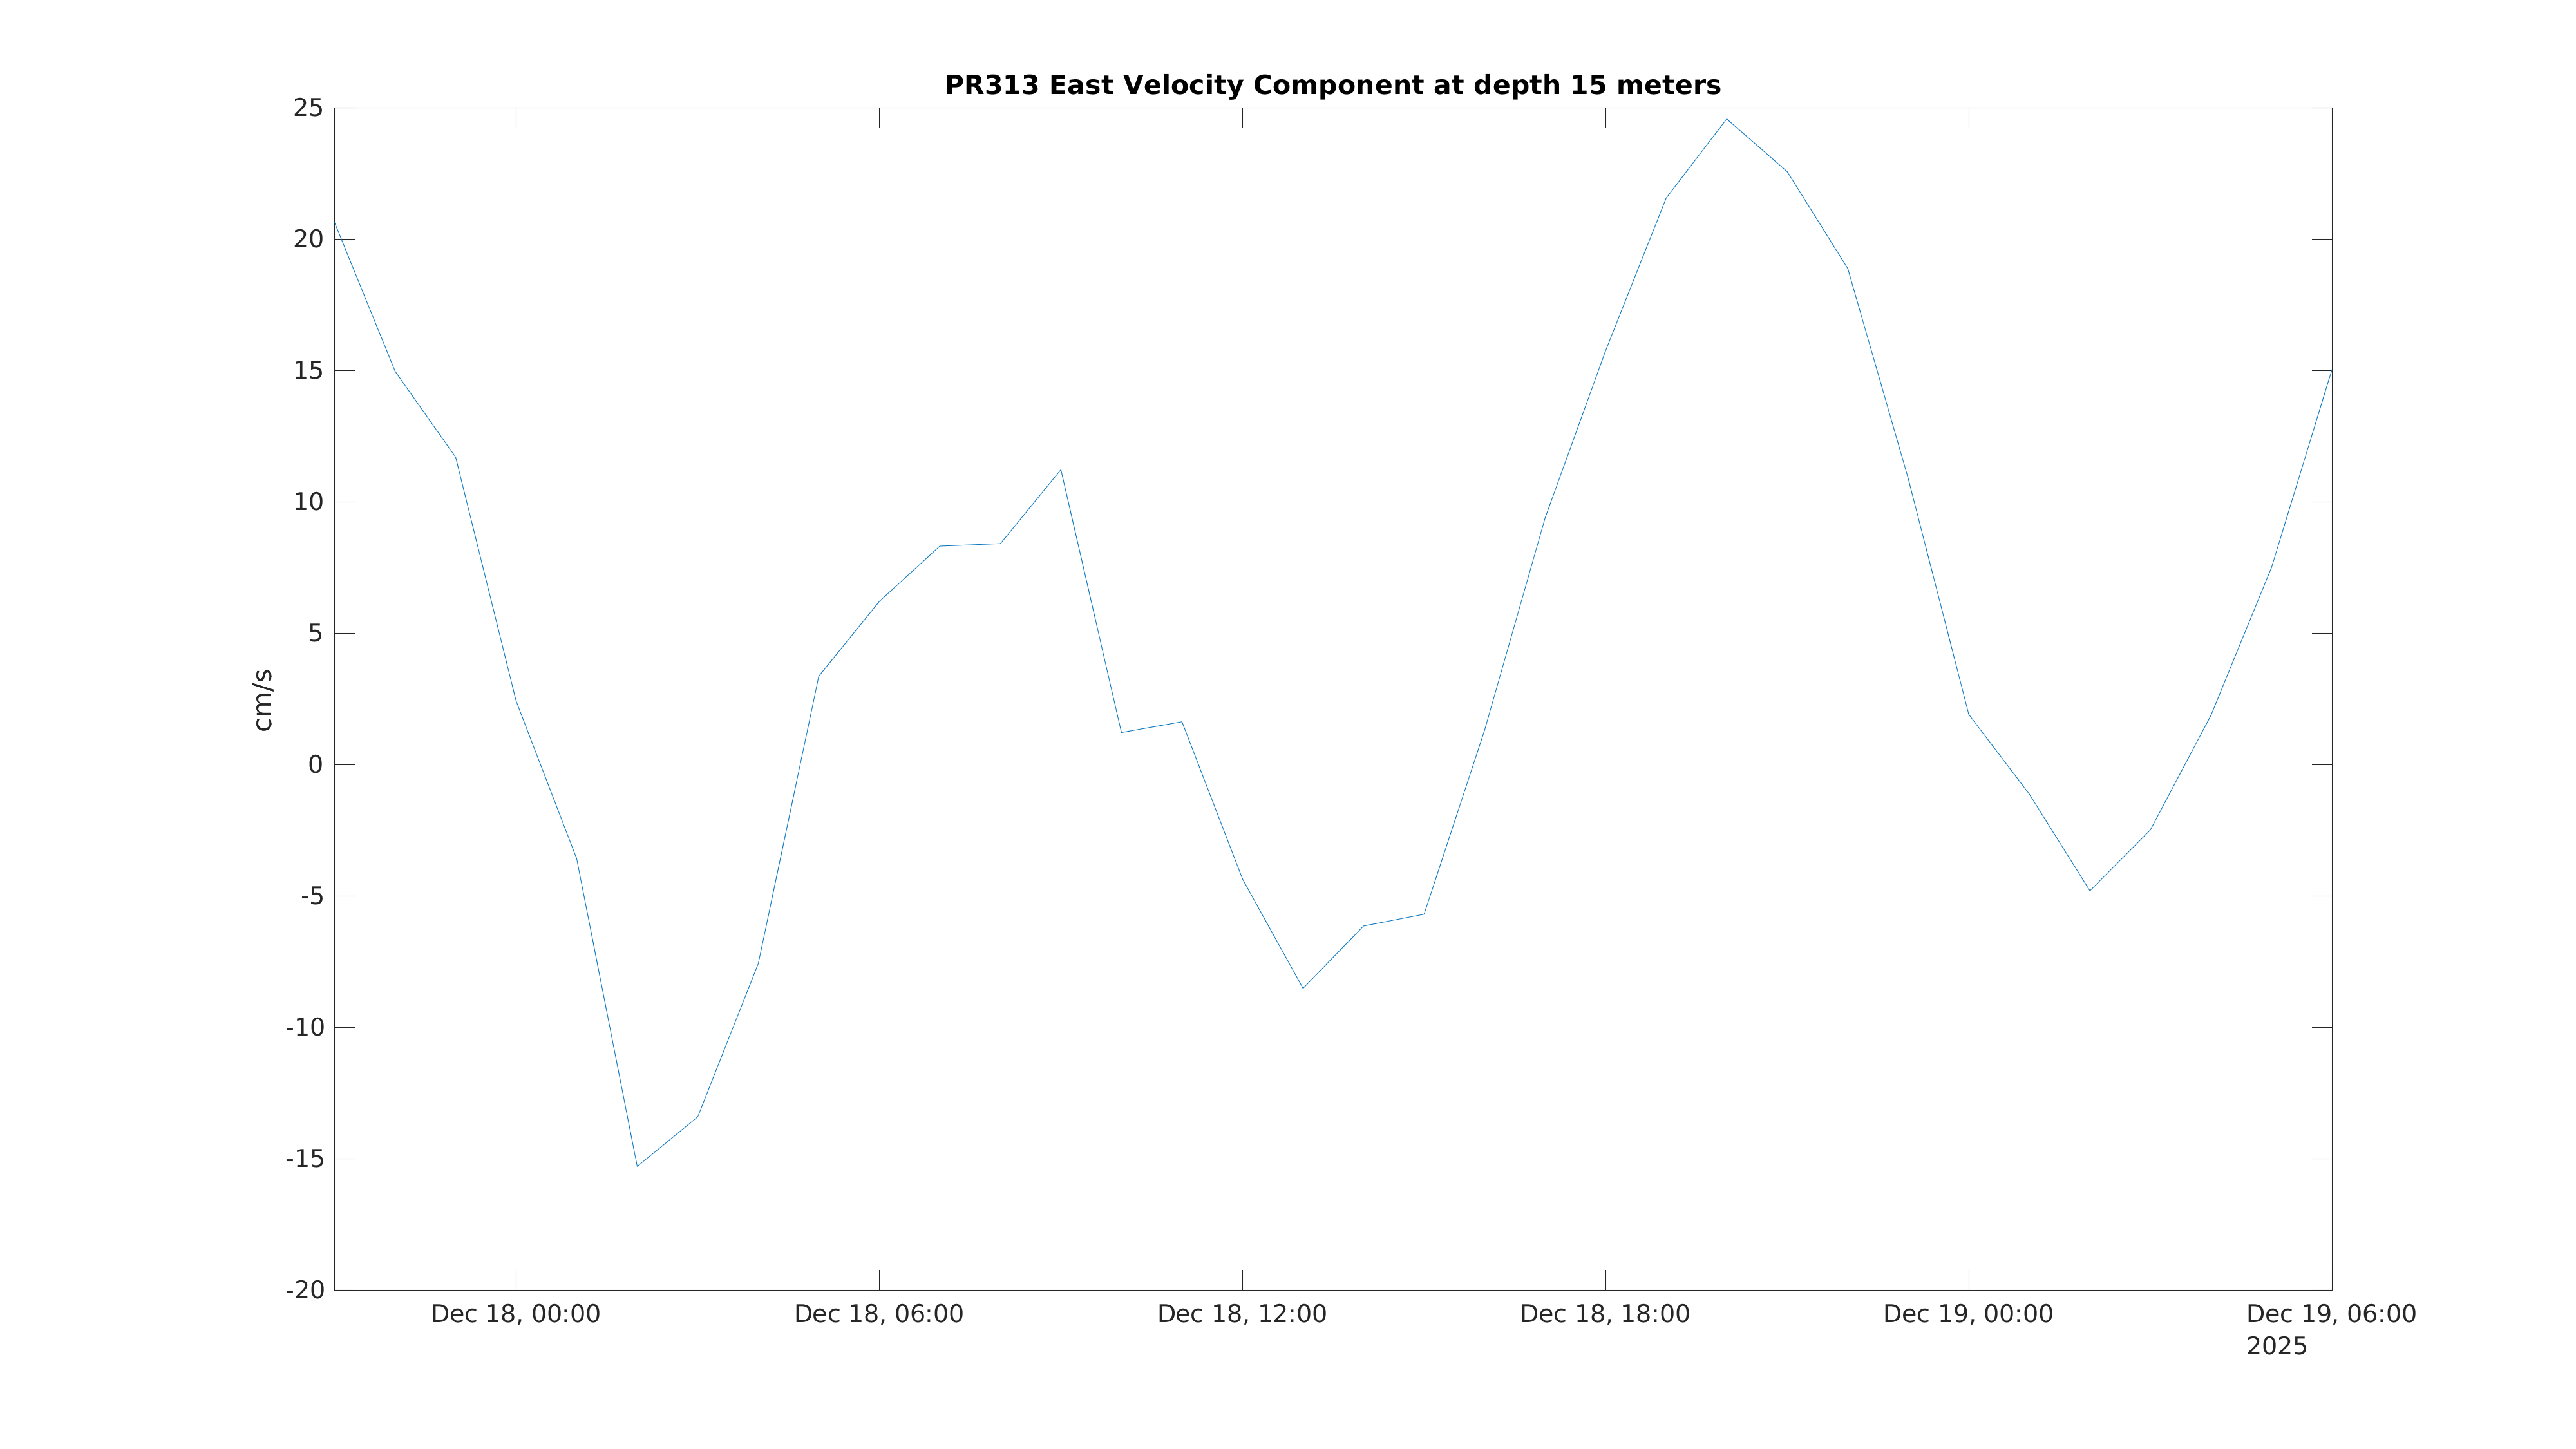
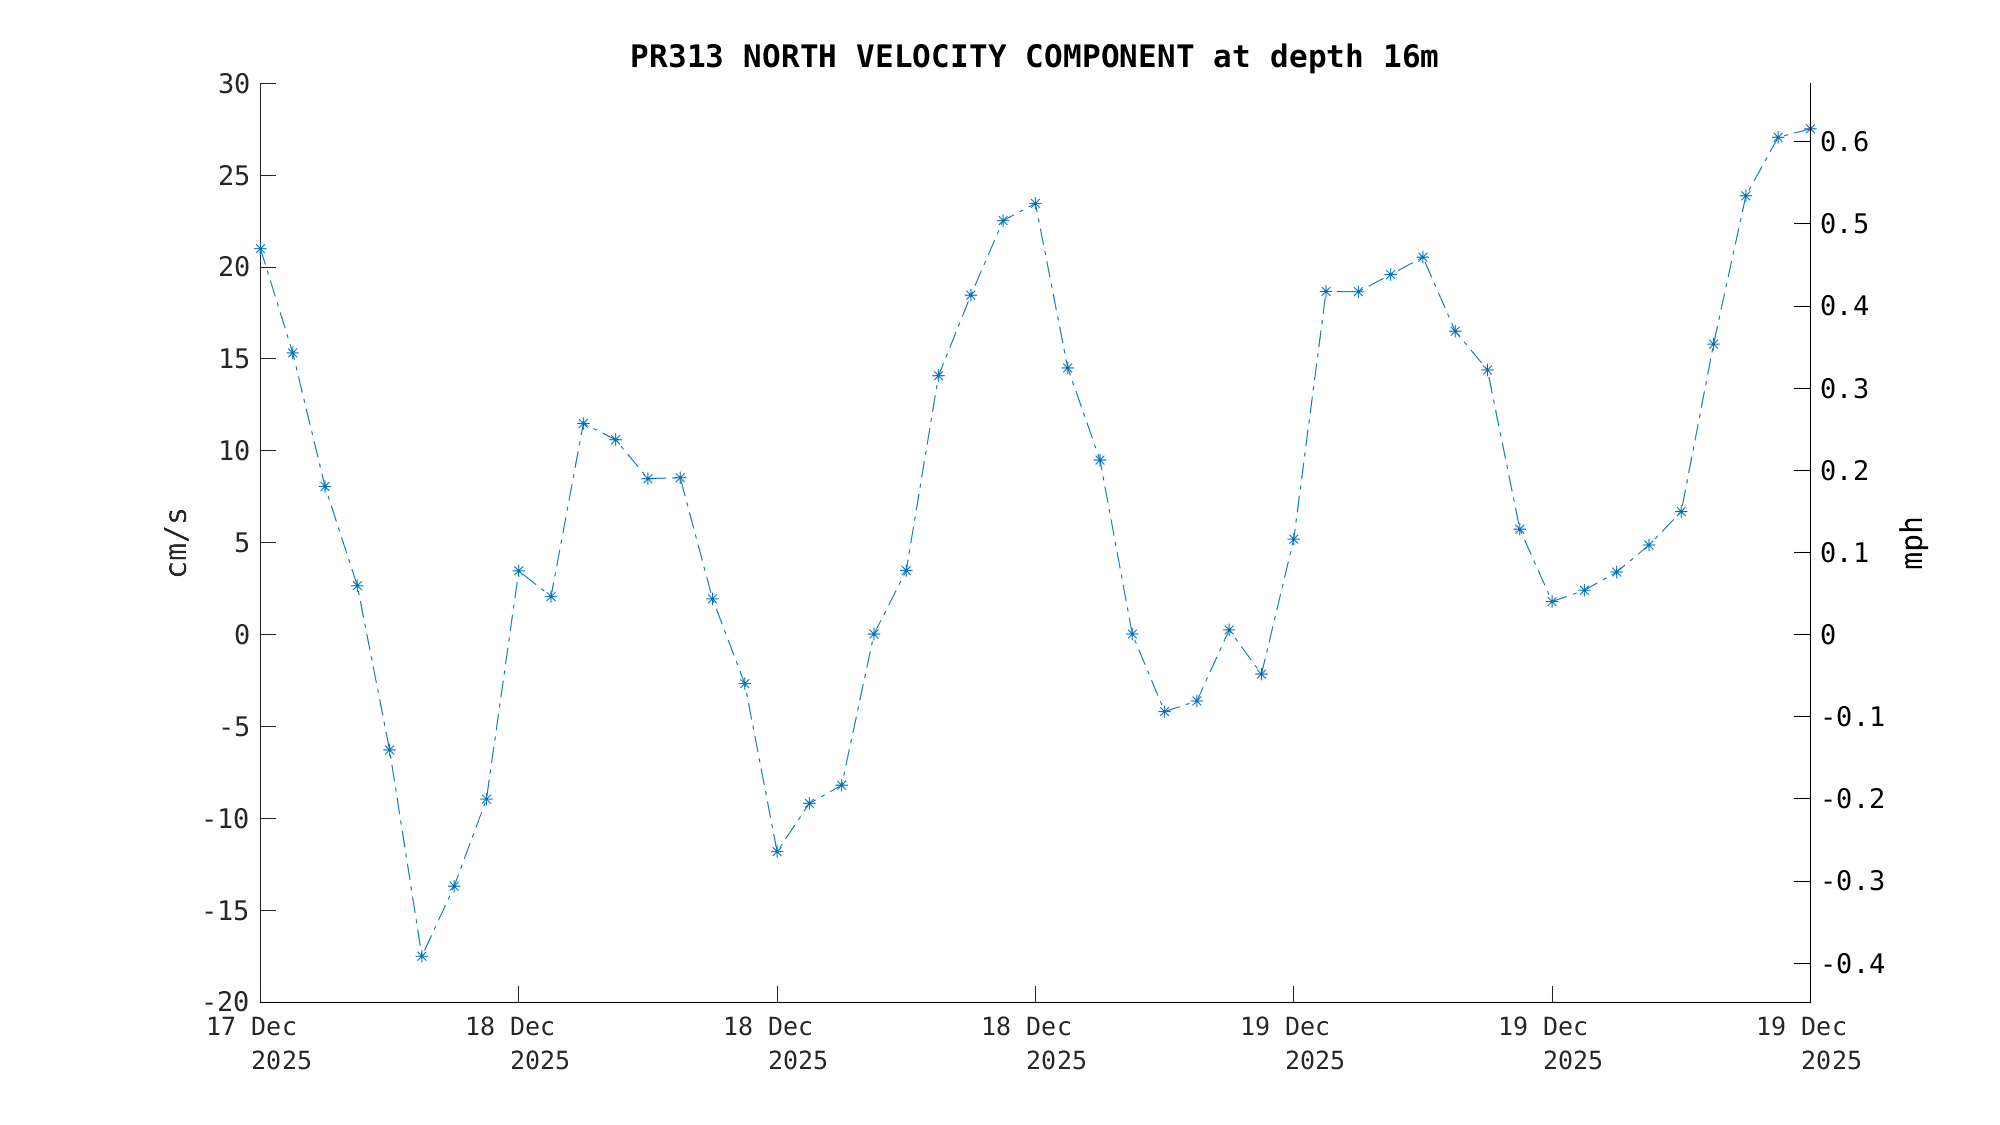
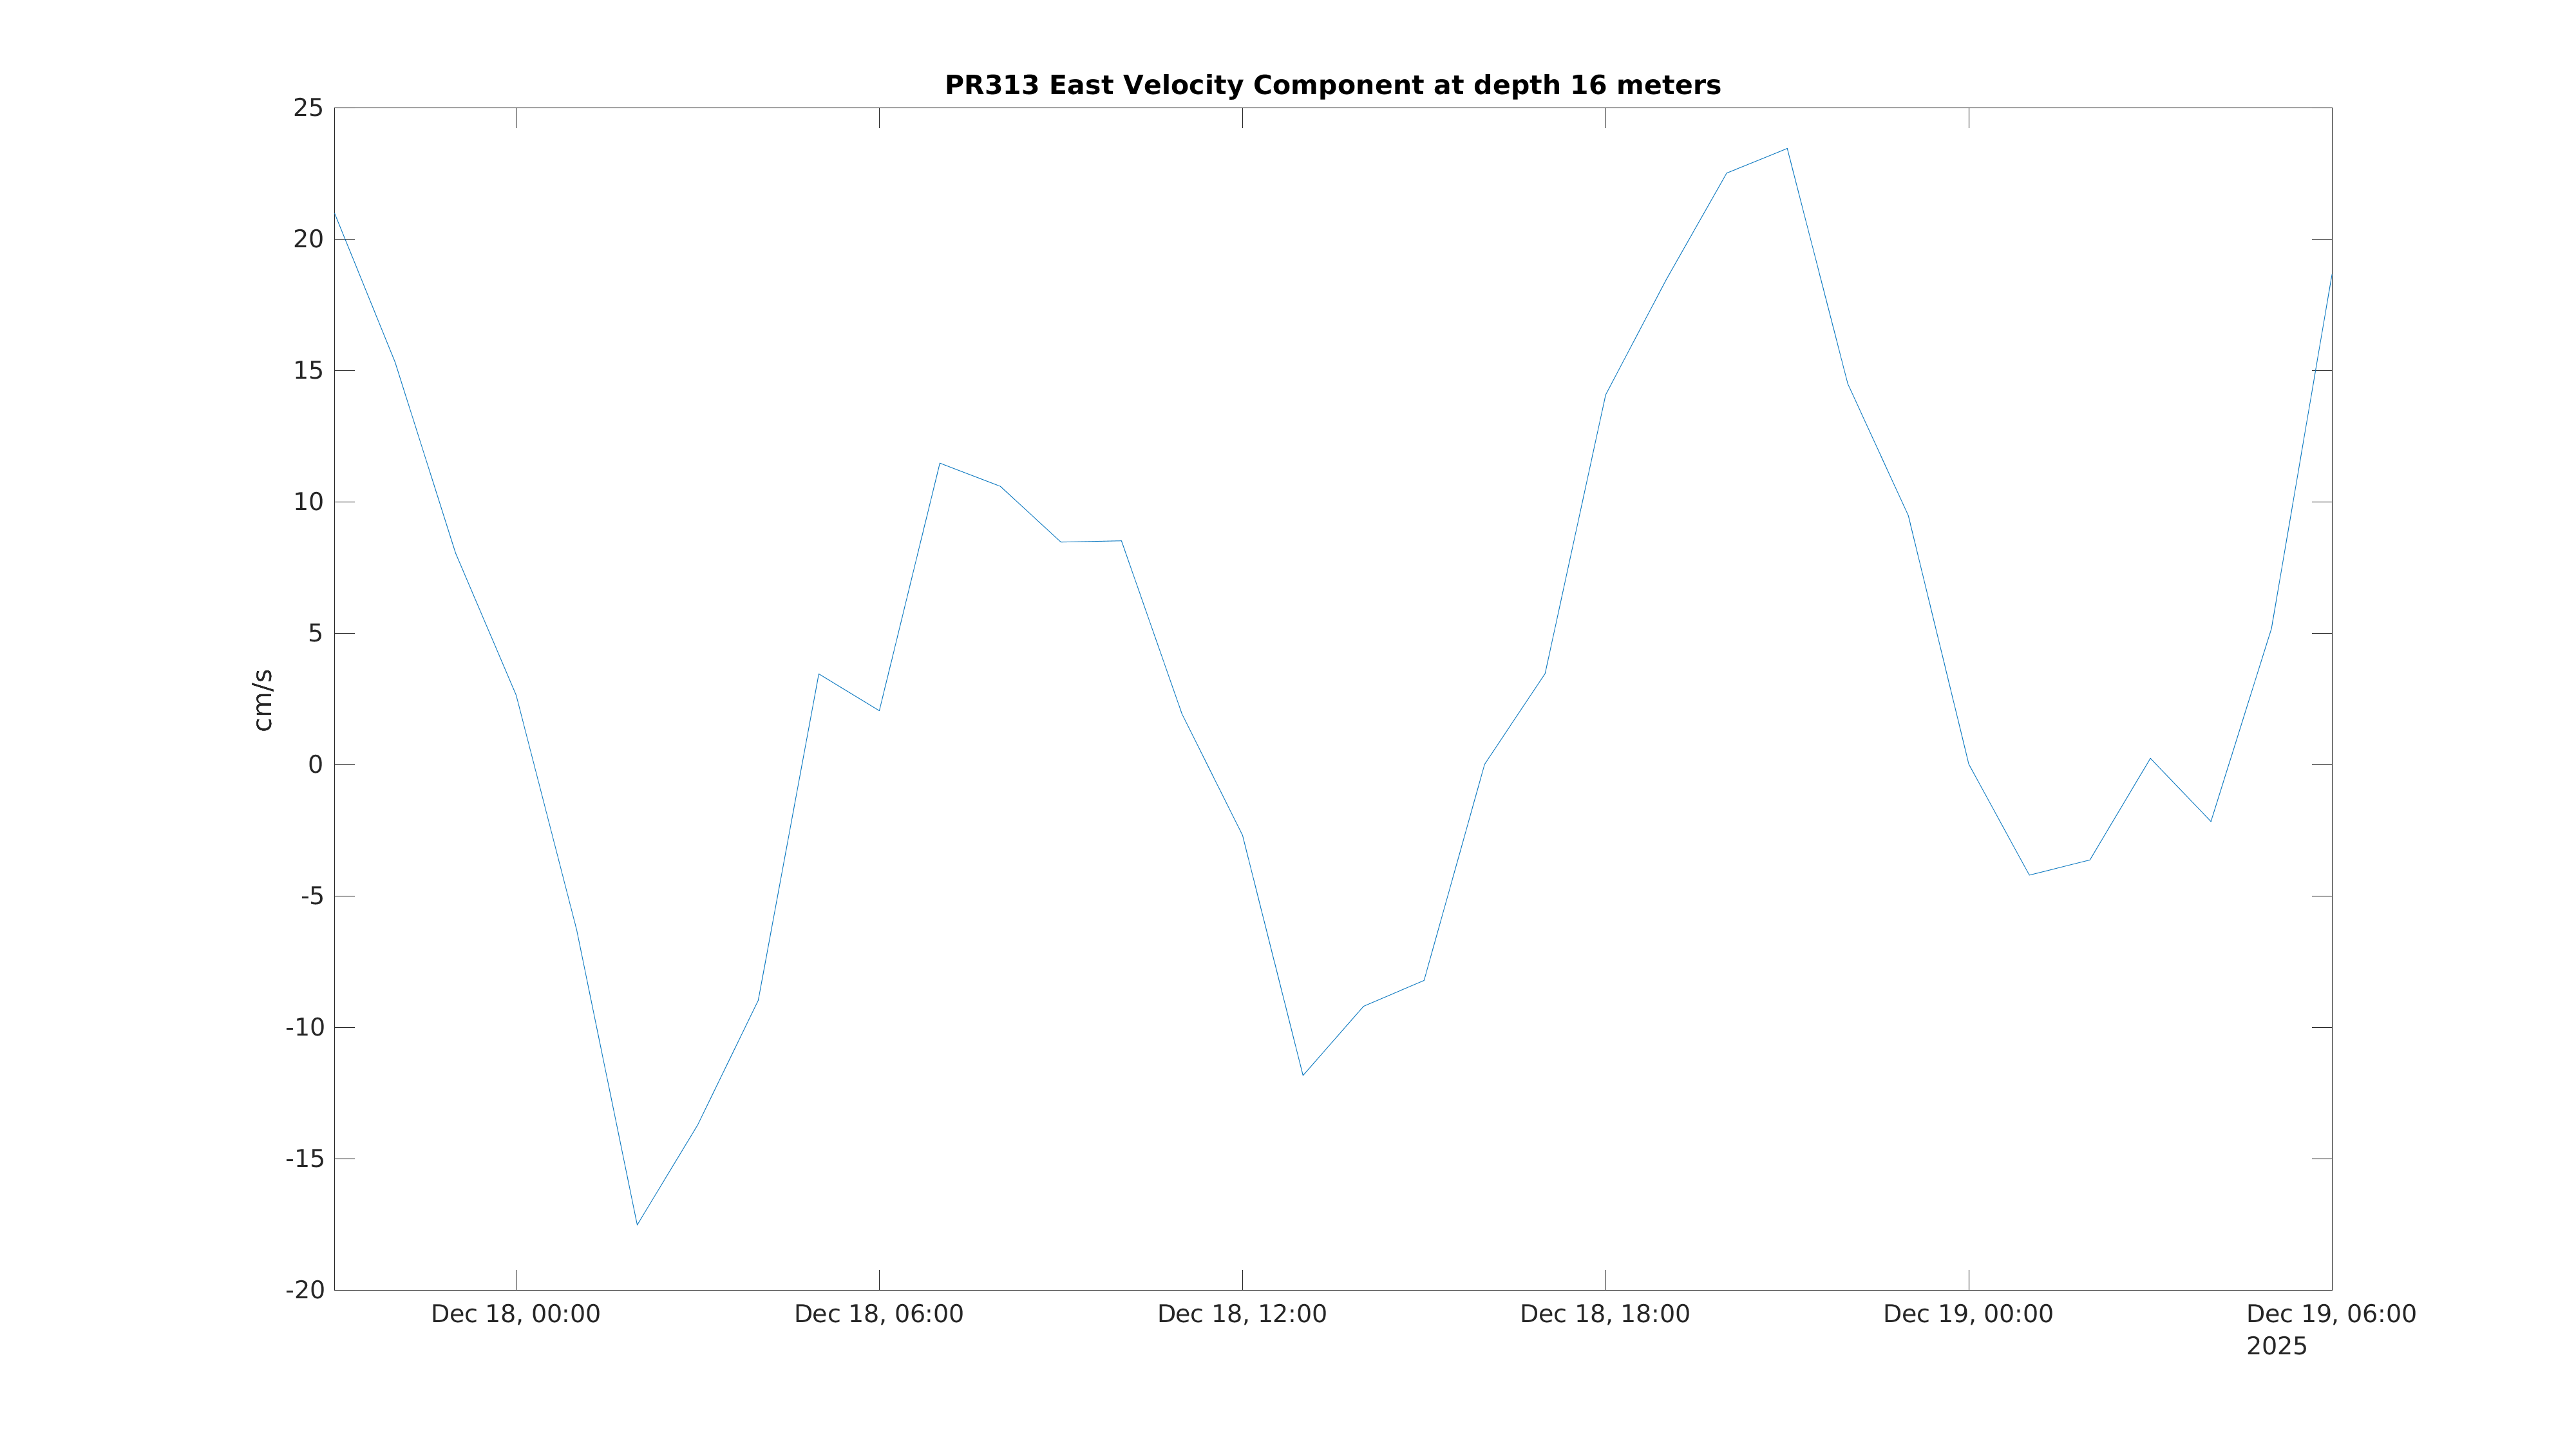
Deployed: Dec 17 2025
Coast Guard Light List Letter: E
Coast Guard Light List Number 31383
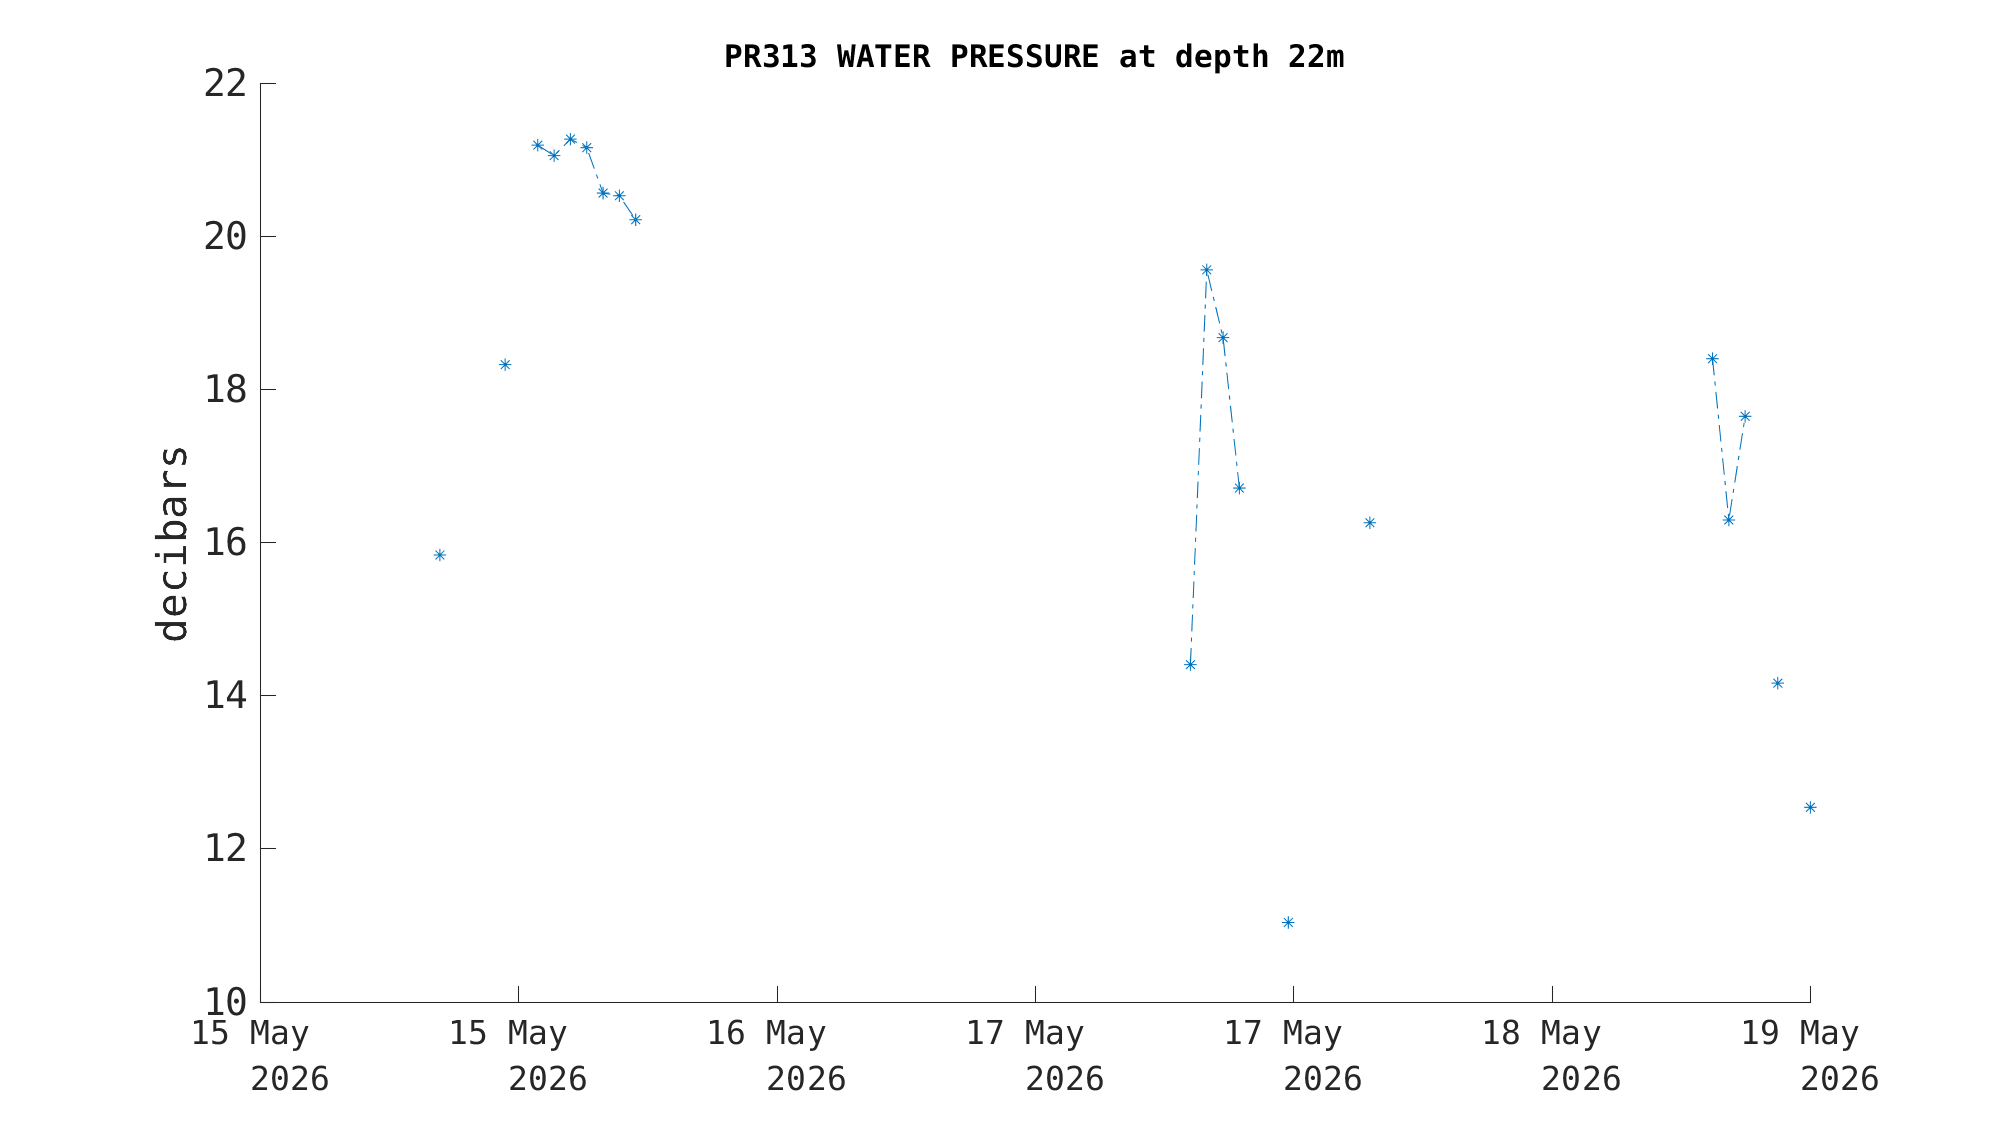
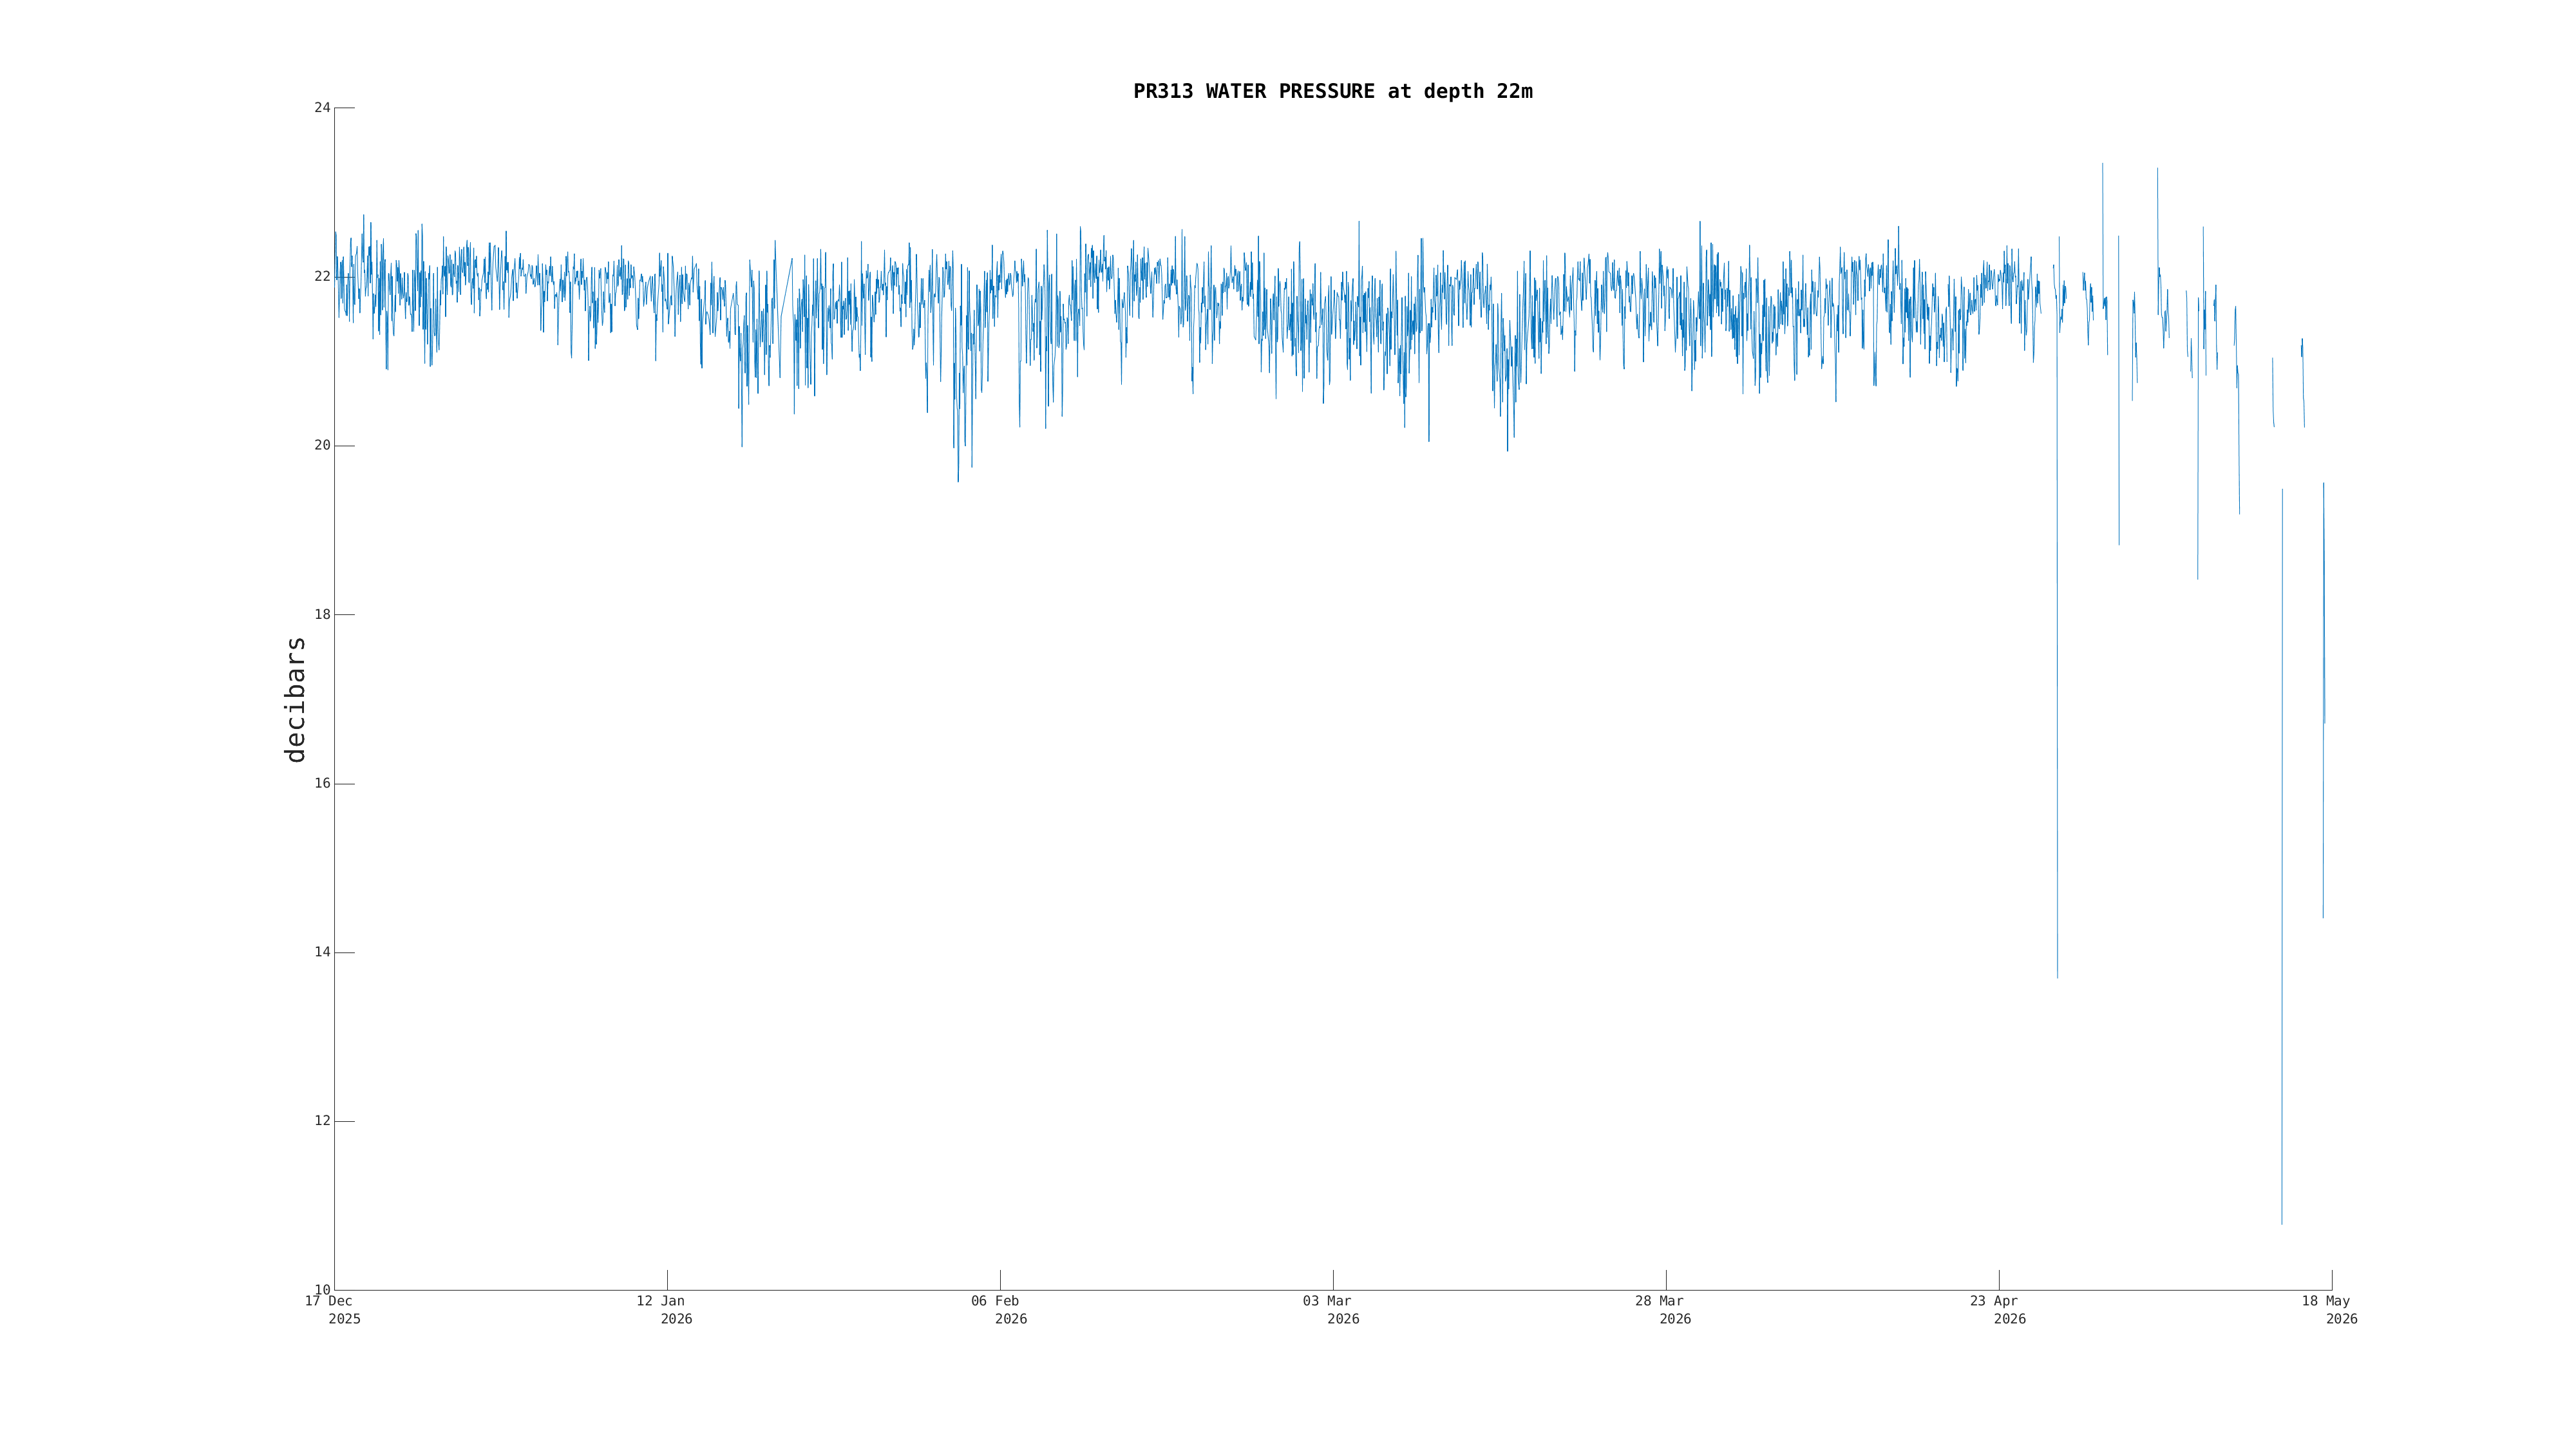
Water Depth: 30 meters (98 feet)
Watch Circle Radius: 60 meters (197 feet)
Last Cell Phone Transmission: May 19, 01 AM AST
Last GOES Transmission: May 18, 11 PM AST
Latest Event:
Dec 17, 04 PM AST
deployed by Luis Ramirez
deployed by Luis Ramirez

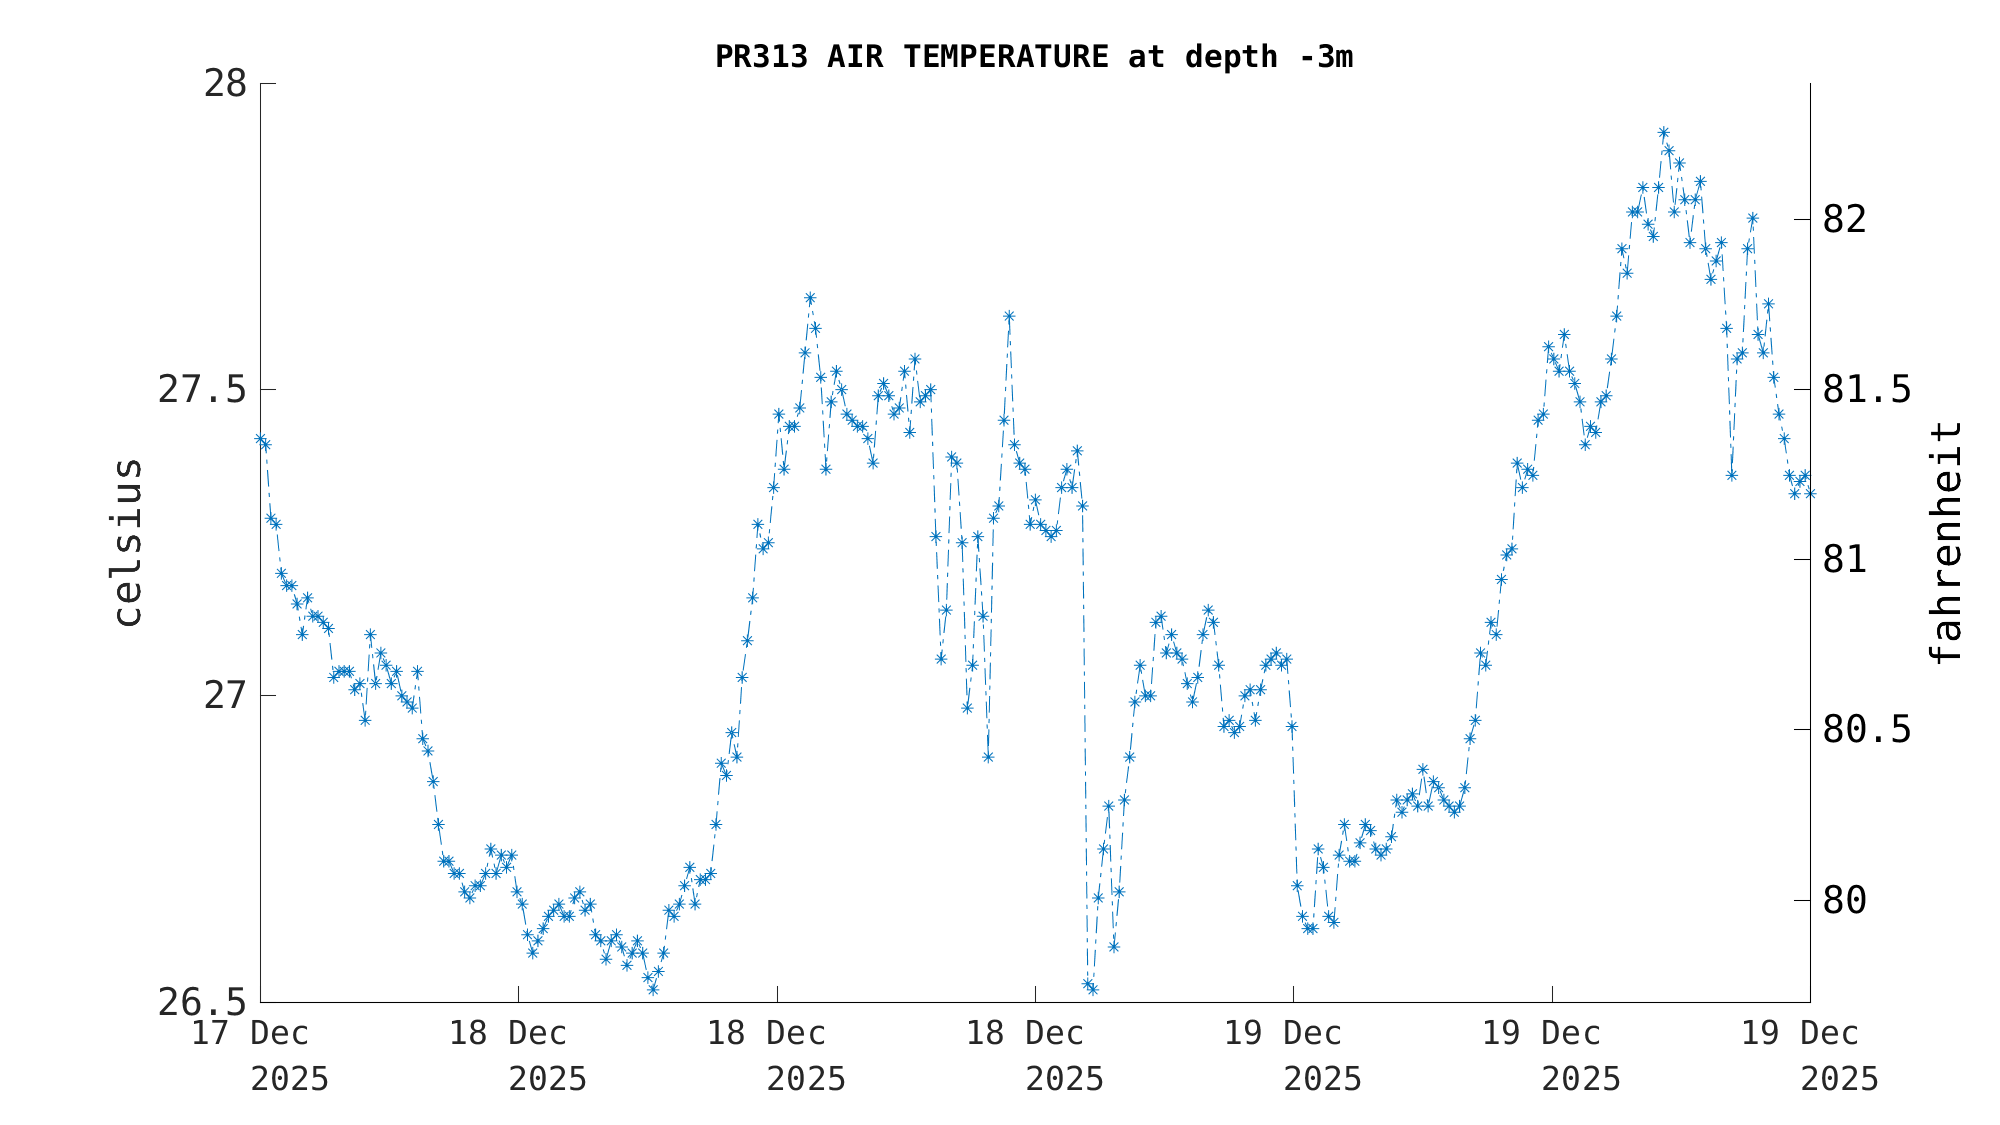
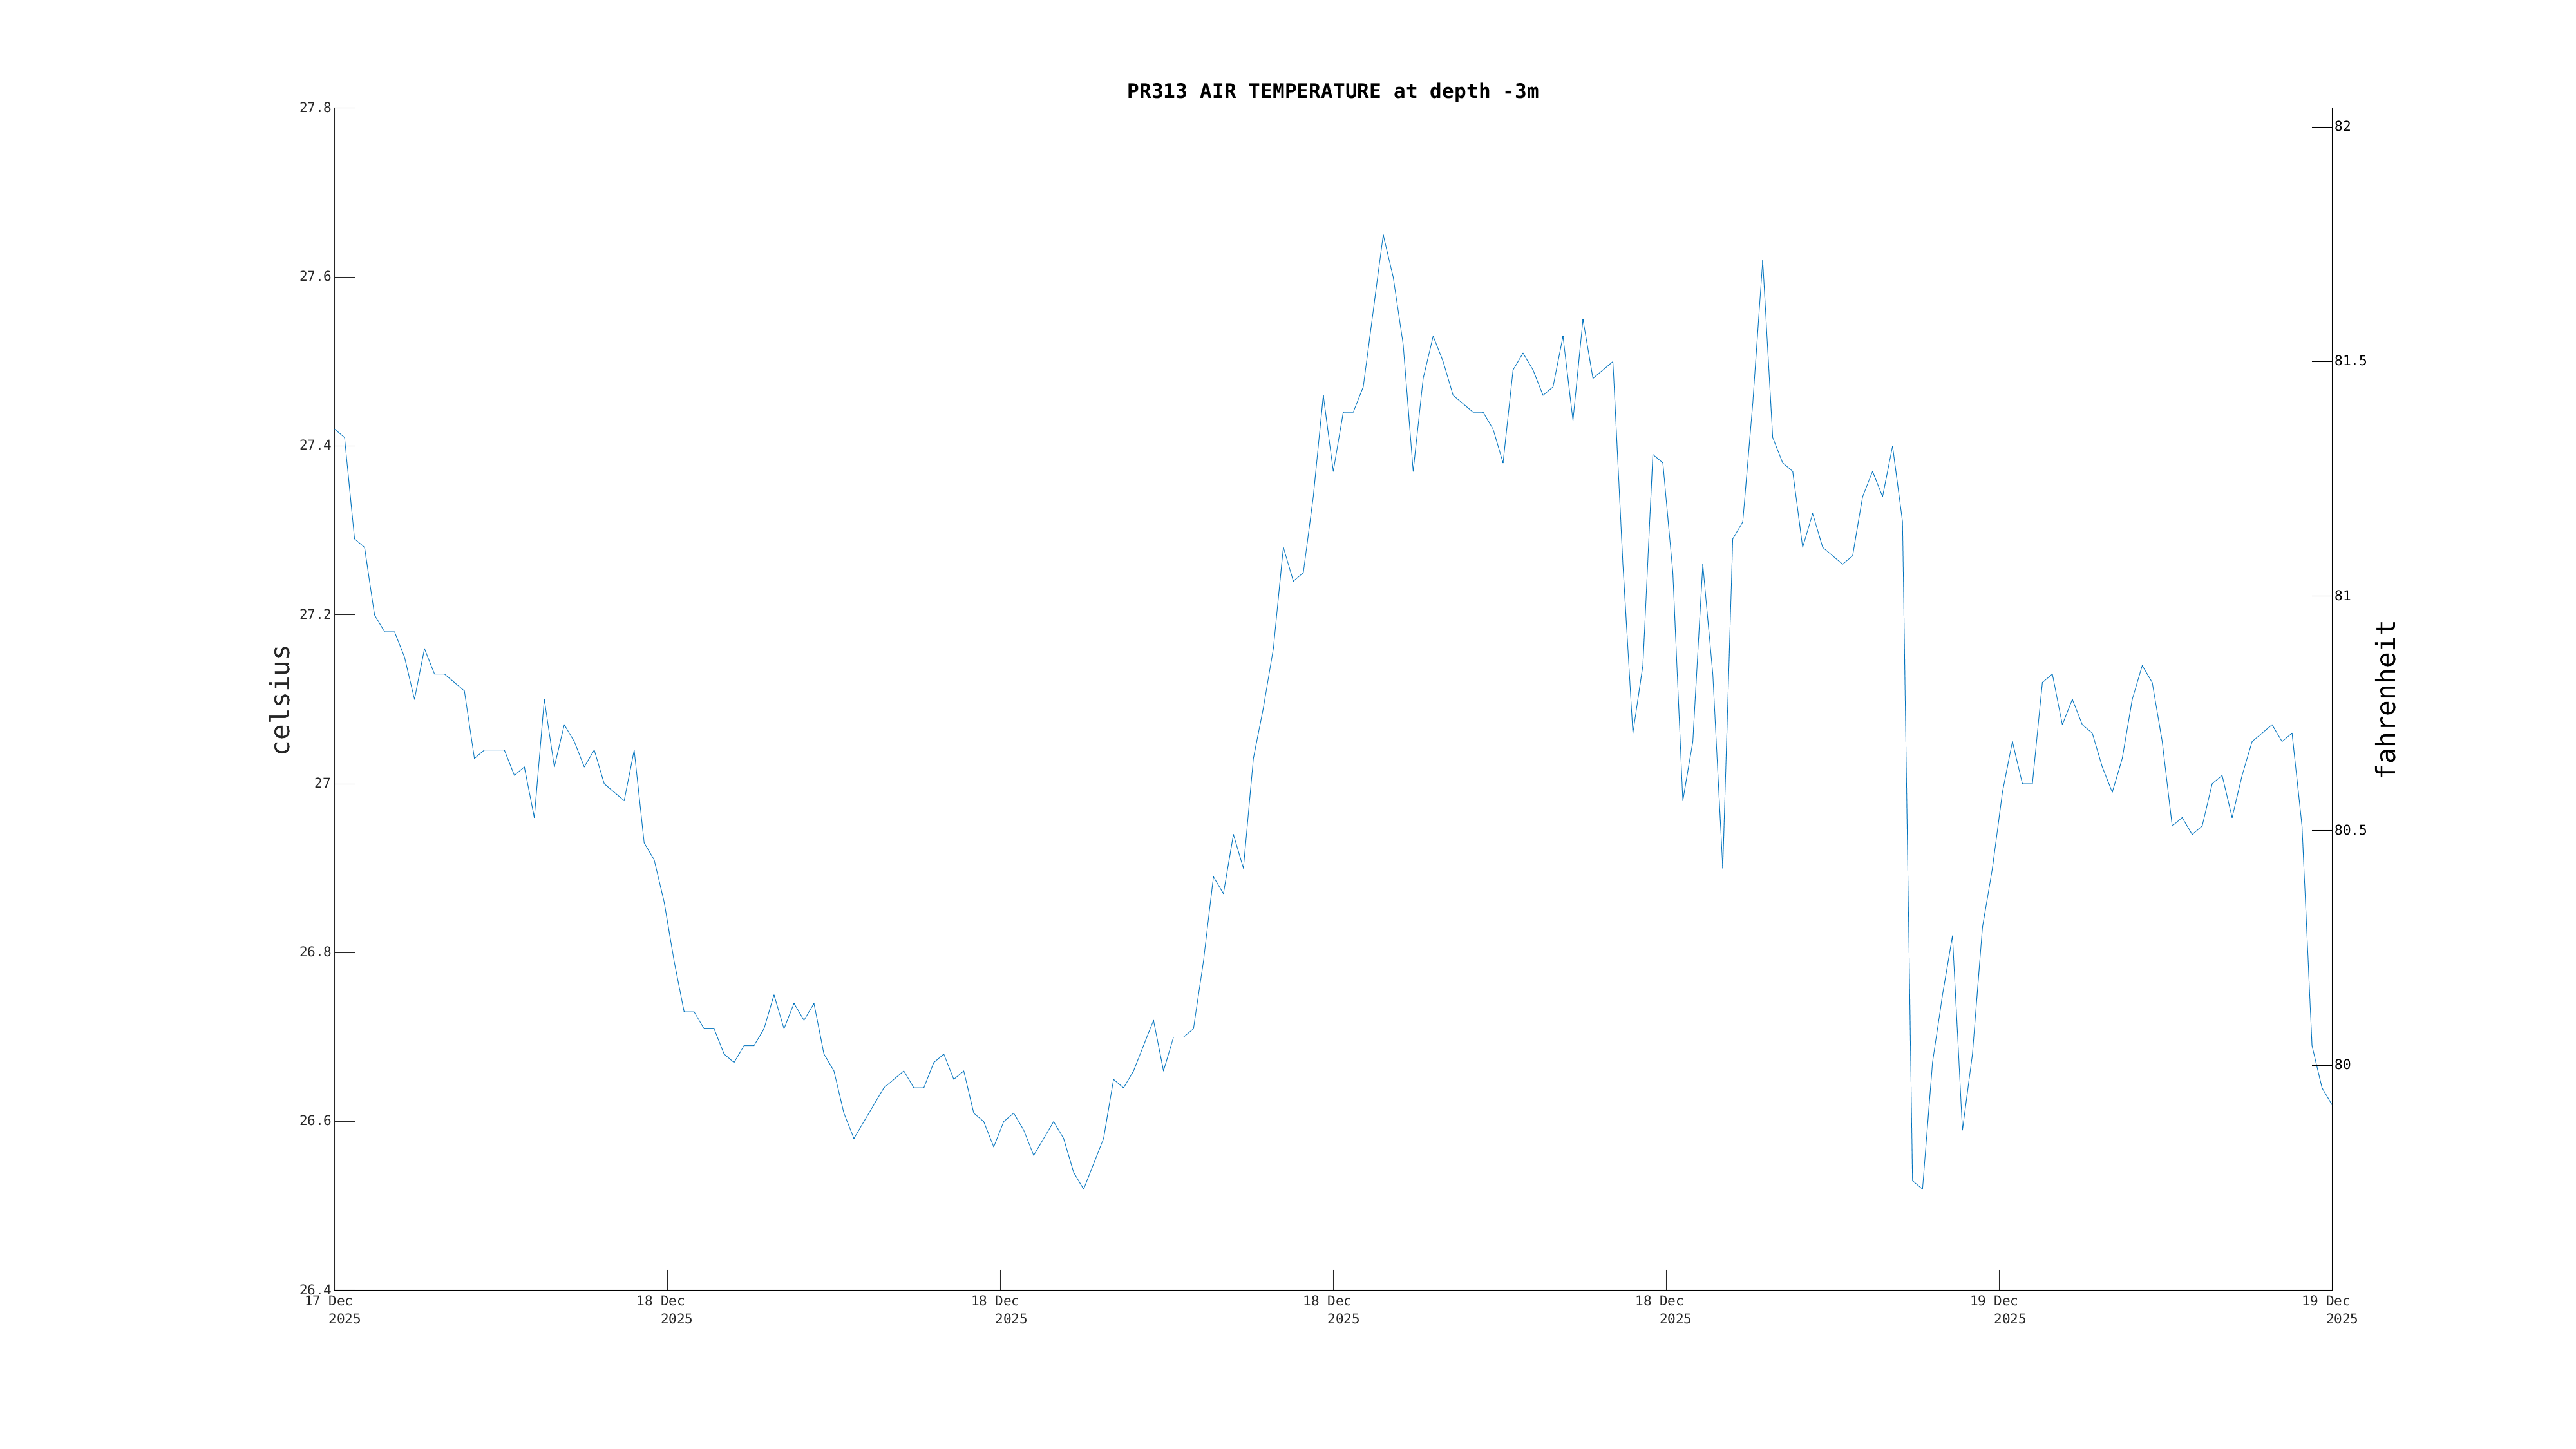
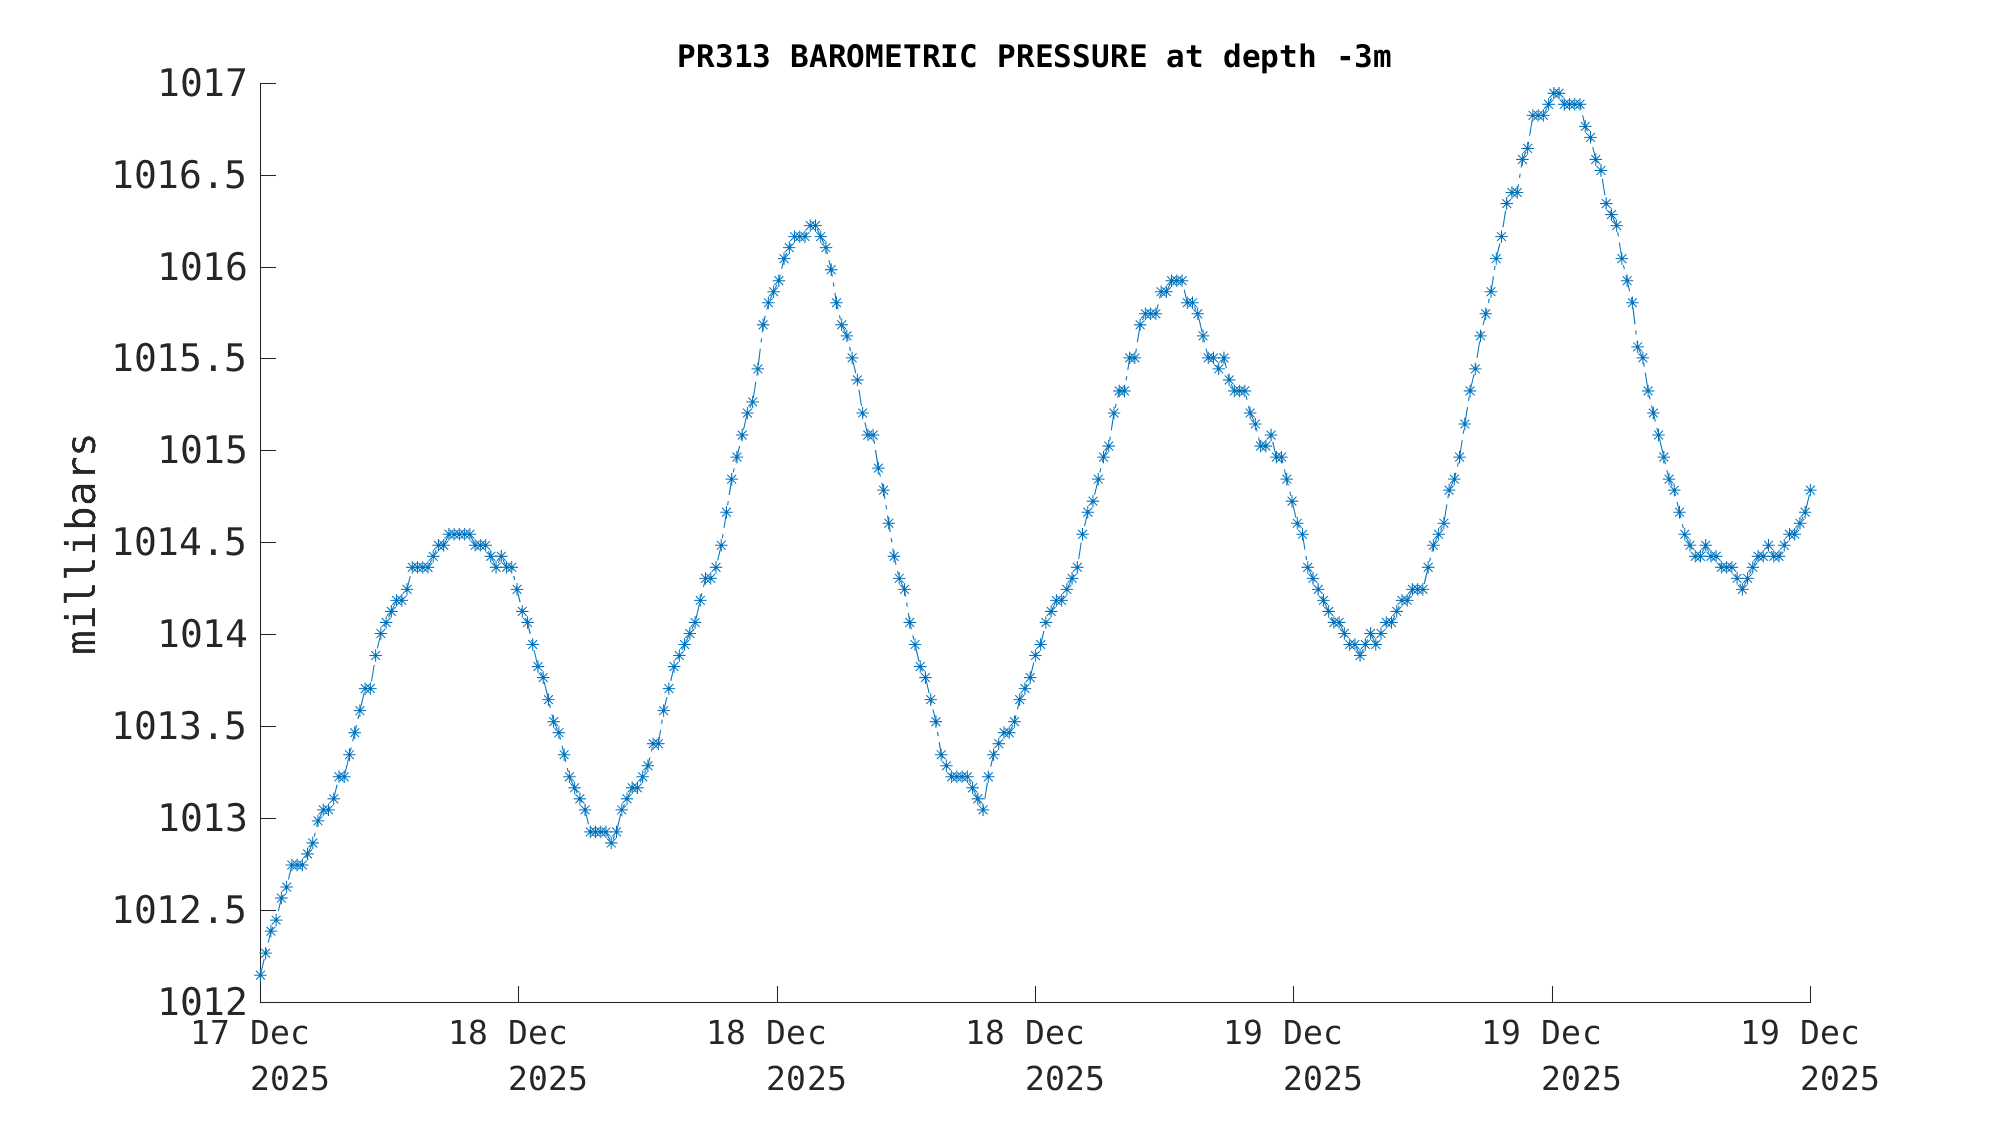
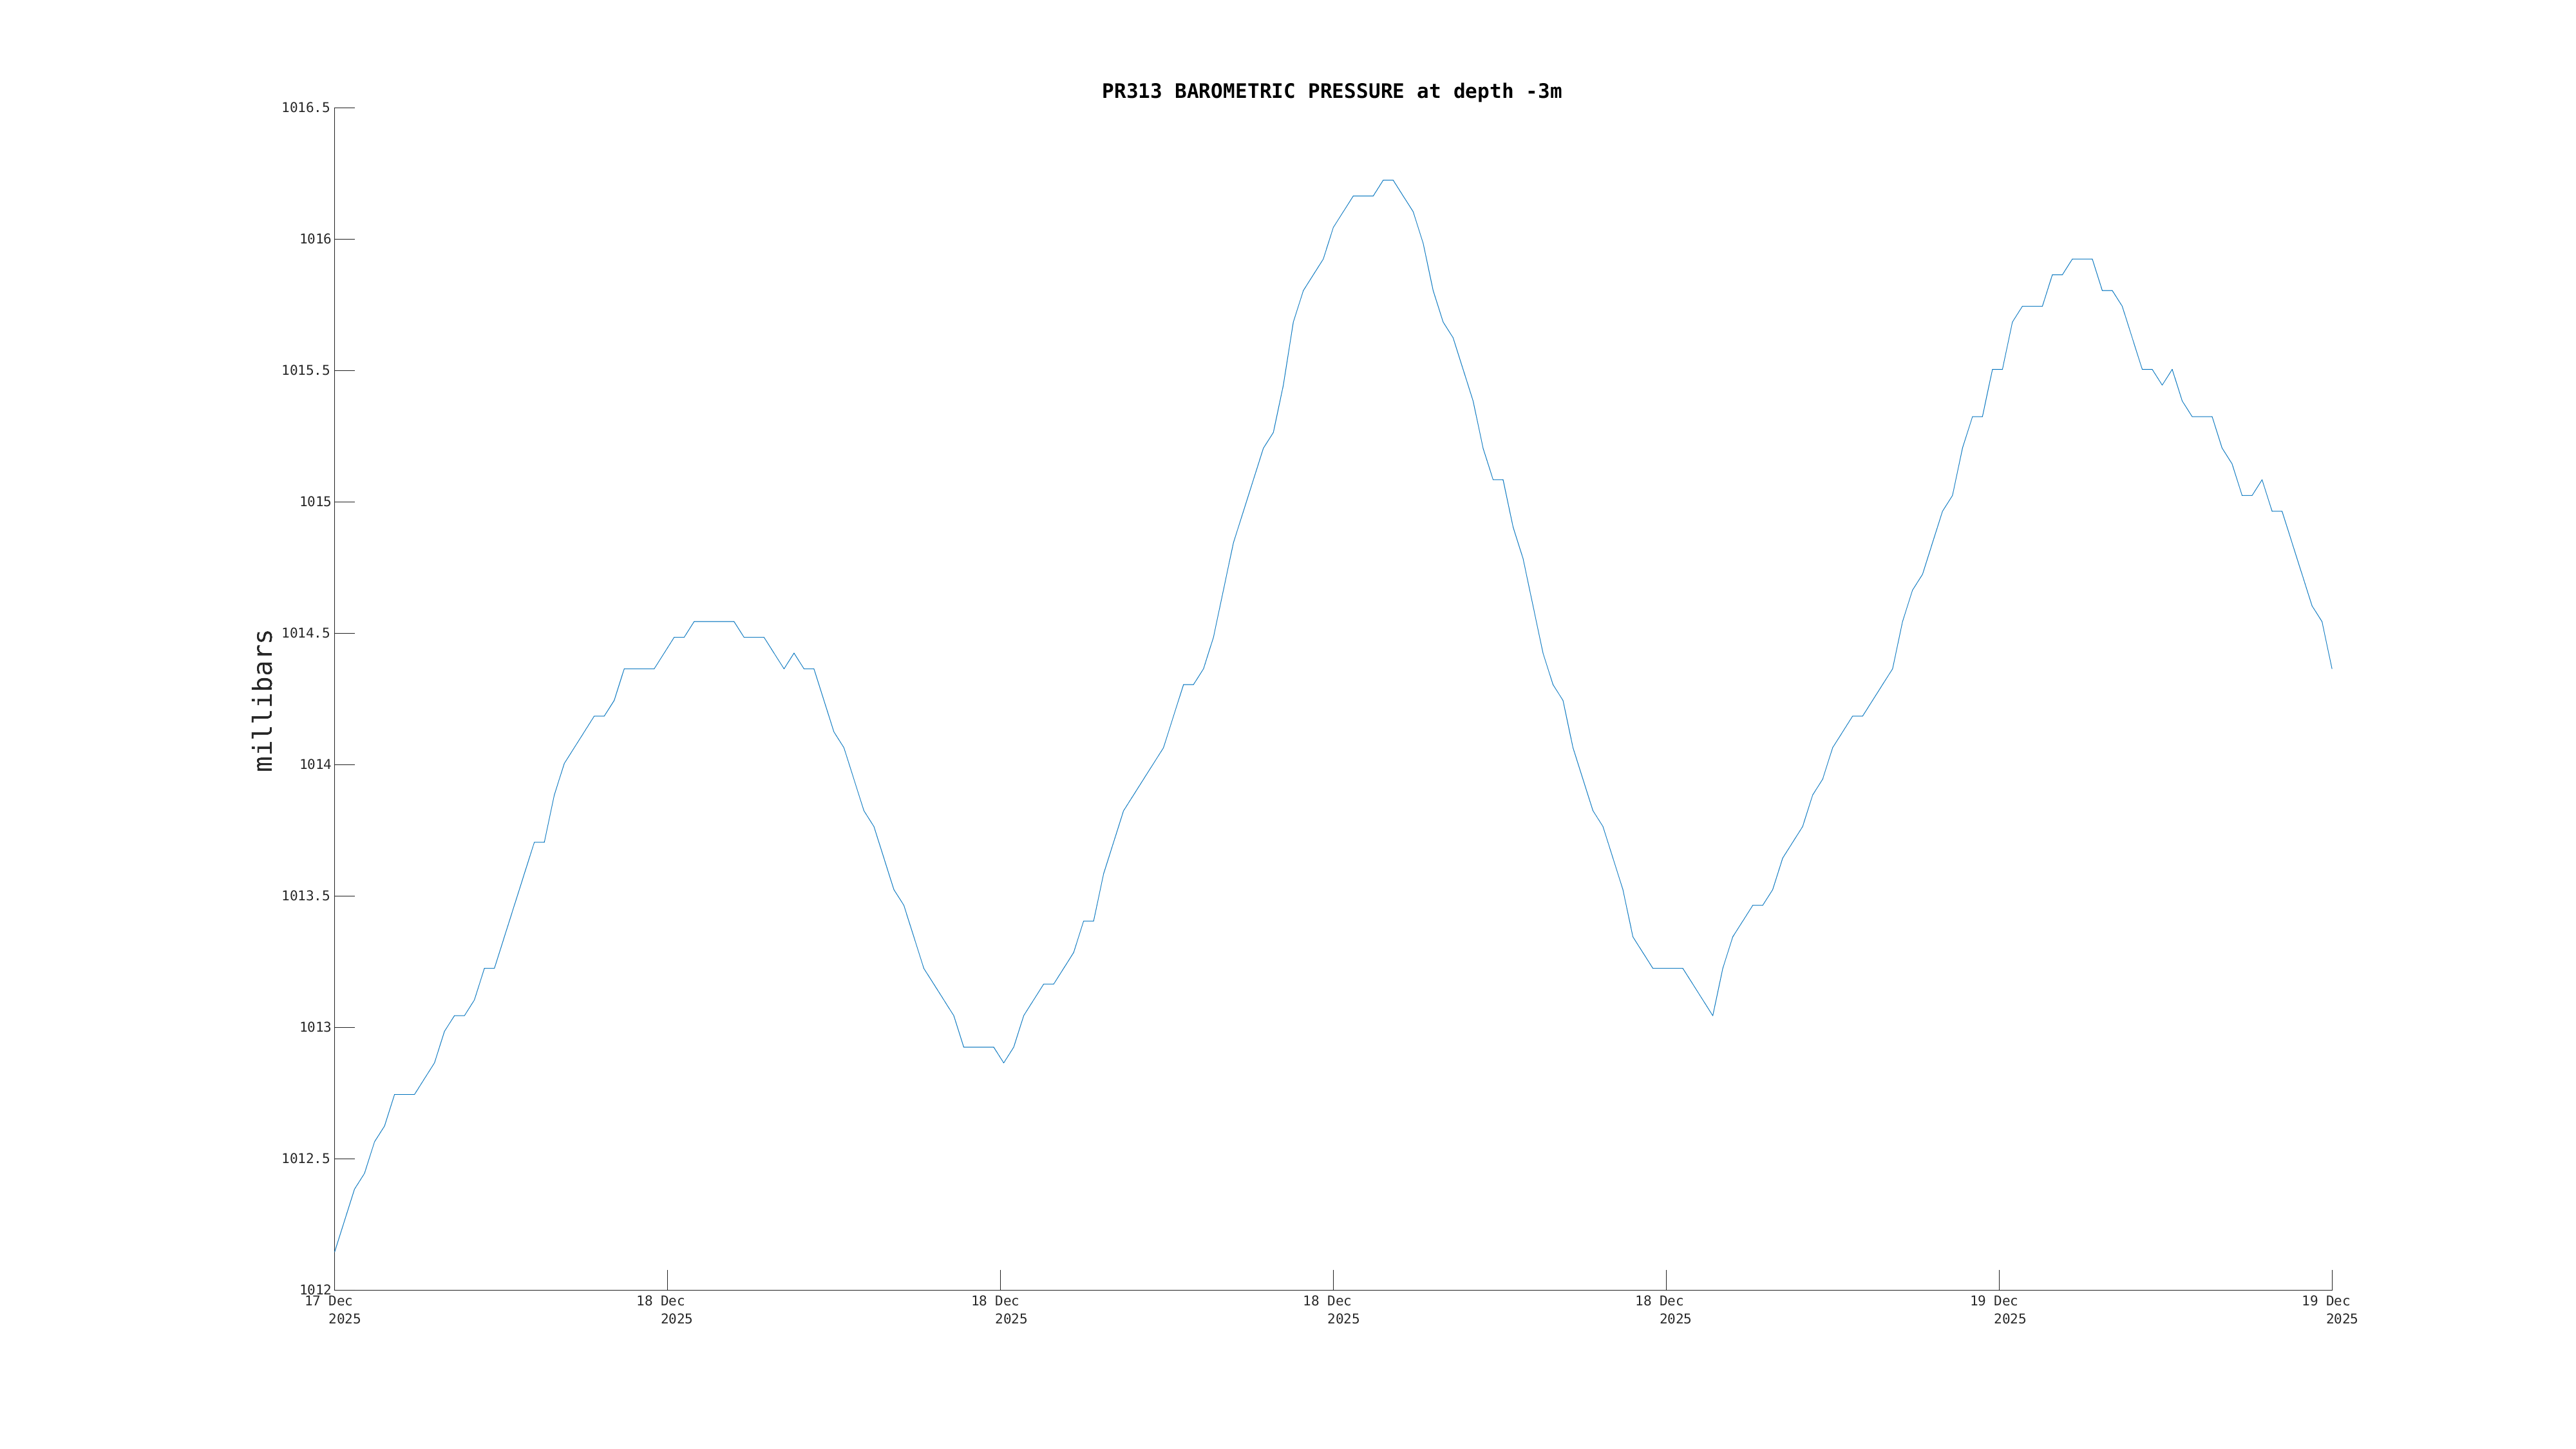
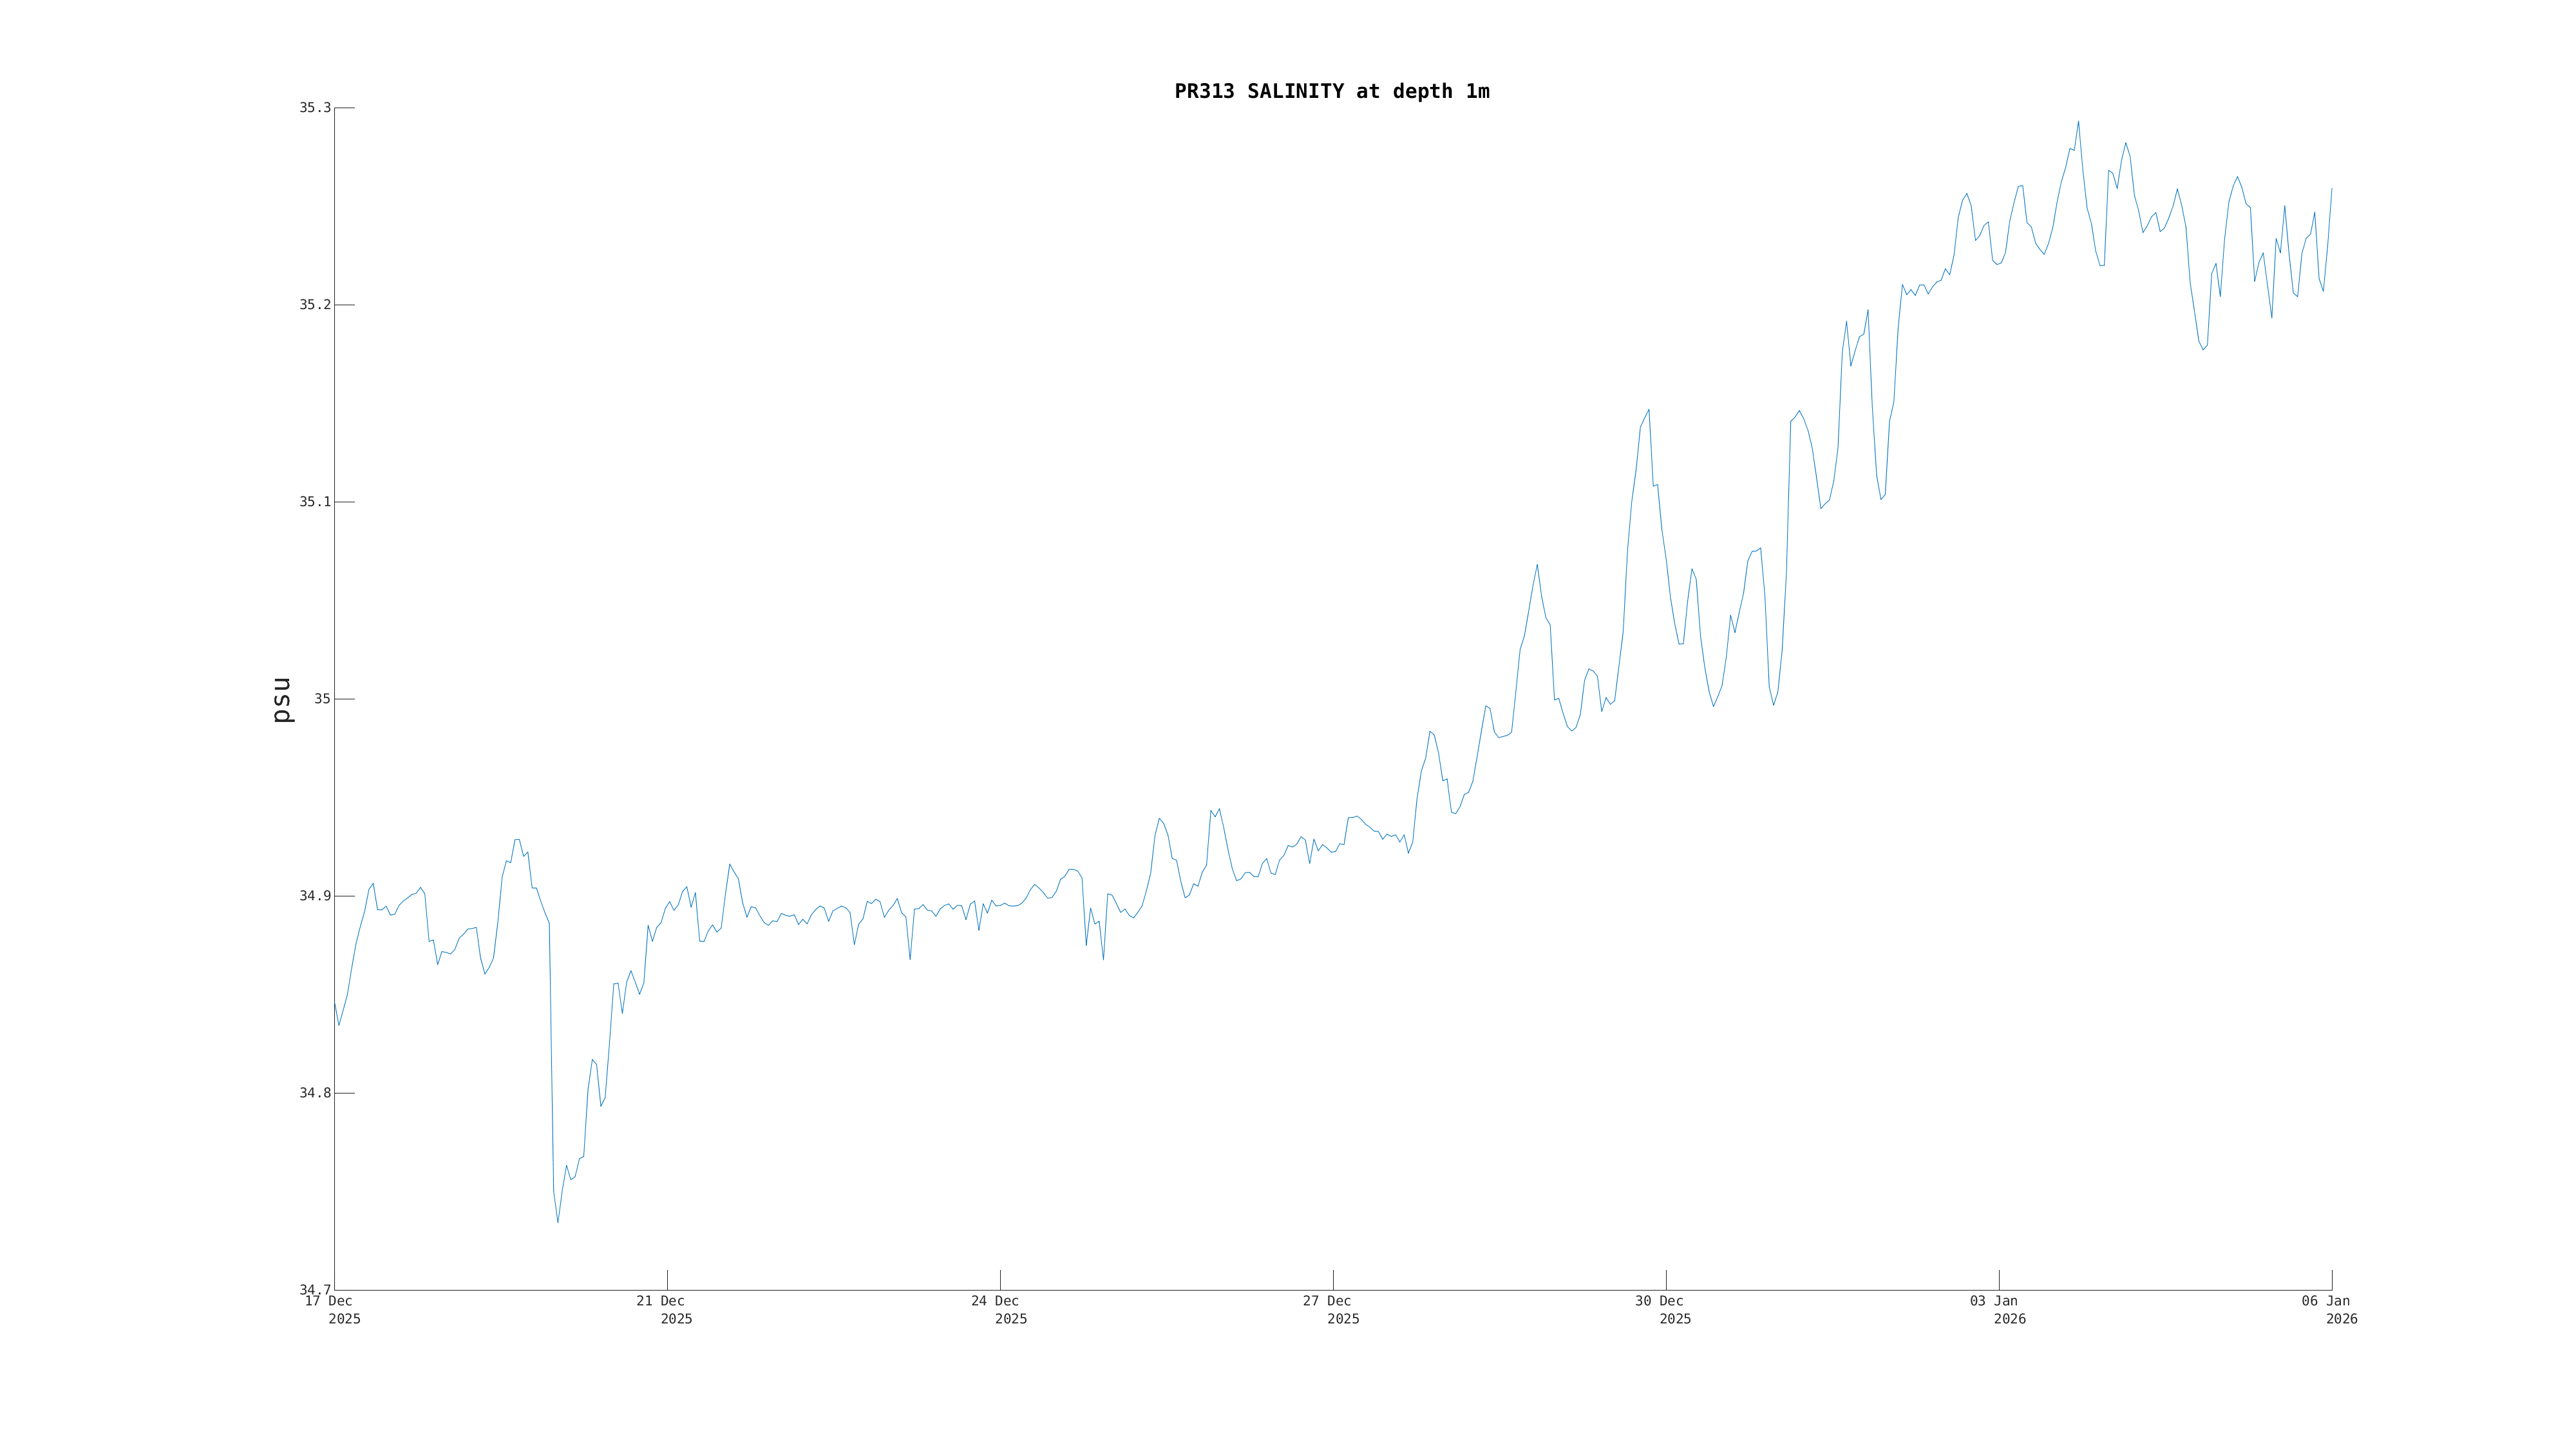
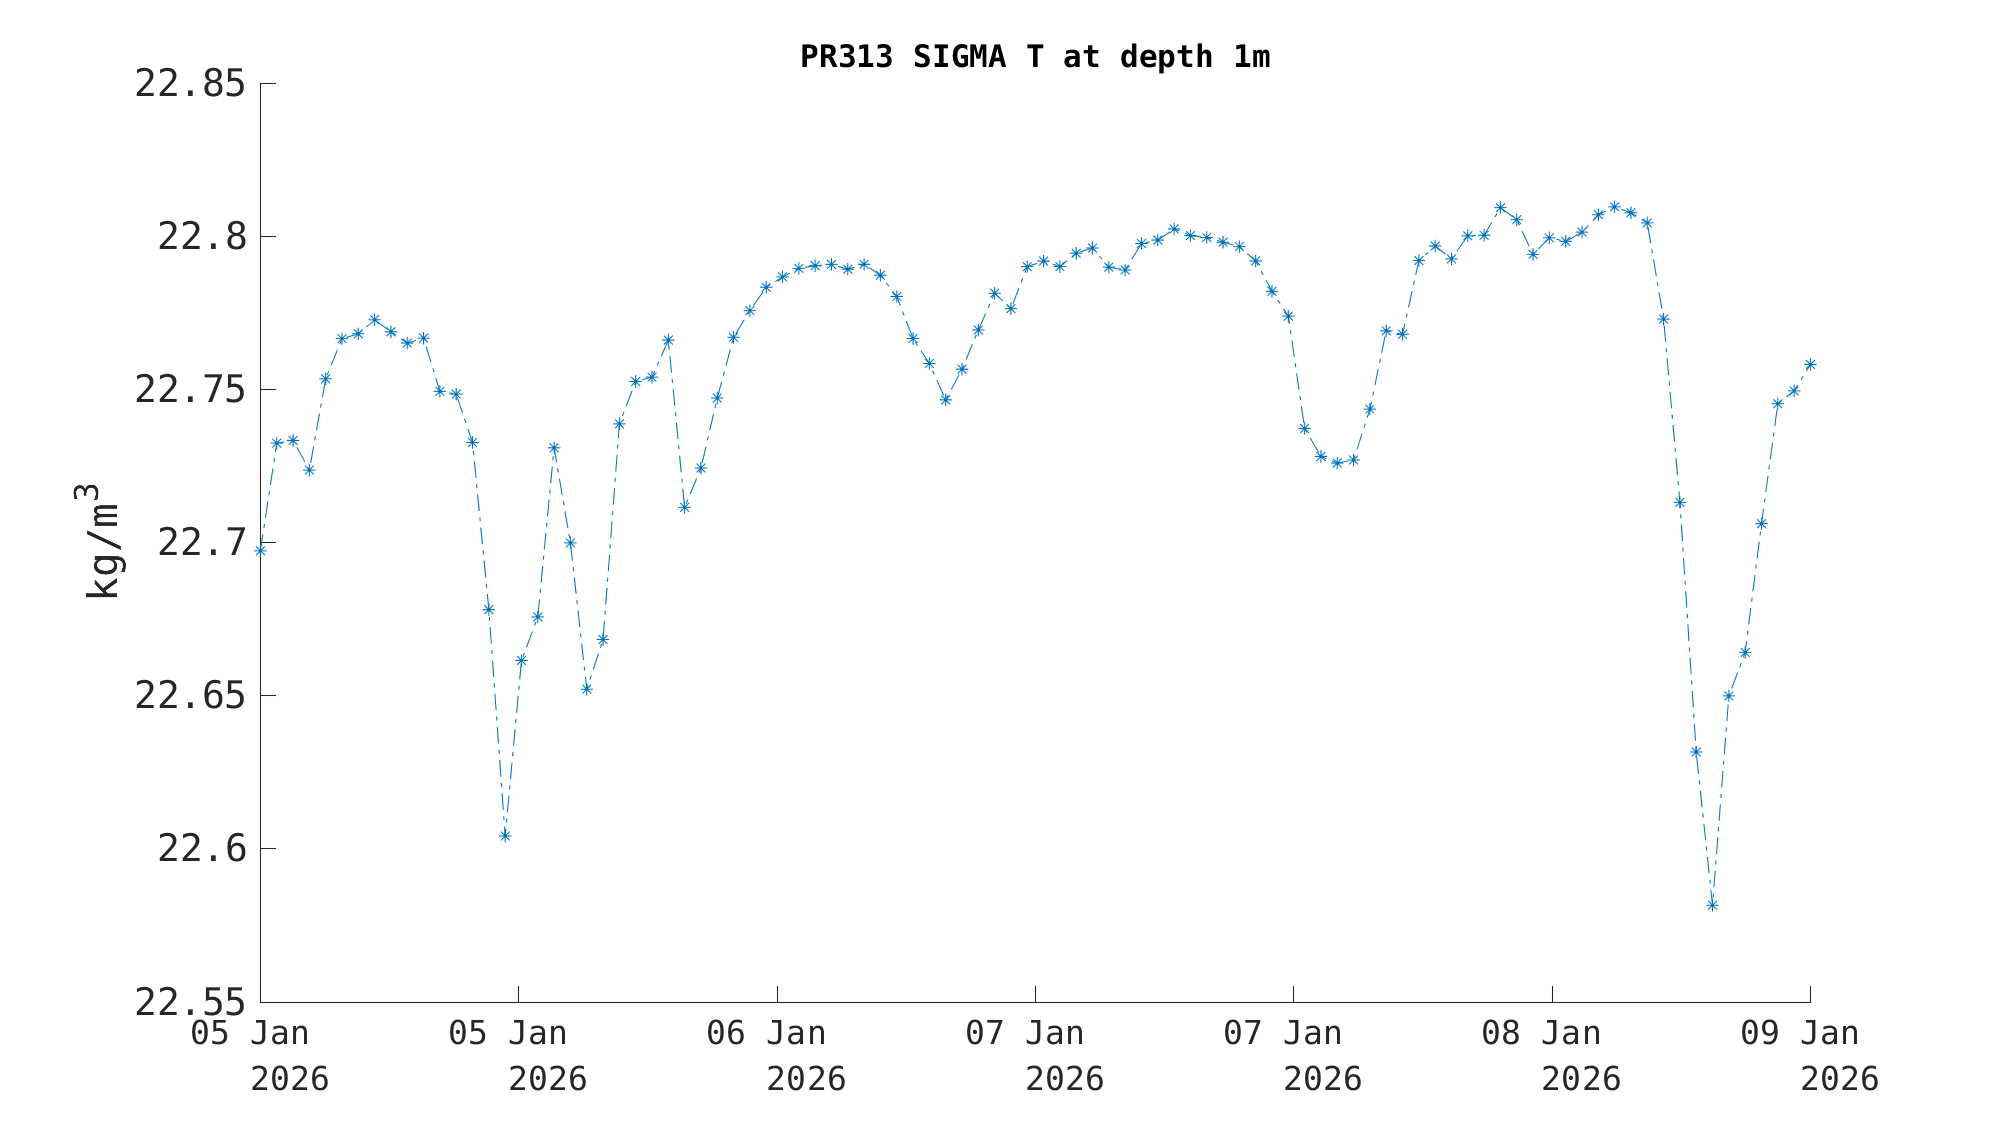
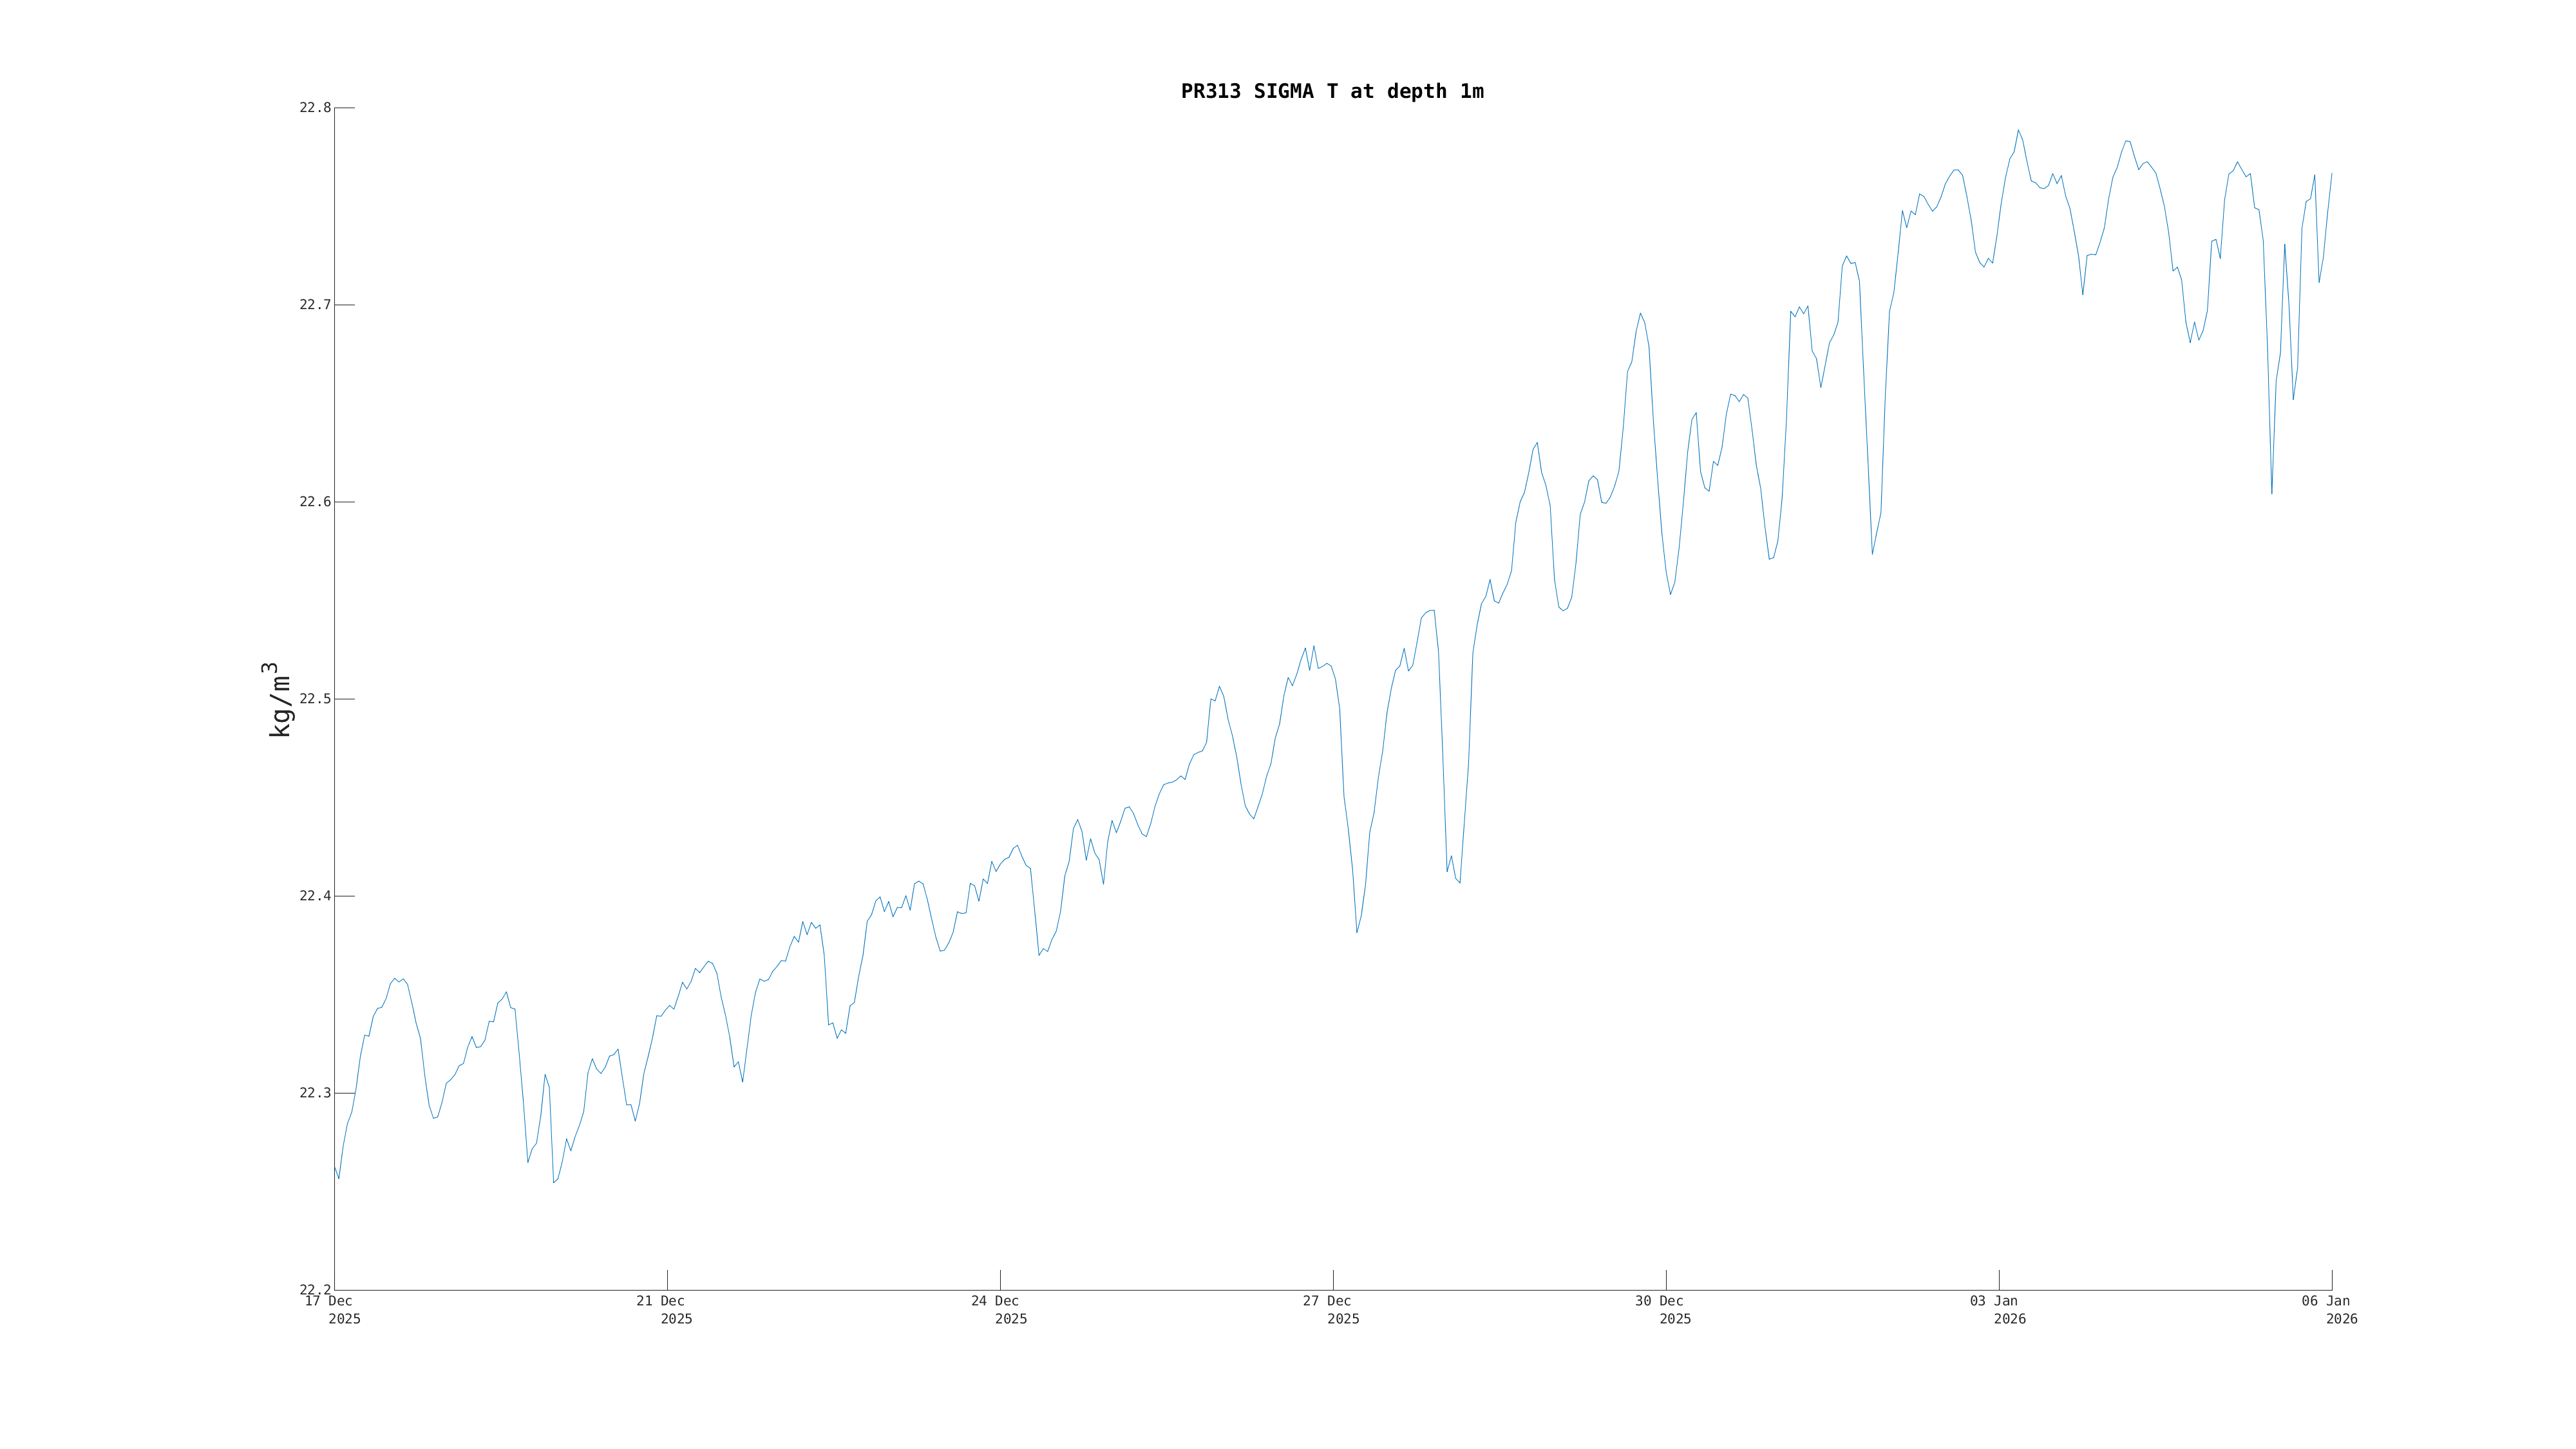
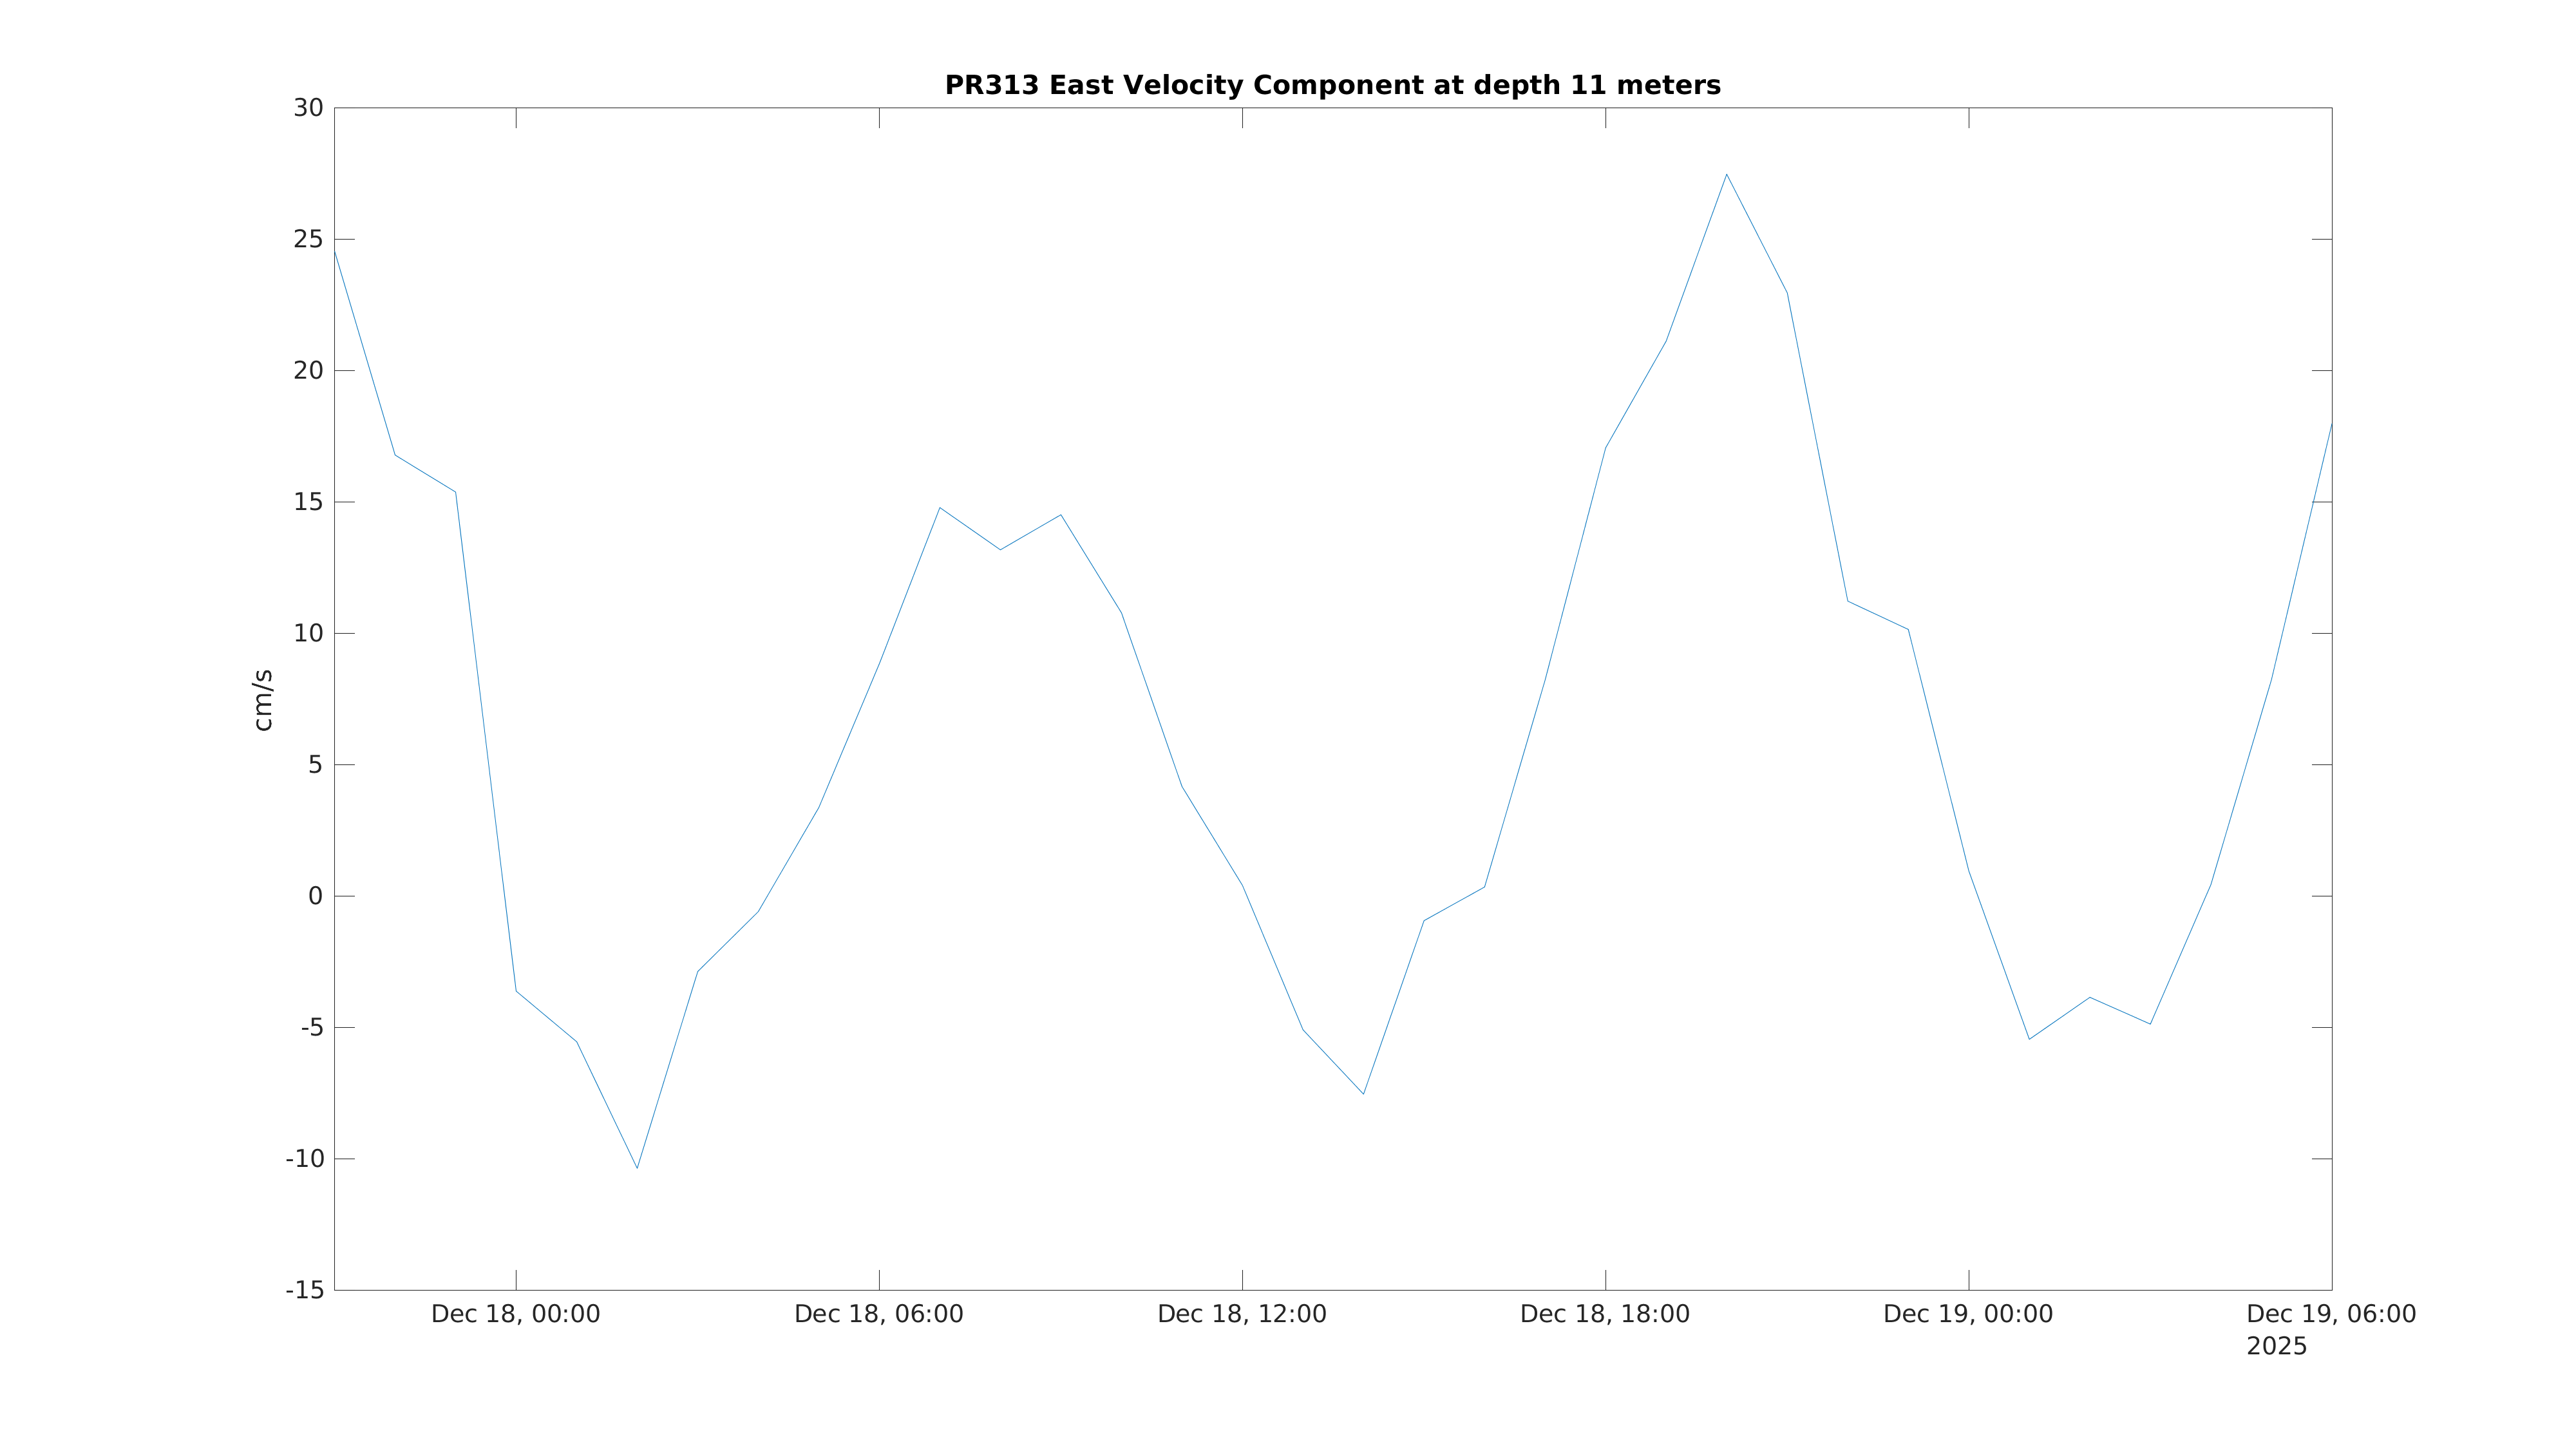
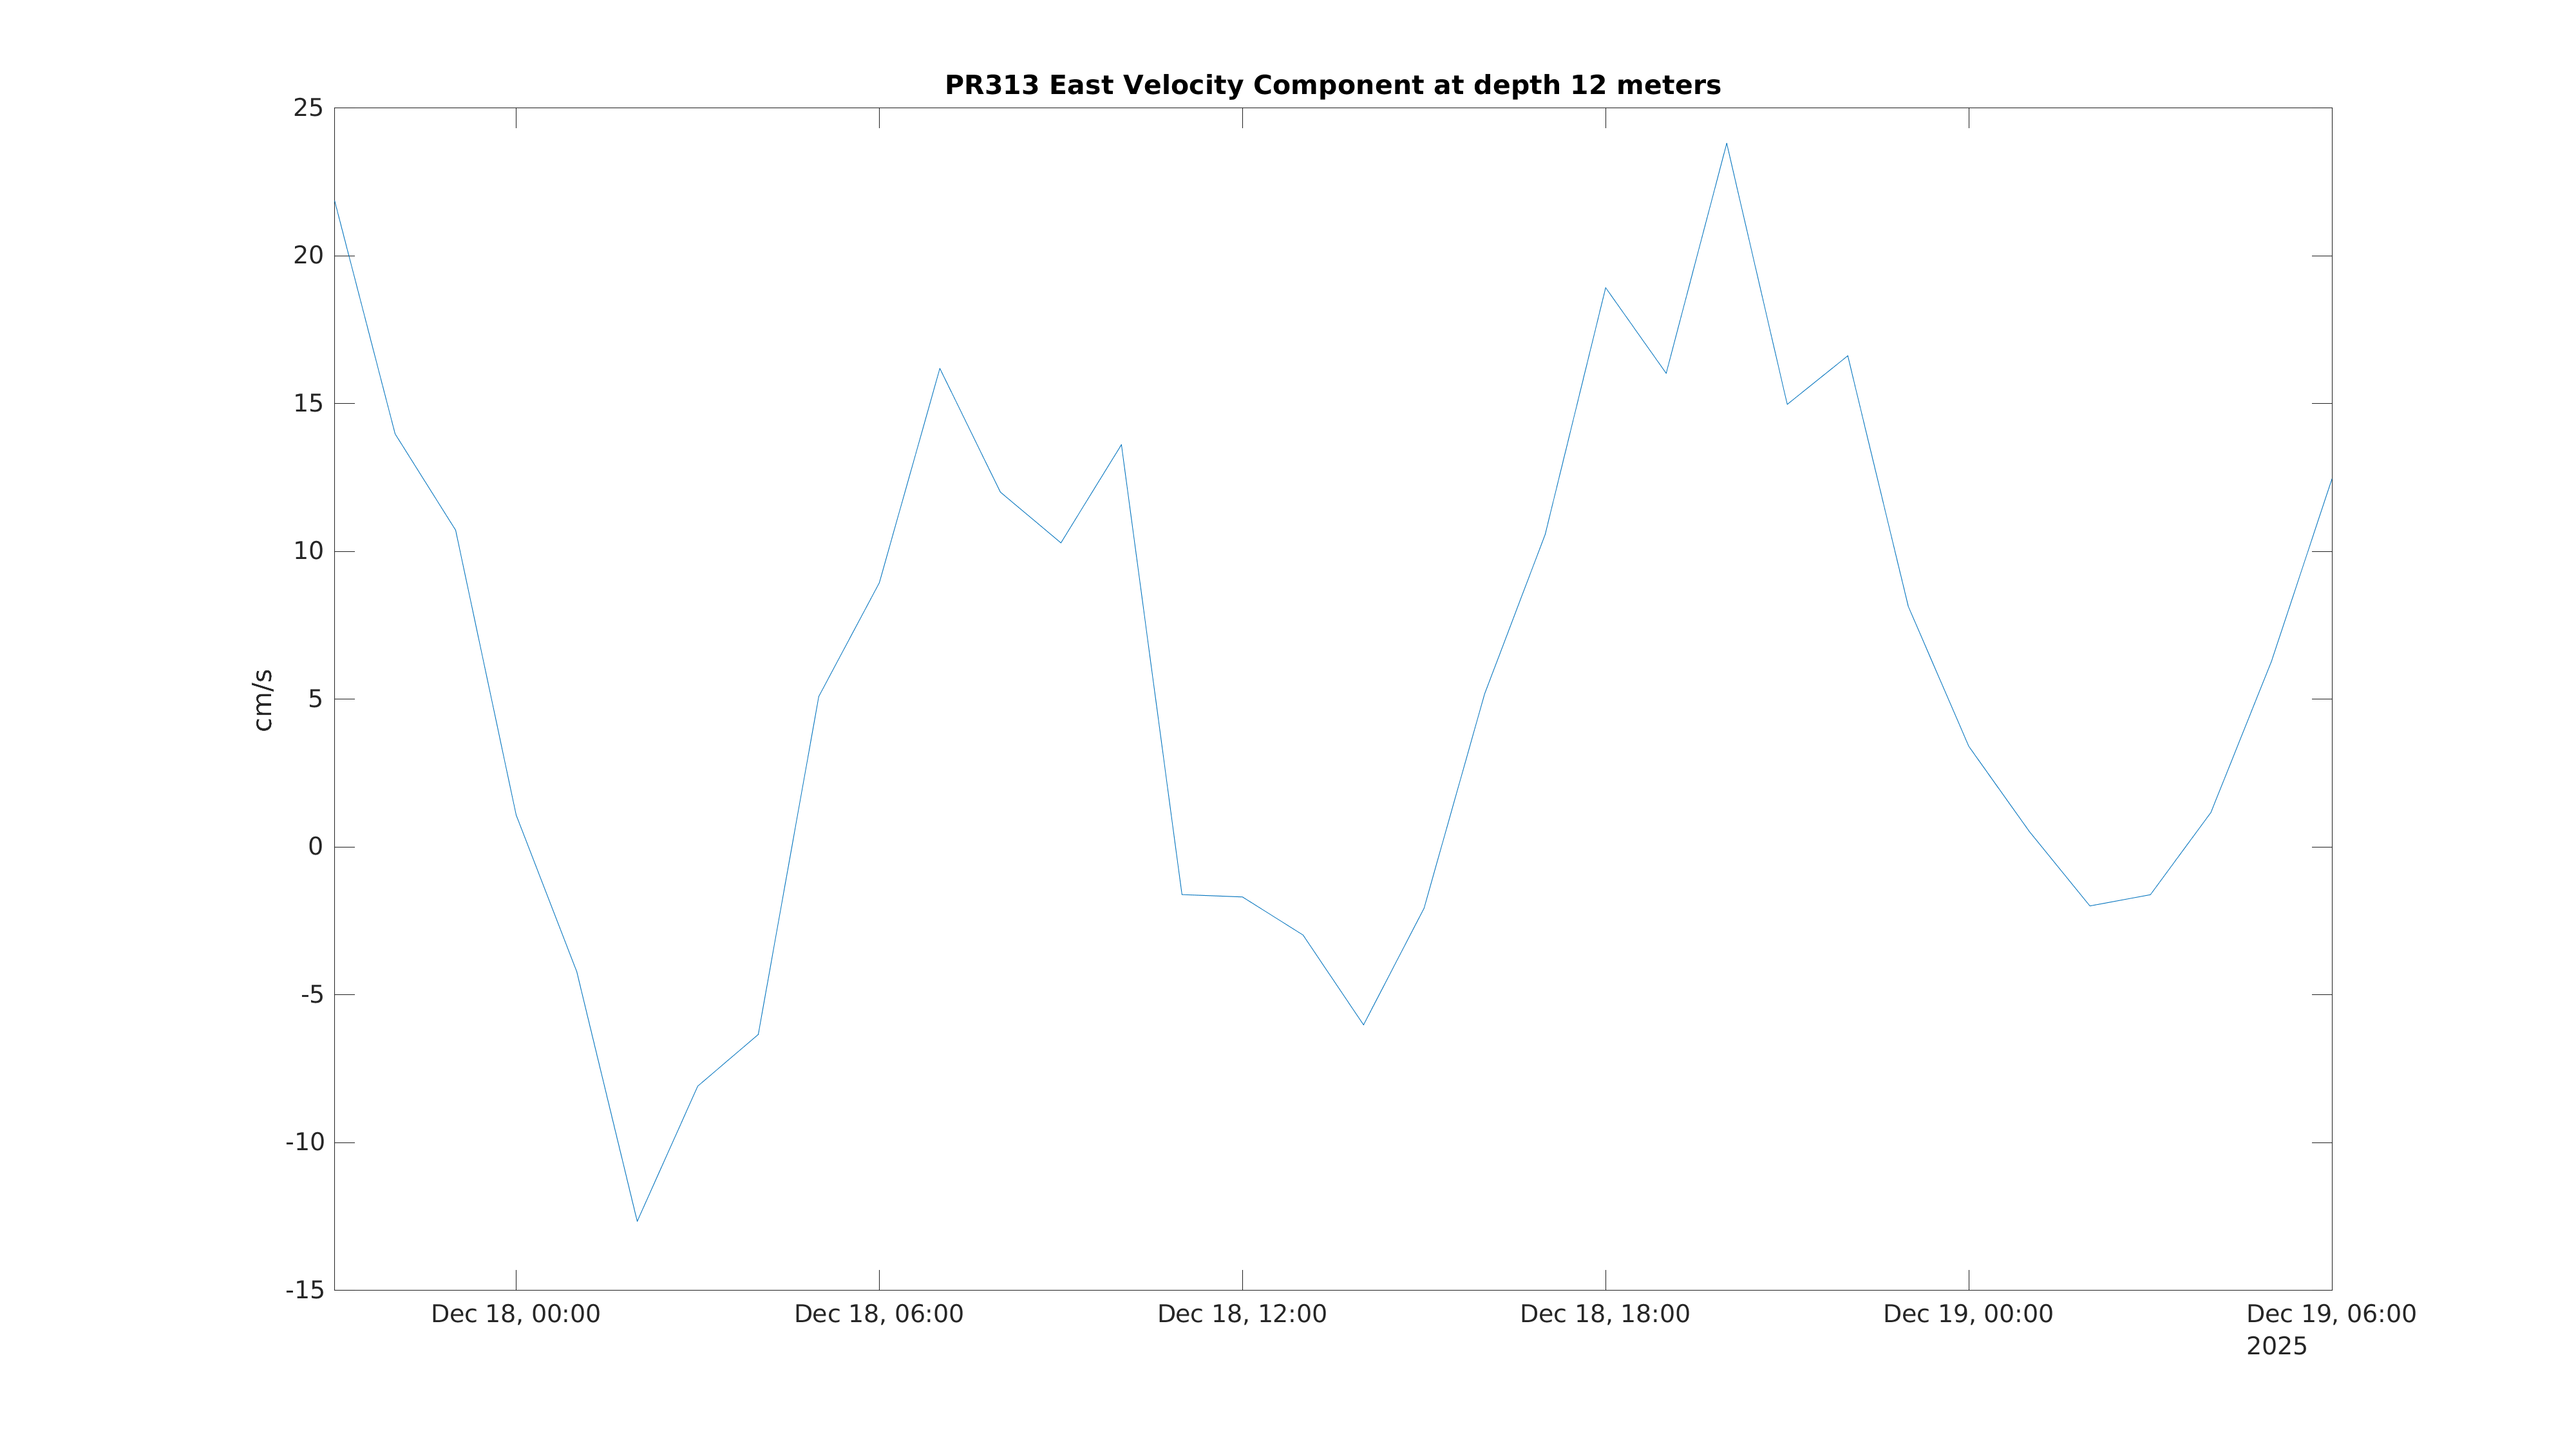
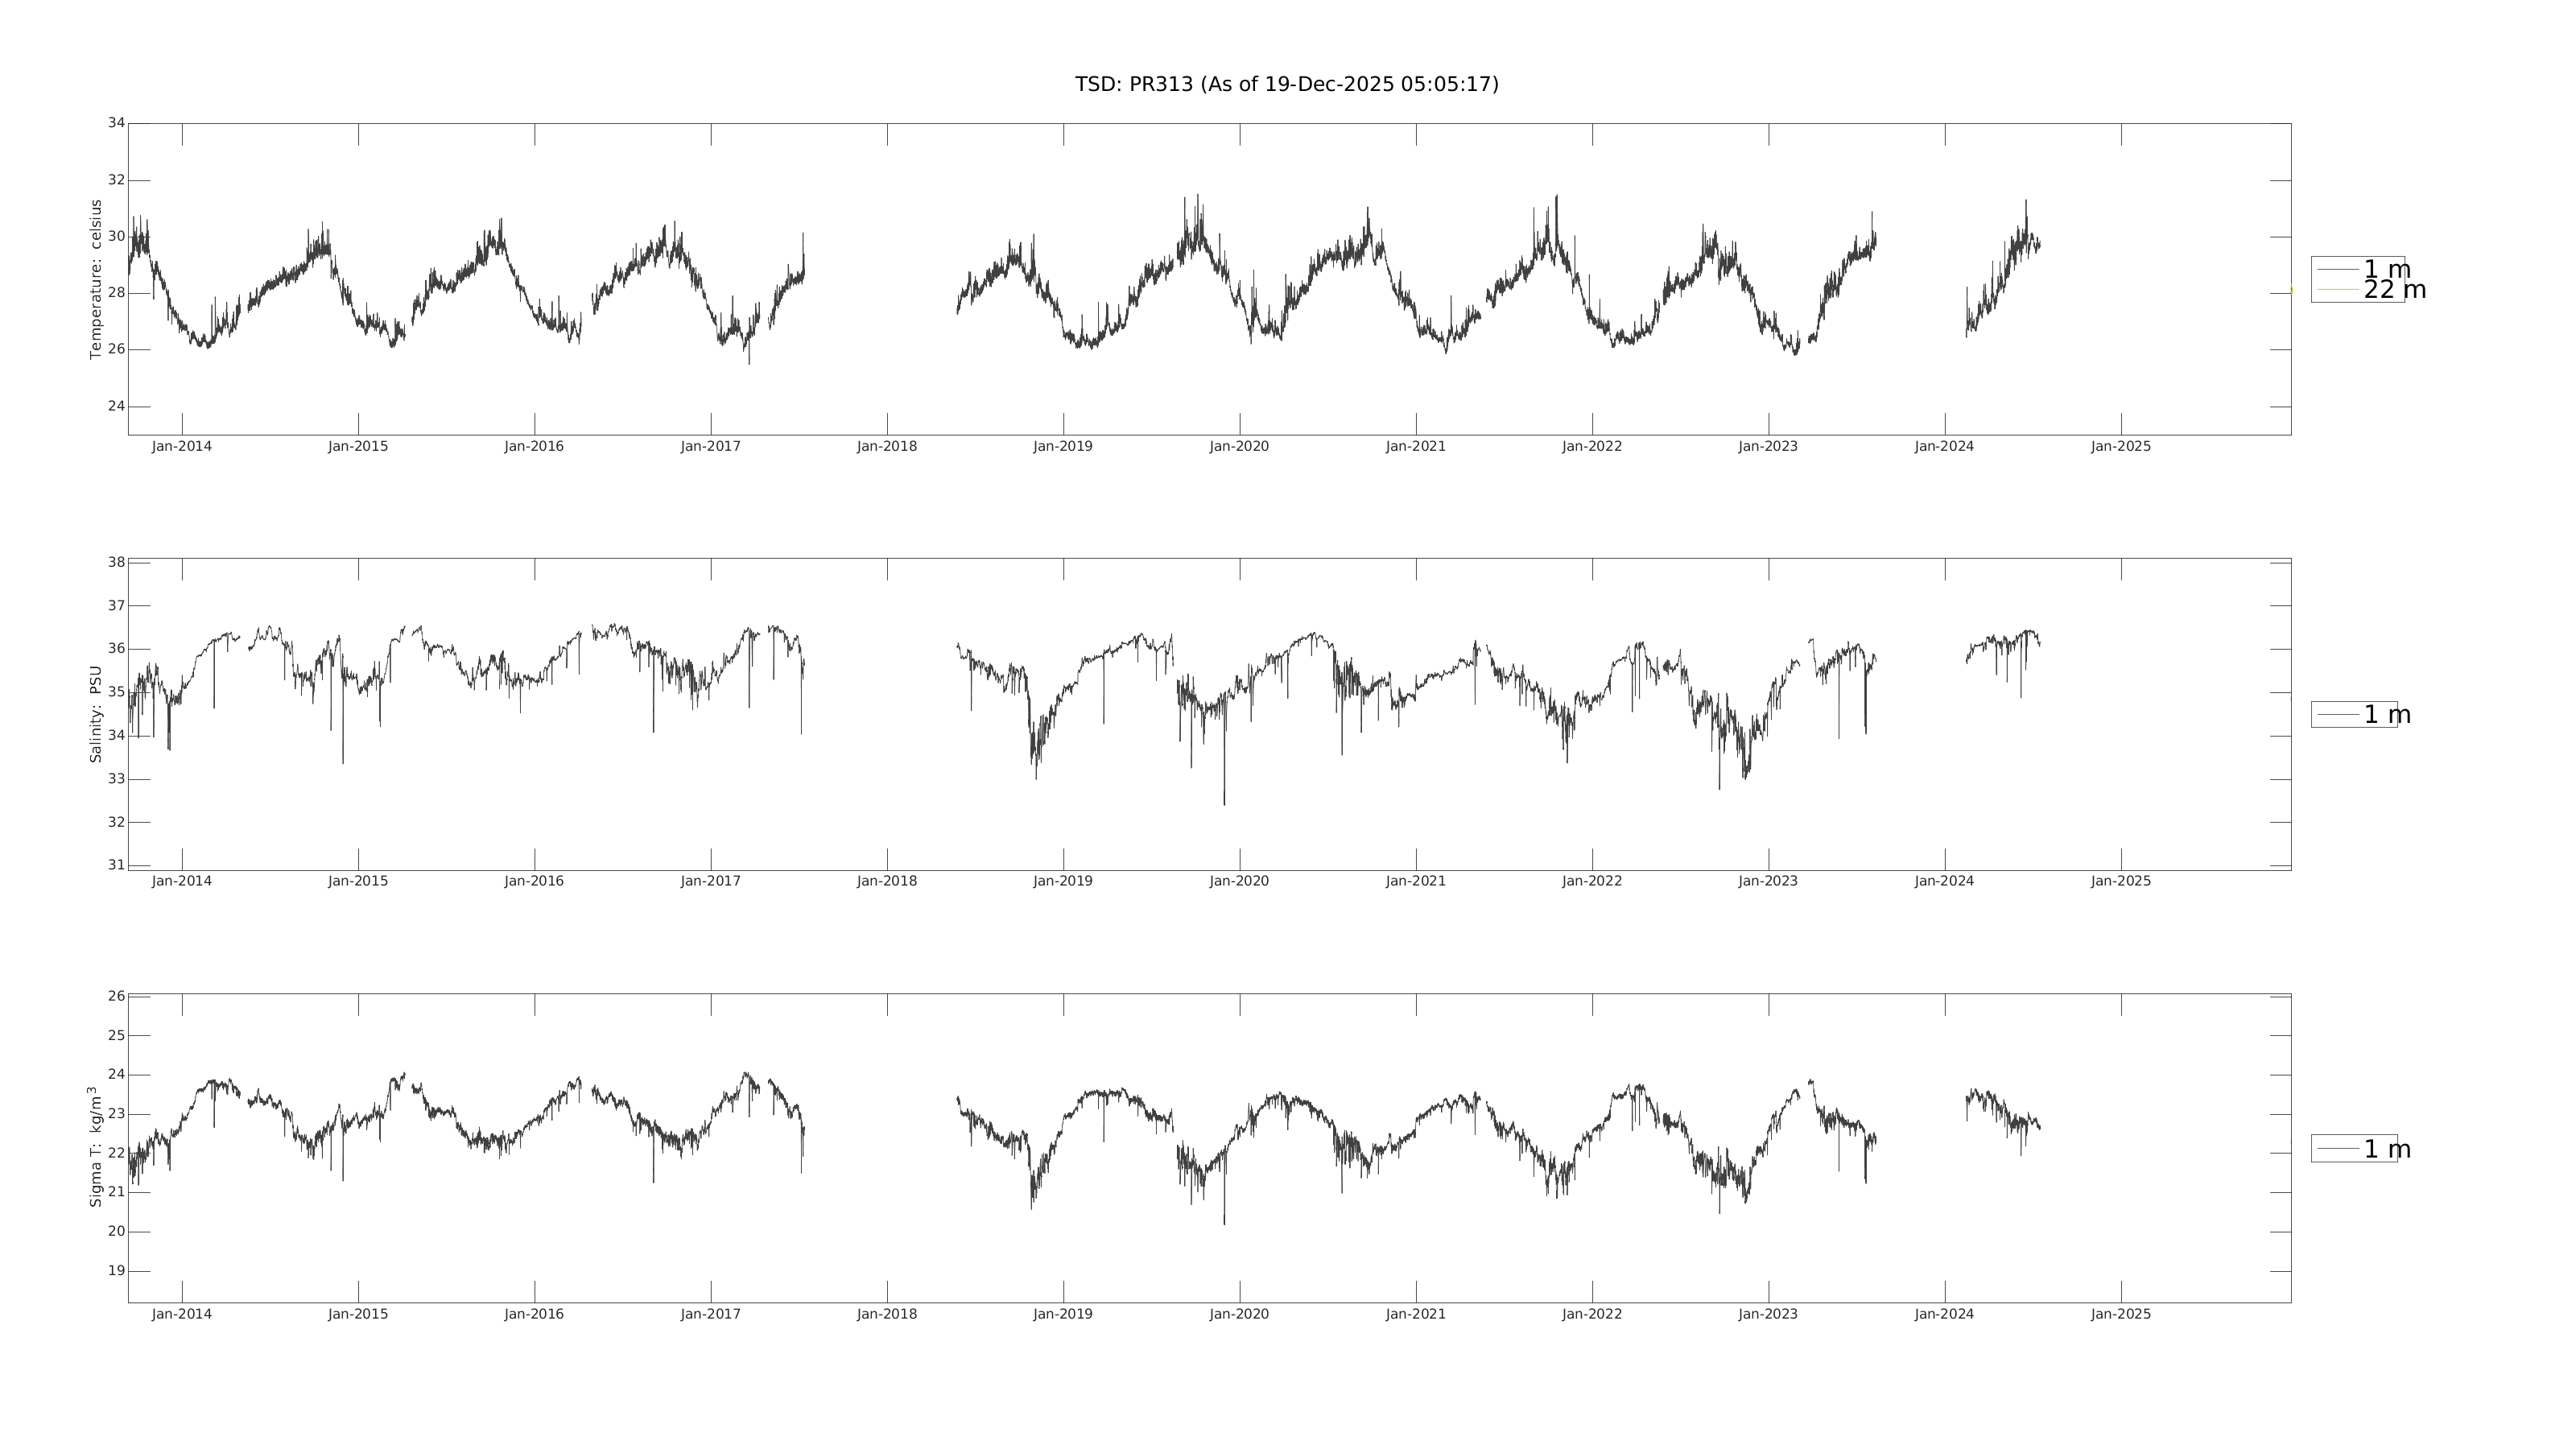 Temperature, Salinity, Density:
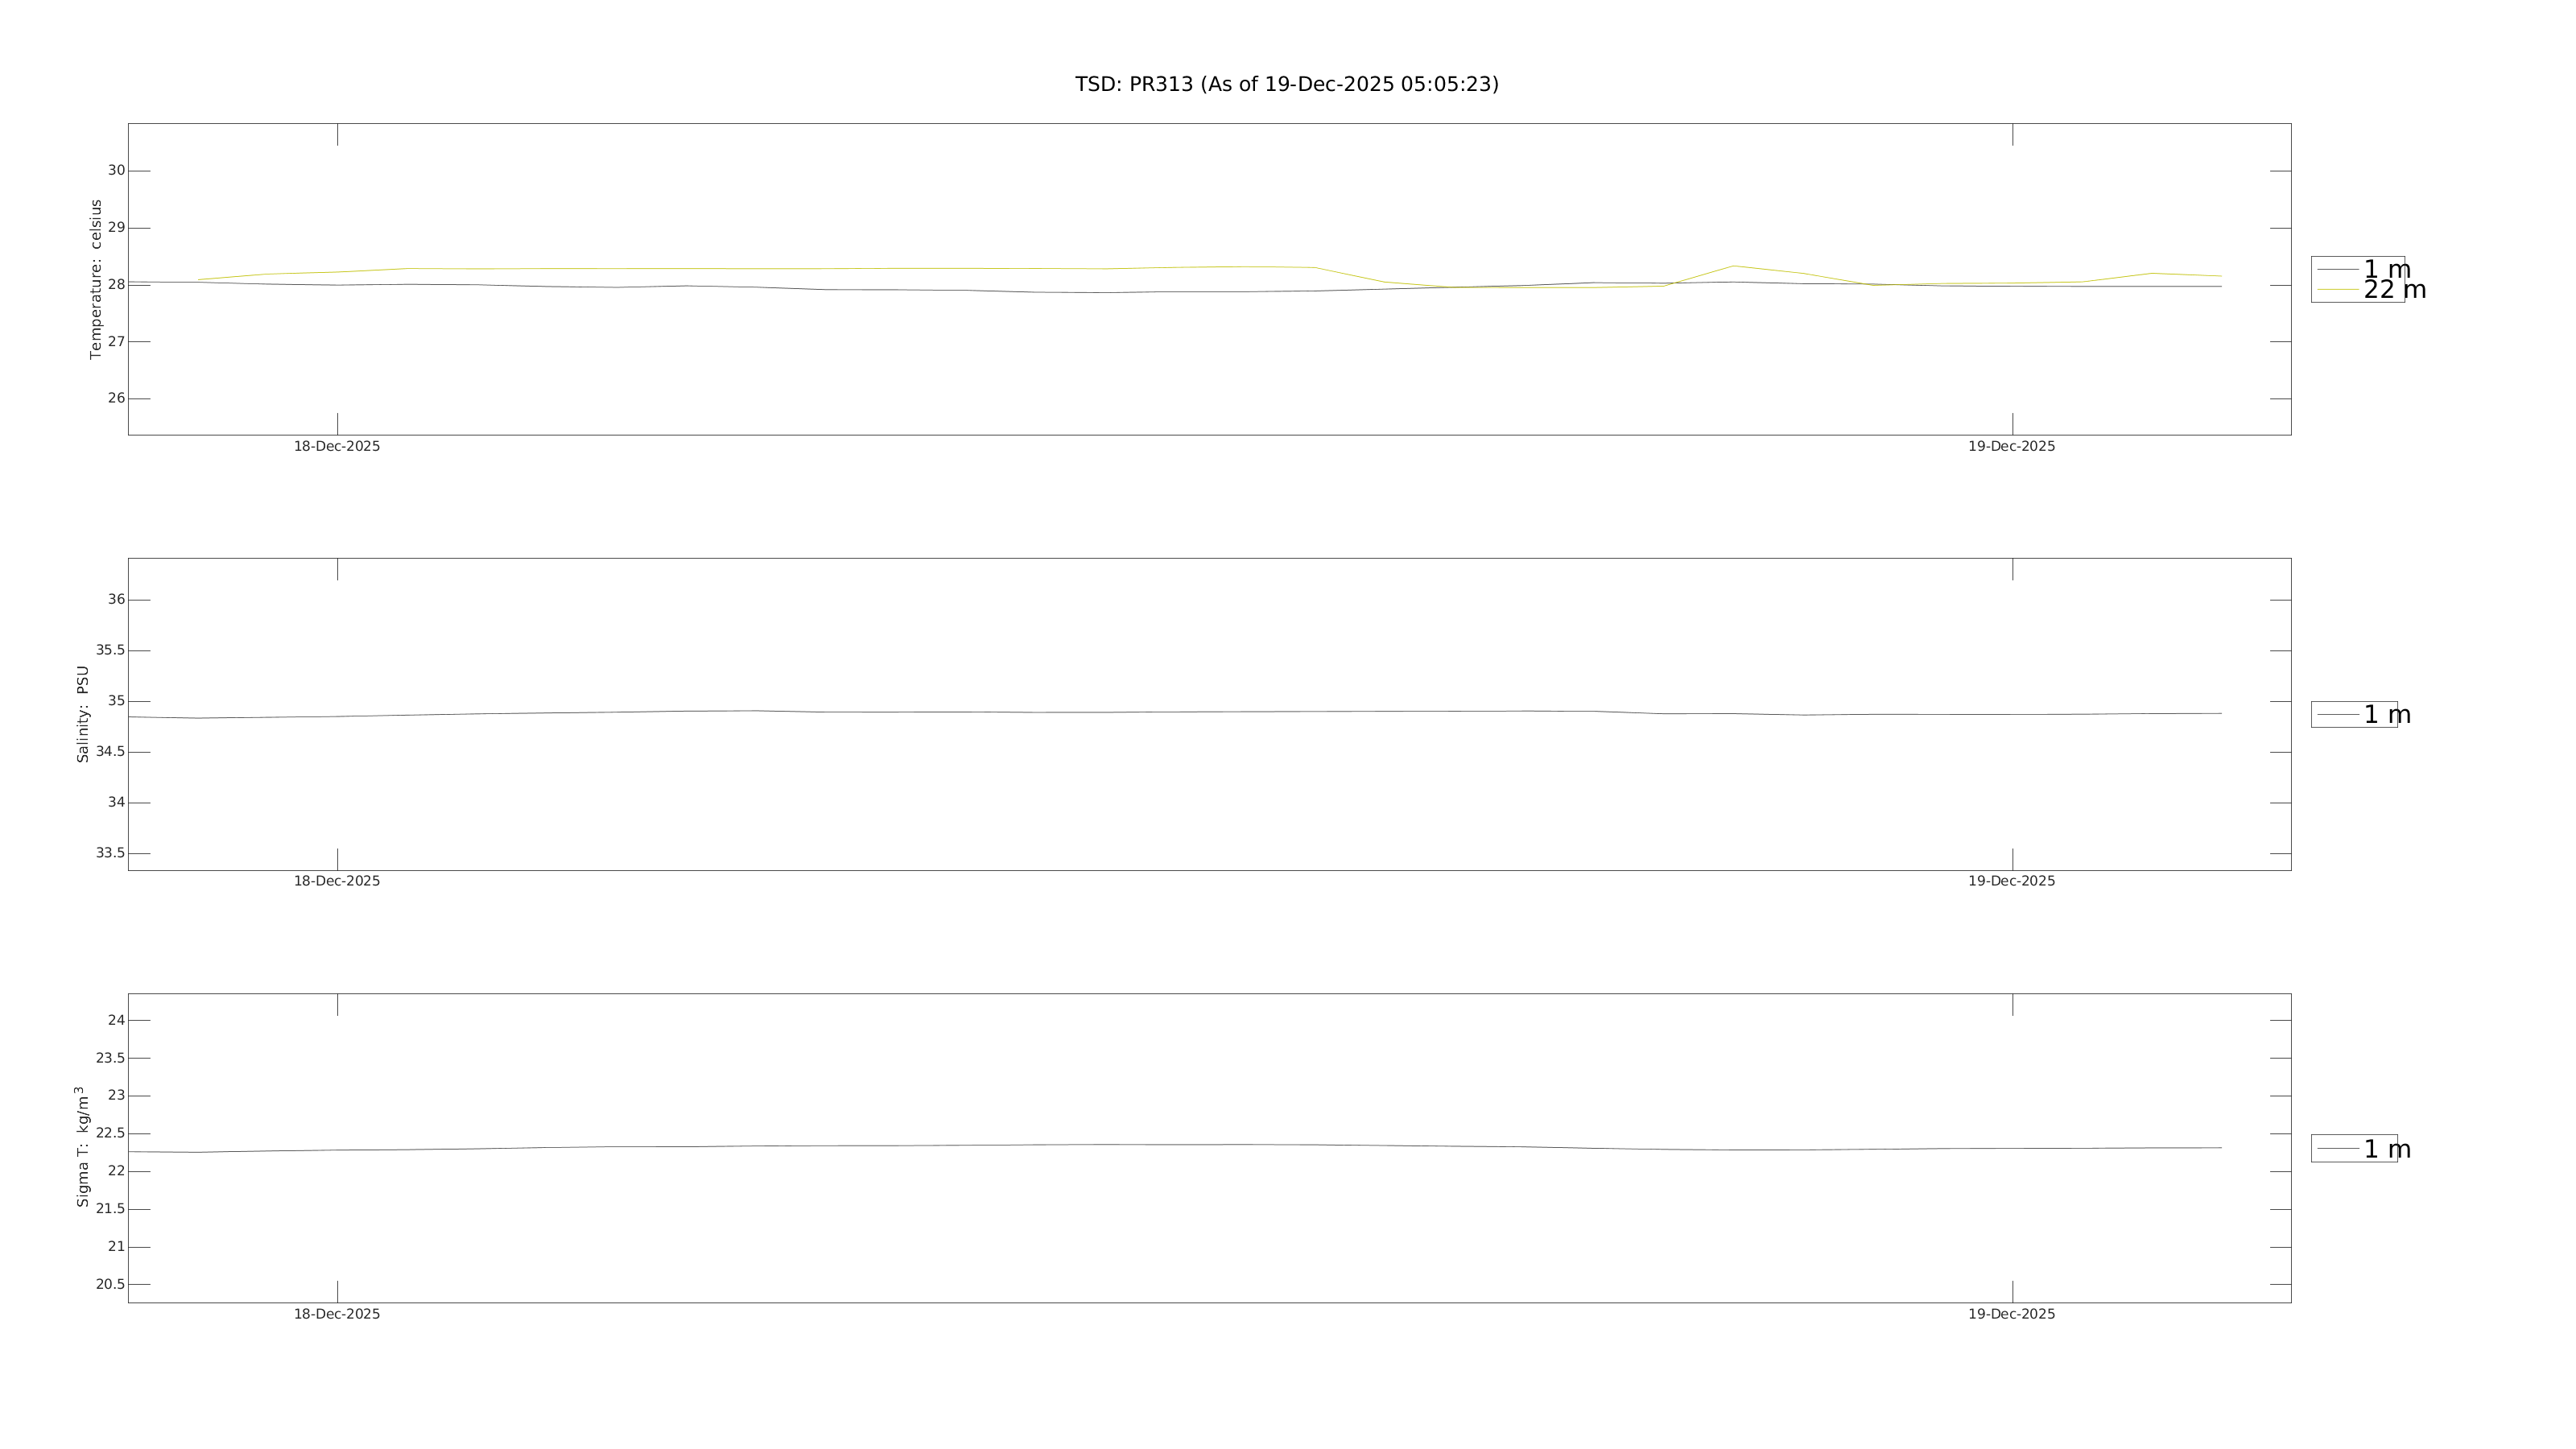
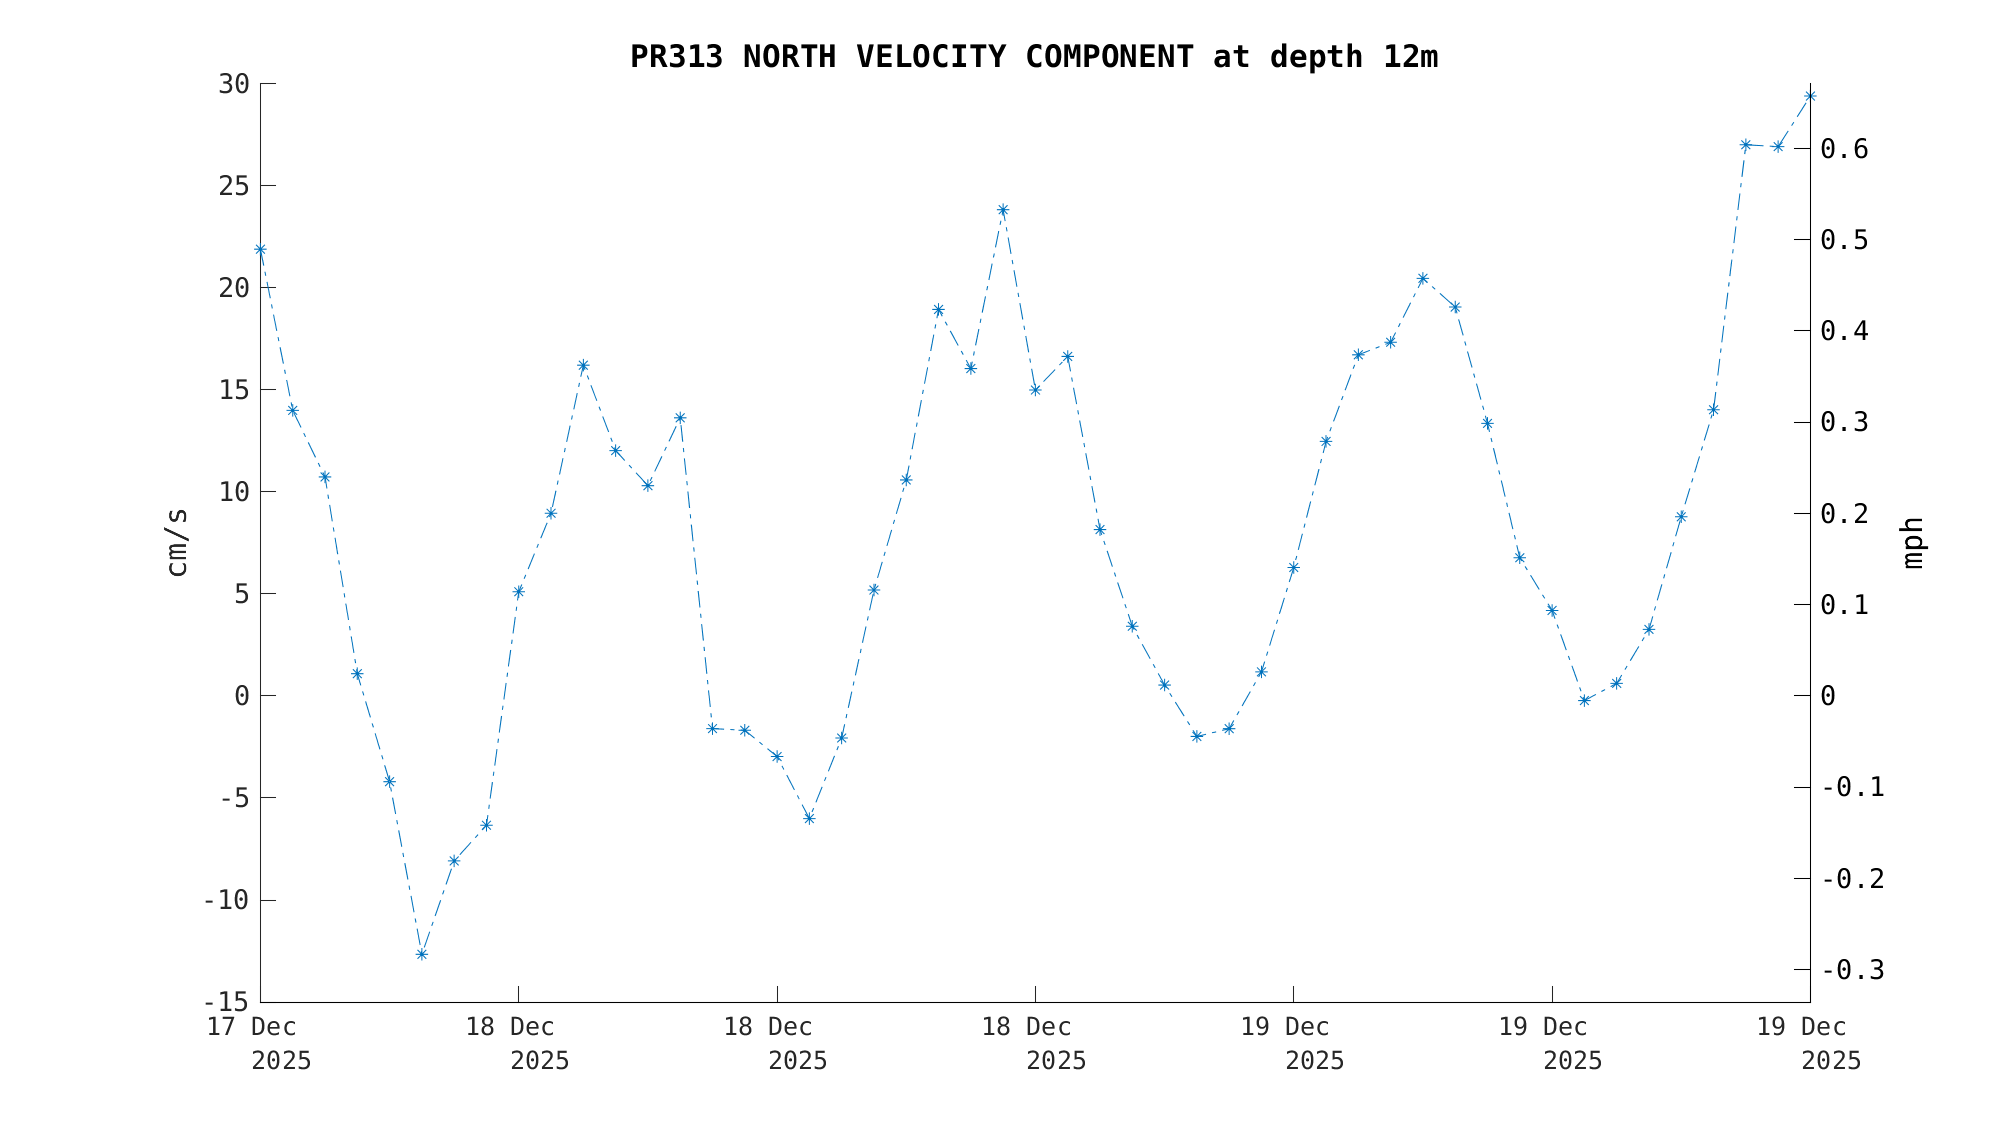
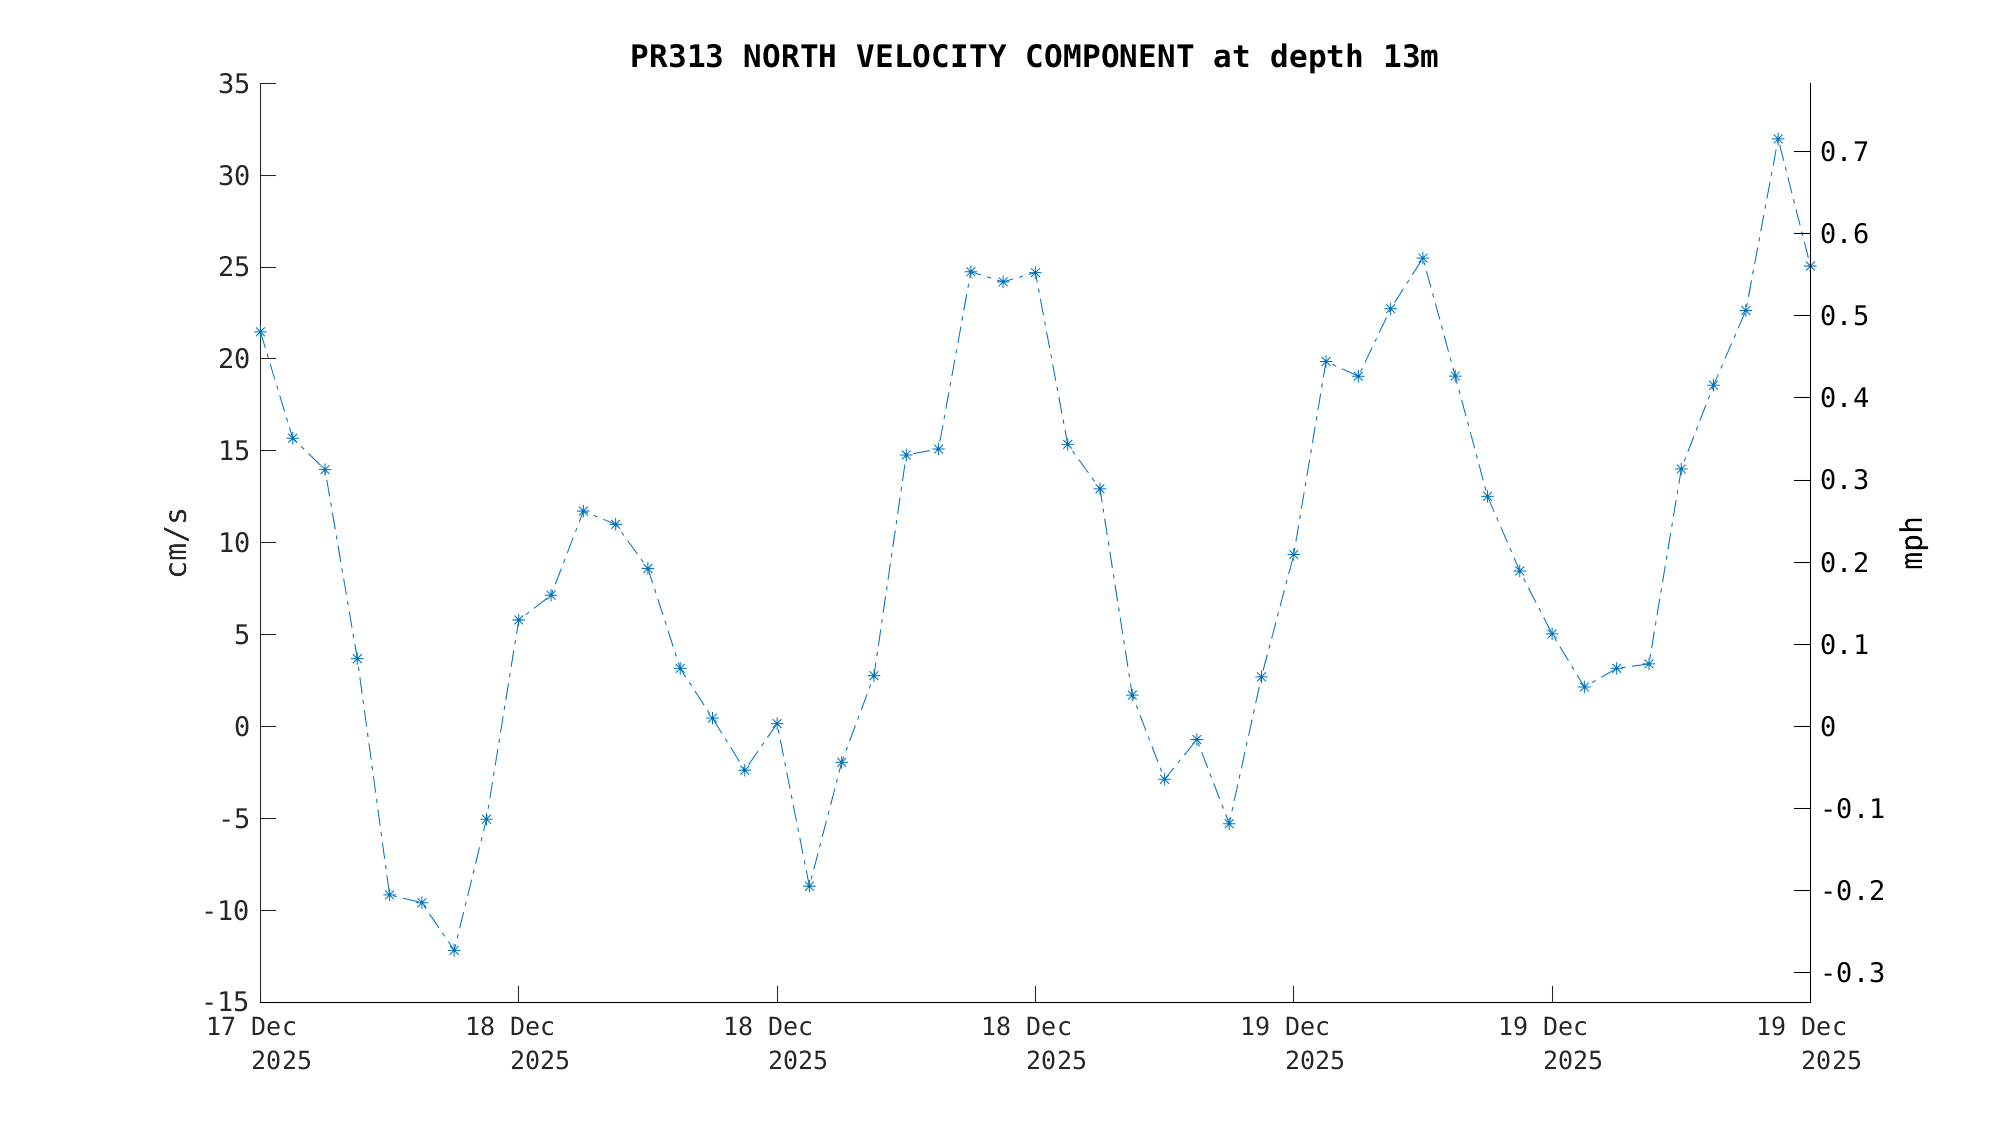
 Temperature, Salinity, Density (Deployment Only):
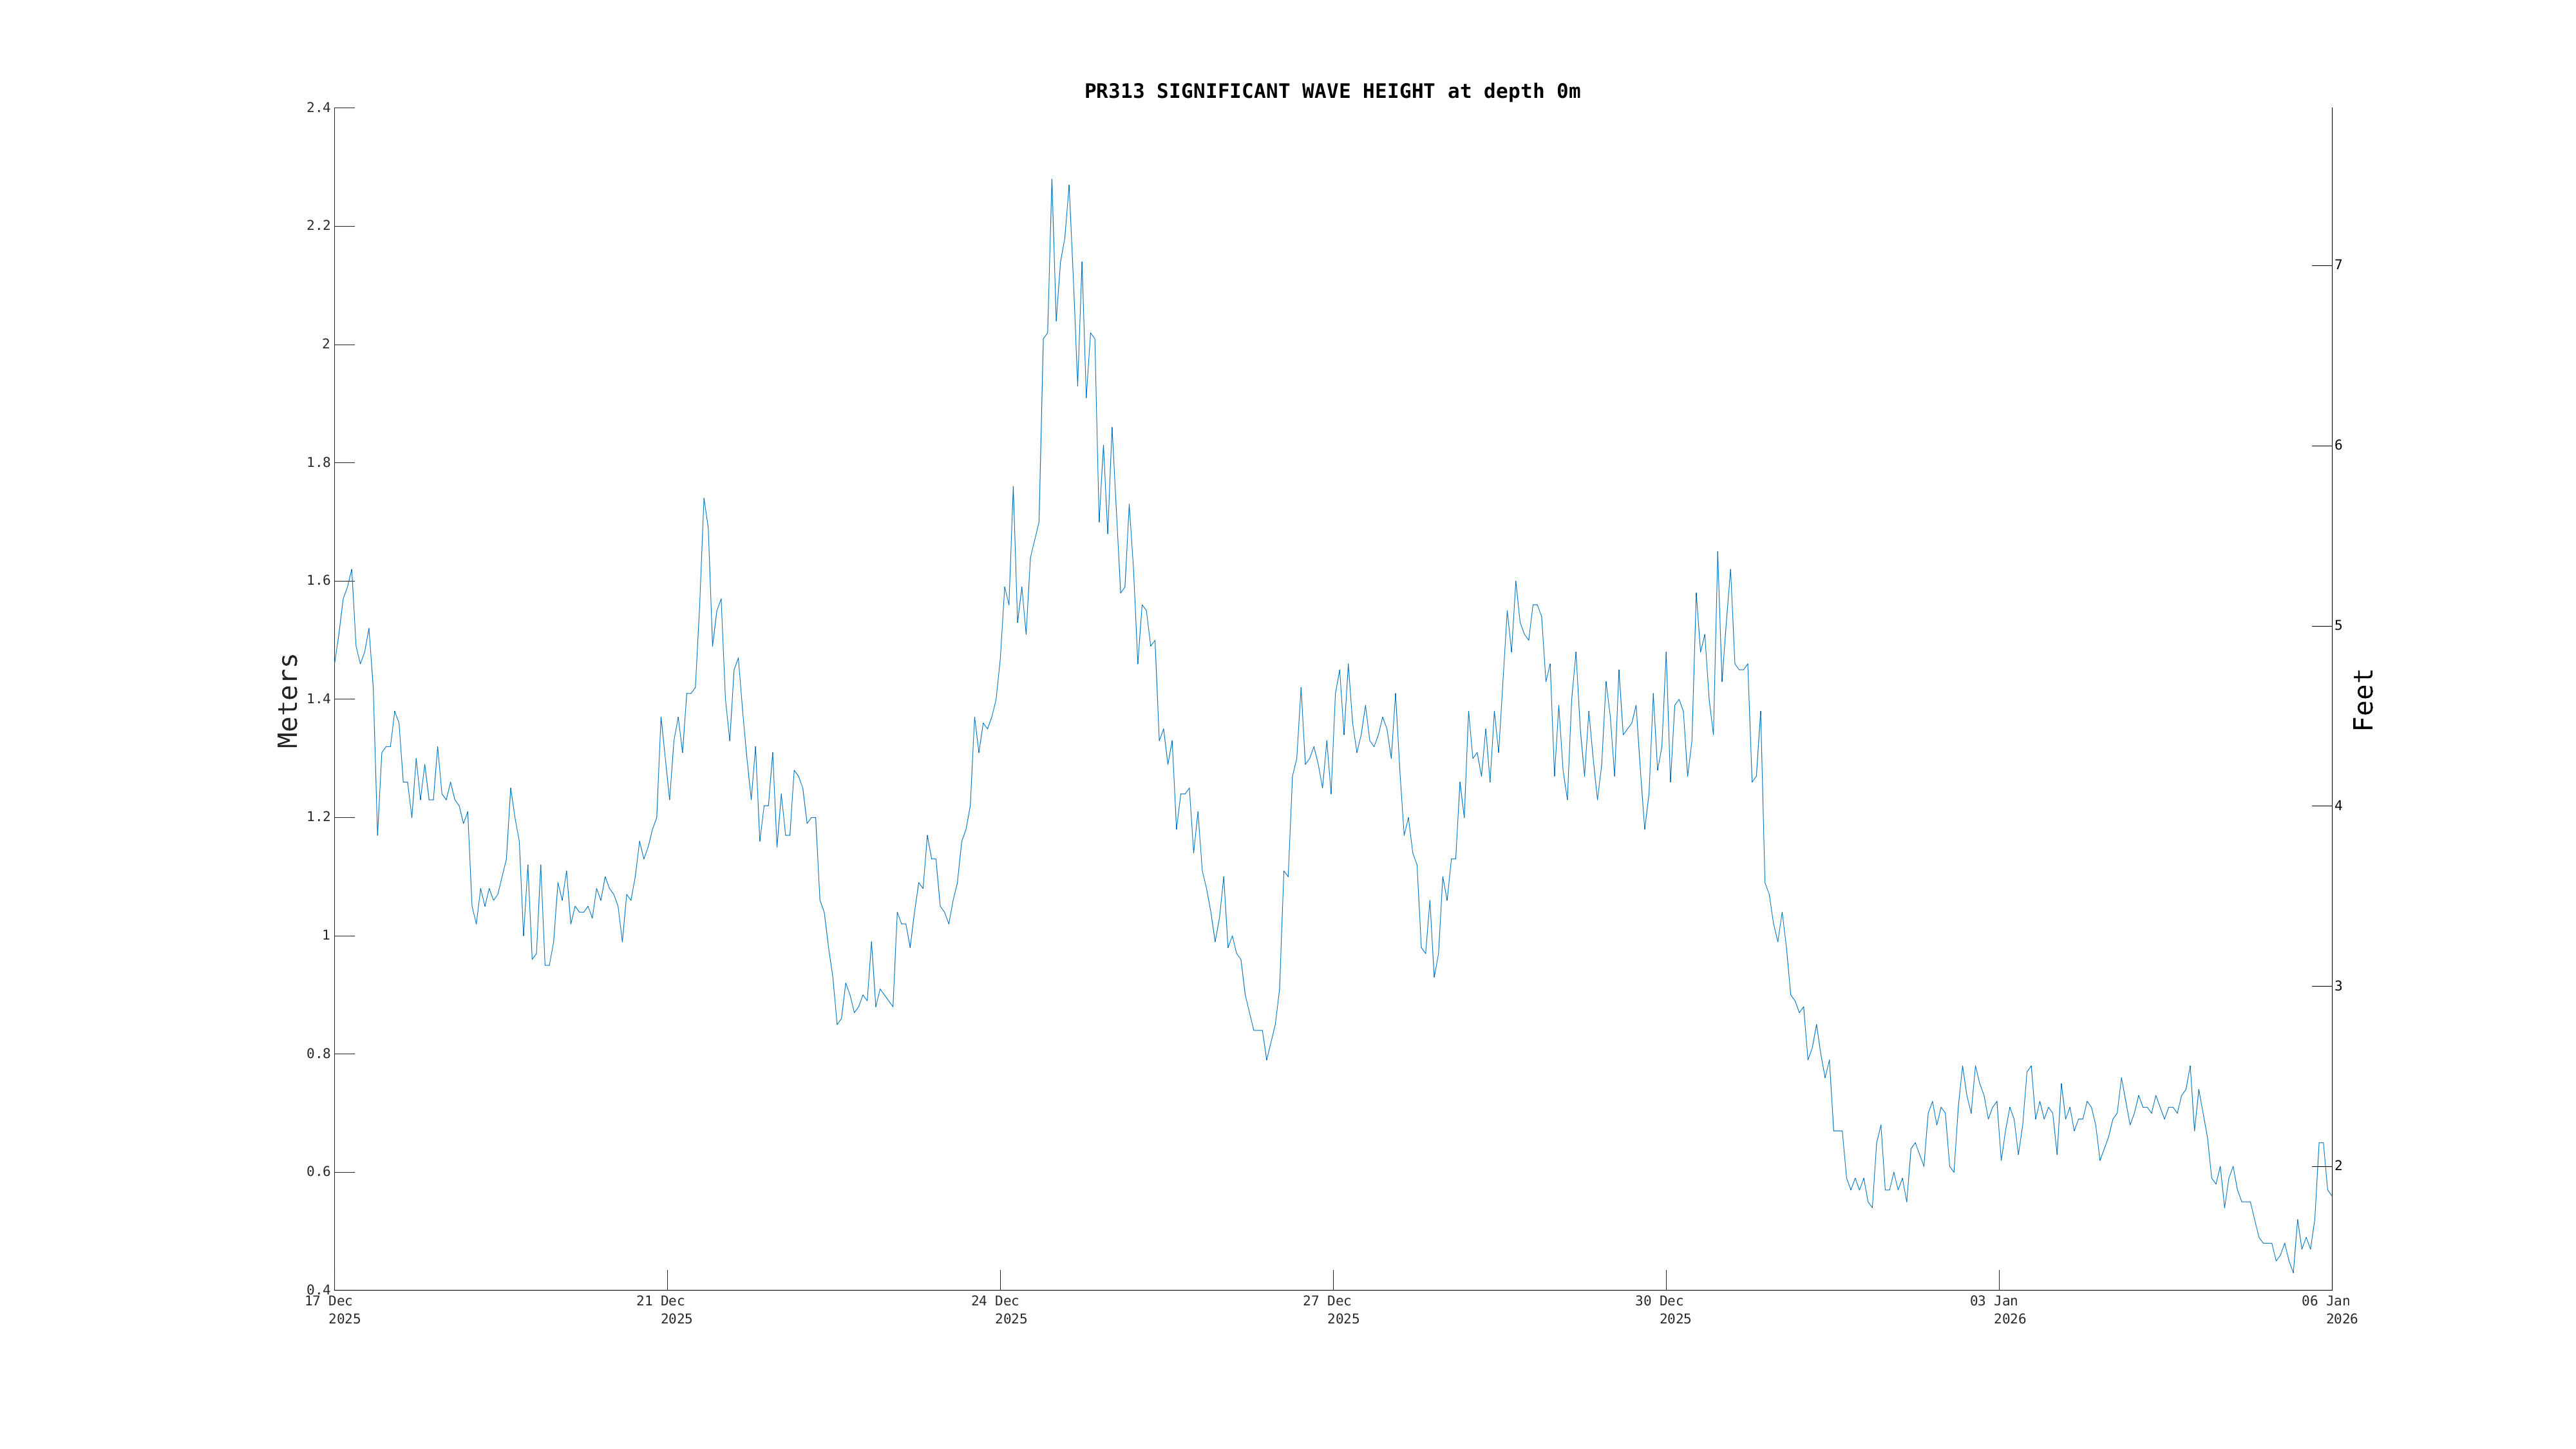

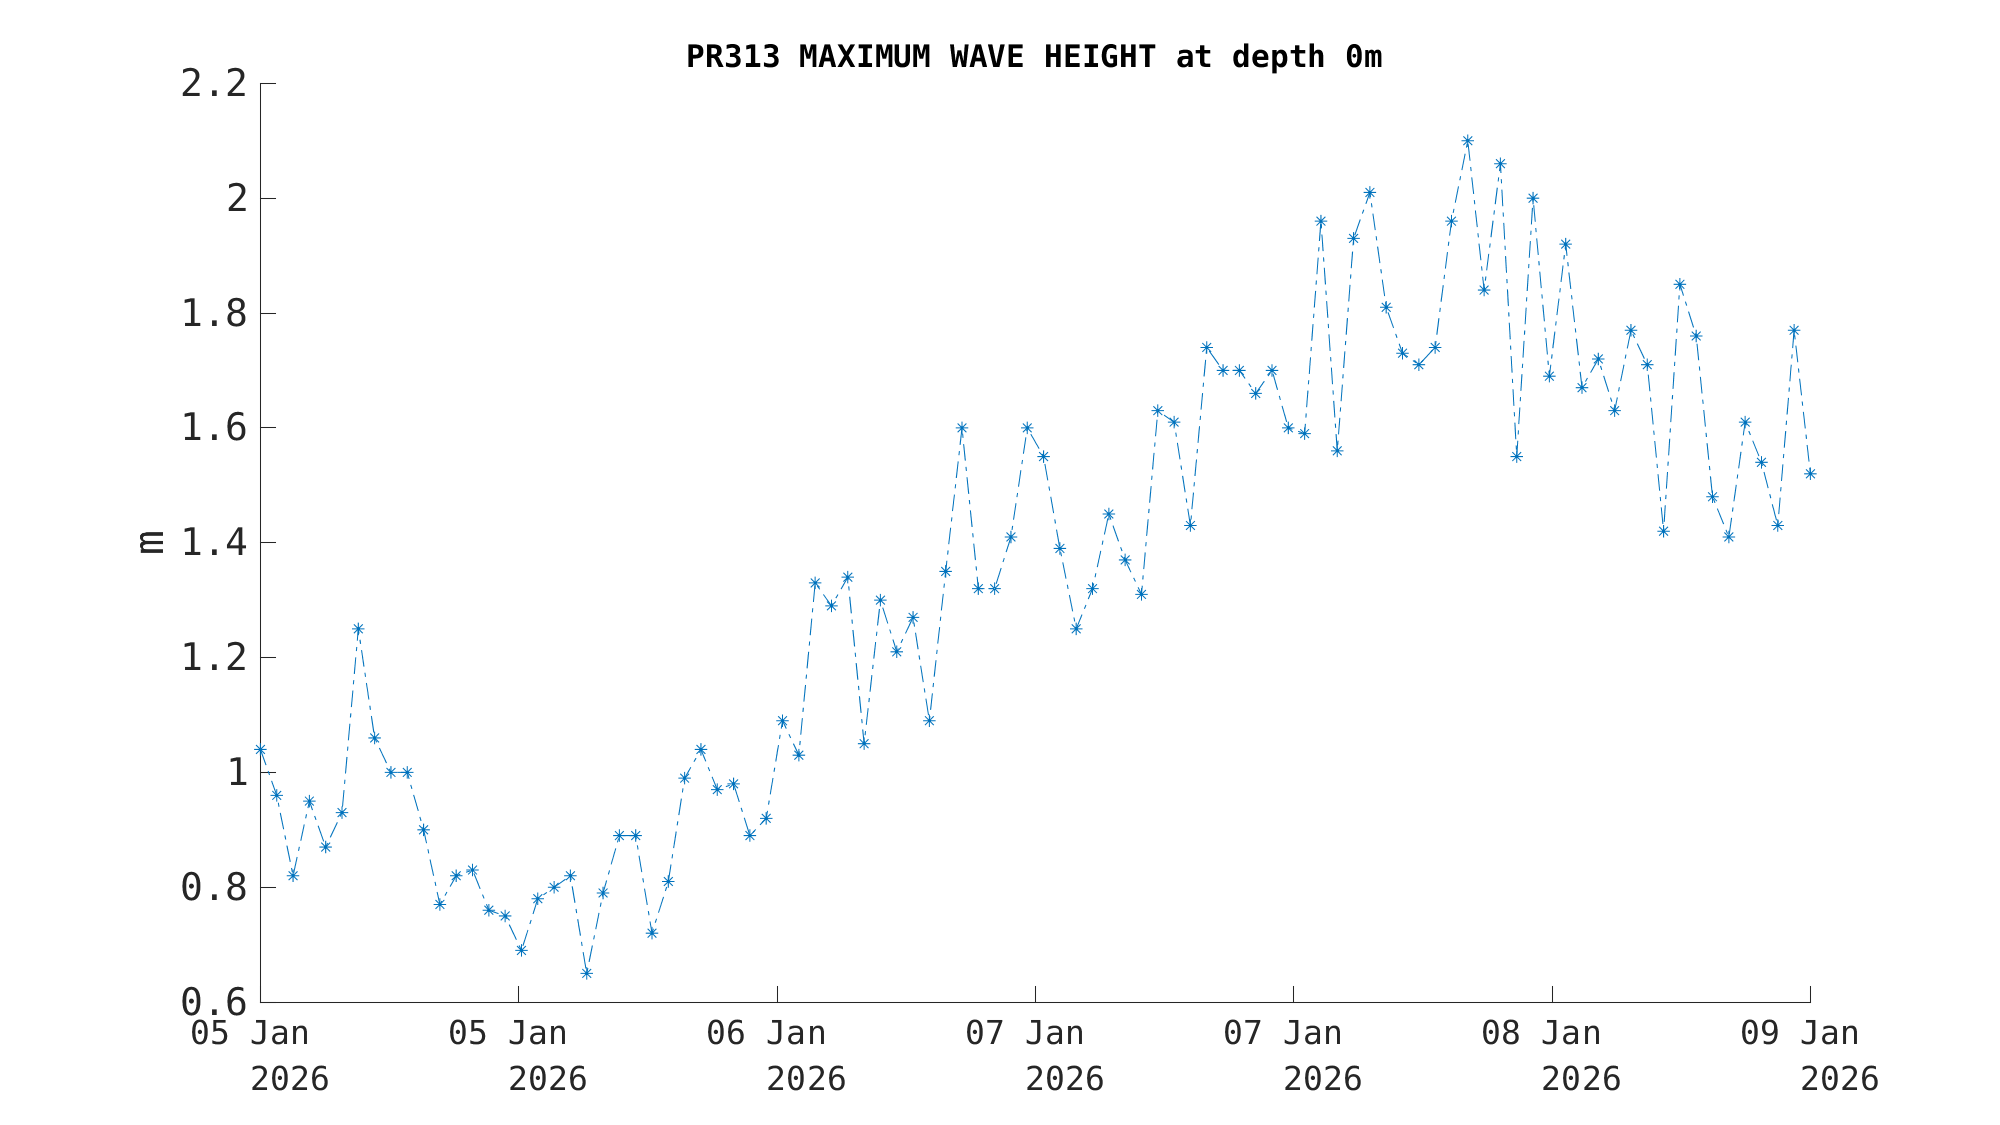
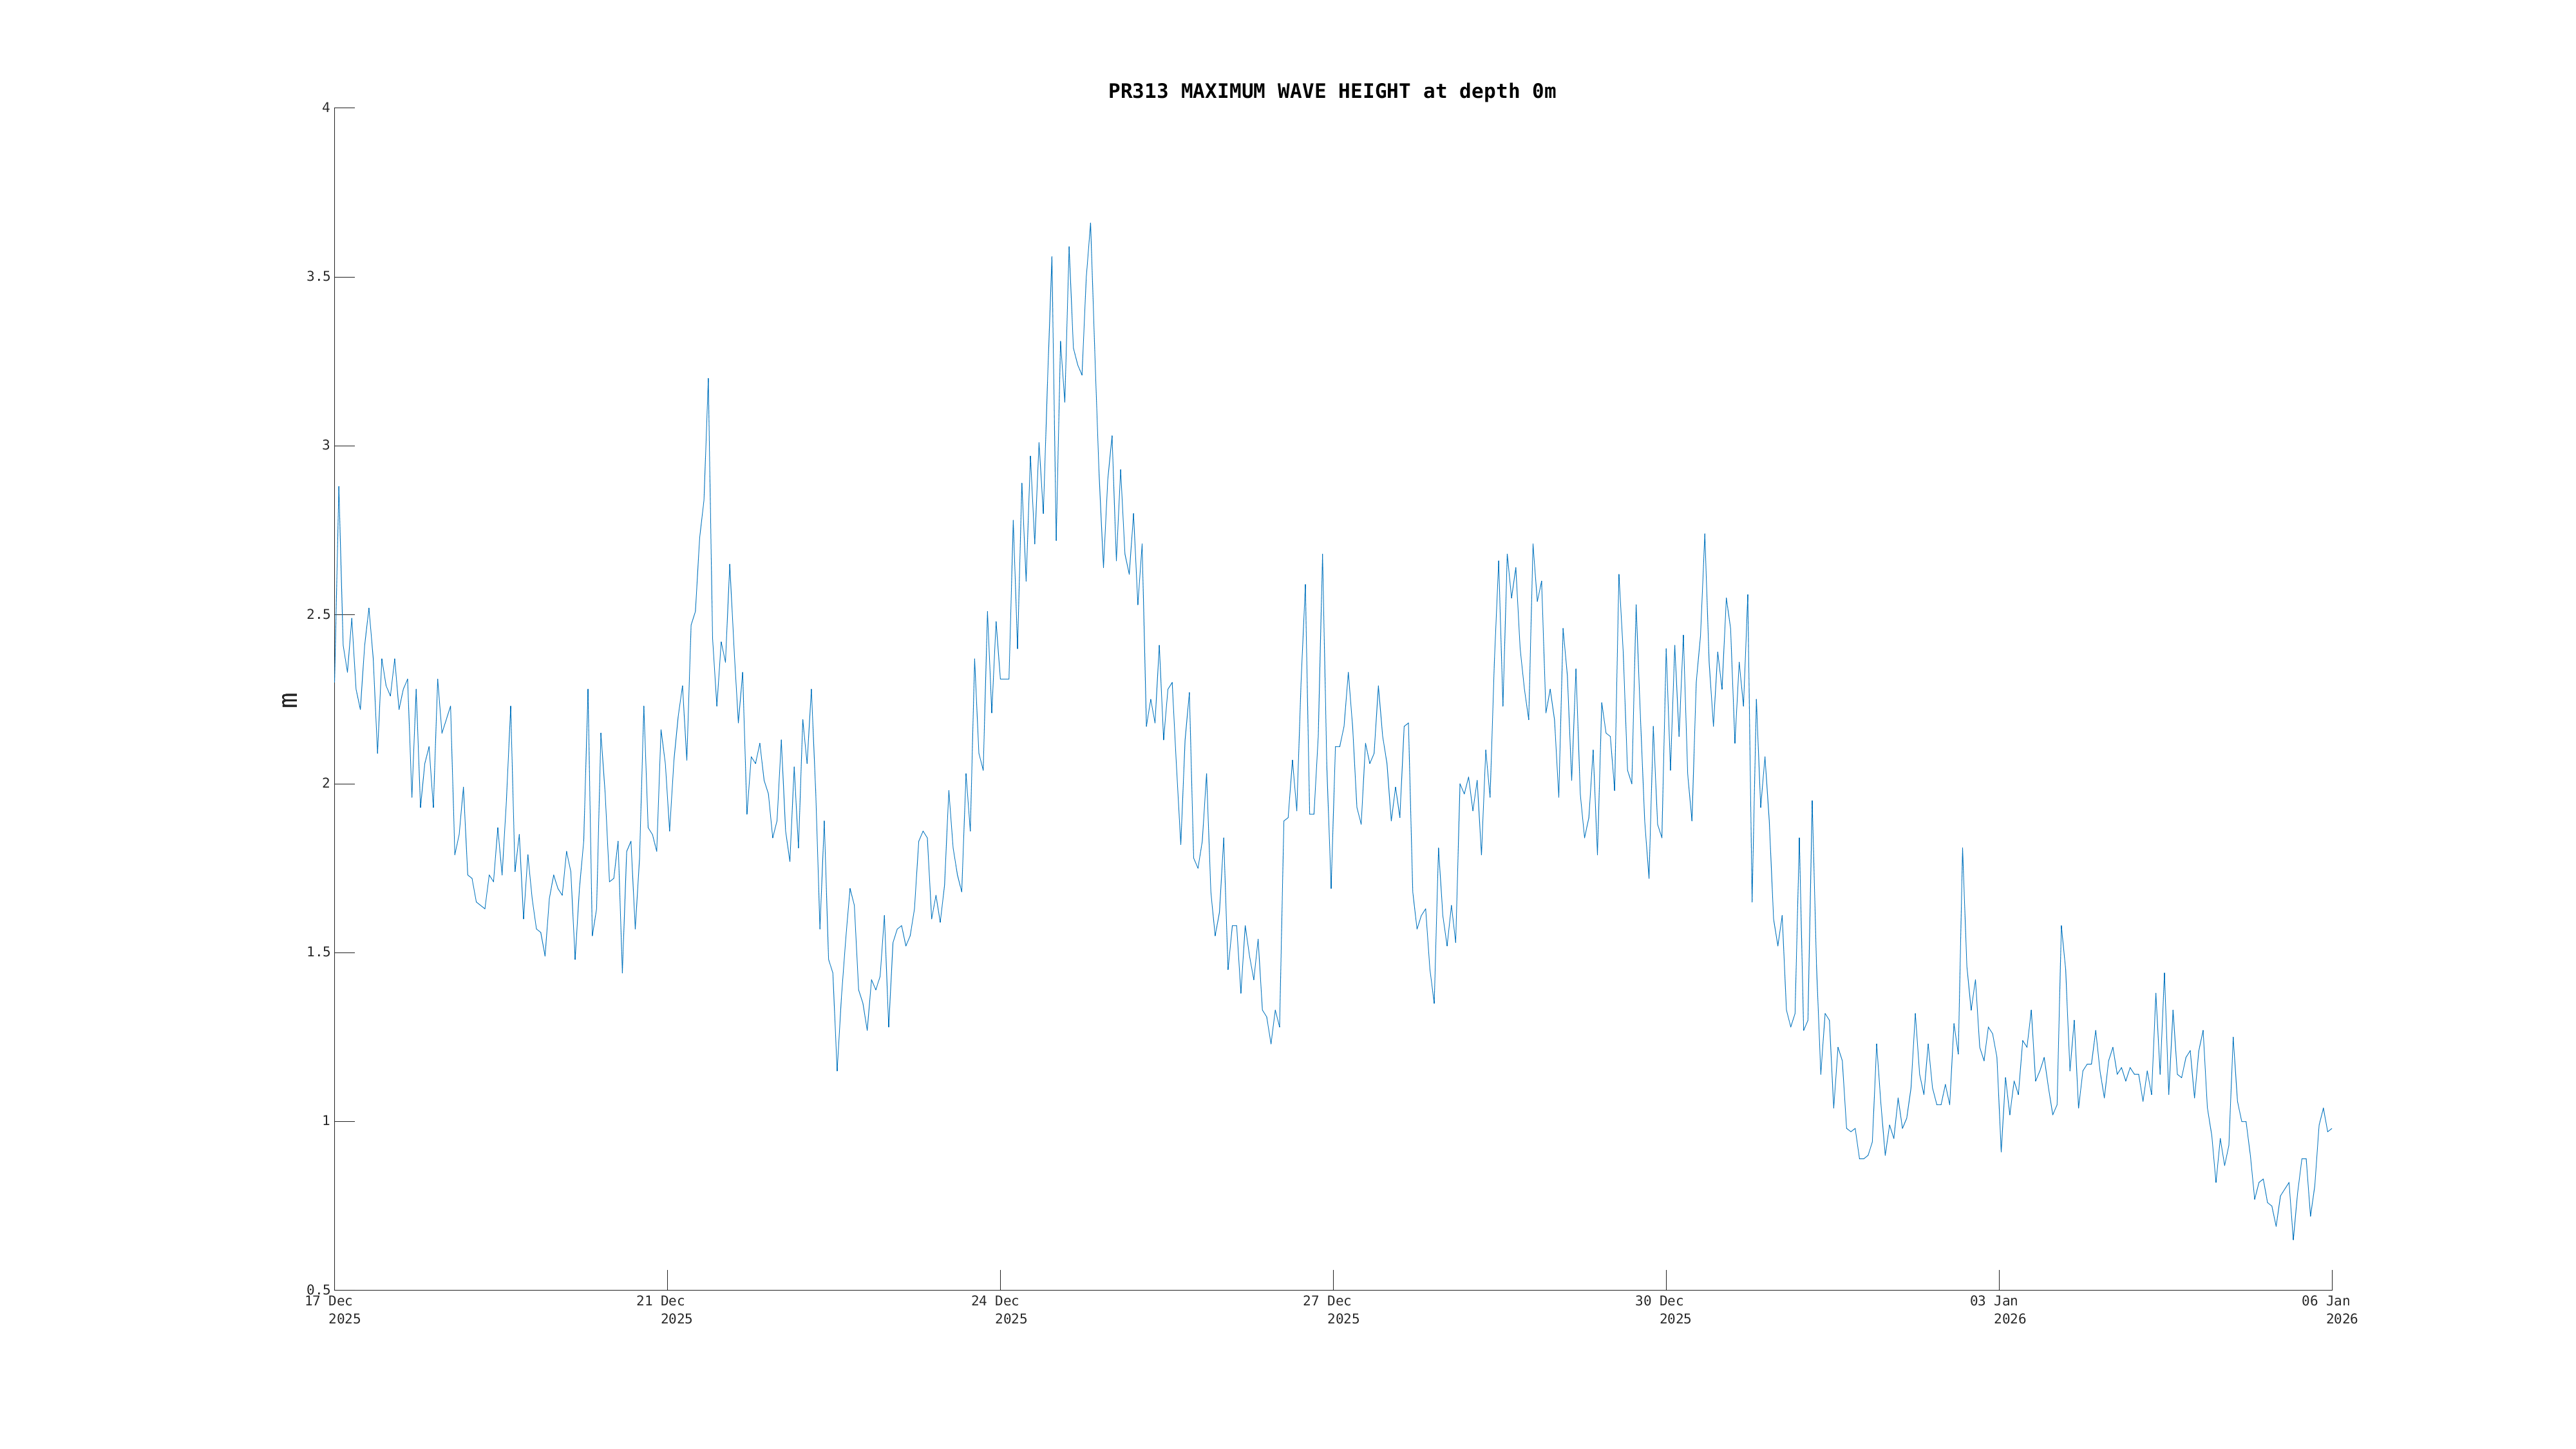
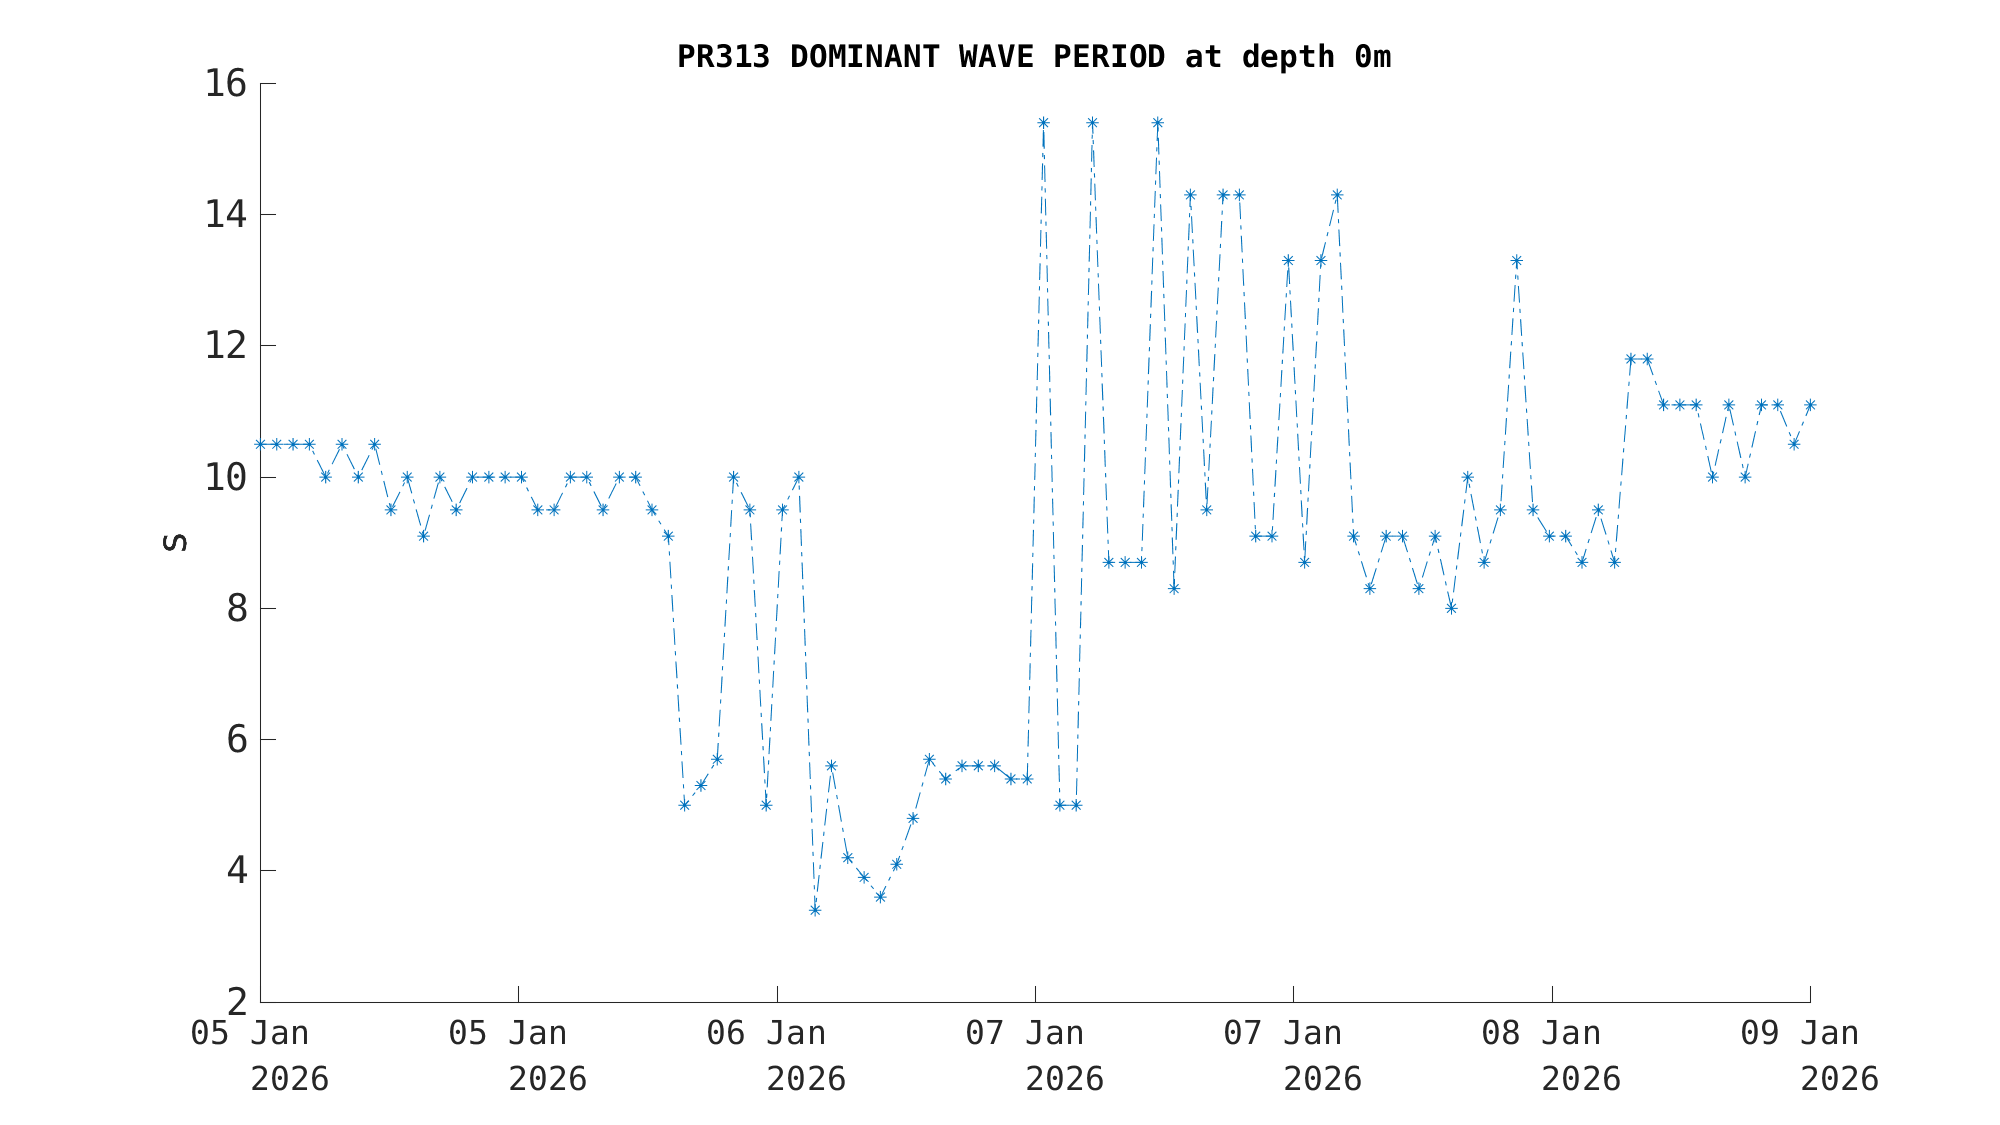
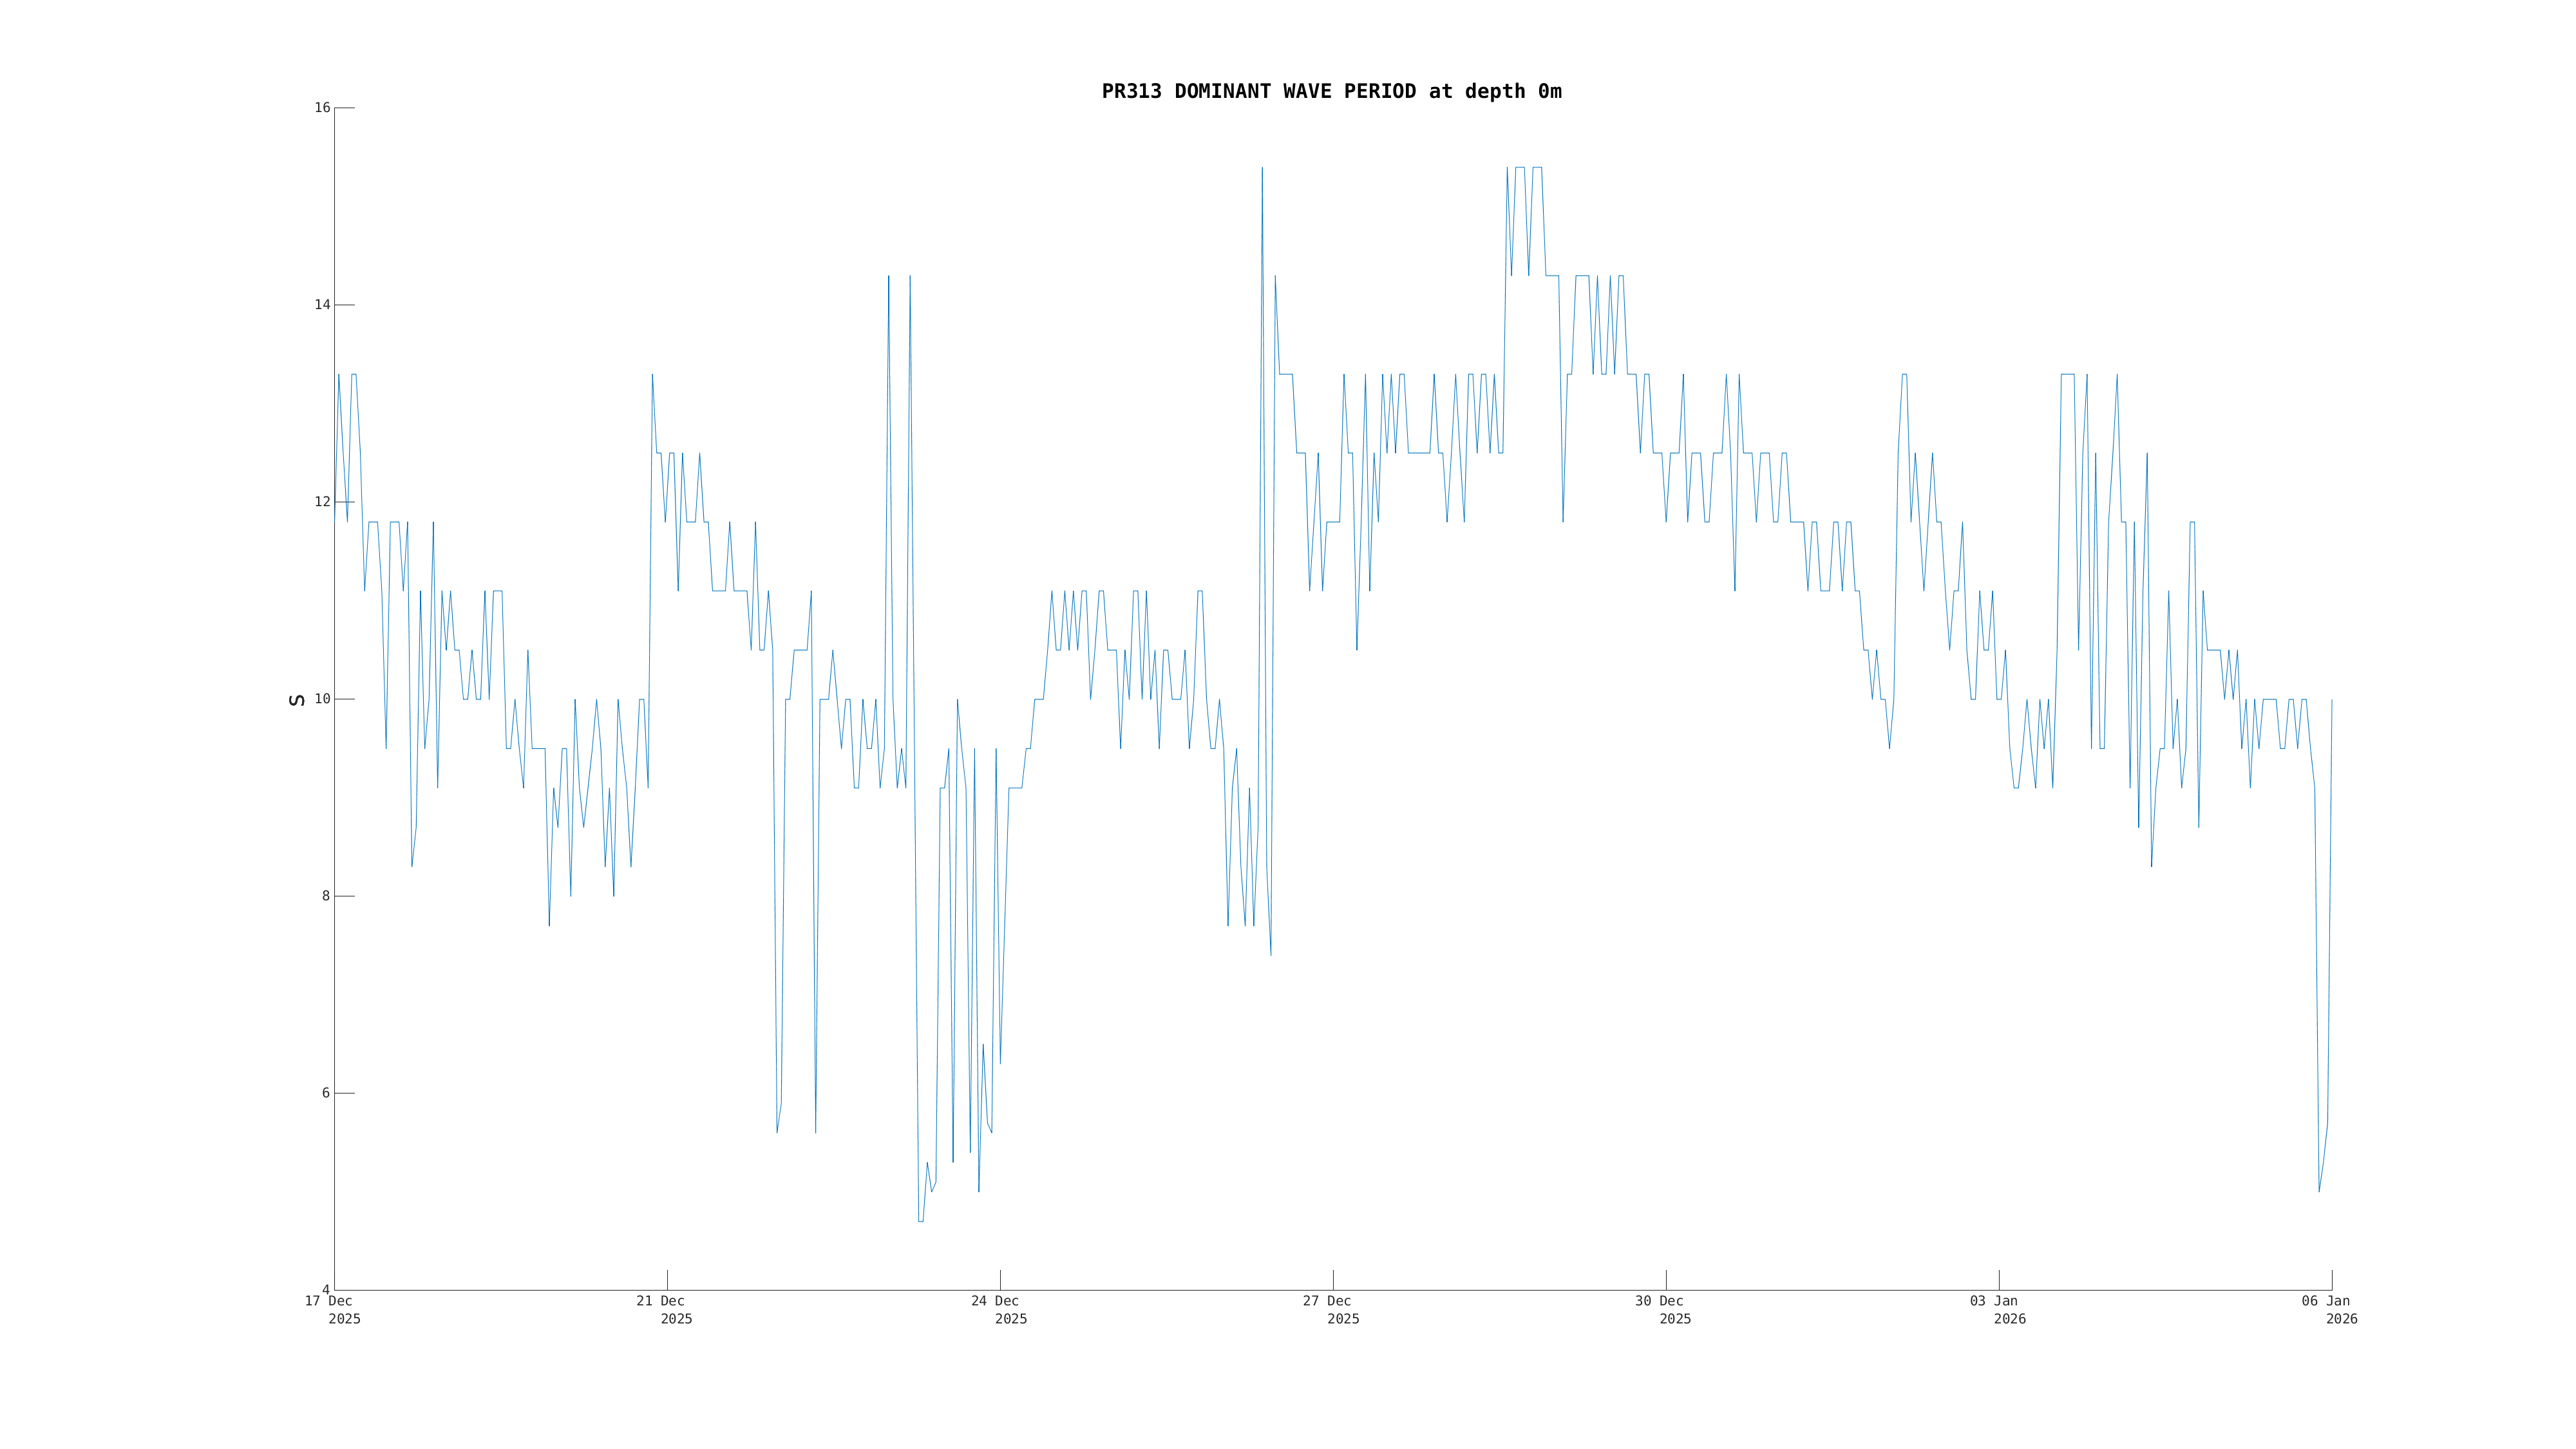

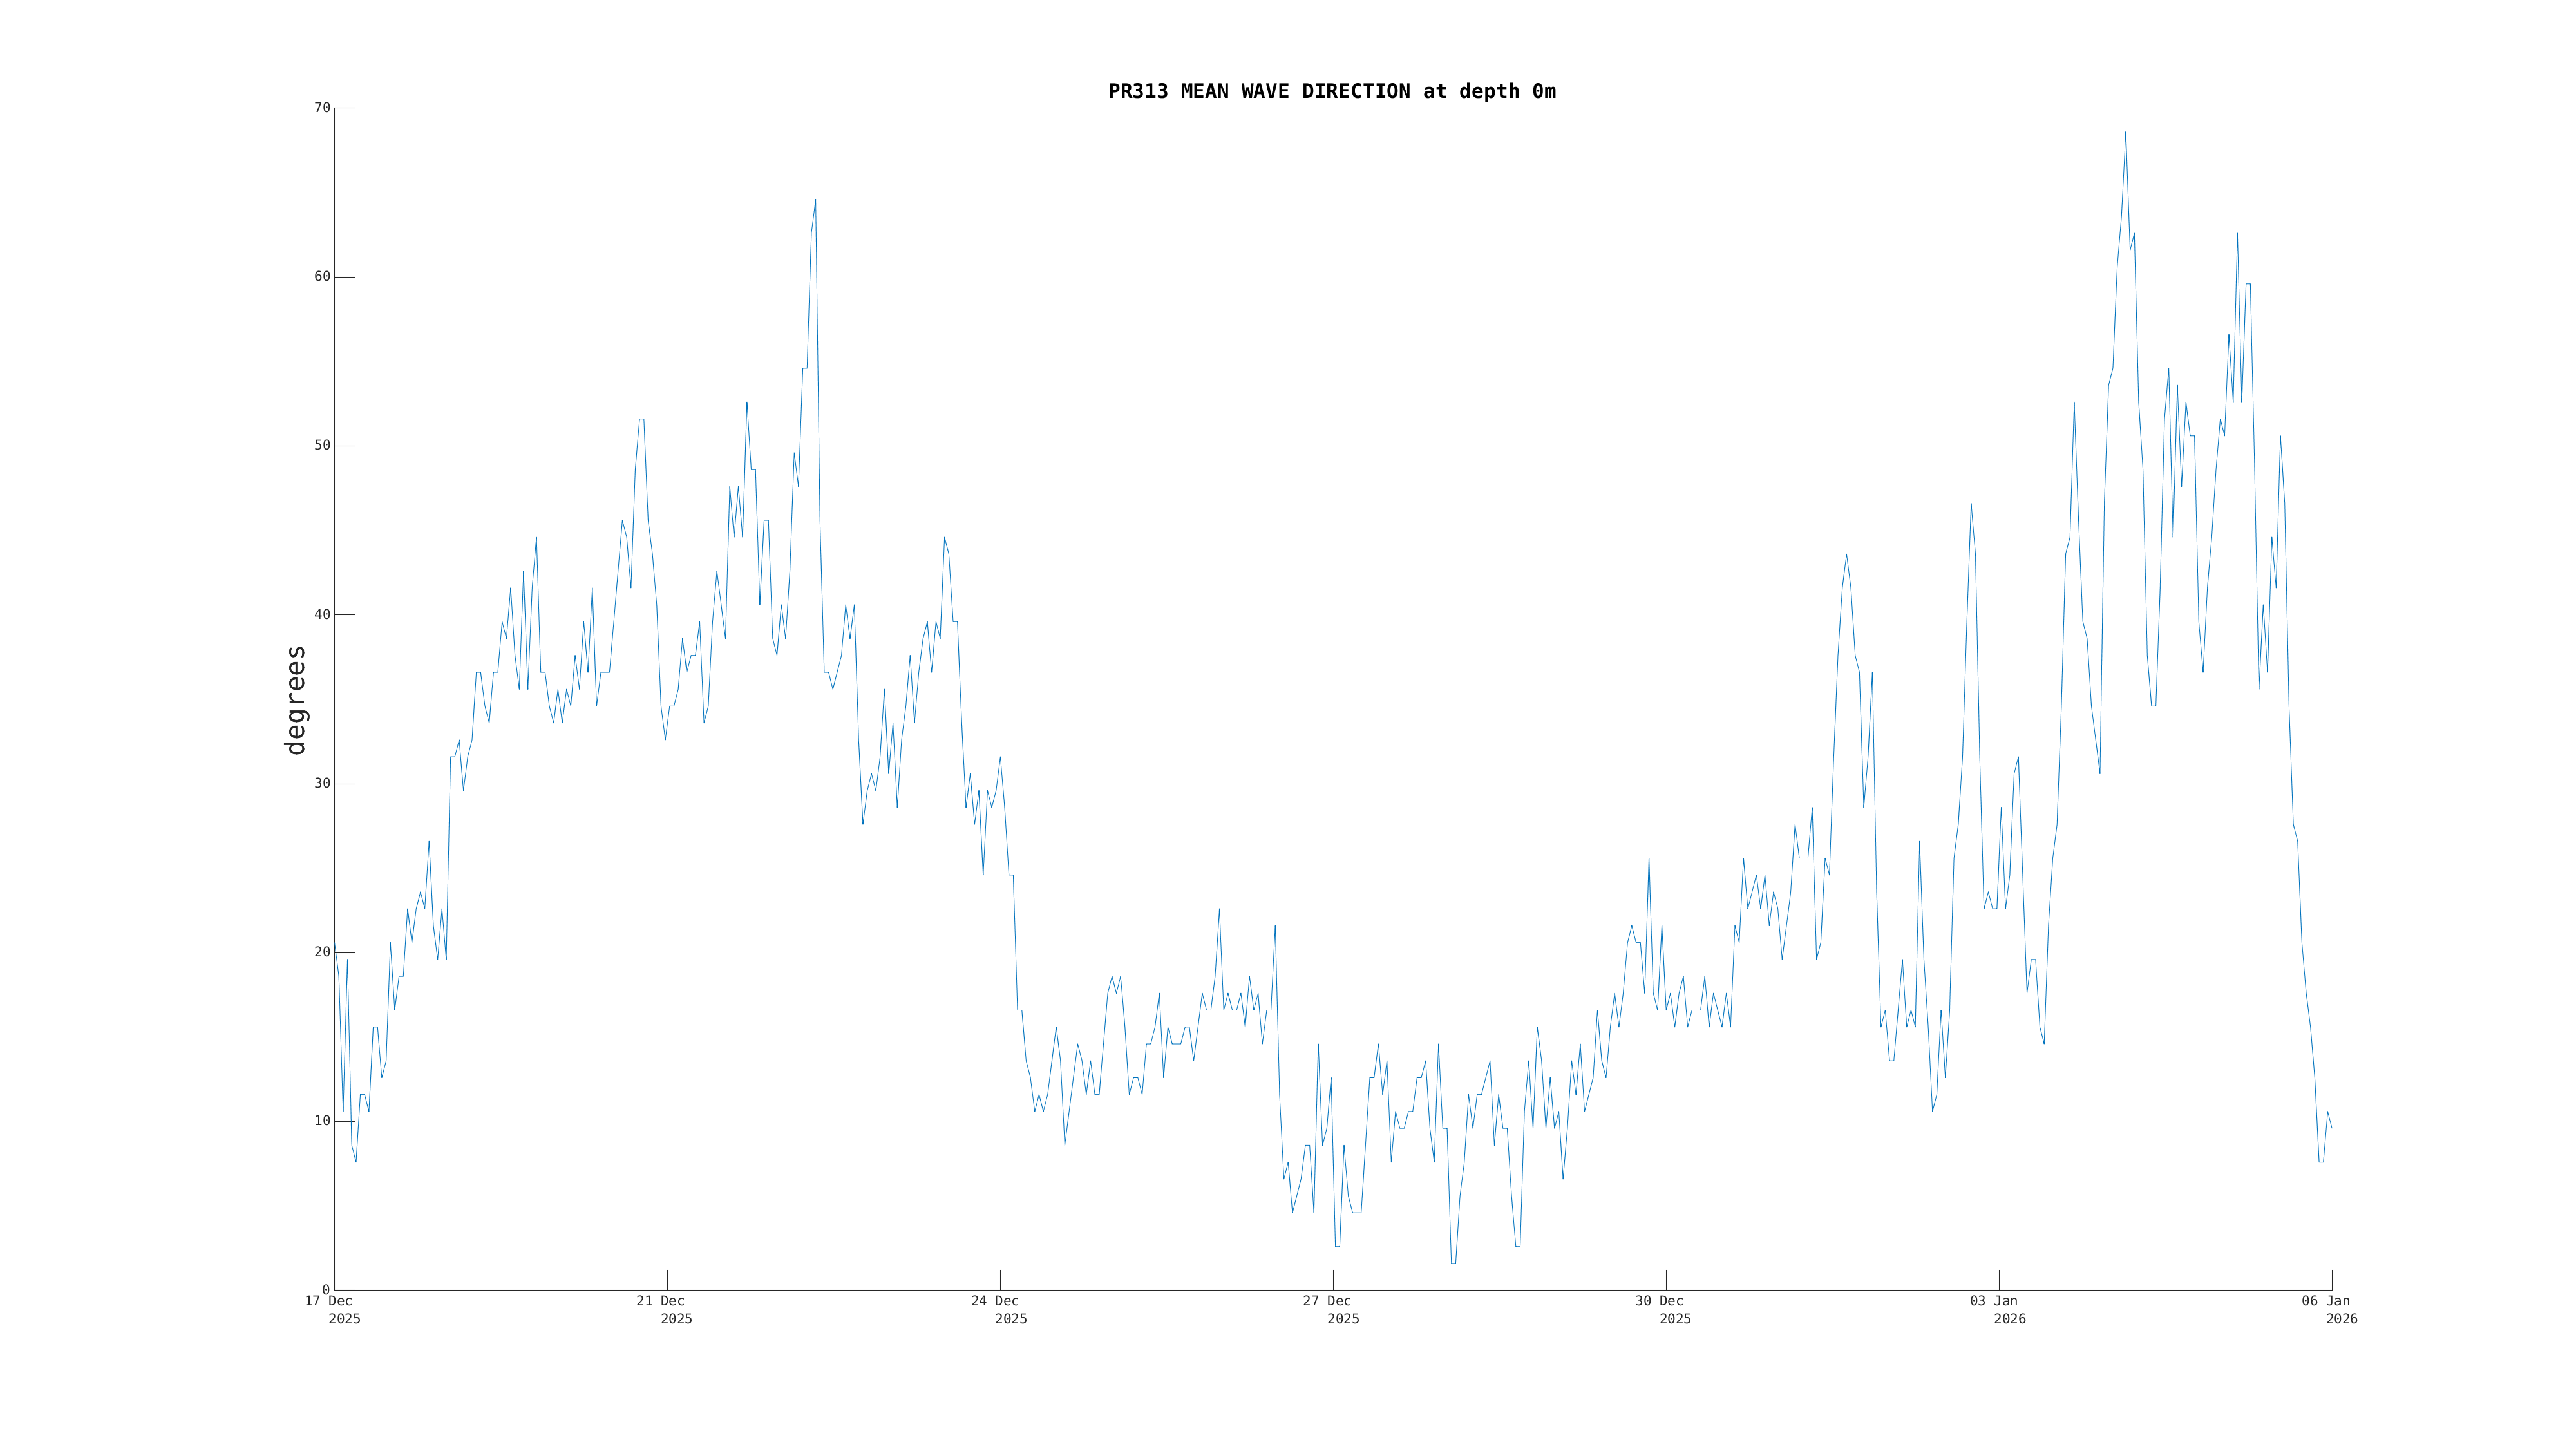
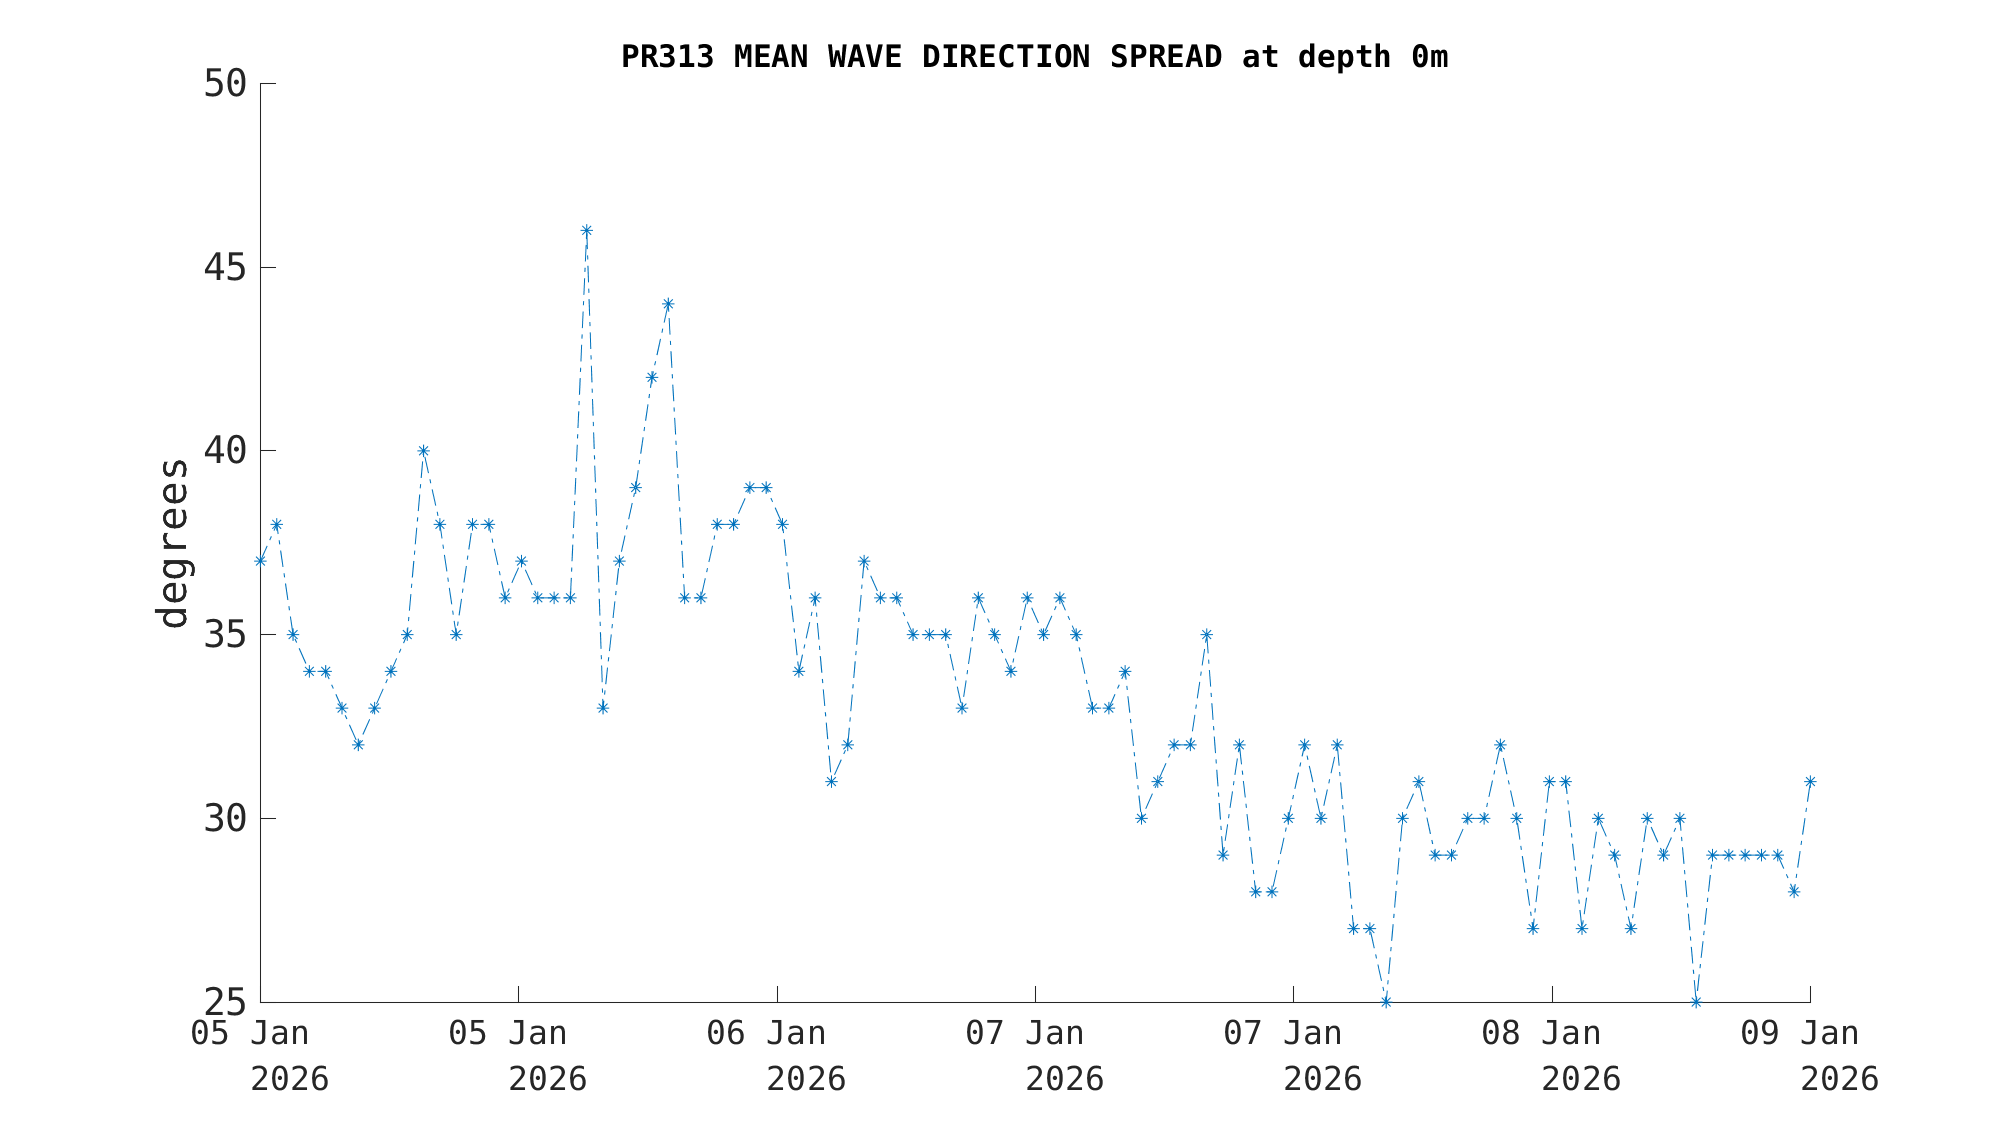
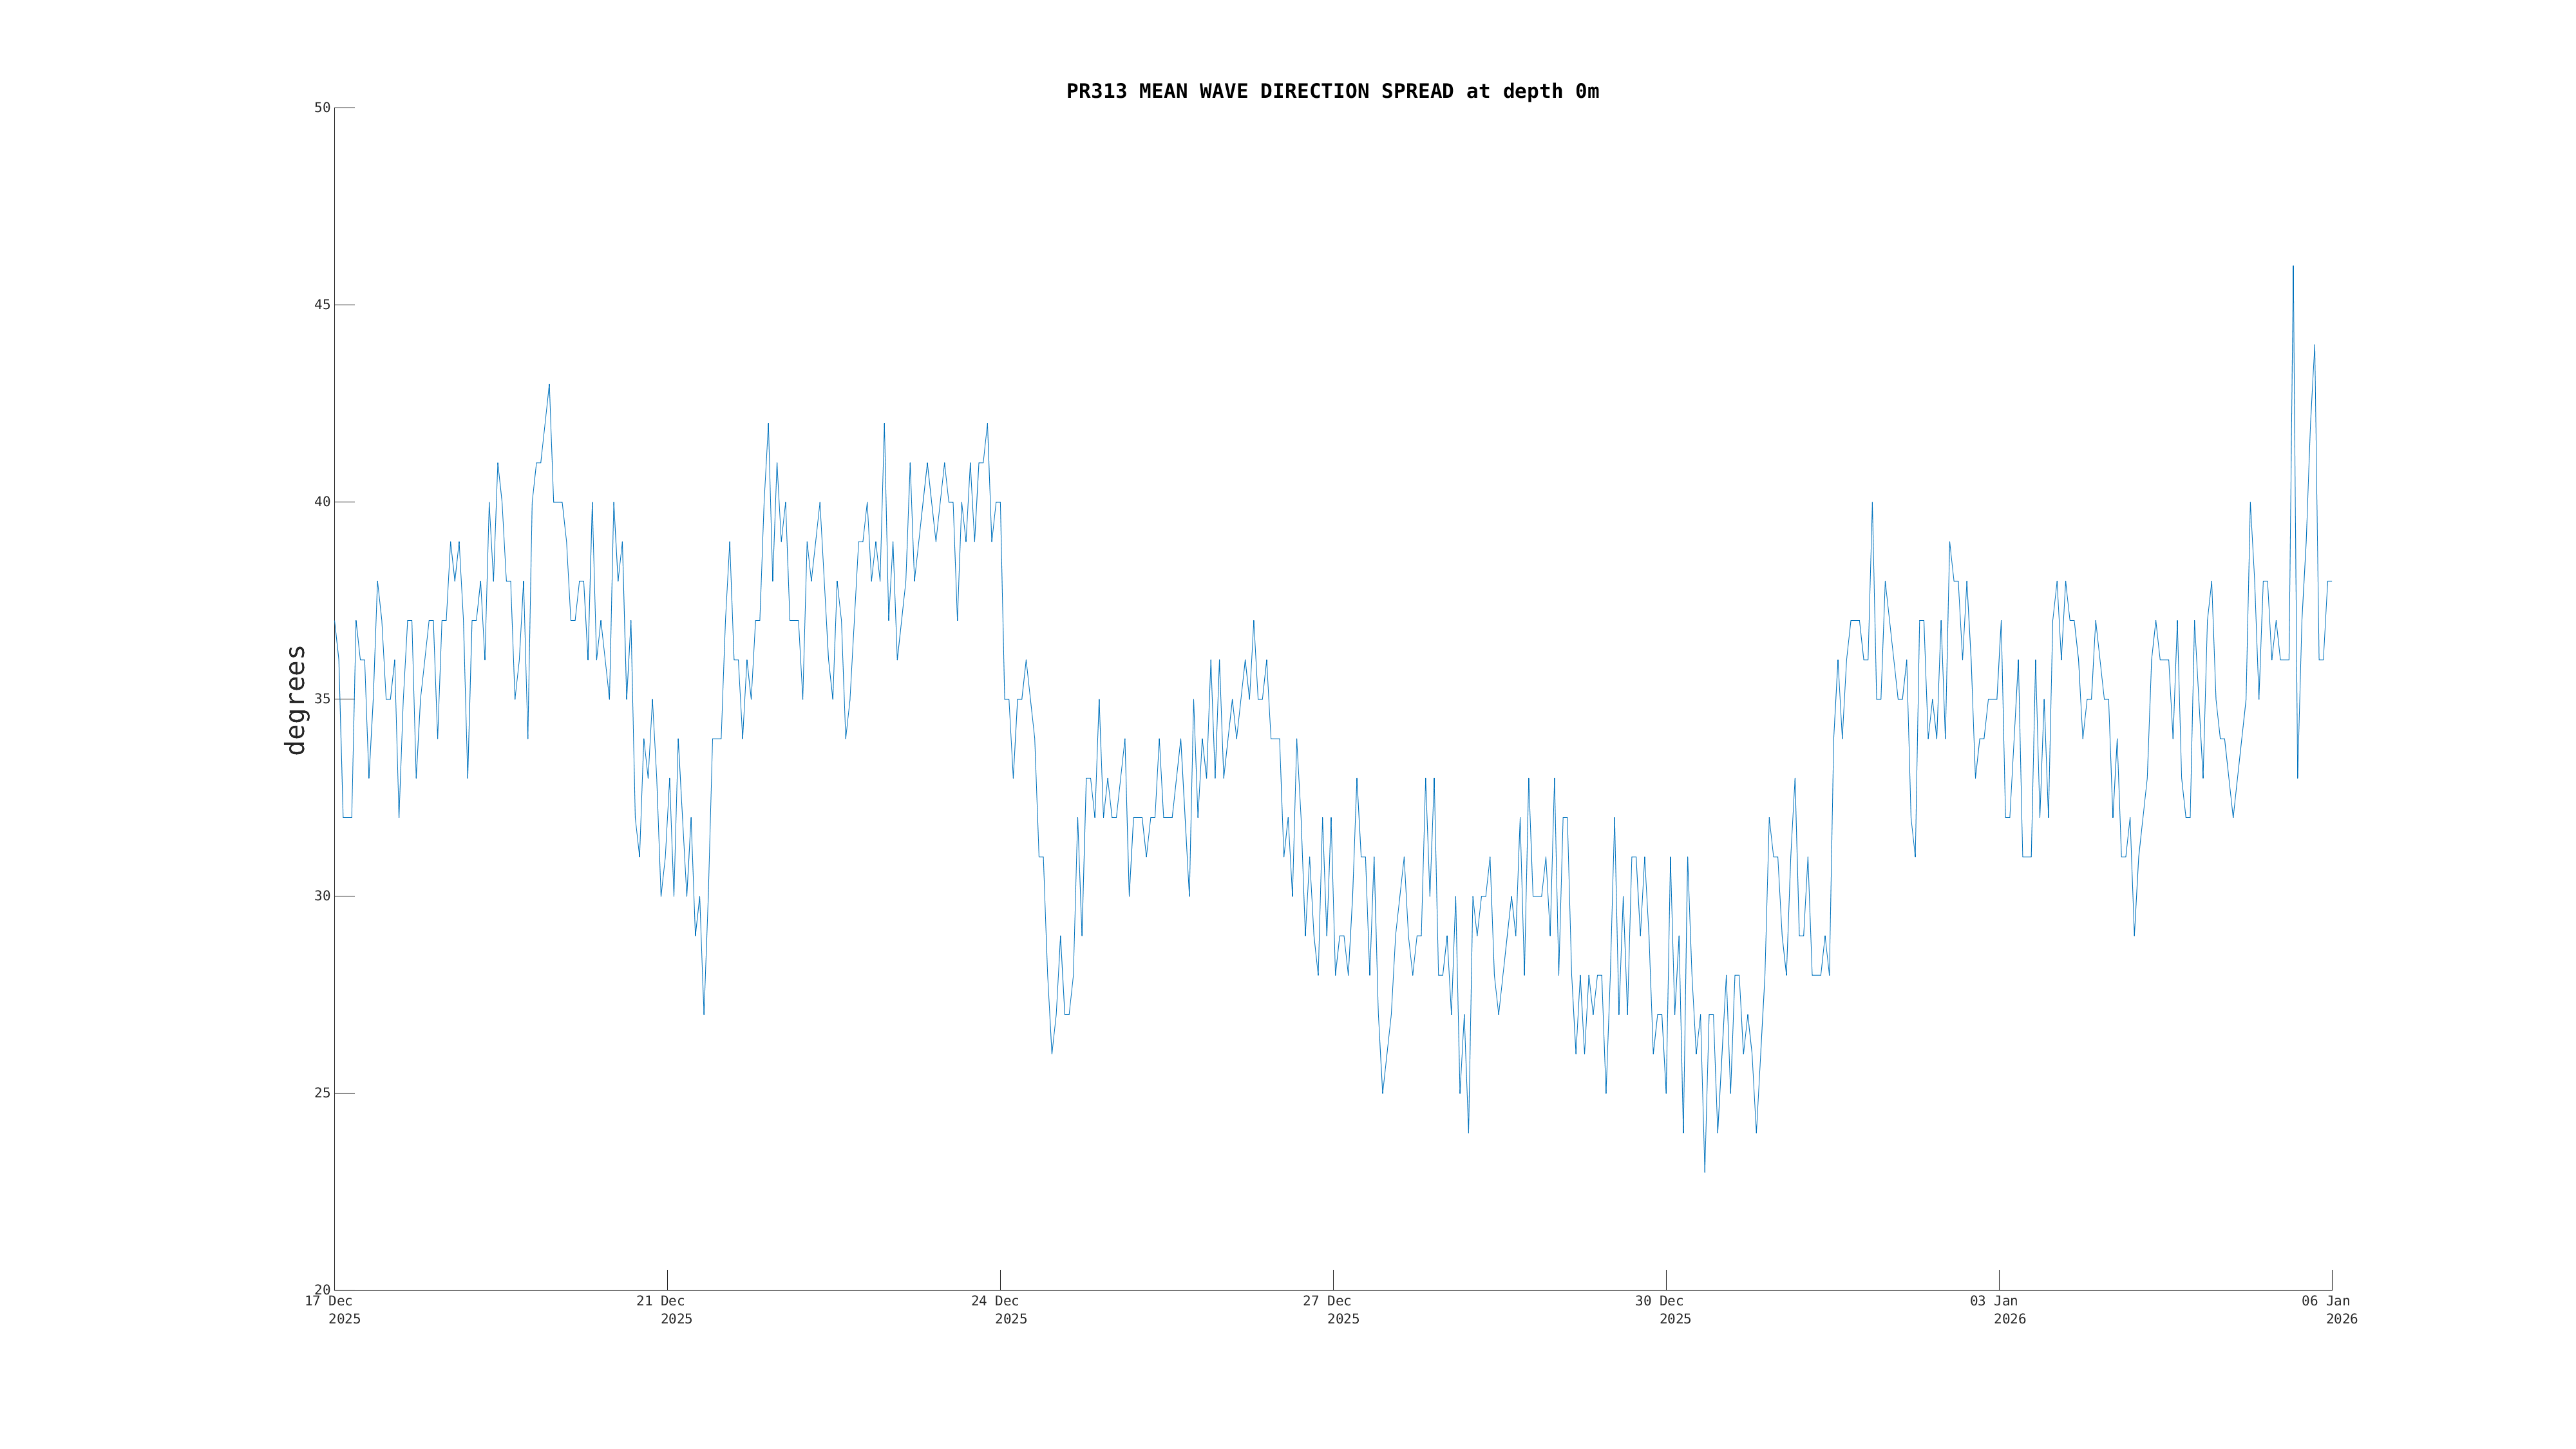


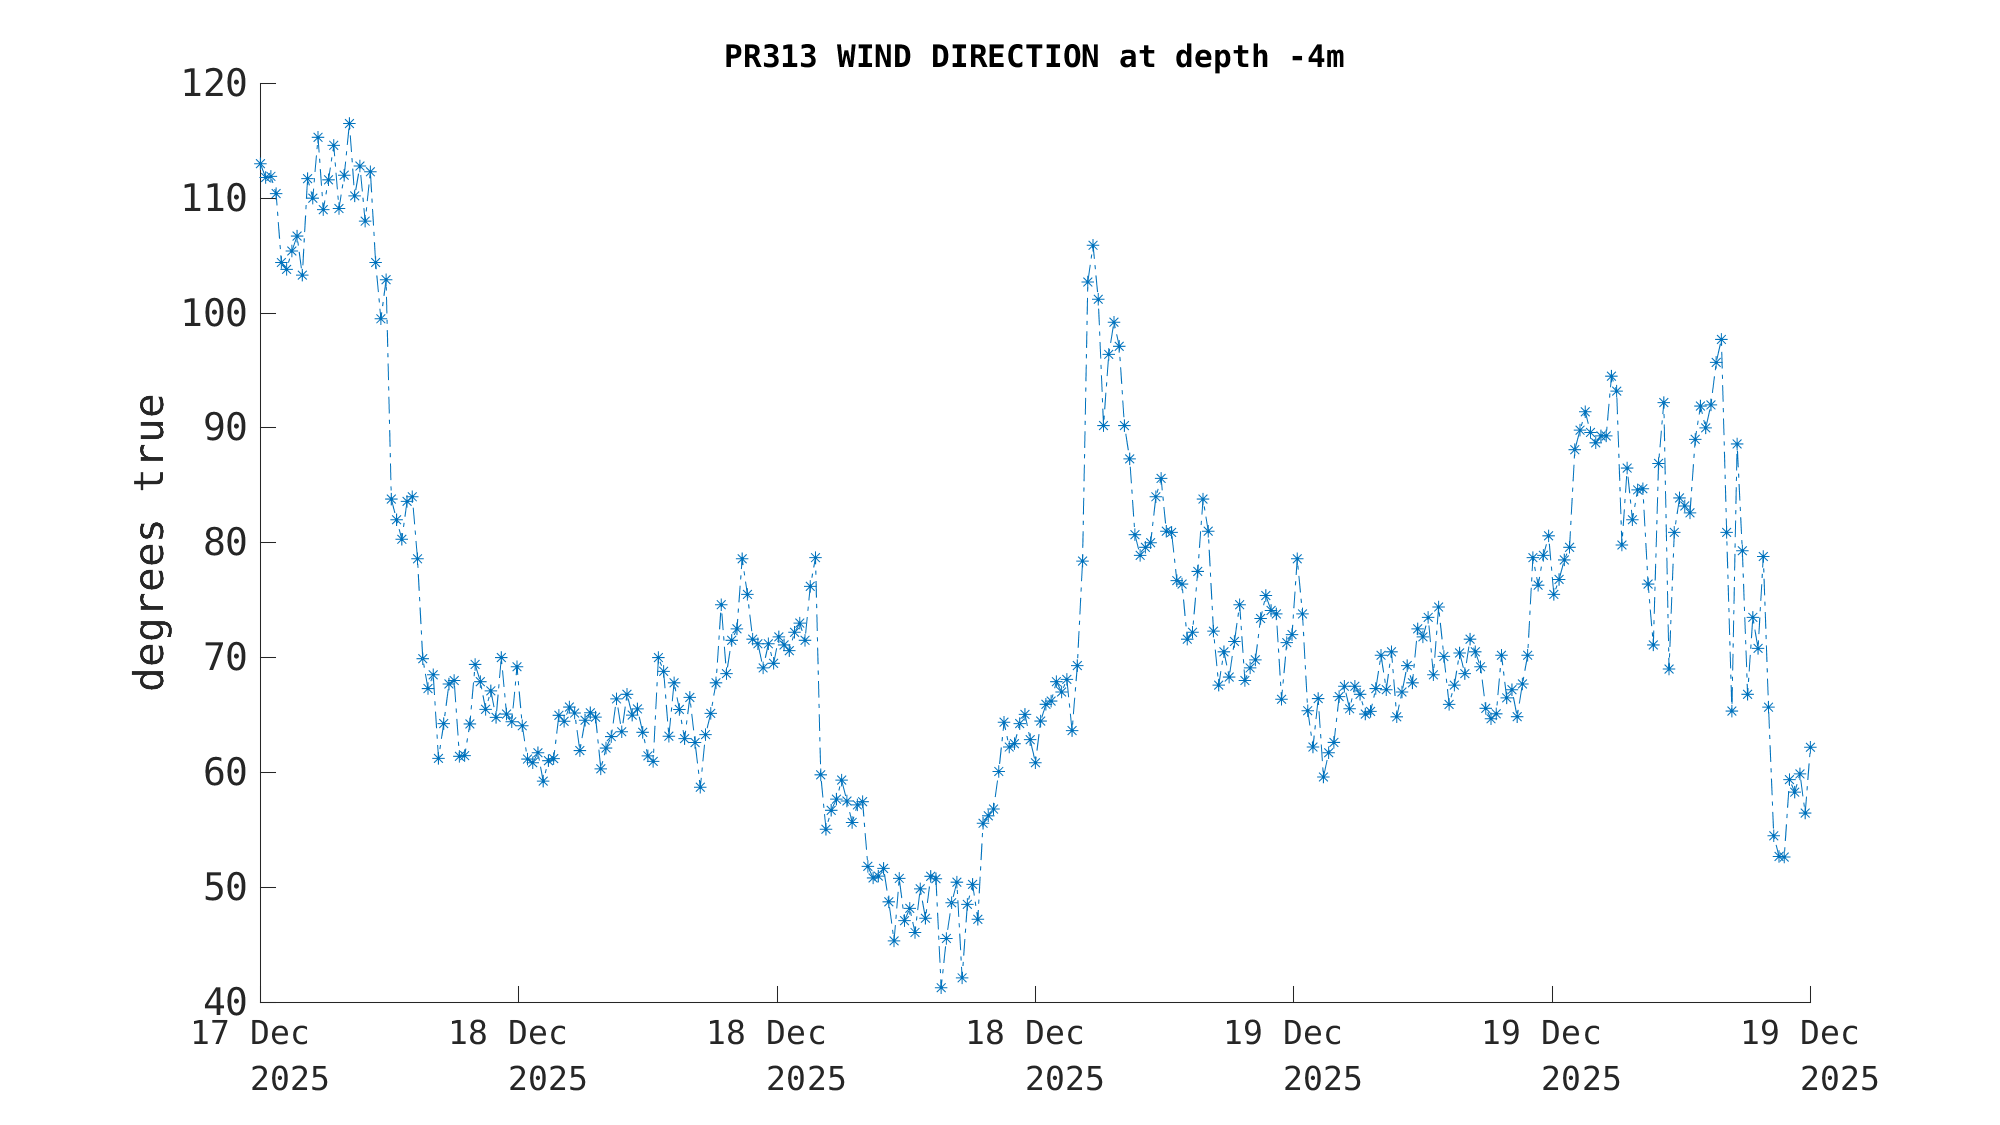
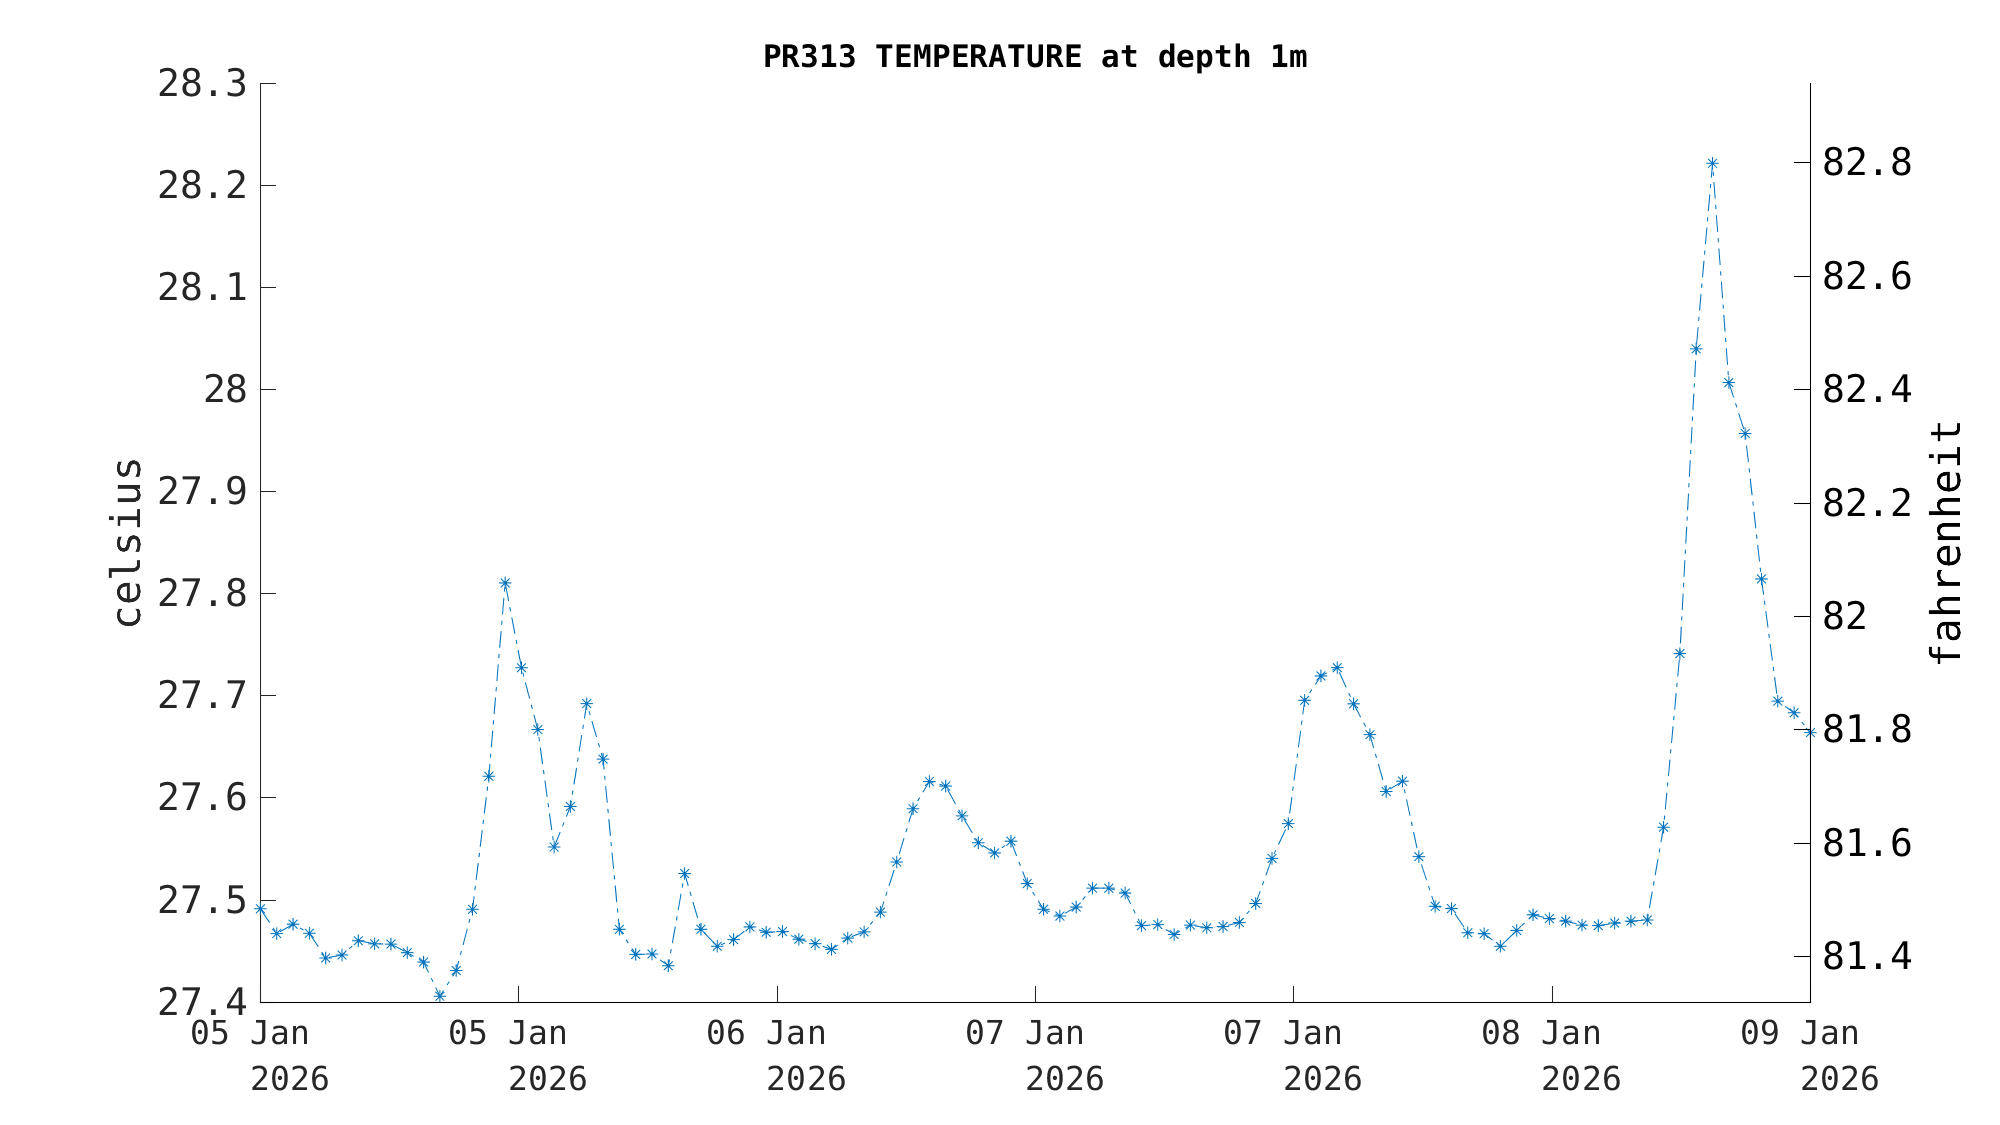

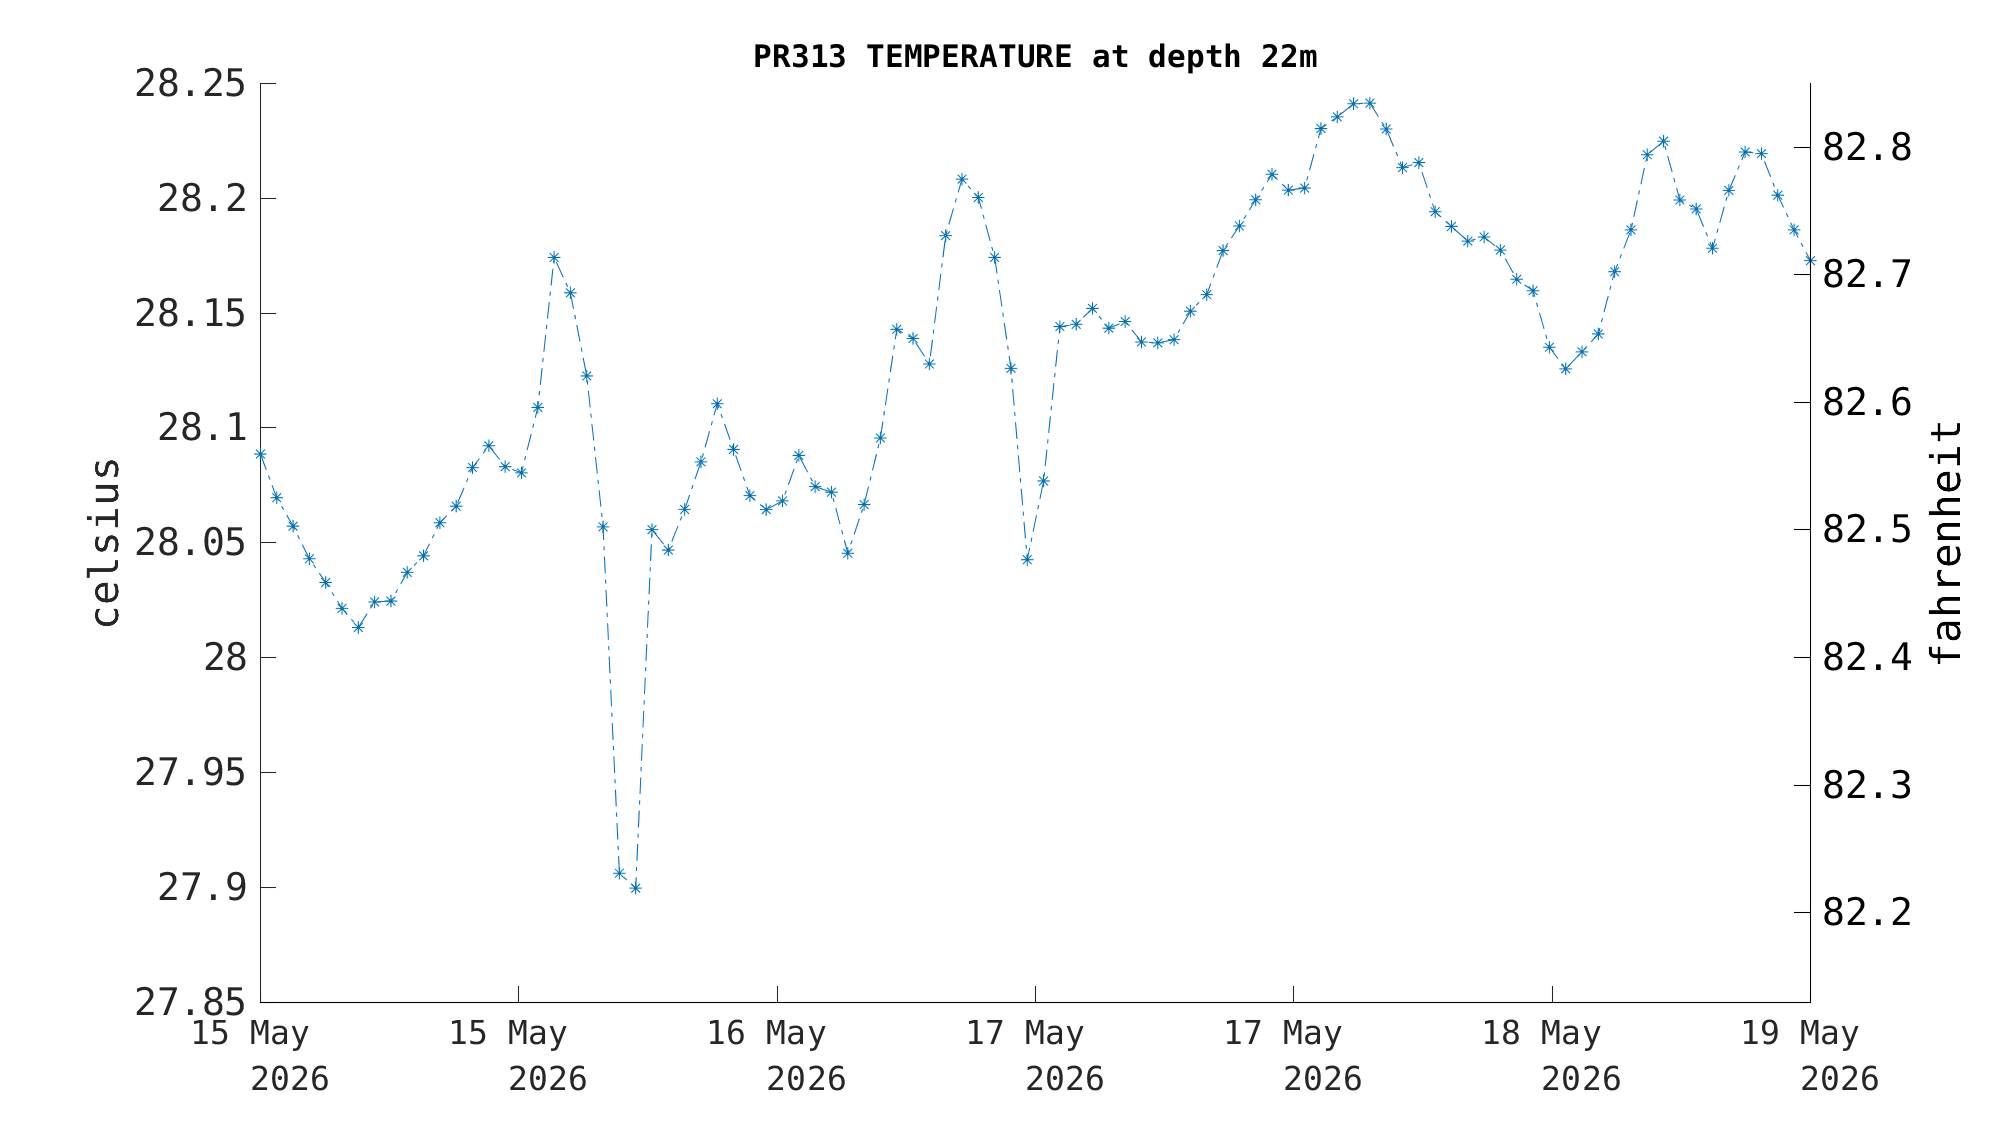
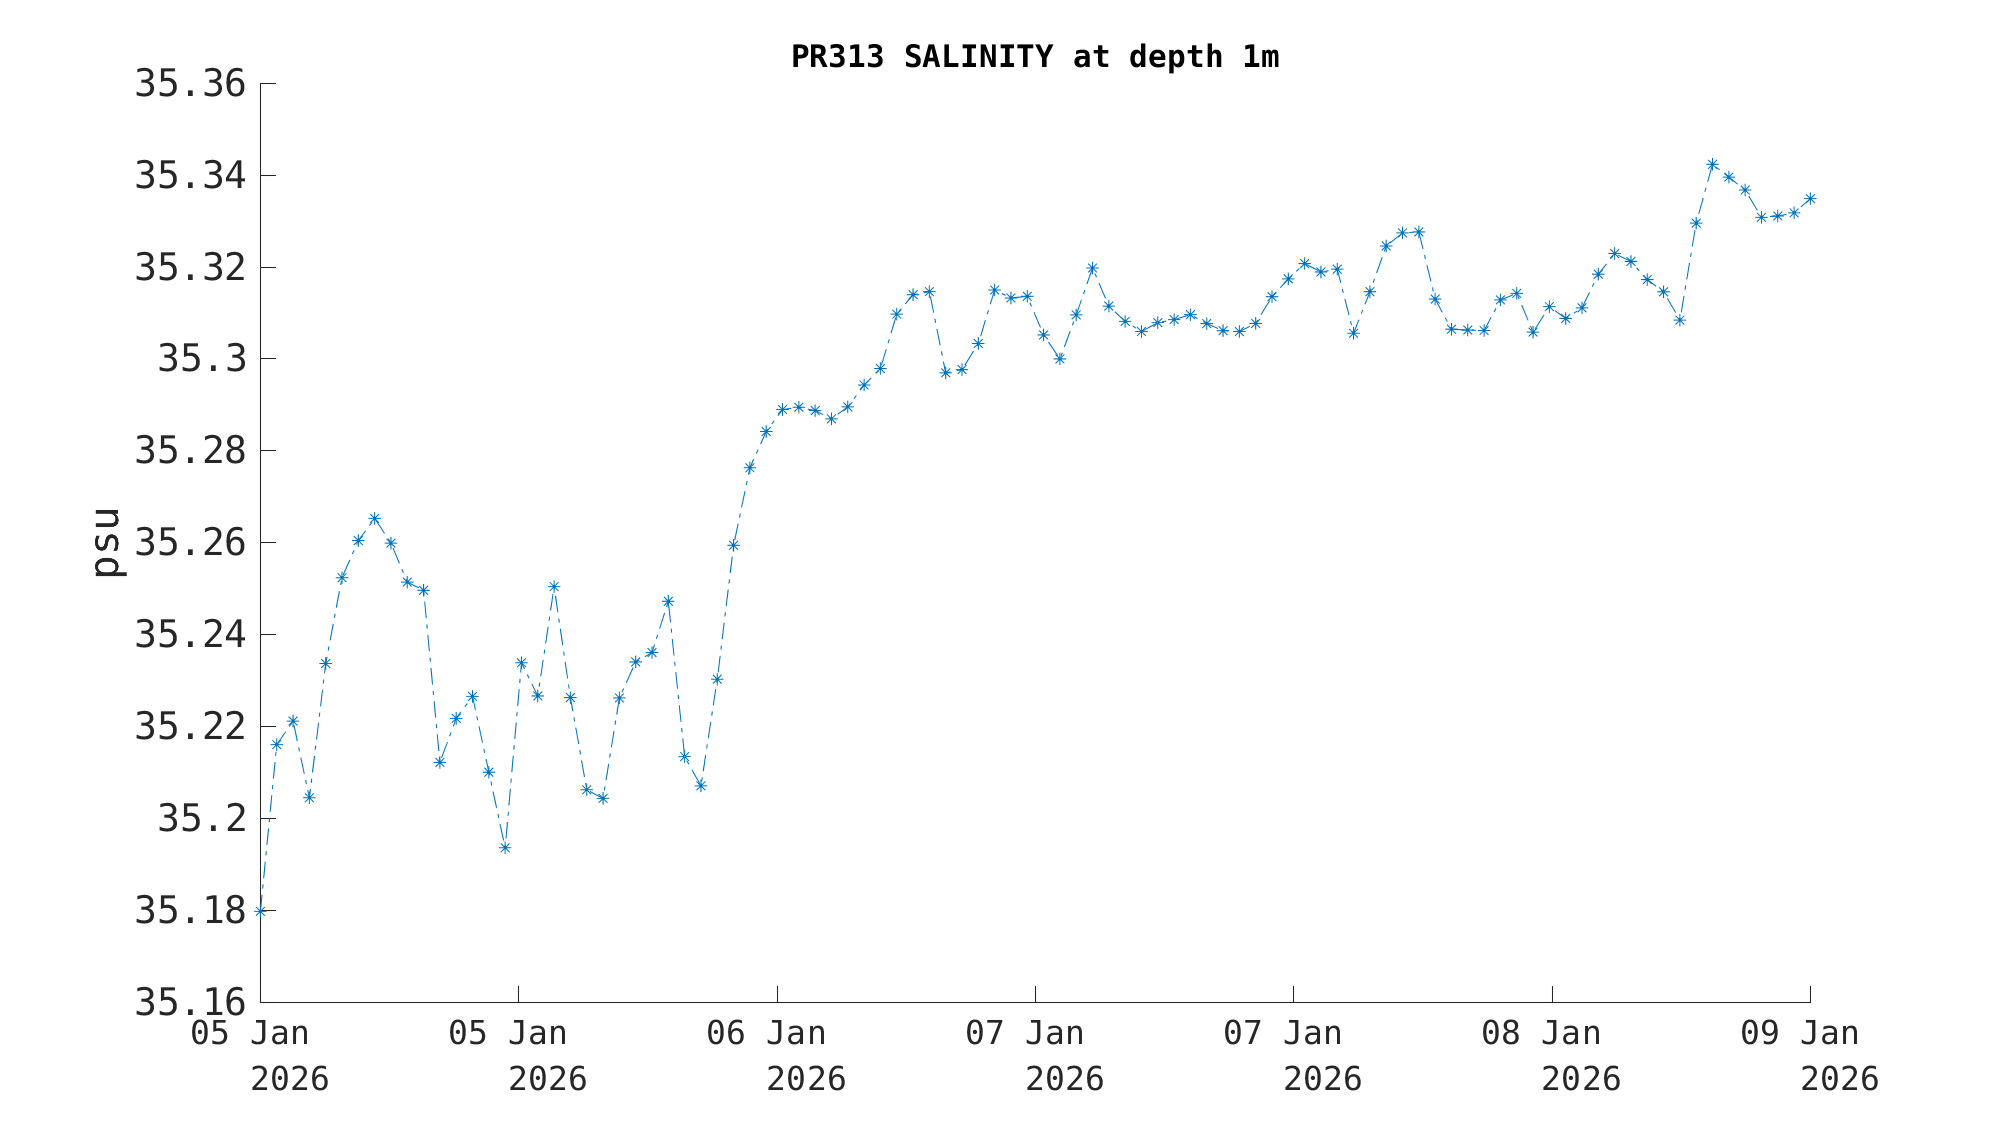


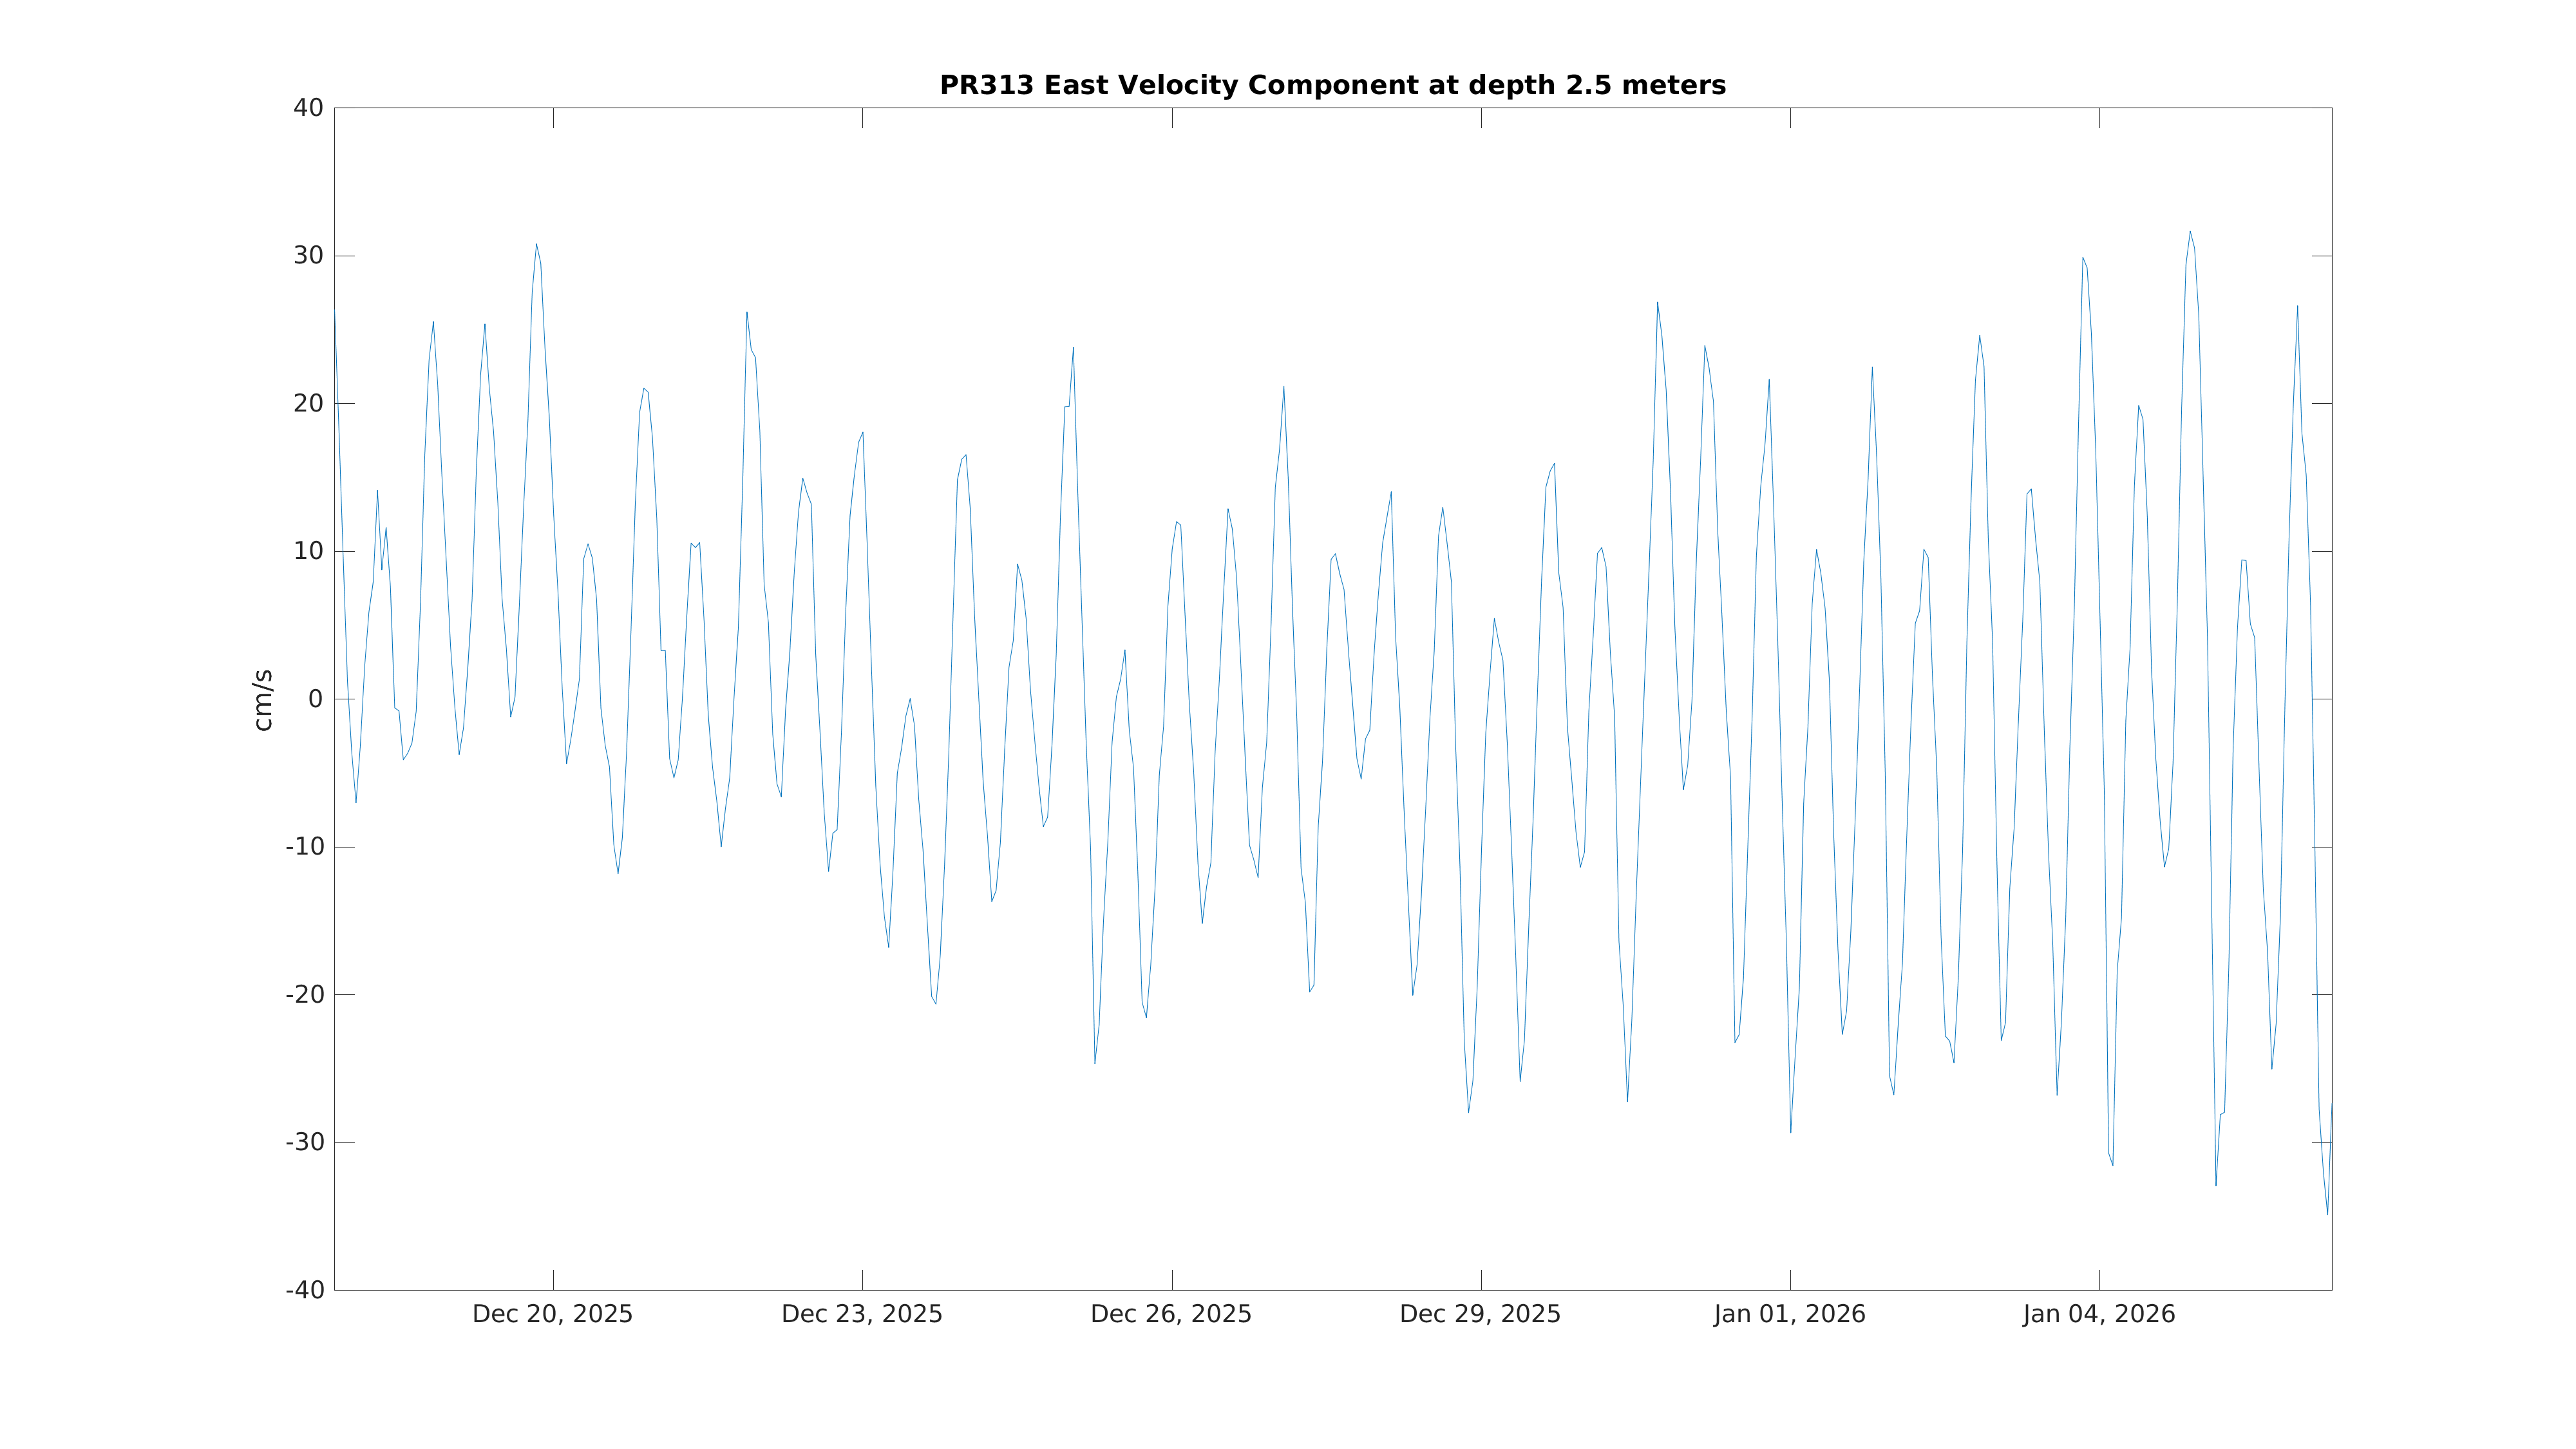


 Latest Month's:
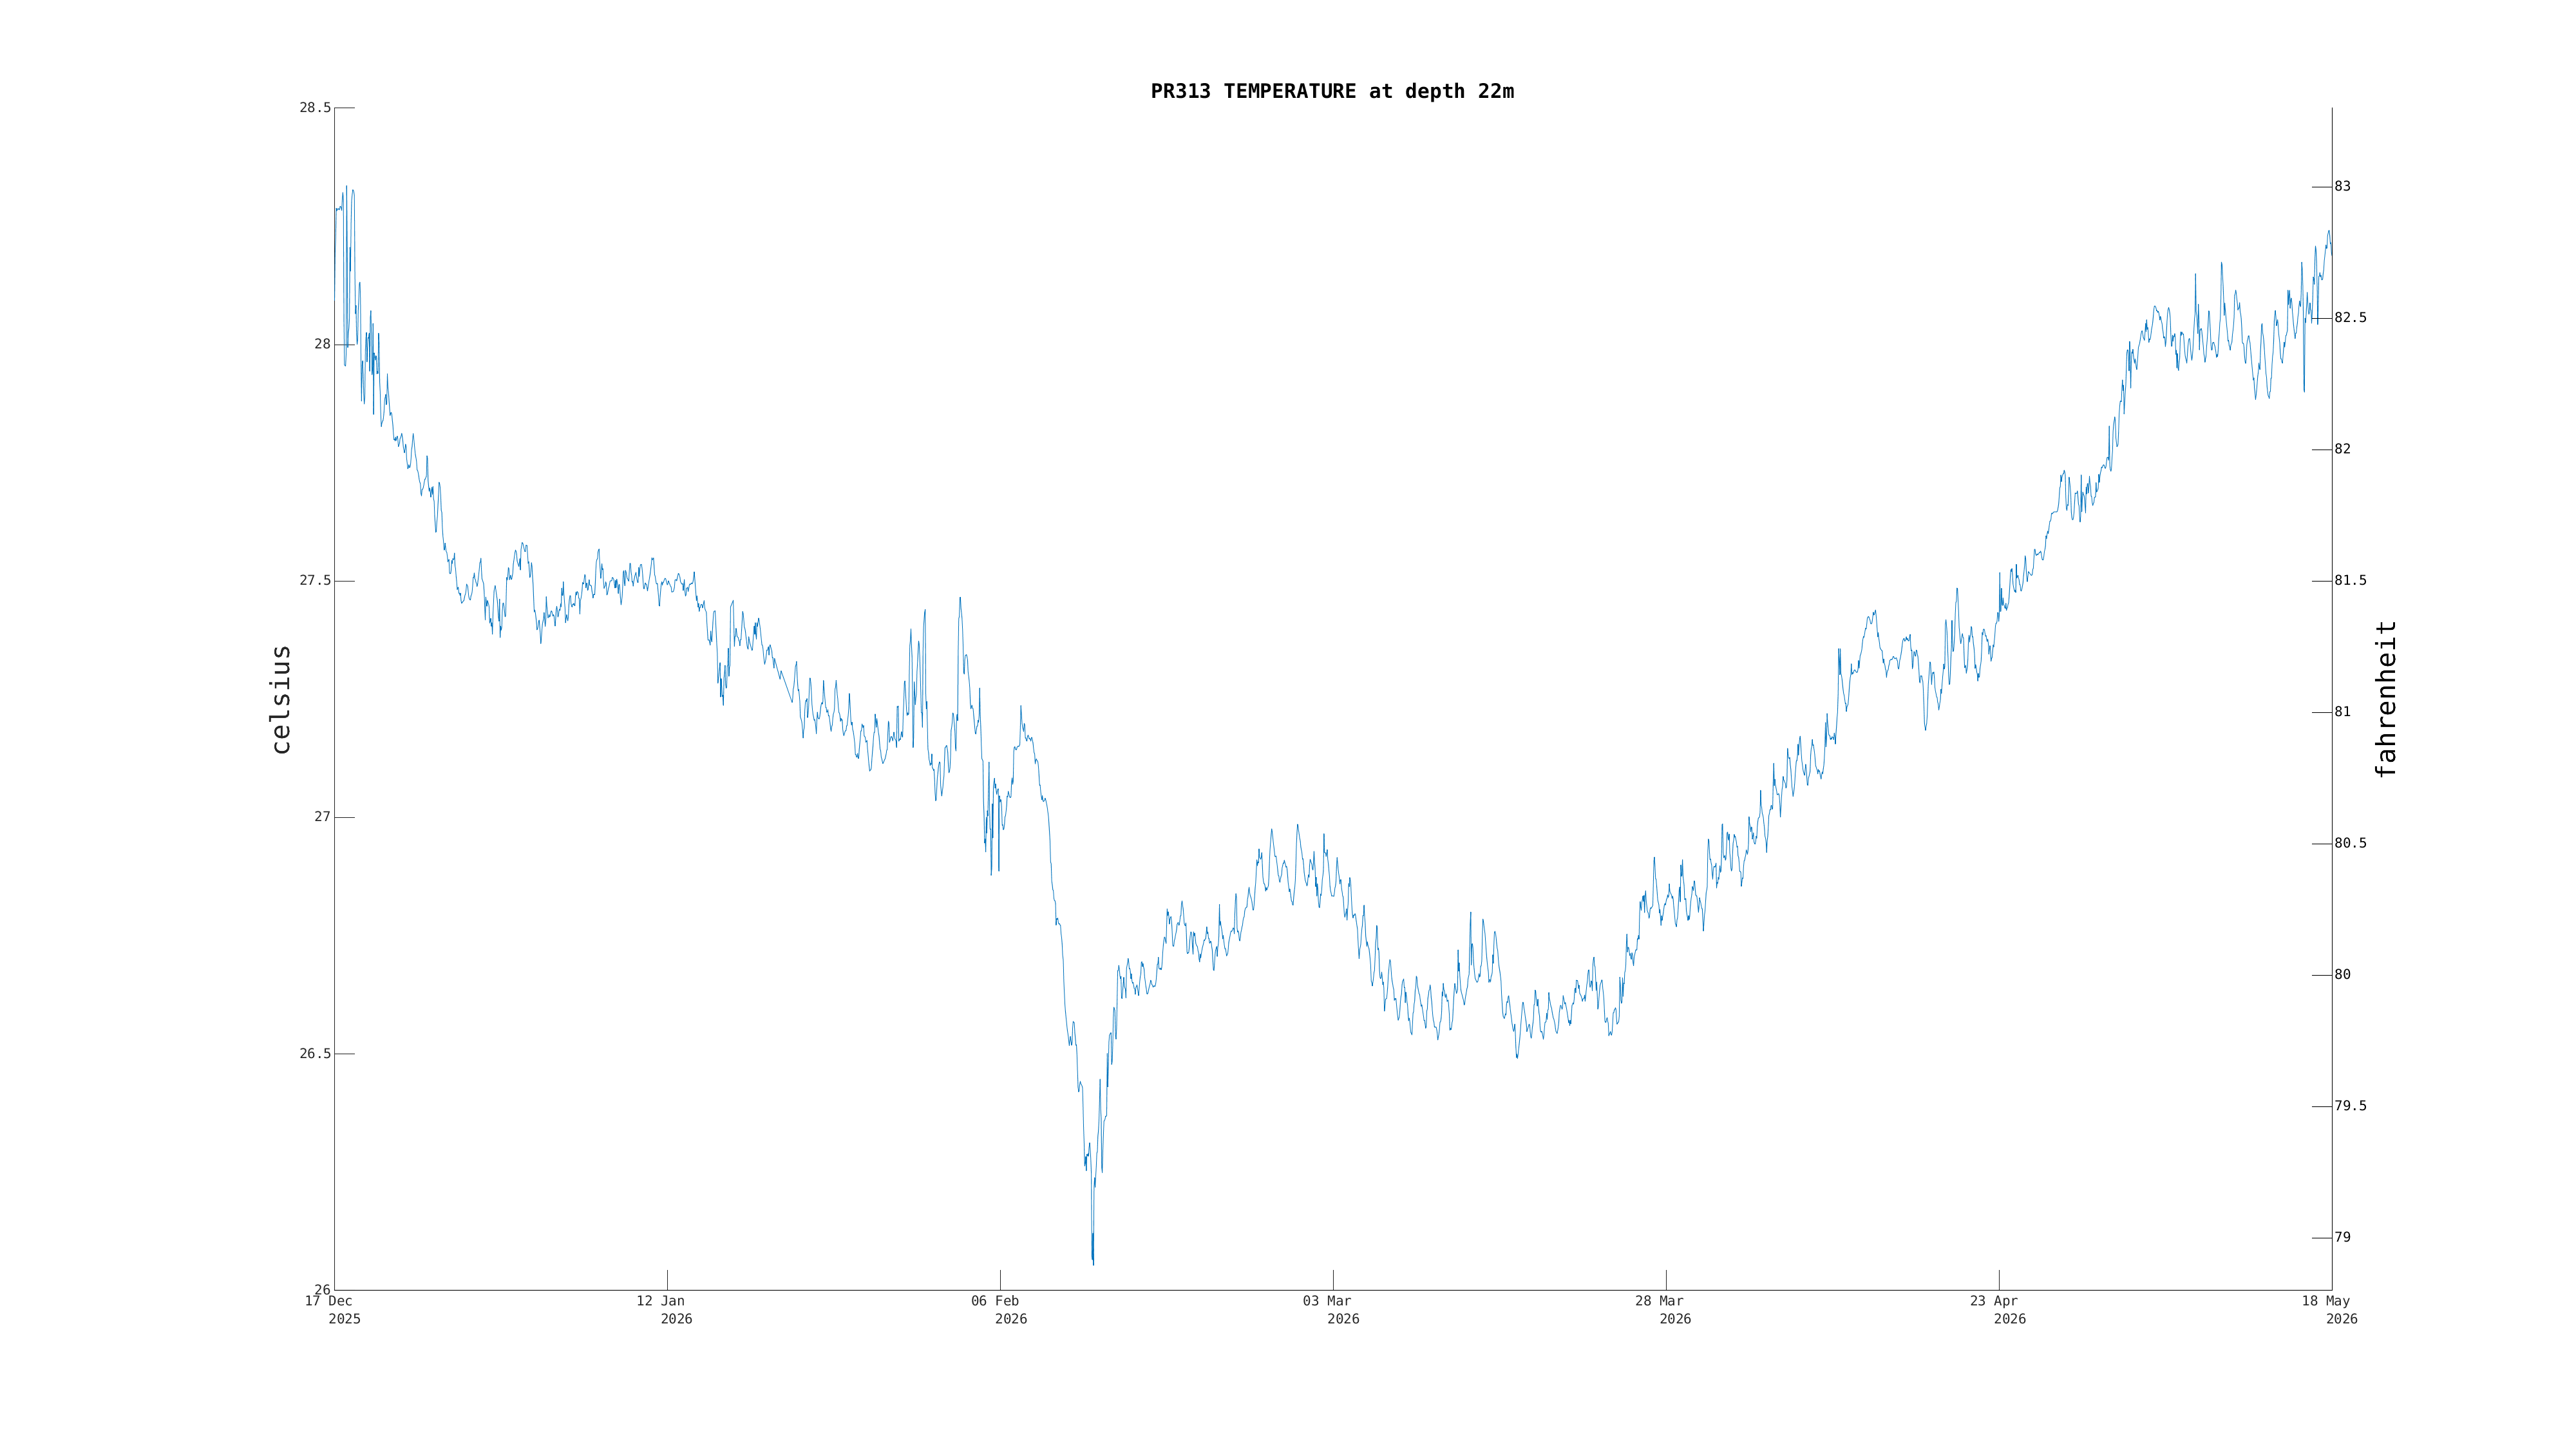
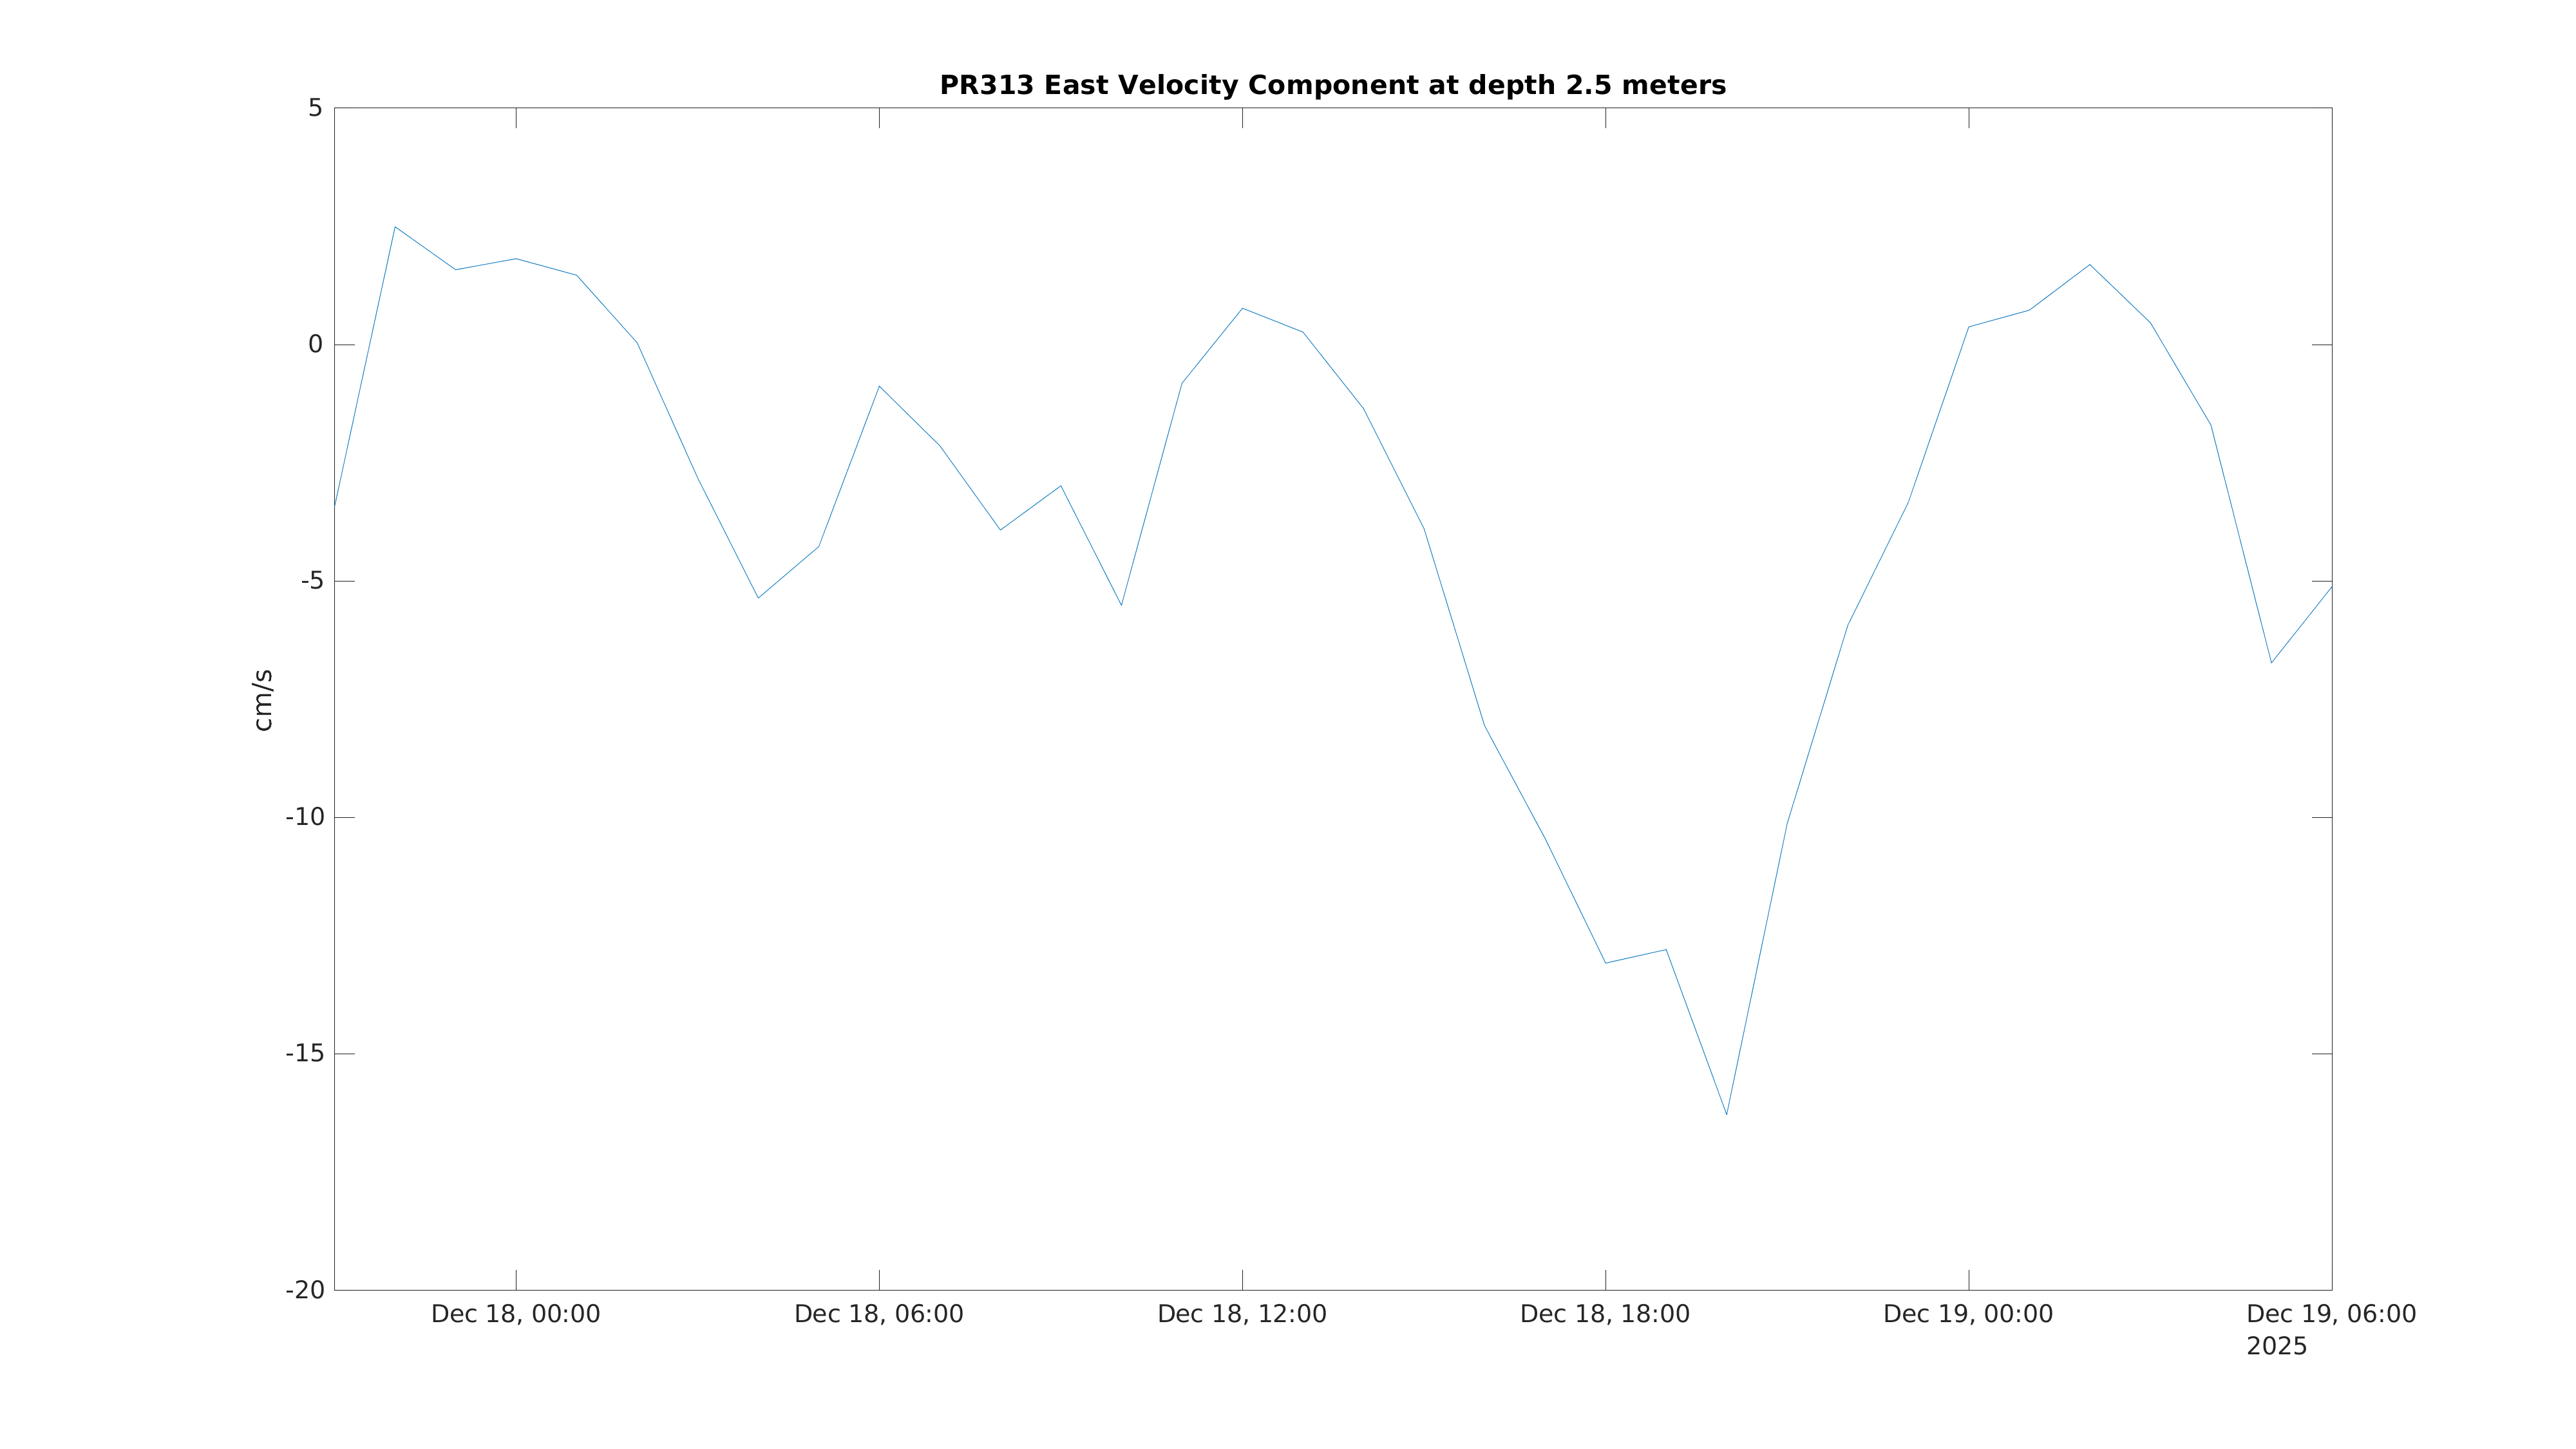
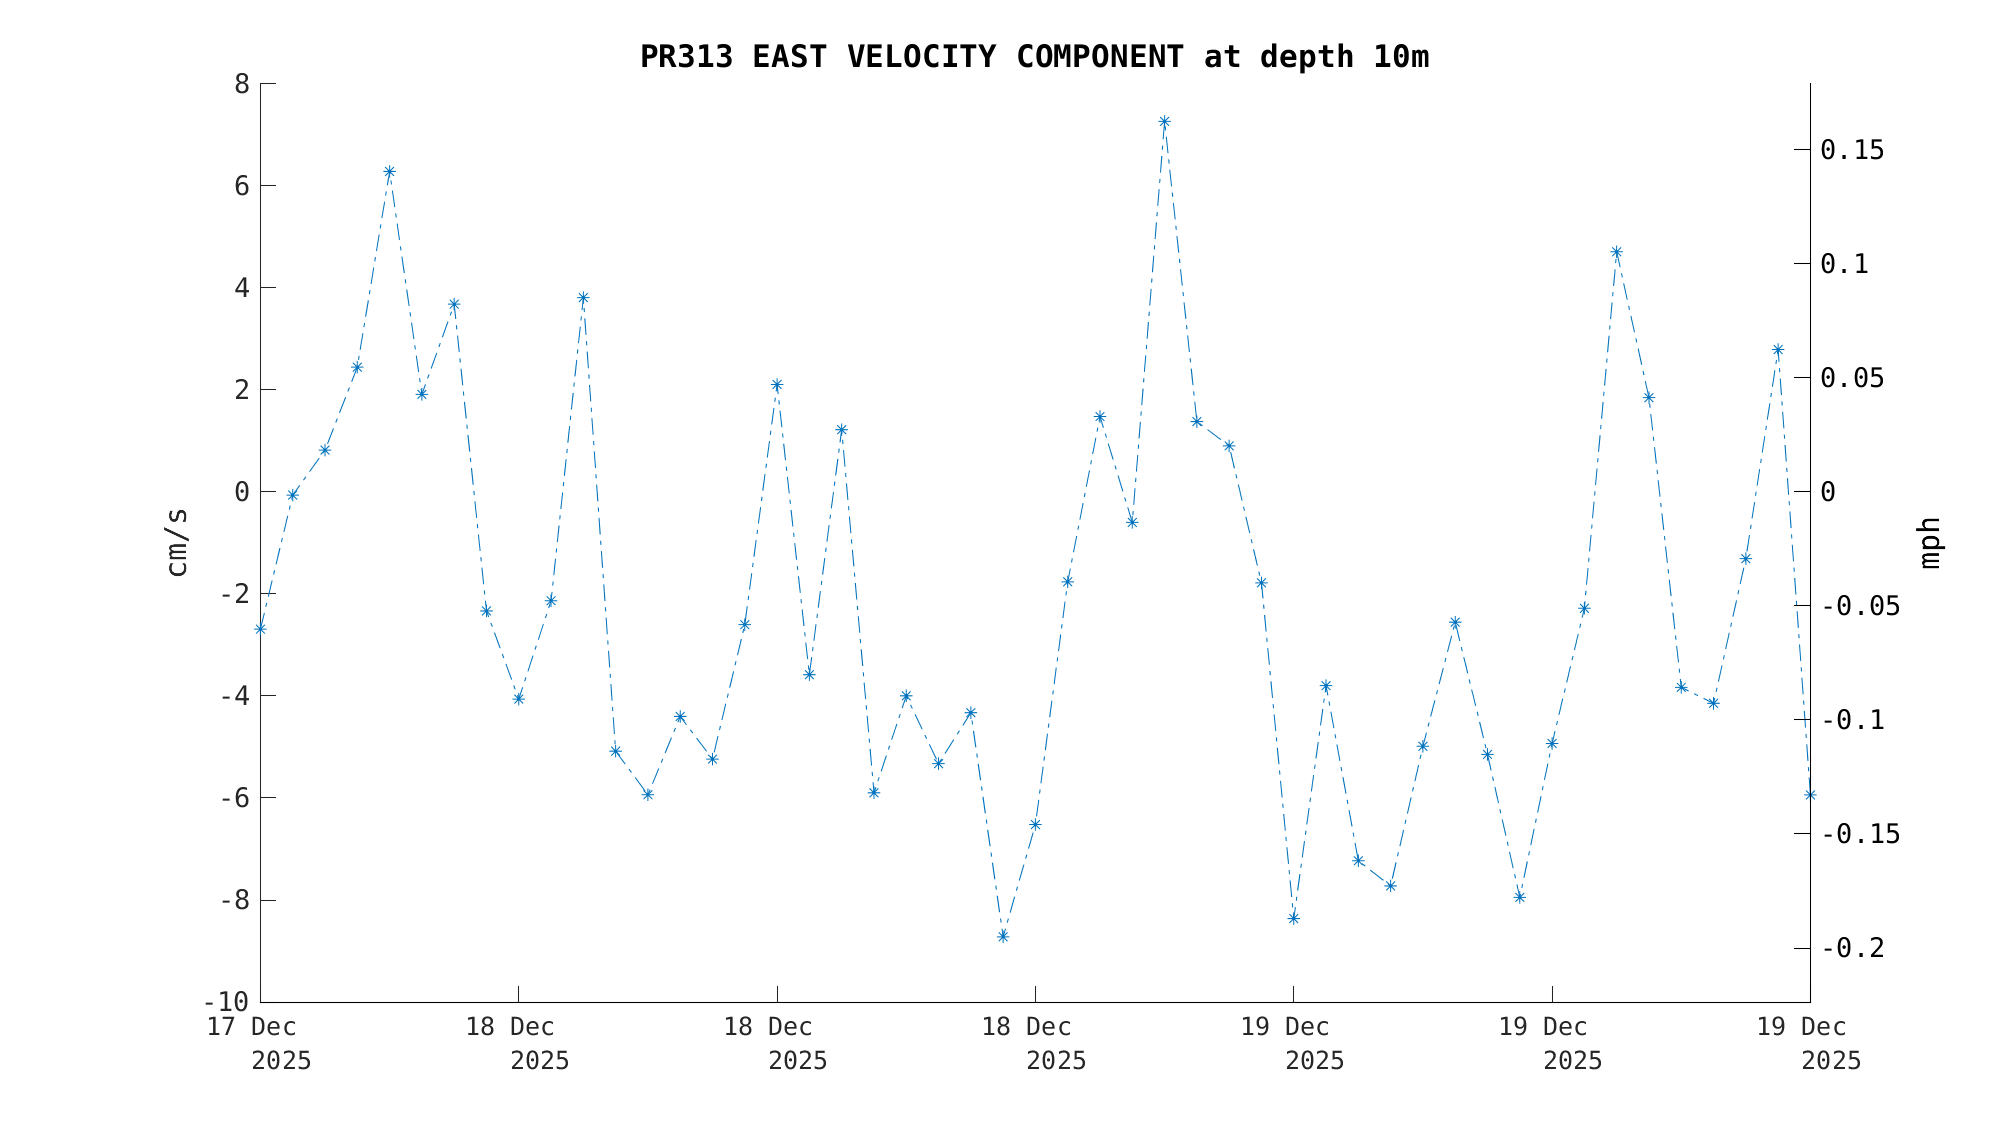
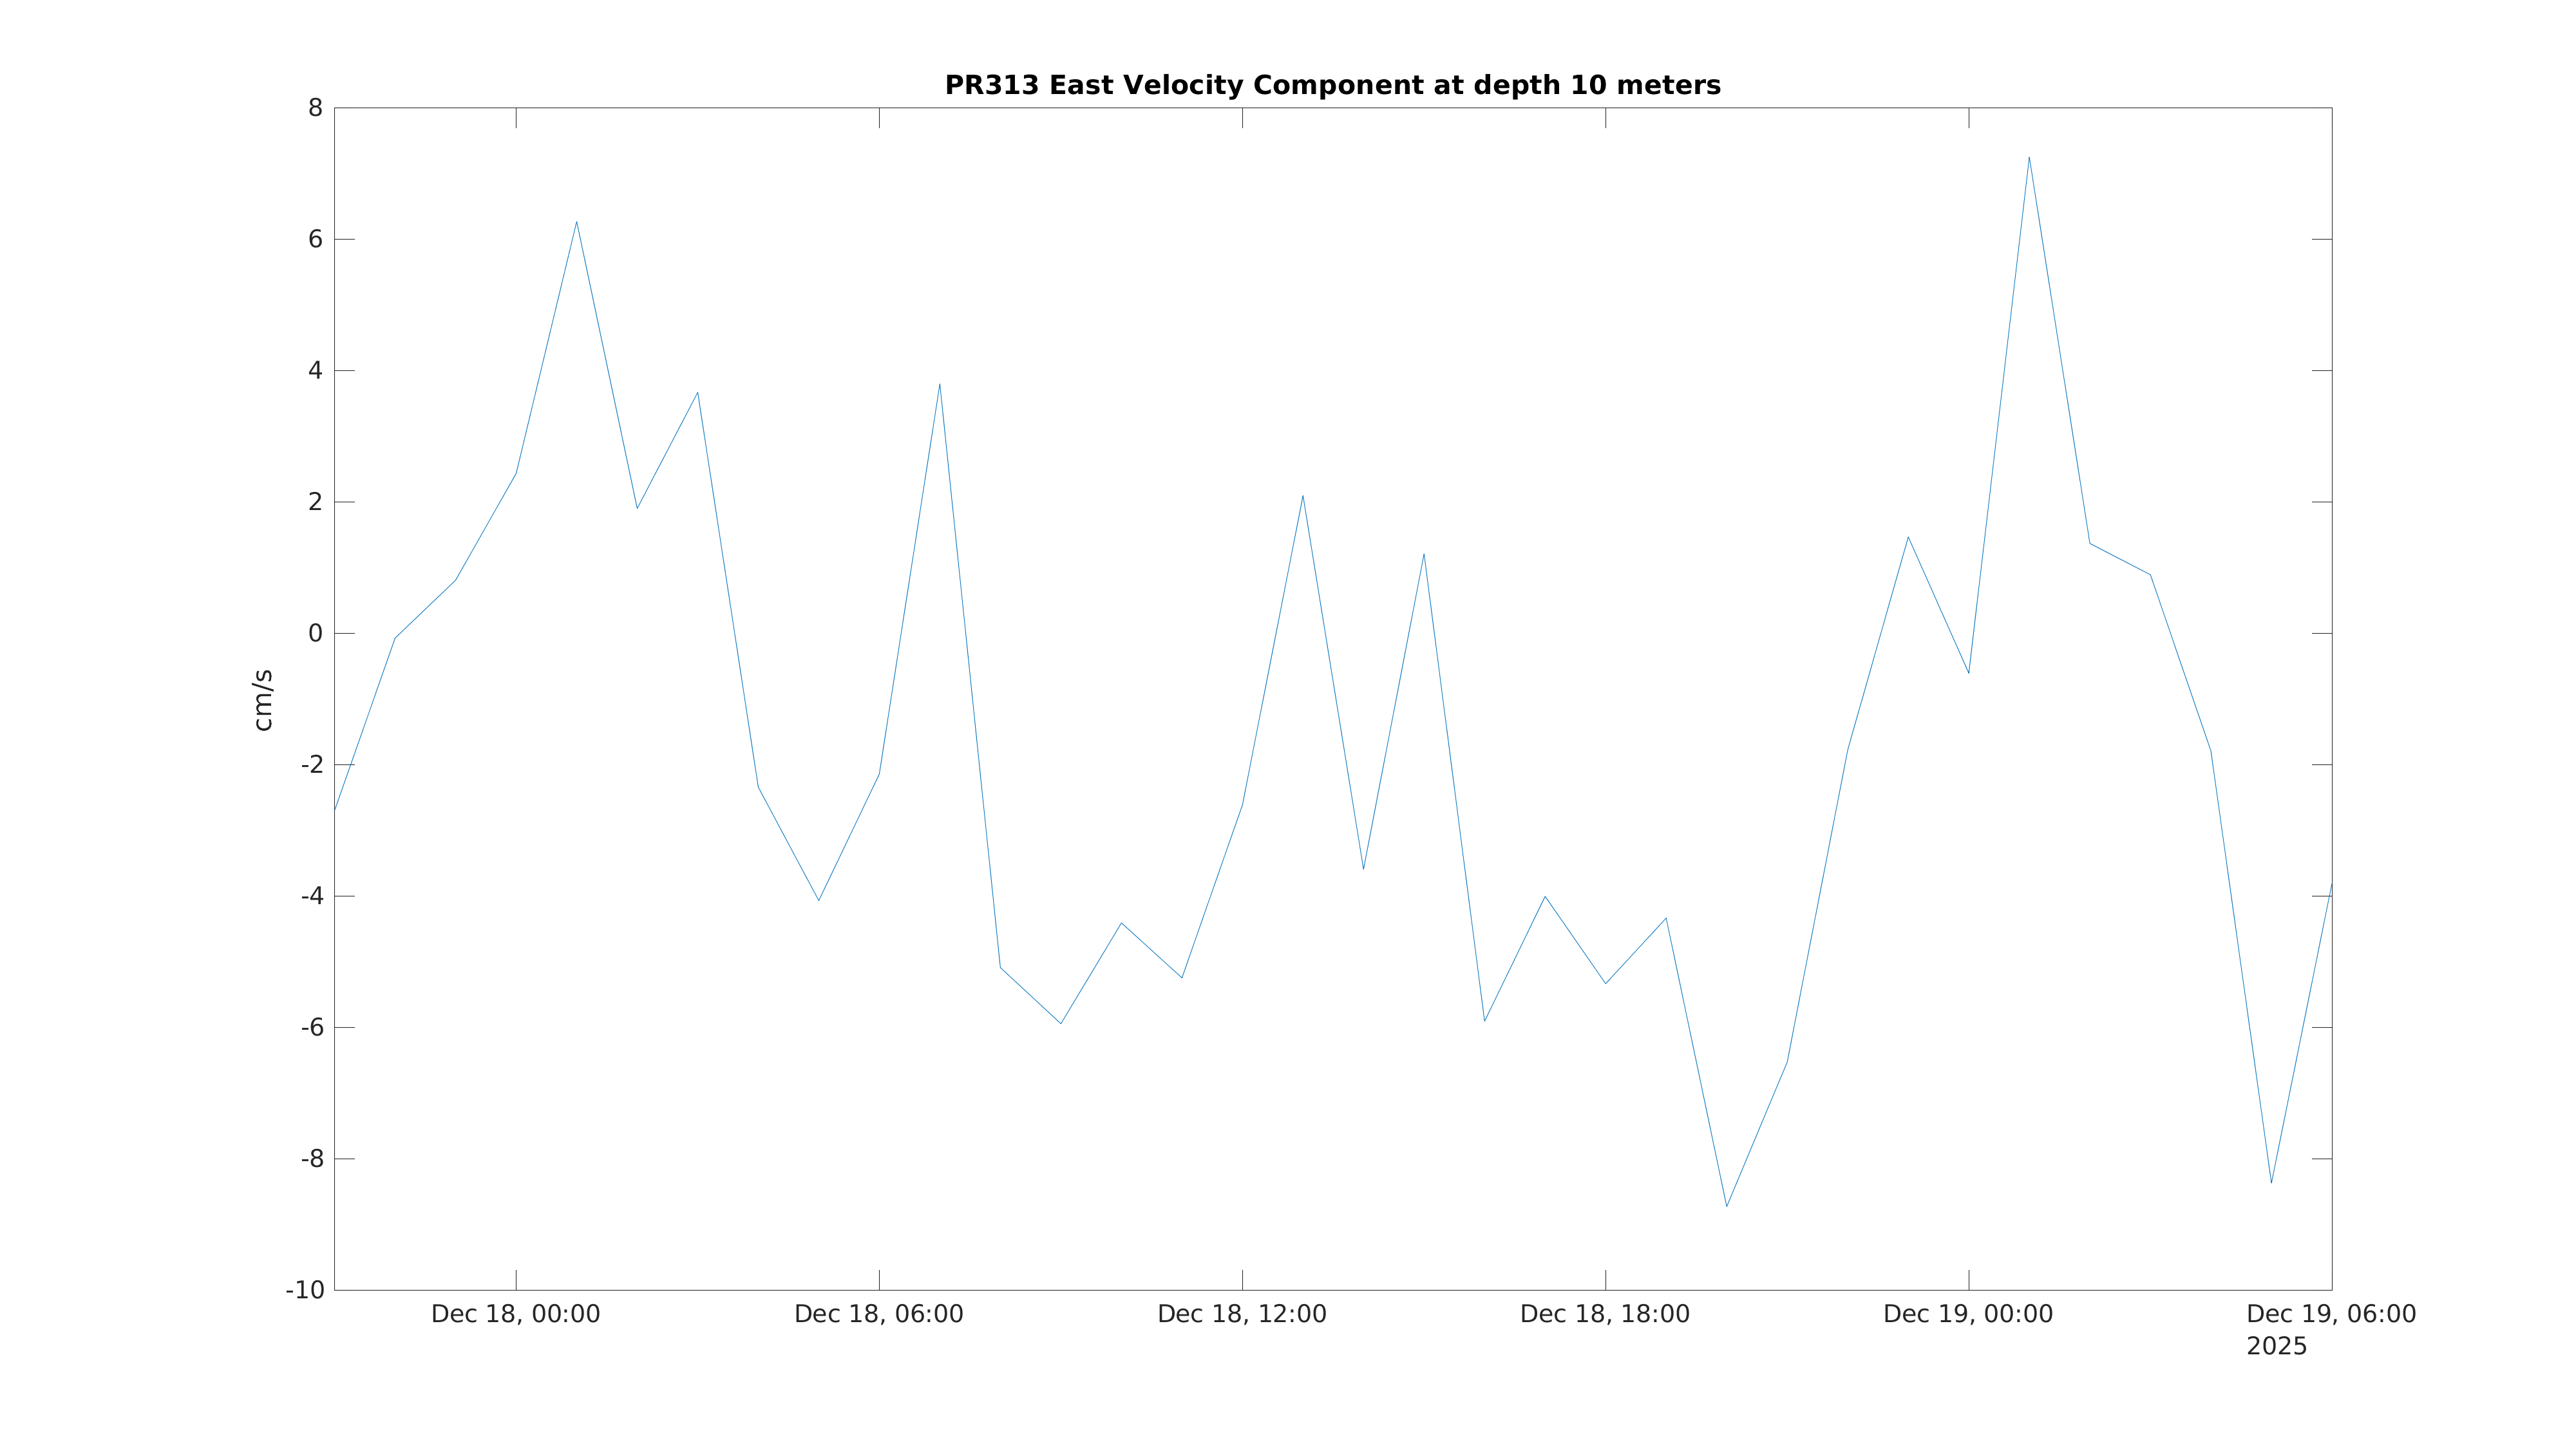
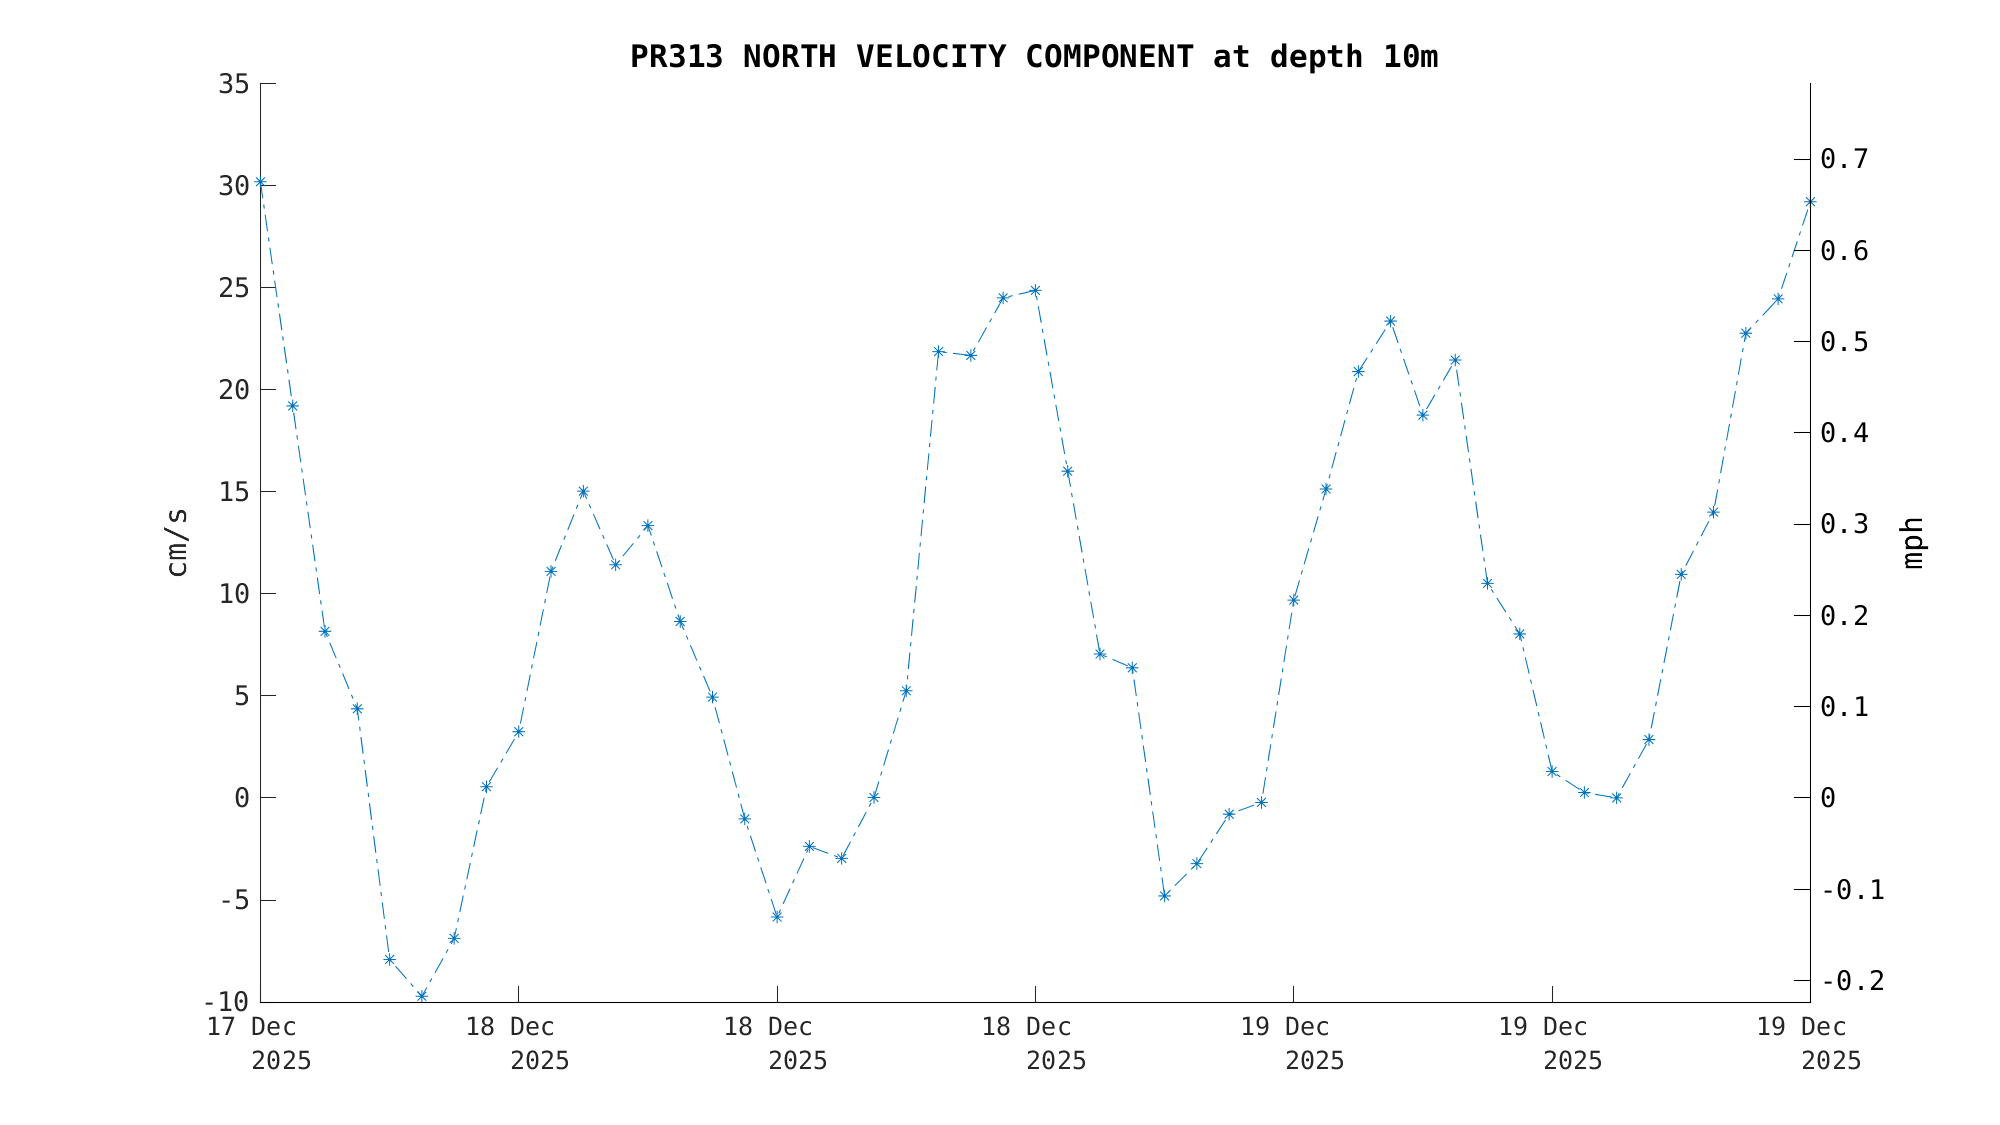
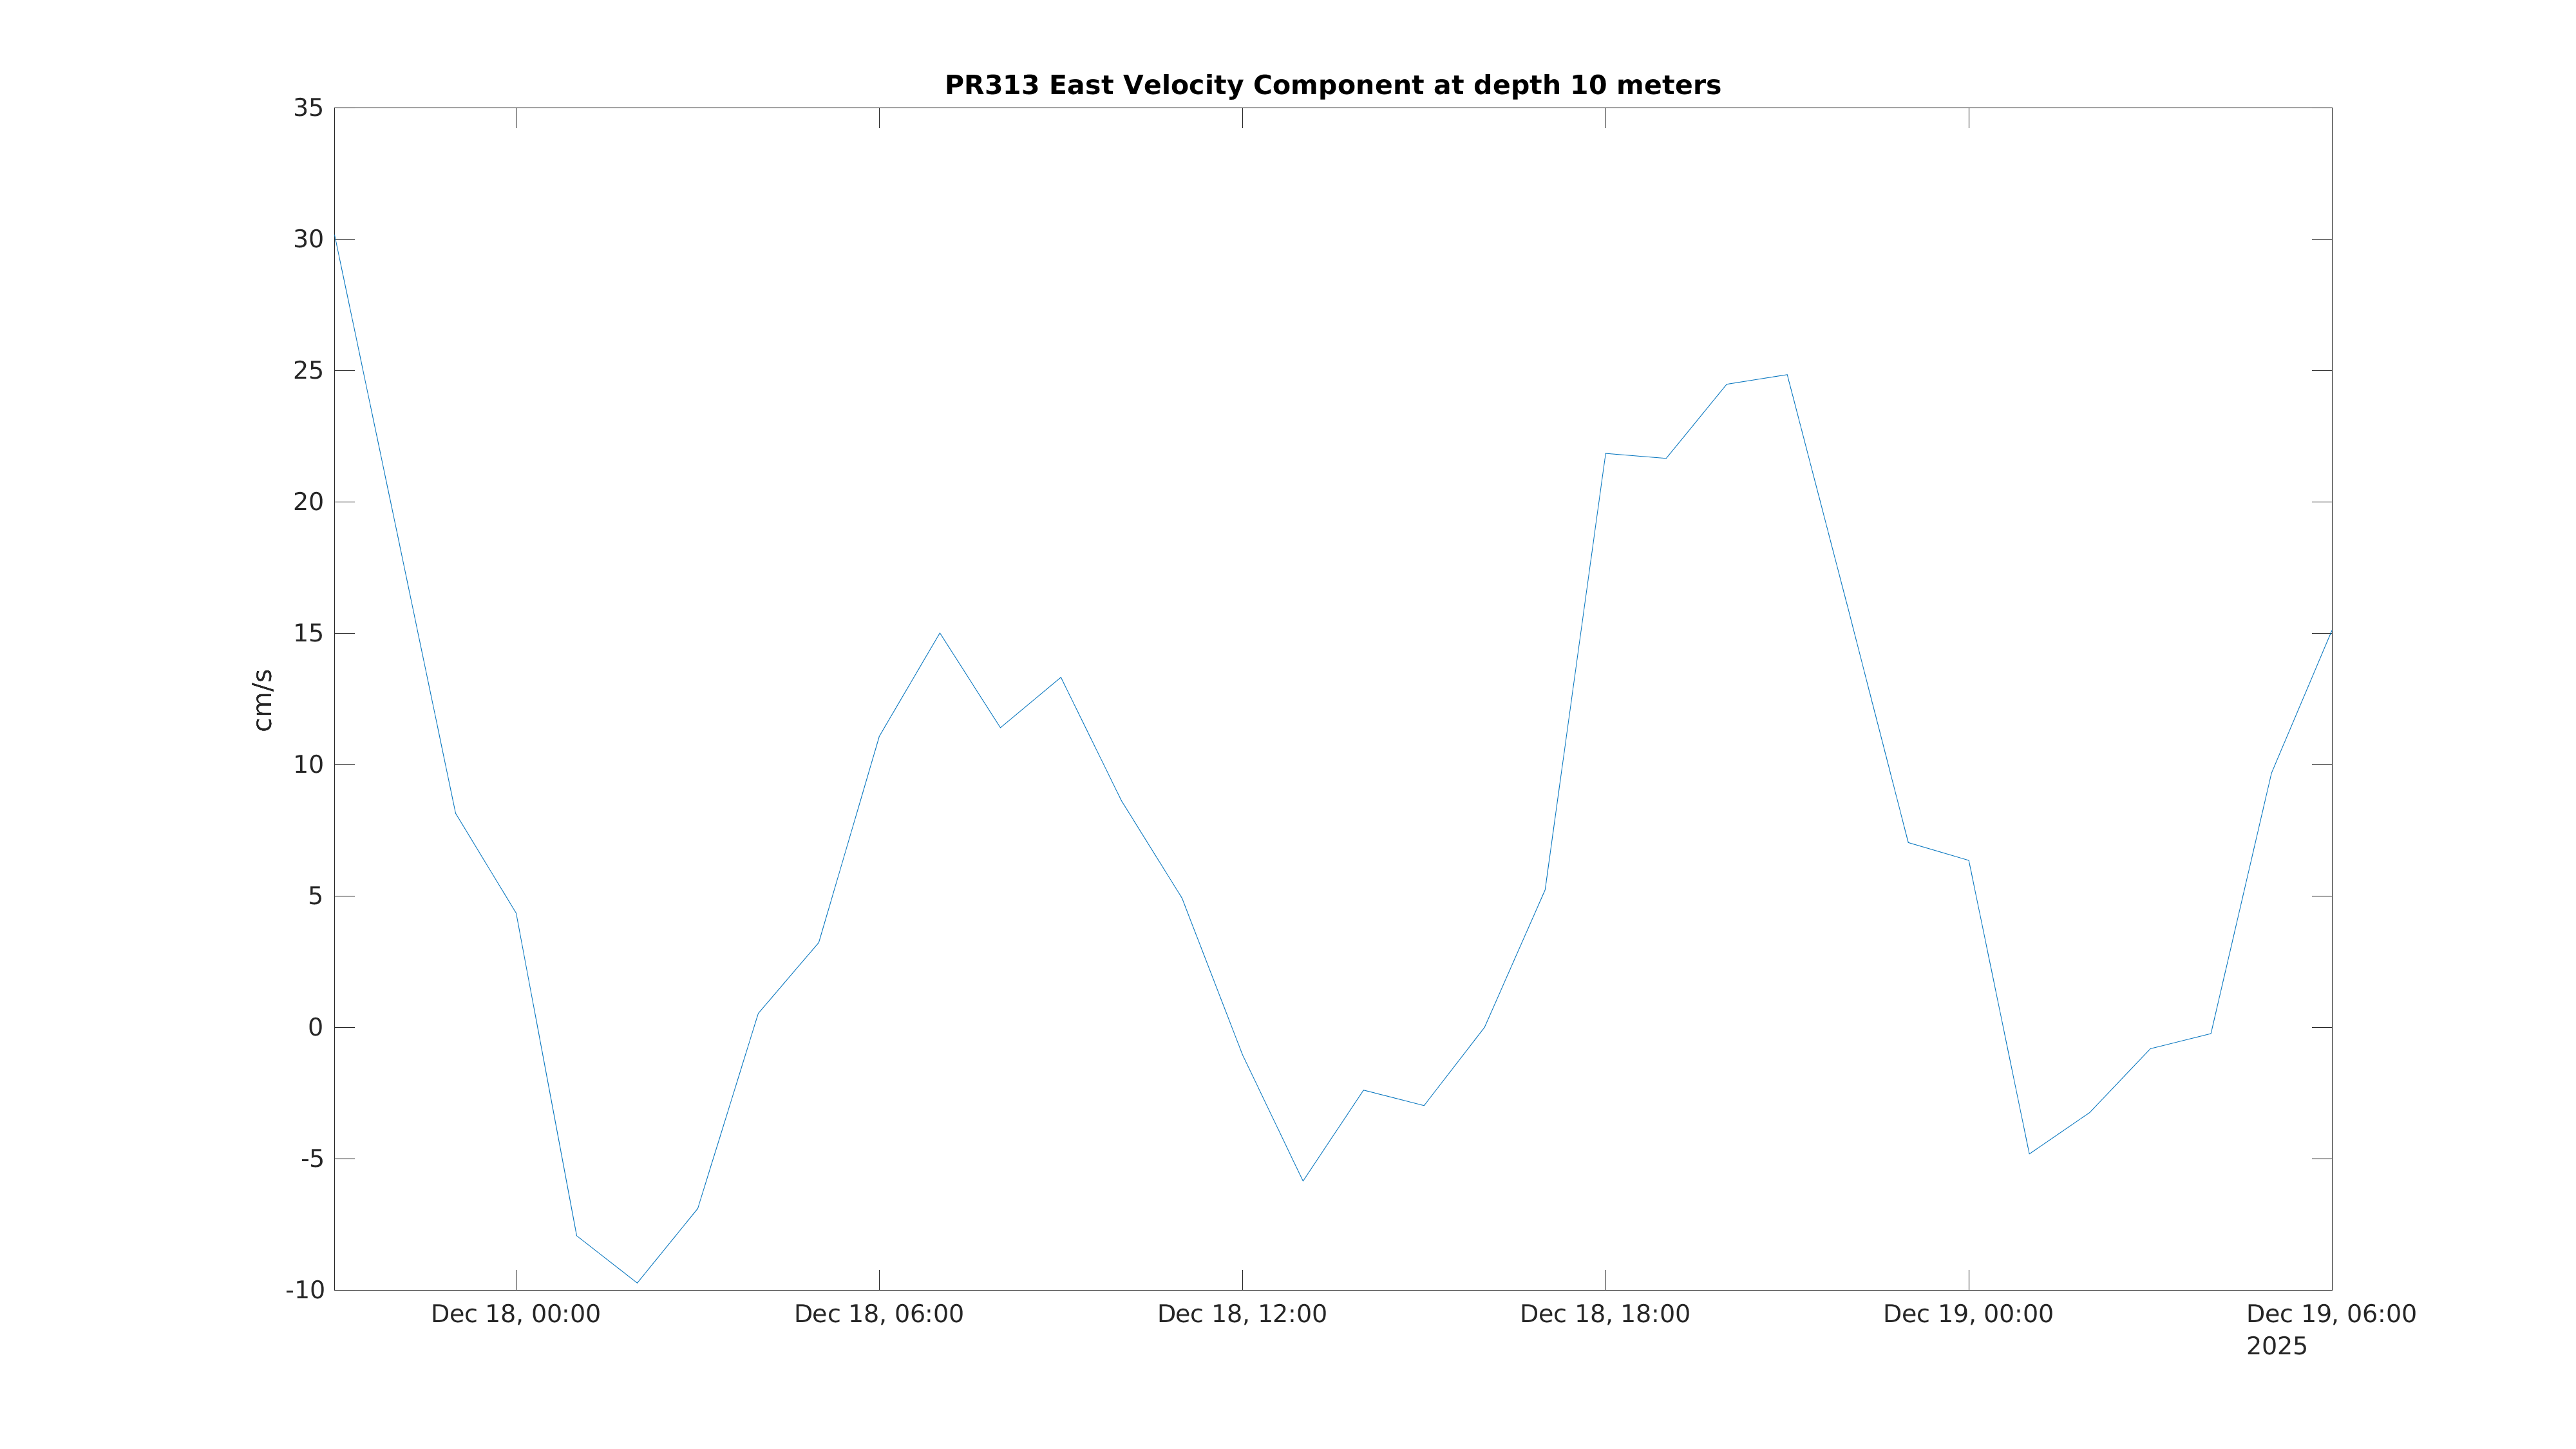
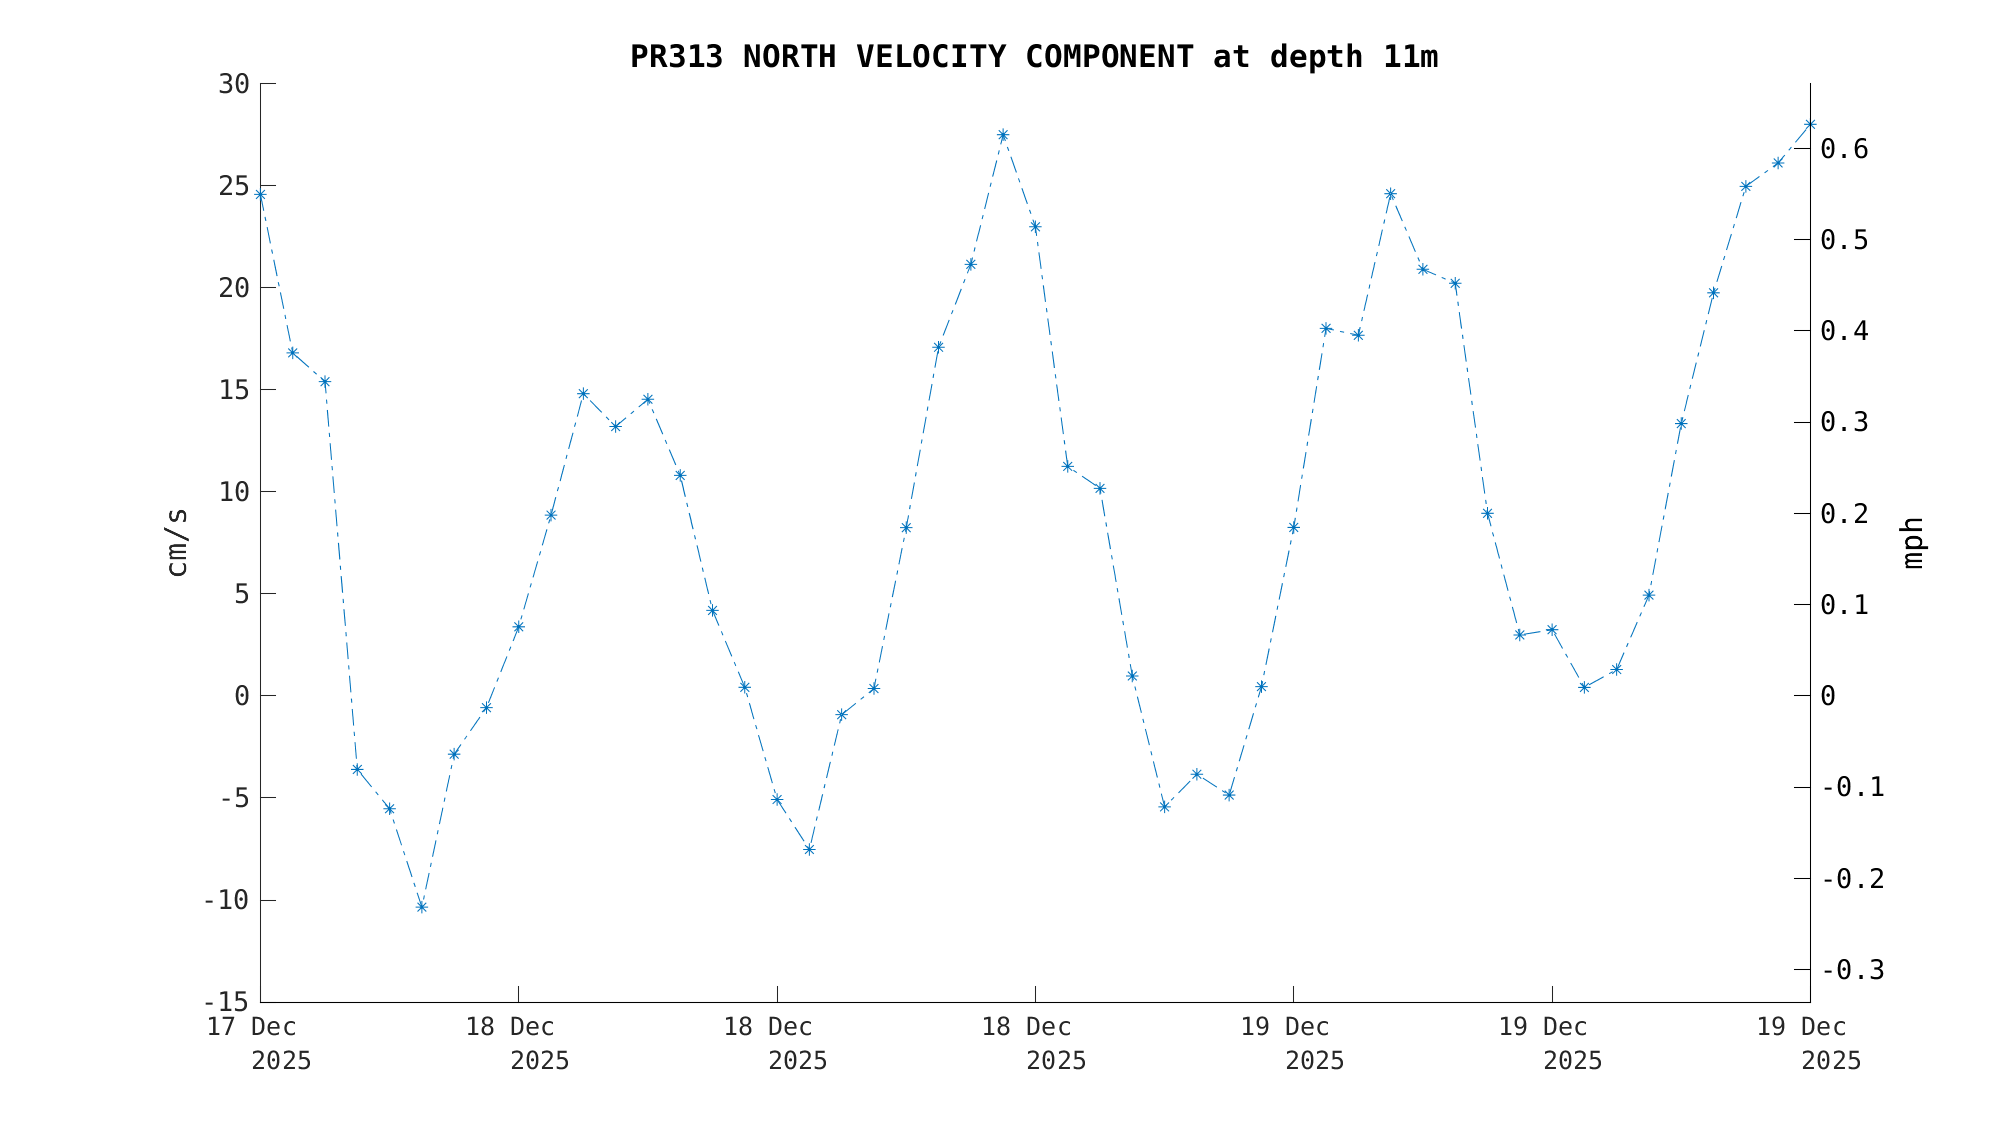
 This Deployment:
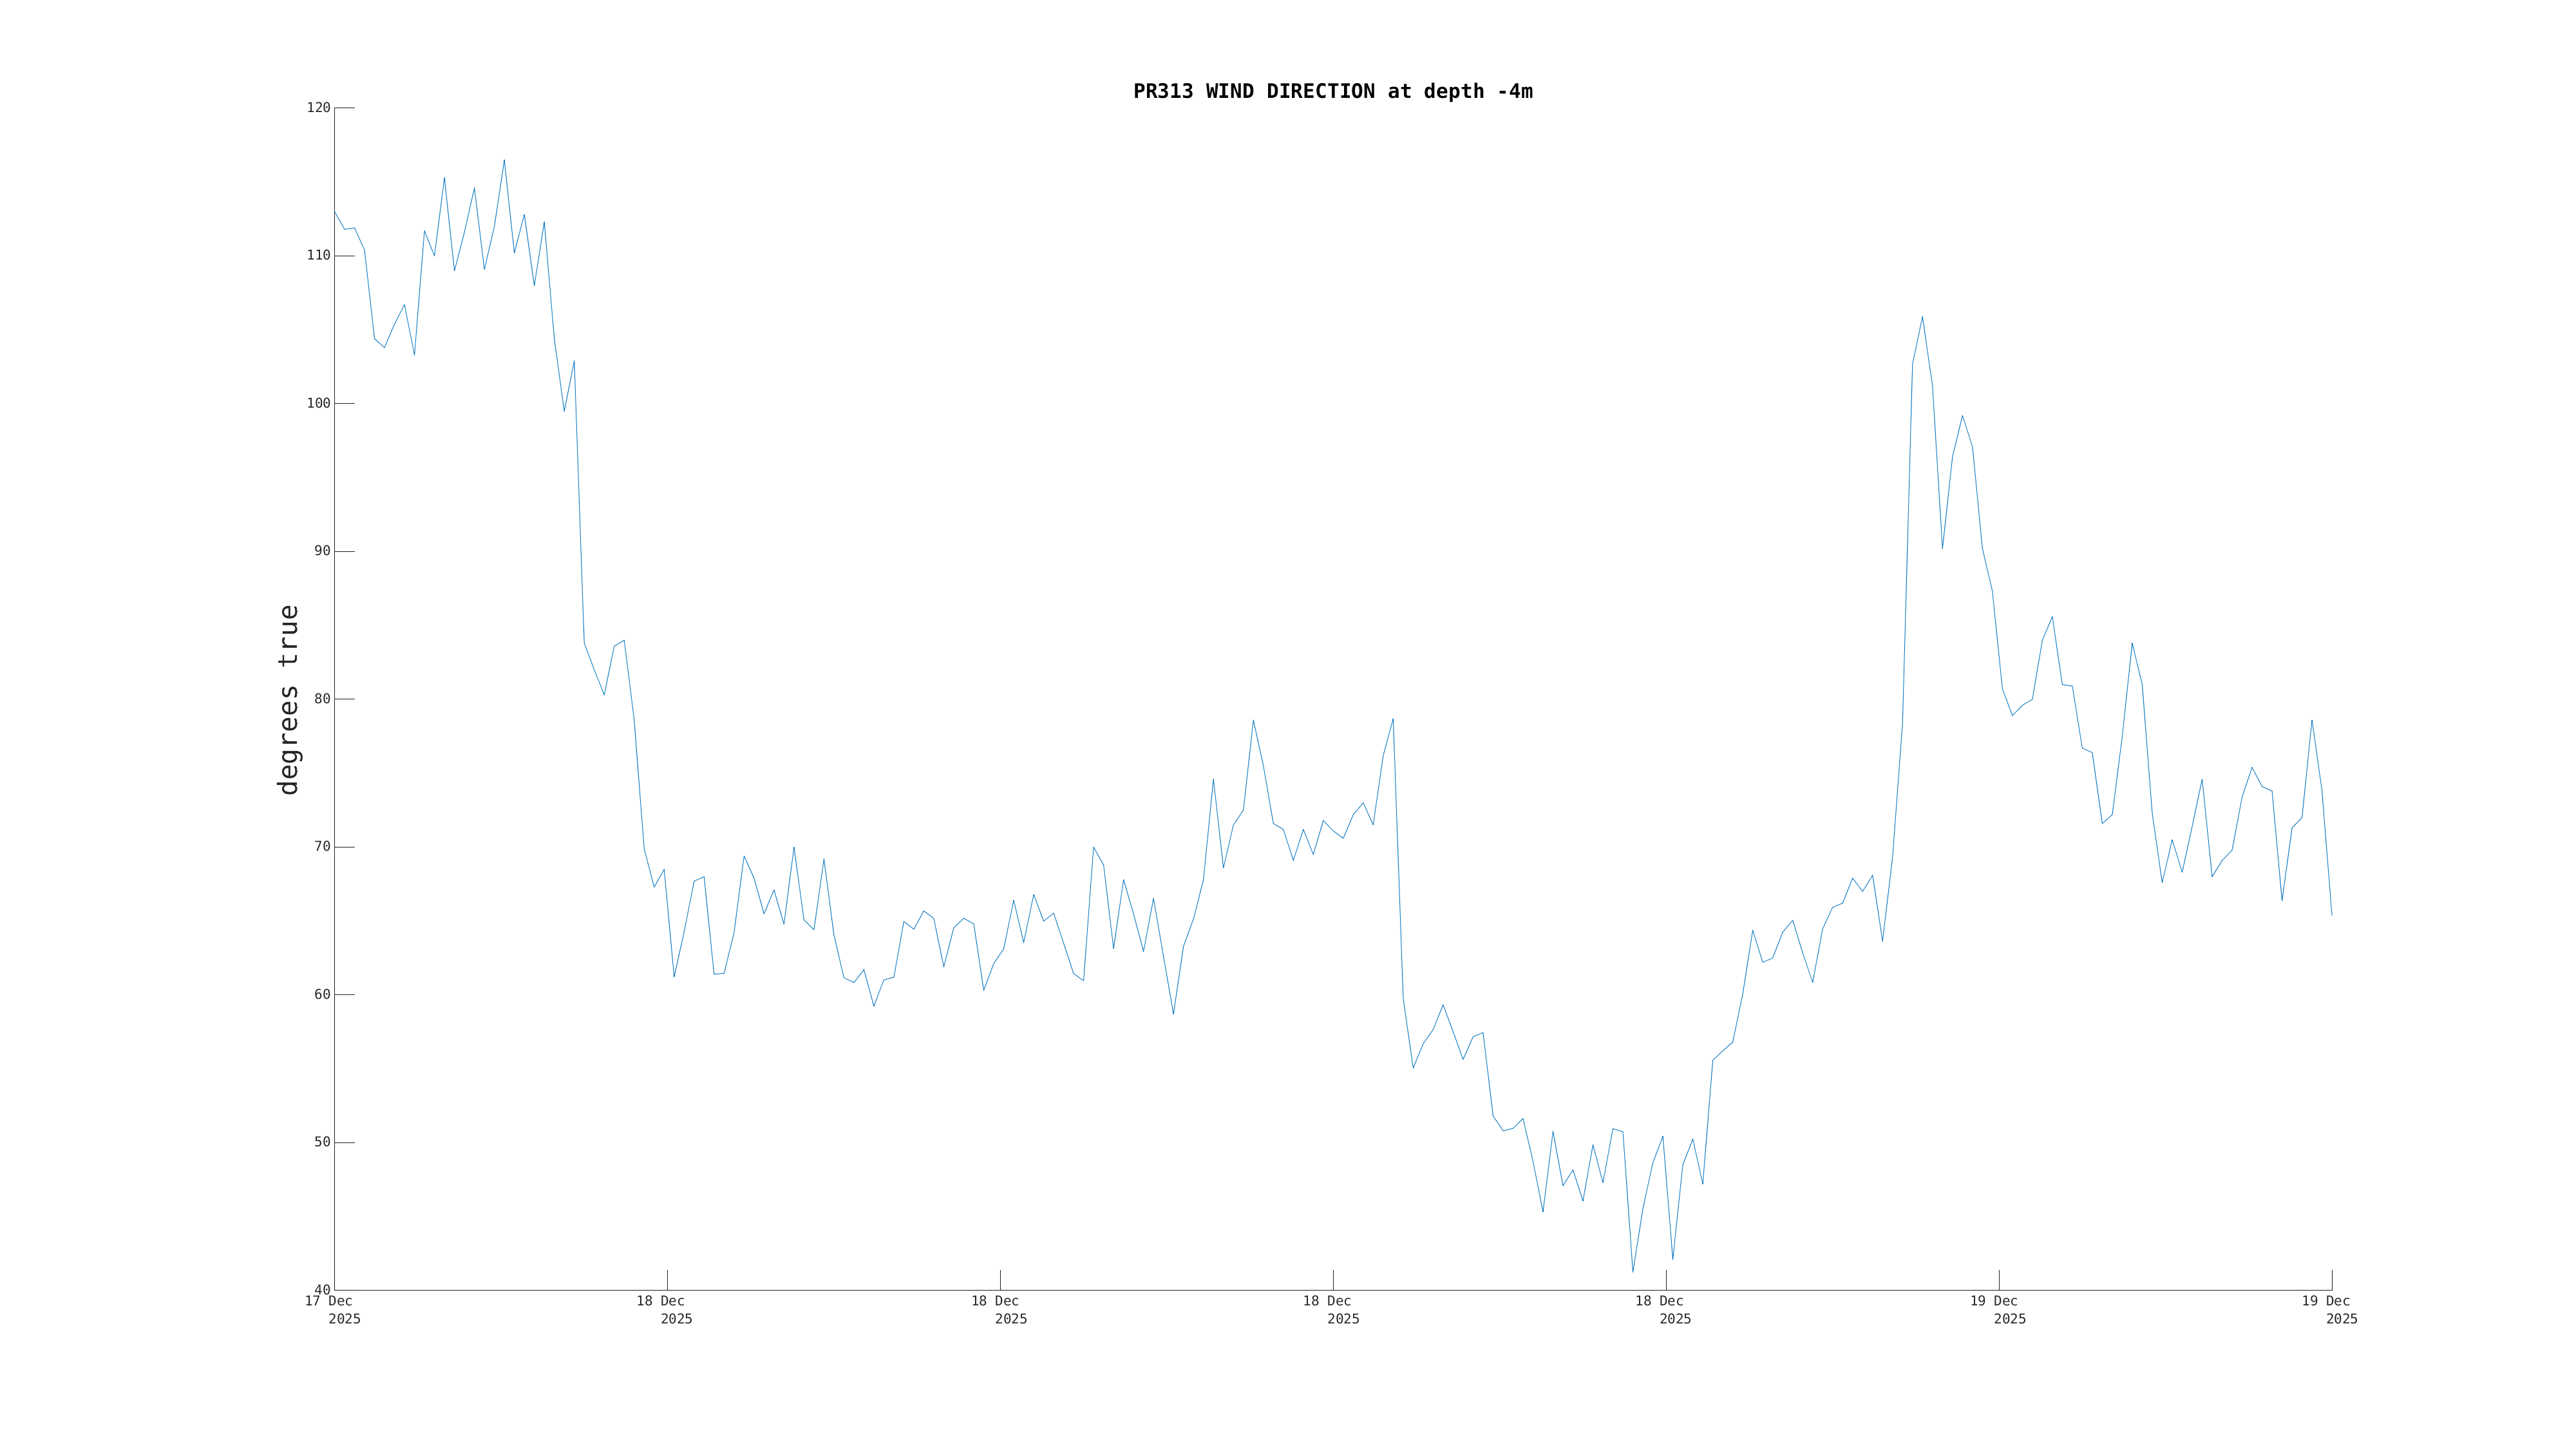
 Entire Position History:
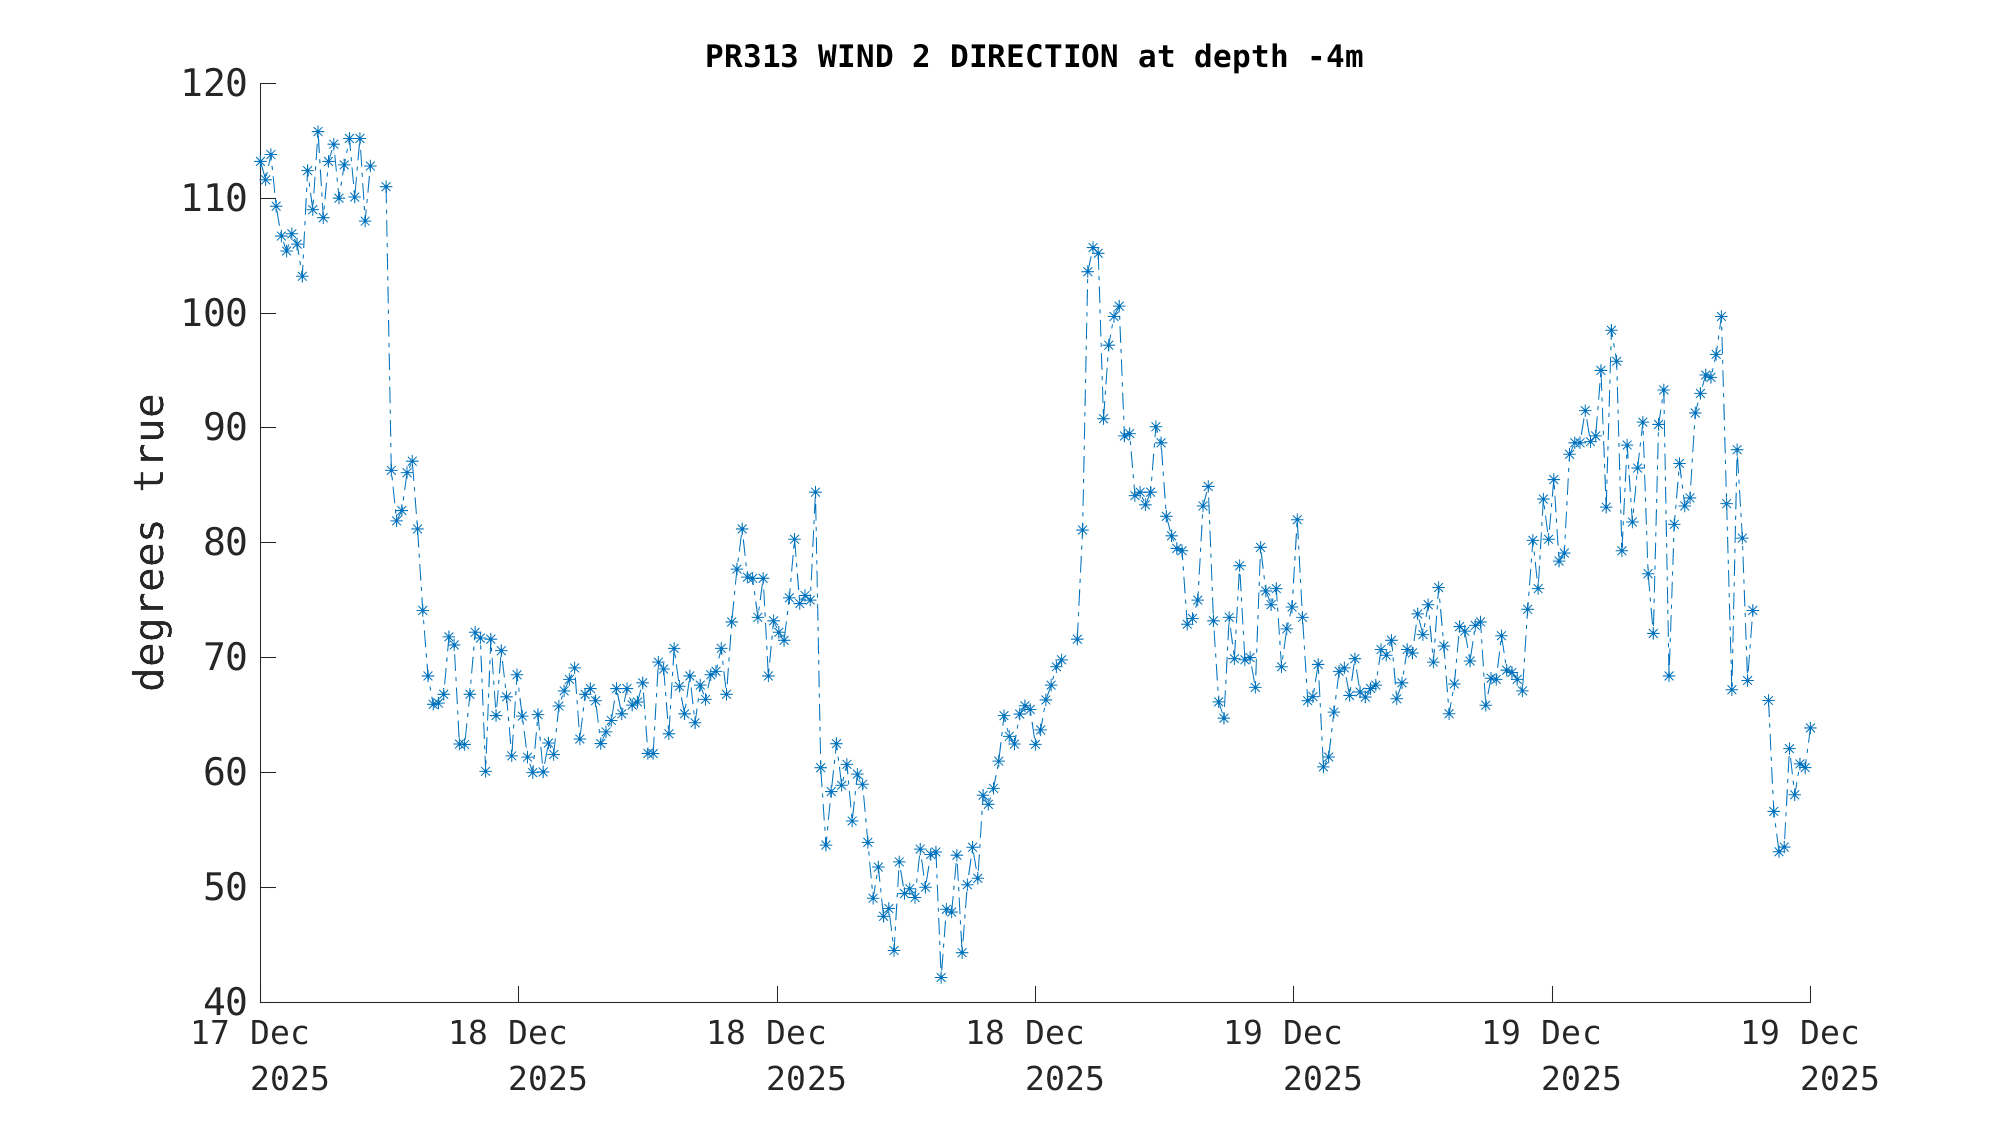
 Latest Month's:
 This Deployment:
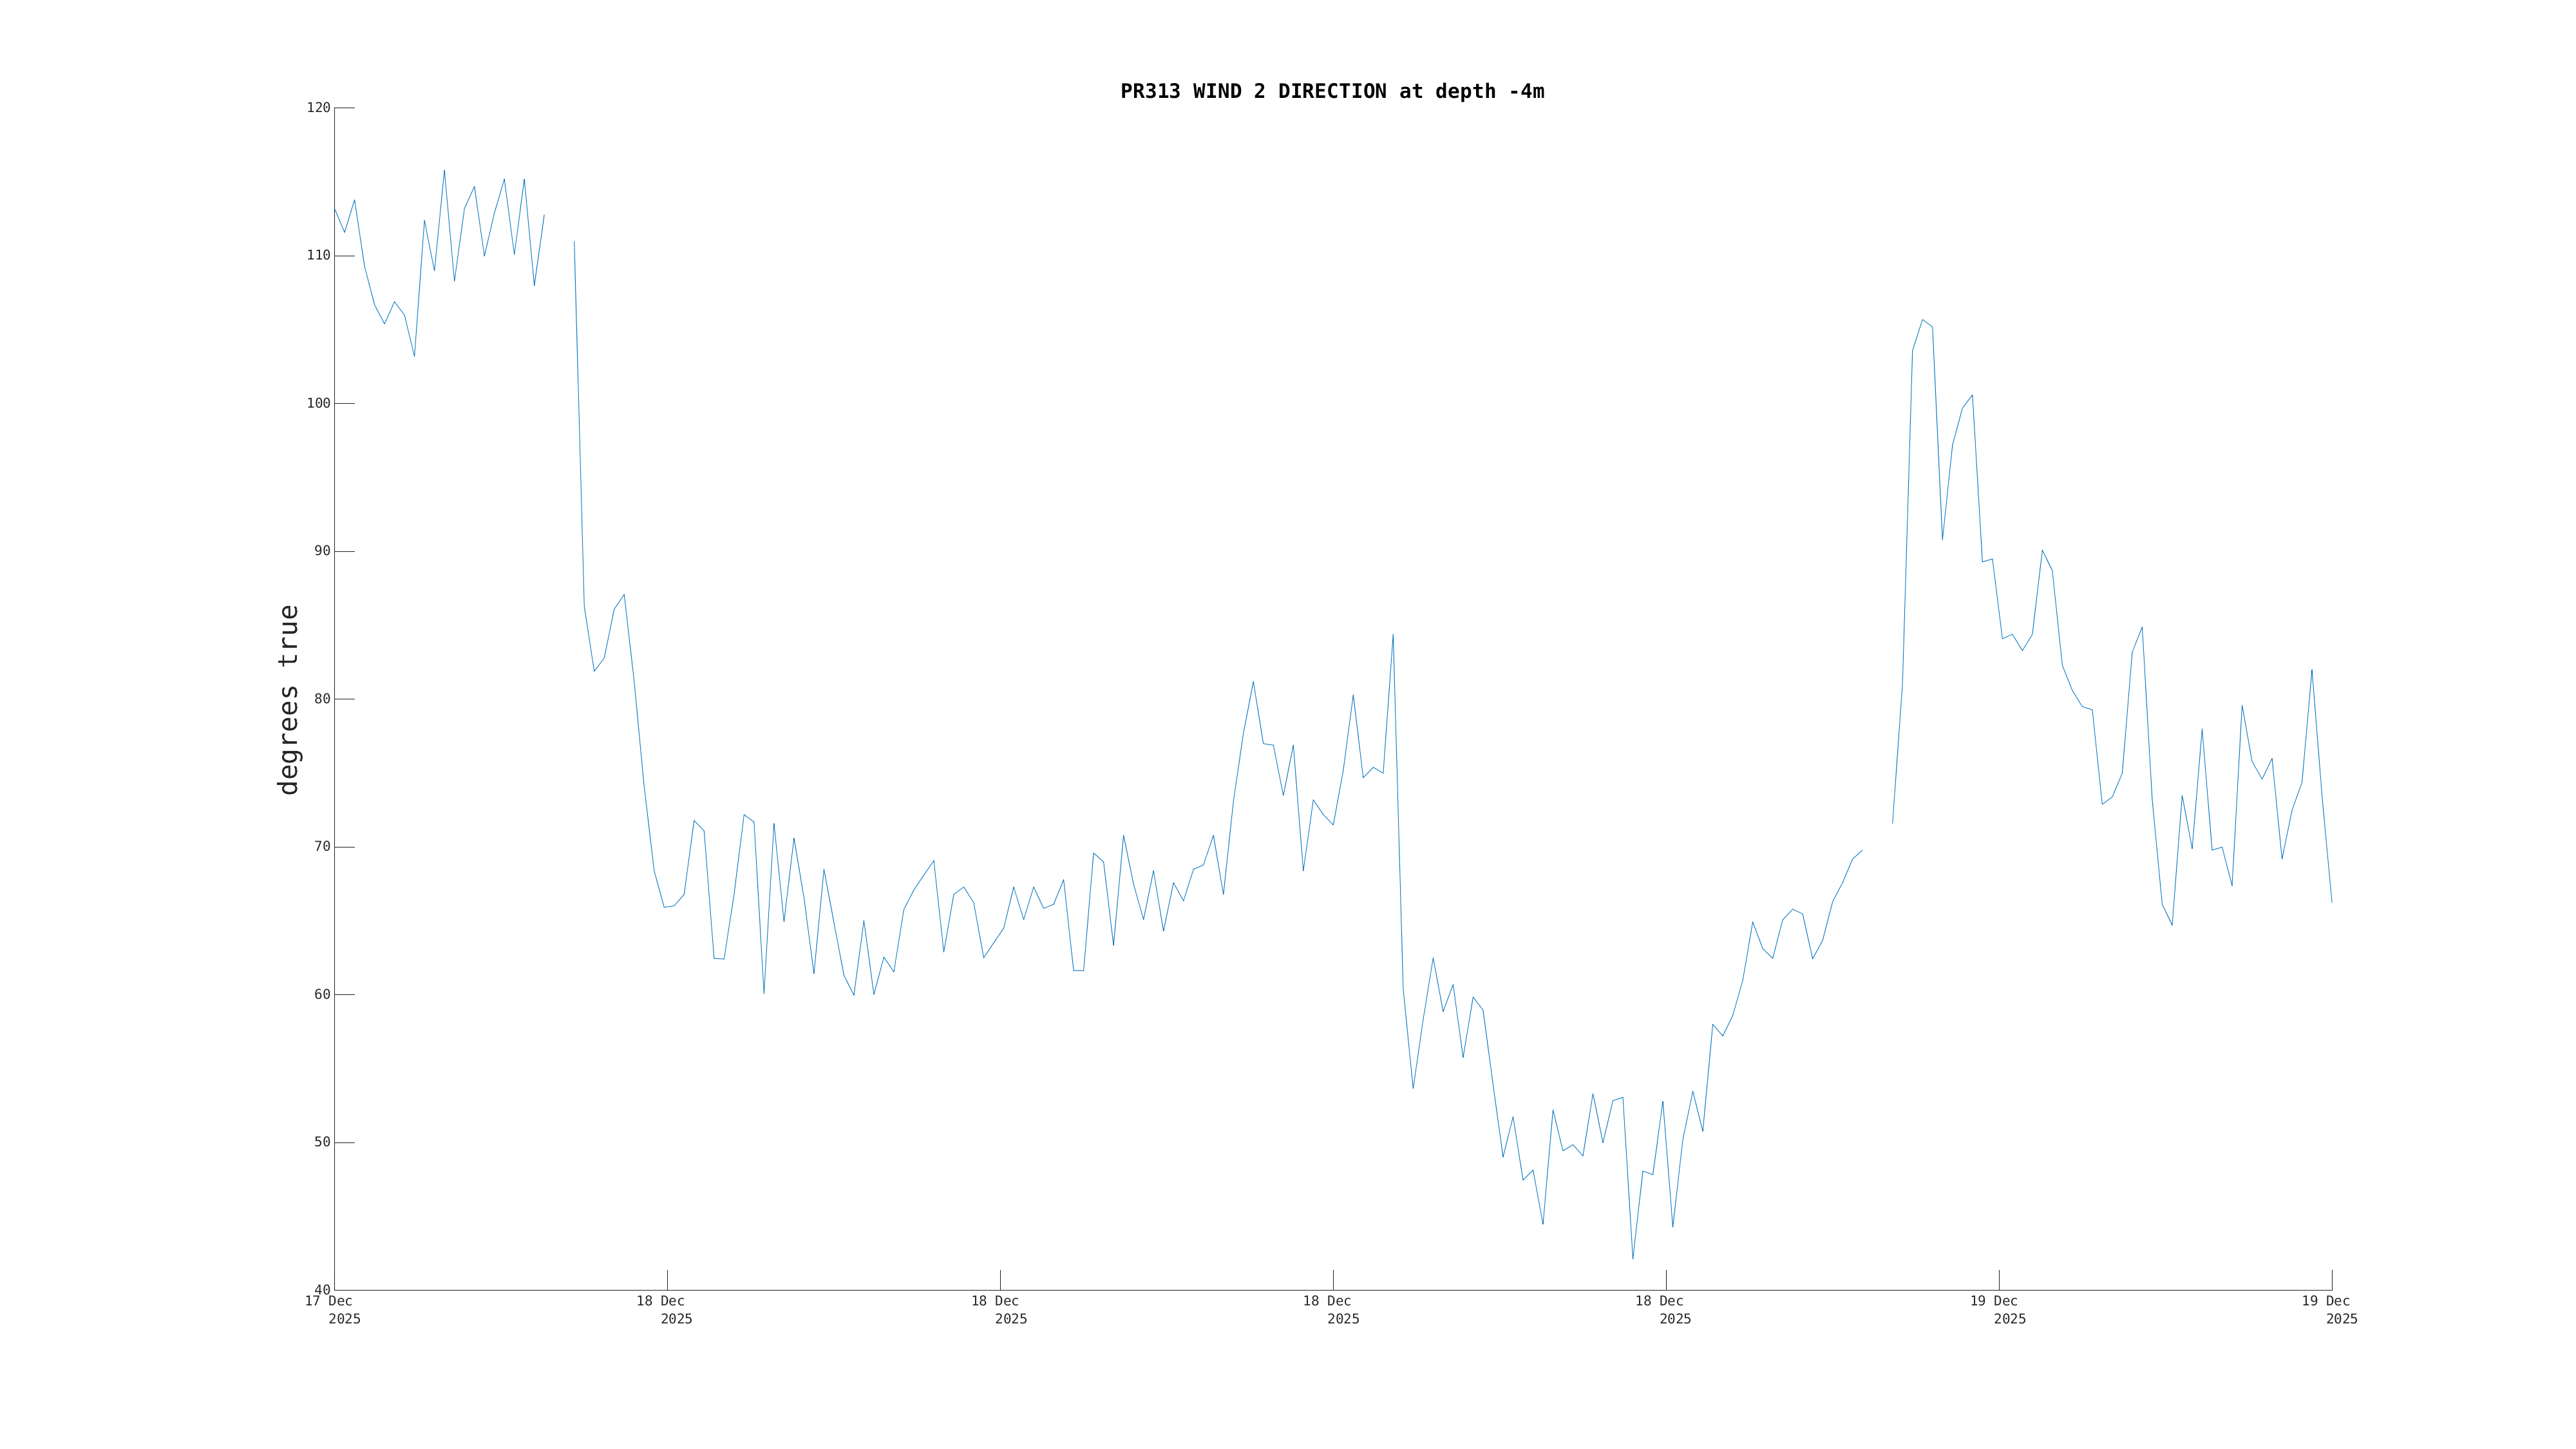
 Entire Position History: