As we have seen, the integrated dynamic
height above a reference level is closely related to the horizontal
pressure gradient force. It is for that reason also closely related to
the geostrophic flow, or the flow that results from the balance
between the horizontal pressure gradient and the Coriolis force. In the
northern hemisphere, the Coriolis force is directed to the right
as you look down the pressure gradient, while in the southern hemisphere,
it is directed to the left.
Don't forget in all of this that the Coriolis force is just an artifact
of our desire to look at things in a geo-centric perspective. It's not
a real force at all.
Using the transect below, you're going to calculate the
geostrophic
velocity based on the thermal wind equation:
d(dp/r)/dx = fv
Again, remember that dp/r is
simply equal to the dynamic height, H, related through the
hydrostatic equation (dp/dz = -rg). You will want to
calculate that first, as an interim step. d(H)/dx is then
the horizontal change in H, or the difference between H
at
one station versus another. Remember that to calculate the horizontal
change in H correctly, you must use the same reference level
for both stations and you must compare value of H at the
same pressure levels at each station! We use dH to
indicate such a horizontal difference. Note: Often oceanographers
use notation like this H(0/1000), or H(50/2000)
to indicate the pressure level being considered and the reference level.
The first example would be for dynamic height at the surface calculated
relative to 1000 dbar, and the second example, dynamic height at 50 dbar
relative to a reference level of 2000 dbar.
When calculating geostrophic velocity from hydrographic stations, dx,
the horizontal differential, is simply the distance between stations or
L.
You can try to measure L from the figure or simply use the
average station spacing for this transect, which was 9 km. Rearranging
our first equation using H and L, we get, simply:
v = dH / (f * L)
Where dH is the difference in dynamic height (at
a given pressure level) between the two stations separated by distance
L.
But
remember, this is all based on the premise that
at some depth, designated
as the reference level, the horizontal pressure gradient force is zero
and the currents die away. Thus to get a velocity at any depth you will
have to integrate (sum) all of the dynamic heights from that reference
level up to the level of interest to you.
Part I
-
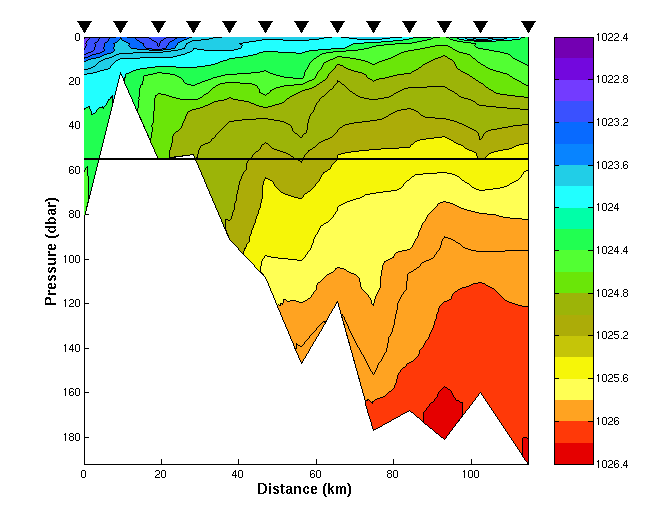
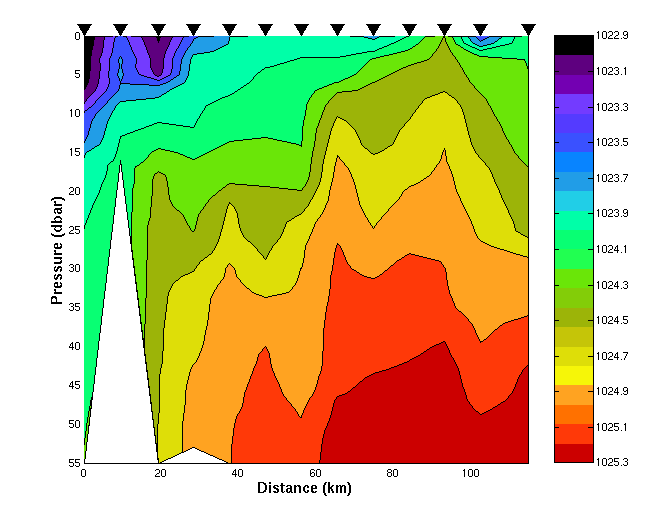
Examine the transect, and estimate the dynamic height at each station for
0,10,20,30 and 40 dbar relative to 55 dbar. Remember that while the surface
of the ocean is shown as flat it's not! This is an effect of using pressure
as the vertical coordinate.
-
From the dynamic heights, and using a mean latitude for this transect of
43 degrees 30'N, calculate the geostrophic velocity between each station
pair at 0,10,20,30 and 40 dbar. Which way is the current going and how
strong is it? Orient your answer in terms of the figure (i.e., to the left,
to the right, up, down, into the picture, out of the picture). Why do you
have to use a pair of stations? Why can't we calculate the geostrophic
velocity at a given station?
-
Now for the two stations furthest to the right, calculate the surface dynamic
height and surface geostrophic velocity relative to 120 dbar and also relative
to 55 dbar. What is the
difference in surface dynamic height between
these two stations using these two levels?
-
What does that say about the strength of the currents between 55 and 120
dbar at this location? (Think relatively: if the surface velocity is 10
cm/s relative to the velocity at 55 dbar, and the water at 55 dbar
turns out to be moving at 4 cm/s, how fast is the surface current actually
moving?)
-
Do you think your estimate of the surface velocity would change much if
you used a reference level of 160 dbar instead of 120? Why or why not?
-
BONUS QUESTION: What does your answer to the preceding questions say about
the use of geostrophic calculations for in this area? Is there a motionless
"reference" depth that's common to all the stations? If you think so, what
depth is it? If not, what might you do to compensate? Defend your answer.
In this figure, the black triangles indicate the station locations,
and the black line, the 55 dbar reference depth. Potential density (sigma_theta
+ 1000 ) is contoured in color. In the second figure down, the
the top 55 dbar of the same transect is pictured, with the color table
stretched for maximum contrast.

Part II
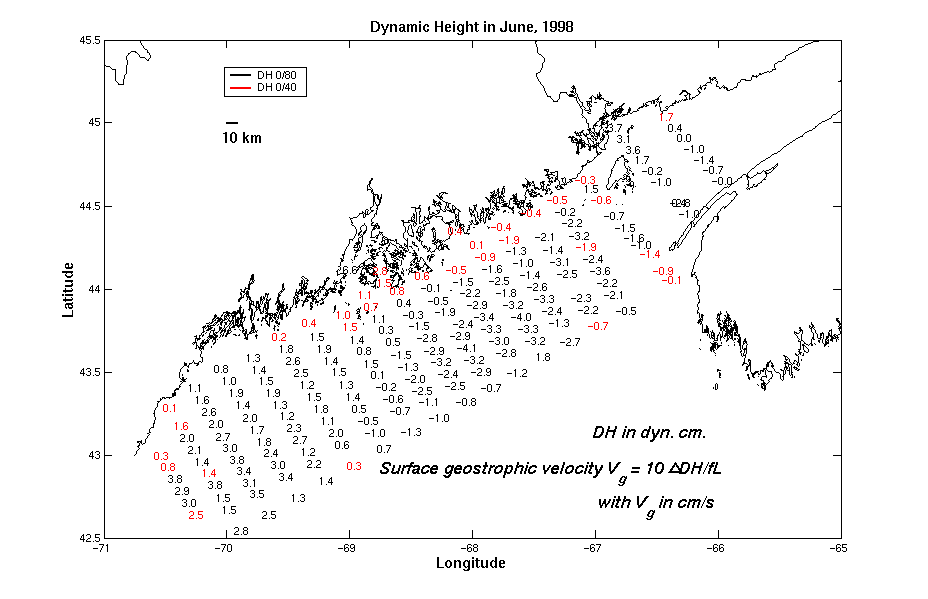
Given that geostrophic velocity is proportional to dH/(f * L),
and flows everywhere parallel to lines of constant H, please
print out the following figure, and, by contouring H, estimate
the surface geostrophic velocity. You'll see I've augmented dynamic heights
relative to 80 dbar (in black) with those relative to 40 dbar in the shallower
spots (in red) -- you can treat all of the heights as the same for these
purposes. Annotate your plot with arrows to indicate the strength and direction
of the flow (big arrow = fast, small arrow means a slow current). Click
on the figure to see it full-sized. You'll want to print it out in landscape
orientation. In this figure, DH, is dynamic height
and the greek letter delta indicates a horizontal difference in this quantity.


