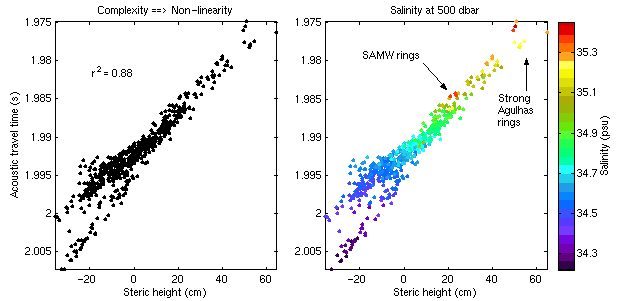


a) (top left) The large thermohaline variability in the Cape Basin results in a lowered correlation between acoustic travel time (tau) and steric height (SSH), both of which have here been calculated from a database of hydrographic profiles.
b) (top right) While extensive thermohaline anomalies are present in the Cape Basin hydrography, these temperature and salinity changes are not completely random, but tend to occur in concert. For example, warm Agulhas eddies bring in surface, central and intermediate waters from the Indian Ocean. Integrated through the water column, the temperature and salinity anomalies of an Agulhas eddy thus remain largely uncompensated. And although the tau depends almost exclusively on and responds to changes in the mean temperature of the water column, SSH reflects changes in both its temperature and salinity. This effect means a large amount of the anticipated thermohaline variability is able to be ascertained with the GEM-ETTA method.
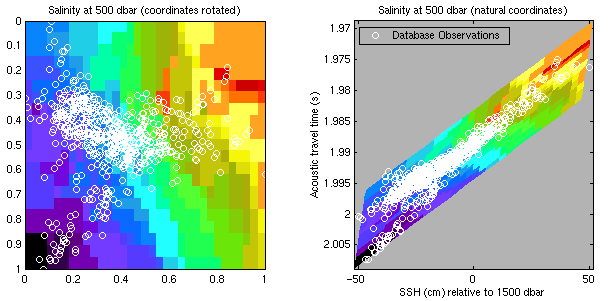
c & d) At each pressure level, the corresponding salinities and temperatures in the database are parameterized as a function of tau and SSH. In essence, this creates a giant 4-dimensional "look-up table", in which tau and SSH become proxies for an entire profile of T(z) and S(z). This profile is called the "GEM-ETTA estimate" of T(z) and S(z). In Fig. 3c, (bottom right) coordinates have been rotated for better results from the gridding algorithm. See Appendix B for more details. In Fig. 3d, (bottom left), the gridded field is translated back into natural coordinates.